
Abstract
Purpose
The aim of this study was to determine changes in physical activity, nutrition, sleep behaviour and body composition in wheelchair users with a chronic disability after 12 weeks of using the WHEELS mHealth application (app).
Methods
A 12-week pre-post intervention study was performed, starting with a 1-week control period. Physical activity and sleep behaviour were continuously measured with a Fitbit charge 3. Self-reported nutritional intake, body mass and waist circumference were collected. Pre-post outcomes were compared with a paired-sample t-test or Wilcoxon signed-rank test. Fitbit data were analysed with a mixed model or a panel linear model. Effect sizes were determined and significance was accepted at p < .05.
Results
Thirty participants completed the study. No significant changes in physical activity (+1.5 √steps) and sleep quality (–9.7 sleep minutes; −1.2% sleep efficiency) were found. Significant reduction in energy (–1022 kJ, d = 0.71), protein (–8.3 g, d = 0.61) and fat (–13.1 g, d = 0.87) intake, body mass (–2.2 kg, d = 0.61) and waist circumference (–3.3 cm, d = 0.80) were found.
Conclusion
Positive changes were found in nutritional behaviour and body composition, but not in physical activity and sleep quality. The WHEELS app seems to partly support healthy lifestyle behaviour.
Healthy lifestyle promotion is crucial, especially for wheelchair users as they tend to show poorer lifestyle behaviour despite an increased risk of obesity and comorbidity.
The WHEELS lifestyle app seems to be a valuable tool to support healthy nutrition choices and weight loss and to improve body satisfaction, mental health and vitality.
Implications for Rehabilitation
Introduction
Obesity rates have been growing rapidly worldwide over the last decades, making it an increasing global health problem as it is strongly associated with multiple chronic diseases such as cardiovascular disease, diabetes, and different forms of cancer [Citation1]. With the increasing obesity rates, healthcare expenditure has globally risen as well [Citation2], partly caused by lifestyle diseases. The high prevalence of obesity is mainly caused by relatively low physical activity levels combined with poor nutrition choices and thus high energy intake, causing an imbalance in energy expenditure and energy intake [Citation3]. However, additional factors such as sleep duration have shown to be associated with obesity and weight gain as well and should, therefore, also be taken into account and targeted together with physical activity and nutrition [Citation4]. Individuals with chronic disabilities show relatively high obesity rates [Citation5], making them a vulnerable group to lifestyle-related diseases.
Lifestyle-related diseases are non-infectious diseases that tend to develop over a longer period of time due to a combination of behavioural, genetic, physiological and environmental factors [Citation6]. Risk factors for lifestyle-related diseases are partly modifiable by influencing behaviour. Health promotion by focussing on behaviour change can be successfully applied in various ways. Mobile health (mHealth) is a rapidly growing mode of delivery that has shown its potential for behaviour change in previous research [Citation7–9], and removes potential barriers for individuals with restricted mobility such as wheelchair users. Multicomponent interventions have shown superior results compared to single component interventions [Citation10,Citation11]. Although numerous multicomponent lifestyle applications (apps) exist, none are designed with and for wheelchair users. Therefore, the WHEELS lifestyle app was developed specifically for and together with wheelchair users to promote and support a healthy lifestyle in the aspects physical activity, nutrition and sleep & relaxation [Citation12].
The WHEELS app was developed using the intervention mapping protocol [Citation13], based on behaviour change theories and evidence-based methods [Citation14–19]. The goal of combining these methods within the app was to provide the necessary tools at each stage of the transtheoretical model [Citation15], to achieve a shift towards healthier behaviour in the aspects physical activity, nutrition and sleep & relaxation. According to the transtheoretical model, individuals shift between different stages during behaviour change (precontemplation, contemplation, determination, action, relapse and maintenance), to eventually adapt and maintain a new learned behaviour. Therefore, one could argue that a stage shift towards maintenance is likely associated with changes in physical activity and nutritional intake. To a lesser extent, this might be applicable for sleep quality, as this is harder to influence by behaviour than physical activity and nutritional intake.
A pilot study on the usability and feasibility of the WHEELS app showed promising results for behaviour and health change, with a tendency to favourable results for the remote-guided group. The app showed room for improvement on usability and seemed feasible to deploy on a larger scale [Citation12]. Due to a small sample size, limited significant improvements were registered in the pilot study on outcome measures for lifestyle and health. Based on the feedback from the study participants, in-app navigation was improved, and a Fitbit integration was added with wheelchair-specific energy estimates. In addition, a lifestyle coach was added for in-app support. The objectives of this study were: (1) to evaluate if using the WHEELS app leads to changes in lifestyle regarding physical activity, nutrition, sleep behaviour, body composition and secondary lifestyle and health-related outcomes; and (2) to explore whether an experienced shift in stage of change (SoC) is related to actual behaviour change in relatively inactive wheelchair users with a chronic disability.
Methods
Study design and participants
Wheelchair users were asked to participate in a 12-week intervention study with a pre-post design, focussing on improving their lifestyle with the help of a lifestyle app, including a 1-week control period prior to the intervention period. The study was performed during the global Covid-19 pandemic, restricting possibilities for physical measurements. Therefore, all collected data were self-reported and collected from a distance. Recruitment of participants took place by advertisements at patients’ associations, on social media, websites, magazines and within the rehabilitation centre Reade in Amsterdam. Individuals were eligible to participate if the following inclusion criteria were met: manual wheelchair user; wheelchair use for longer distances (>500 m); 18 to 75 years old; access to a smartphone or tablet; sufficient knowledge of the Dutch language to understand the content of the app and the study, not meeting the spinal cord injury (SCI) exercise guidelines for cardiometabolic health [Citation20]. Potential participants were excluded if one or more of the following exclusion criteria were met: insufficient understanding of technology to benefit from the app; insufficient functioning of arm/hand to operate a smartphone or tablet; presence of progressive disorders that could influence the outcomes; presence of psychiatric disorders; negative advice regarding unsupervised exercise based on the Lausanne recommendations [Citation21]. A sample size calculation, performed with G*Power [Citation22], indicated that a minimum of 27 participants was needed based on a repeated measures design including 4 measurement occasions with an effect size of 0.14 [Citation23,Citation24], an ICC of 0.90 of the Fitbit [Citation25] and with an α of 0.05 and a β of 0.95. Taking a 10% dropout into account resulted in a desired sample size of at least 30 participants. All participants provided written informed consent and ethical approval was given by the local Medical Ethical Committee of Erasmus MC (MEC-2019-0826).
Procedure
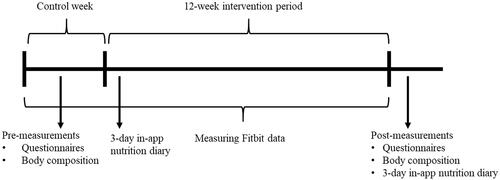
At the start of the study, participants were asked to start wearing a Fitbit Charge 3 activity tracker at the wrist. After a 1-week control period, participants received access to the WHEELS lifestyle app and were asked to improve their lifestyle with the help of the app during the following 12 weeks. The WHEELS app is targeted to help wheelchair users comply with scientific exercise guidelines for adults with SCI [Citation20], achieve a healthy energy balance, and achieve a healthy balance between exercise and sleep/relaxation [Citation12]. Data from the Fitbit were continuously collected throughout the study period as shown in . Nutrition diaries were administered during the first intervention week and after the intervention period. Online questionnaires and body composition measurements were self-administered during the control week and after the final week of the intervention period.
Figure 1. Schematic overview of the study protocol.
Intervention
The intervention provided during the 12-week period consisted of the WHEELS wheelchair-specific mHealth lifestyle app. This app focuses on three aspects: physical activity, nutrition and sleep & relaxation. Information, tips, tricks and feedback are presented in the app on these three aspects combined with exercises that can be performed in the wheelchair, a nutrition plan and tools to achieve behaviour change. The nutrition plan was personalised based on personal characteristics (sex, age and body mass) and the participant’s goal. Participants were able to log their progress, get in contact with other users in the community section and schedule workouts in their calendar. The developmental process, content and available functions of this app were described in a previous published paper [Citation12]. On top of the earlier described app functions, the possibility of a smartwatch integration was added to provide the user objective real-time feedback on physical activity, energy expenditure and sleep.
The nutrition part of the app included an energy balance overview, starting each day with a person-specific target for daily energy and nutrition intake based on an estimate of their basal metabolic rate. The basal metabolic rate was determined by the Schofield equation [Citation26] and based on the personal characteristics: sex, age and body mass. This outcome was subsequently converted with a factor 0.85. This factor was determined based on a comparison of our own unpublished data and studies in which the basal metabolic rate of individuals with and without SCI was measured. In these studies, individuals with SCI showed approximately a factor of 0.85 in basal metabolic rate compared to able-bodied participants [Citation27,Citation28]. The basal metabolic rate was supplemented throughout the day with the accumulated activity energy expenditure estimated by the Fitbit. When individuals set a goal other than maintaining body mass (either loose or gain weight) an energy deficit or surplus was included in their daily starting value. Depending on the amount of weight loss/increase target and the time period in which this target was set, a larger or smaller correction was applied to the daily starting value.
During the study participants wore a Fitbit Charge 3 wrist-worn activity tracker. Estimated energy expenditure data from the Fitbit on physical activity performed during the day was imported in the WHEELS app and converted with a factor of 0.77 into a more realistic calorie count of performed activities, which fitted better to the wheelchair community. Previous research suggests one metabolic equivalent (MET) for individuals with SCI should be adjusted to 2.7 ml·kg−1min−1, which is a factor of 0.77 compared to 3.5 ml·kg−1min−1 for abled-bodied individuals [Citation29]. The accumulated energy expenditure during the day was presented in real time within the app and summed with their personal daily starting value. The energy expenditure overview could be compared to the registered energy intake when the participant logged their nutrition intake, providing an overview of their daily energy balance.
During the intervention period, users could consult a lifestyle coach within the app with any questions regarding lifestyle, app functionalities or other topics related to the intervention study. In additional to answering questions, the coach provided information, tips and tricks on exercise, nutrition, sleep and relaxation on a weekly basis in the community part of the app throughout the 12-week intervention. Additionally, minor changes were made prior to the intervention on the in-app navigation of the single exercise and exercise program search functions to improve usability, based on feedback received during the pilot study.
Outcome measures
Stage of change
The transtheoretical model of change was used pre and post-intervention to measure possible shifts in SoC of the individual in adopting healthy physical activity and nutritional behaviour [Citation30]. Participants were asked whether they were currently meeting the SCI exercise guidelines for cardiometabolic health [Citation20] and if they were eating according to the Dutch national nutrition guidelines from the Netherlands Nutrition Centre [Citation31]. Participants could answer on each of these questions with one the following statements: (1) no intention to change behaviour (pre-contemplation); (2) intention to change within the next 6 months (contemplation stage); (3) intention to change within the next 30 days (preparation); (4) lifestyle modifications are made for fewer than 6 months (action stage); (5) working to prevent relapse and consolidate gains (maintenance).
Fitbit data
The Fitbit Charge 3 (Fitbit Inc., San Francisco, USA, software versions 3.42.1 − 3.45.1 2021, firmware version 28.20001.88.11) is a commercially available wrist-worn activity tracker released in 2018. The Charge 3 uses a variety of sensors, including a 3-axial accelerometer, an optical heart-rate tracker and an altimeter. The Fitbit was used to continuously measure lifestyle-related outcomes during the control and intervention period. Data were collected on the aspects physical activity (‘steps’) and sleep (sleep minutes and sleep efficiency). Previous research has shown that using the registered ‘steps’ of a Fitbit allows for detecting changes in activity levels during wheelchair activities in individuals with SCI [Citation32]. The Fitbit was used to register ‘steps’ accumulated over a day and provided insight into participants’ total daily activity level. The Fitbit was used to register time awake and time asleep and used these outcomes to determine sleep efficiency expressed in percentage and total sleep time in minutes. The Fitbit Charge 3 is able to register sleep behaviour based on a combination of registered movement and heart rate patterns [Citation33]. It was shown that the Fitbit can accurately measure sleep time and sleep onset latency, allowing a valid sleep efficiency measurement in a free-living environment [Citation34]. During this study, all Fitbit’s push notifications, except for the low-battery notification, were disabled to limit the intervention effect of the activity tracker. The users Fitbit account was linked with a Sport Data Valley (LIACS, Universiteit Leiden, Leiden, The Netherlands) account, a platform that allows the users and researchers to easily store, manage, share and analyse data anonymously.
The minimum awake wear time to determine if a day was valid to use for analysis was set at 12 h a day. This was done to ensure a valid representation of physical activity with the recommended awake wear time of at least 10 h [Citation35]. In case of sleep data, registered sleep with a minimum sleep time of 3 h was considered a valid recorded sleep period. A minimum of 4 valid days/nights, of which at least one weekend day/night, was necessary to construct a valid weekly average of a Fitbit outcome measure for both physical activity and sleep [Citation36]. These were used to construct intervention period averages to test for changes over time. A total of 4 intervention period averages were constructed, i.e., control period (week average of the control week prior the start of the intervention), start (average of available week averages of intervention week 1 − 4), middle (intervention week 5 − 8) and end intervention period (intervention week 9 − 12).
Nutrition
Participants received instructions on how to log their nutritional intake and were asked to do this for 3 consecutive days with one weekend day in the WHEELS lifestyle app twice, at the start and after the intervention period. This method is considered a reliable method for dietary assessment [Citation37]. The app allowed users to log meals and products in the app connected to a large nutrition database, providing information on energy and the macronutrients carbohydrates, protein and fat. Uncertainties about registered diet records (i.e., unrealistic food proportions, incomplete days) were solved by contacting the participant. Diet records were analysed based on nutrition values averaged over the 3 available valid days.
Body composition
Body mass and waist circumference were collected pre and post-intervention, if possible. Participants were asked to measure their body mass, up to 1 decimal, in the morning before breakfast, when the necessary weighing equipment was available. All participants received a tape measure at inclusion and were asked to measure their waist circumference three times at the level of umbilicus in supine position up to 0.5 cm accuracy during a regular exhale. The average of three waist circumference measurements was used as the outcome. BMI (body mass/height2) was calculated using self-reported height if the participant was able to measure body mass. In case of a lower-limb amputation, the relative segmental mass of the amputated limb was determined by the formula of Osterkamp [Citation38] and adjusted for lost body mass to calculate BMI according to the formula of Himes [Citation39].
Questionnaires
Questionnaires were administered online in Qualtrics (Provo, Utah, USA) in which personal and demographic (sex, age, height, educational level), disability-related characteristics and personal intervention goals were asked, on top of the below stated questionnaires. Educational level was divided into lower, middle and higher educational level according to the Dutch central agency for statistics [Citation40]. SCI was divided into tetraplegia (neurological lesion at or above T1) or paraplegia (neurological lesion below T1).
Physical activity
The Dutch Physical Activity Scale for Individuals with Physical Disabilities (PASIPD), a 12-item 7-day recall self-reported questionnaire to evaluate the physical activity level in individuals with a physical disability, was administered. The PASIPD outcome is the number of metabolic equivalents of task (MET) hours spent per day calculated according to the method of Washburn [Citation41]. The score in METS can range from 0 to 182.3.
Body satisfaction
The adult body satisfaction questionnaire was used to measure perceived body satisfaction [Citation42]. The questionnaire contains 10 items with 7-point Likert scale answer options, ranging from −3 to 3. The scores on the items are divided and averaged over the two subscales, function (seven items) and appearance (three items), where a higher score represents a higher body satisfaction.
Exercise Self-Efficacy
The Exercise Self-Efficacy Scale (ESES) is a valid and reliable 10-item questionnaire that was used to assess exercise self-efficacy [Citation43,Citation44]. The questionnaire contains 4-point Likert scale answer options with a total score ranging from 10 to 40, where a higher score represents a higher exercise self-efficacy.
Fatigue
The Checklist Individual Strength (CIS20R) questionnaire was used to measure fatigue. This self-reported questionnaire consists of 20 questions with a 7-point Likert scale answer option, providing a total score between 20 and 140, with a higher score representing a more severe experienced fatigue. The questionnaire is considered as a suitable and reliable method to measure fatigue [Citation45,Citation46].
Sleep quality
The Pittsburgh Sleep Quality Index (PSQI) was administered, which is considered as a valid self-reported questionnaire to evaluate sleep quality [Citation47,Citation48]. The questionnaire consists of 7 component scores based on 19 items, resulting in a total score range of 0 − 21, with a higher score representing worse sleep quality.
Quality of life
Health-related quality of life on eight different dimensions was measured with the Dutch Short Form Health survey Enabled (SF-36E) questionnaire, considered a reliable and valid questionnaire [Citation49,Citation50]. The dimensions included are physical functioning, social functioning, role physical, role emotional, mental health, vitality, bodily pain and general health. The enabled version is adapted to individuals with a mobility impairment. The questionnaire has a score range of 0 − 100, where a higher score represents a higher quality of life.
Usability
The usability of the app was tested with the System Usability Scale (SUS), a 10-item questionnaire assessing the usability of the product on a 10-point Likert scale ranging from 1 (“strongly disagree”) to 10 (“strongly agree”). The sum of the results was rescaled to a total of 100, where a higher score represents a higher experienced usability [Citation51].
Statistical analysis
Shapiro-Wilk test, histograms and Q–Q plots were used to test for normality of the data. Demographics of the study population were described.
Data collected with the Fitbit were analysed with different models, depending on the distribution of the outcome variables. The physical activity outcome ‘steps’ was modelled with a random intercept mixed model. The data was not normally distributed and, therefore, square root transformed. Compound symmetry was used as repeated covariance type with a restricted maximum likelihood method for the mixed model. In this model, ‘steps’ was used as dependent variable with intervention period as independent variable. In case of sleep data, where data transformation could not achieve normal distribution, a random intercept panel linear model was performed, as this method does not require normal distributed data as an assumption [Citation52]. In the two models, the number of sleep minutes and sleep efficiency were the dependent variables with intervention period as independent variable.
Change in SoC was constructed as a dichotomous variable whether a change occurred towards maintenance (=1) or not (=0). A change towards maintenance was considered when the SoC score increased with at least one step towards (5) “working to prevent relapse and consolidate gains (maintenance)”. In case of a similar SoC score or a step downwards towards (1) “no intention to change”, a score of 0 was assigned. For nutrition data, interaction effects between change in SoC and all nutrition outcomes were tested with a repeated-measures ANOVA. Nutrition outcomes were set as dependent variables (pre and post) and the dichotomous variable for change in SoC as independent variables. For physical activity data, an interaction effect was included in the random intercept mixed model between change in SoC (dichotomous variable) and intervention period as independent variables and registered steps as a dependent variable.
Pre and post-intervention changes on body composition, nutrition and the questionnaires SoC, PASIPD, body satisfaction, ESES, CIS20R, PSQI, SF-36E and SUS were tested with a paired-samples t-test or, when assumptions were violated, the non-parametrical alternative Wilcoxon signed-rank test.
Cohen’s d effect sizes were calculated. In the situation of n < 20 the alternative Hedges’ g was calculated. Effect sizes were interpreted as: d < 0.2 very small, d = 0.2 − 0.5 small, d = 0.5 − 0.8 medium, d > 0.8 large. When assumptions were violated, the effect size was determined by z/(√n) [Citation53].
Significance was accepted at p < .05. In the case of multiple comparisons, a Bonferroni correction was applied by dividing .05 by the amount of tests performed for each aspect (SoC, nutrition, body composition and questionnaires). All data collected with the Fitbit were processed using R software (version 4.1.1, R Foundation for Statistical Computing, Vienna, Austria) within the Rstudio environment (Version 1.4.1717, Rstudio, Inc., Boston, MA, USA) [Citation54,Citation55]. Panel linear model analysis was performed with the plm package [Citation56]. All other statistical analyses were performed with IBM SPSS Software (Version 27).
Results
Thirty-three participants were included in the study of which 30 completed the intervention period (). Of these 30 participants, three participants did not complete the nutrition diary on both pre and post-measurement, two did not complete the final questionnaires and one participant was unable to collect any data with the Fitbit due to technical issues throughout the intervention period. Demographic information of the 30 participants who finished the intervention period are presented in . Due to the inability to measure body mass in a home setting when using a wheelchair, limited body mass and BMI data (n = 19) are available.
Figure 2. Flow chart of participant’s inclusion.
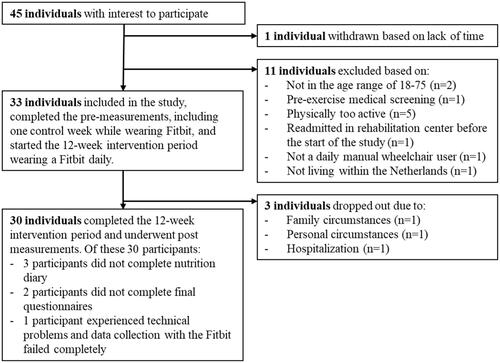
Table 1. Demographic characteristics of the participants.
Stage of change
Significance for change in SoC was accepted at a p value of .05/2 = .025. No significant change in SoC regarding physical activity (p = .034; effect size = .40) or nutrition (p = .81; effect size = .05) was found between pre to post-test. Sixteen participants shifted at least one stage regarding physical activity towards maintenance and six participants shifted at least one stage towards maintenance regarding nutrition. All frequencies are shown in .
Table 2. Experienced stage of change on nutrition and physical activity pre and post intervention (n = 28).
Fitbit data
Physical activity
A total of 2113 (80.1%) valid days were recorded out of 2639 available days, of which 332 (88.1%) valid week averages could be constructed for analysis out of 377 available weeks. This resulted in 112 (96.6%) valid period averages, calculated according to the requirements mentioned in the method section. The random intercept mixed model showed a tendency towards an increase in registered ‘steps’ over the intervention periods (p = .064). Results of the pairwise comparison of the control week with the intervention periods showed a significant increase in physical activity in the middle intervention period (+3.8 ± 1.5 √steps) (), which represents an average daily increase of approximately 610 ‘steps’ registered by the Fitbit. No significant change was found at the end of the intervention period on ‘steps’, with a small effect size (d = 0.13). No interaction effect was found (p ≥ .354) between change in SoC and physical activity during any intervention period when this was added as interaction to the mixed model.
Table 3. Regression analyses on Fitbit data.
Sleep quality
A total of 2018 (76.5%) valid nights were recorded of the 2639 available nights, of which 319 (84.6%) valid week averages could be constructed of the 377 available weeks. This resulted in 108 (93.1%) valid period averages of the 116 available periods. The random intercept panel linear model showed a significant temporary reduced number of sleep minutes (-13.0 ± 6.1 min) and sleep efficiency (-1.5 ± 0.7%) registered by the Fitbit during the middle period, compared to the control week, as shown in . At the end period of the intervention no significant changes were observed for number of sleep minutes or sleep efficiency with very small (d = −0.05) to small effect (d = −0.17) sizes respectively.
Nutrition
Data of one participant were excluded from analysis due to unrealistic nutrition diary values (i.e., daily energy intakes were implausibly low). Significance was accepted at .05/7 = .007. A significant reduction (-1022 ± 434 kJ) in energy consumption was found post-intervention with a medium effect size. Additionally, the amount of consumed protein (-8.3 ± 5.0 g) and fat (-13.1 ± 5.0 g) was significantly lower post intervention with a medium effect size for protein and a large effect size for consumed fat (). No interaction effect was found (p ≥ .257) between change in SoC and intervention period for any of the nutrition outcomes.
Table 4. Nutritional intake pre and post 12-week intervention based on diet records (n = 26).
Body composition
Body composition data of 27 participants at pre and post-intervention were available, including body mass data of 19. Significance was accepted at .05/3 = .017. A significant reduction was found overtime in body mass (-2.7 ± 6.2 kg), BMI (-0.8 ± 1.5 kg/m2) and waist circumference (-3.3 ± 3.9 cm) with medium effect sizes for body mass and BMI and a large effect size for waist circumference ().
Table 5. Body composition changes pre and post 12-week intervention (n = 27).
Questionnaires
Significance was accepted at a p value of .05/15 = .003. A significant increase (+7.8 ± 3.0 MET h/day) in physical activity was found according to the PASIPD questionnaire, with a medium effect size. A significant improvement was found in experienced body function (+1.22 ± 0.36), body appearance (+1.10 ± 0.43) and total body satisfaction (+1.19 ± 0.31), with medium effect sizes for body function and body appearance and a large effect size for overall body satisfaction. No significant change was found in exercise self-efficacy according to the ESES questionnaire. A significant reduction in experienced fatigue was registered with the CIS20R questionnaire (-15.1 ± 6.7) with a medium effect size. According to the PSQI questionnaire, no significant change was found in sleep quality during the intervention. Within the SF-36E questionnaire, significant improvements were found on the domains mental health (+7.3 ± 4.1) and vitality (+9.1 ± 5.0), all with a medium effect size. No significant changes were found on the domains physical functioning, social functioning, role limitation physical, role limitation emotional, pain and general health perception. The participants evaluated the usability of the WHEELS app with a mean SUS score of 72.5 ± 17.5 with a score range of 32.5 and 100. Outcomes of all the questionnaires can be found in .
Table 6. Results from questionnaires pre and post 12-week intervention (n = 28).
Discussion
Principal findings
Findings of this study indicate that the WHEELS lifestyle app with an in-app coach and connected with an activity tracker partly supports a change towards a healthier lifestyle. No significant changes in SoC were found regarding physical activity and nutrition. No significant lasting changes in physical activity and sleep quality were observed based on Fitbit data. No interaction effect was found between SoC and outcomes on physical activity and nutrition. Participants showed a reduction in body mass, BMI and waist circumference, which seems largely caused by changes in diet, as a significant reduction was found in energy intake and amount of fat and protein post intervention. The questionnaire data showed that after the intervention the participants experienced an increase in body satisfaction, reduced fatigue and improved mental health and vitality.
Similar results on body composition changes were found during a previously conducted pilot study [Citation12]. In the present study medium effect sizes were found on reduced body mass and BMI and a large effect size was found on reduced waist circumference, showing good potential of this lifestyle app. This study seems to confirm that the app supports weight loss in wheelchair users with an above average effect size (d = .61) on body mass compared to other mHealth weight loss programs (average d = .37) [Citation57]. In total 74% of the participants lost weight and reduced their waist circumference. The validity of the body composition measurements is somewhat questionable, as they were all self-administered at home due to a global pandemic, instead of in a controlled environment by a trained researcher. However, diet records showed a reduced energy intake in 77% of the participants and a reduced intake of grams of fat and protein supporting both of our findings. Therefore, it seems plausible that the improvements in body composition reflect reality. Although the nutritional results are promising, there is still room for improvement on the macronutrient ratio intake of fat, as it shows a high relative intake with 35.5% of the total energy intake post intervention, where in general a range of 20–35% is recommended [Citation58].
The contribution of physical activity to body composition changes was limited, as only a temporary increase in physical activity was registered by the Fitbit during the middle period of the intervention. In the end period of the intervention, the increase in physical activity found was no longer significant compared to the control week. These results are in line with the previous conducted pilot study [Citation12] and other studies [Citation10]. Change in dietary behaviour is more likely to last than change in physical activity [Citation10], which is also reflected by the SoC results found in this study considering the large number of participants who considered themselves in the maintenance stage in diet behaviour. Surprisingly, in the present study participants subjectively experienced an increase in their physical activity level based on PASIPD questionnaire outcomes, in contrast to the objective Fitbit data. Possibly, participants experienced a greater increase in physical activity, because they were working on their lifestyle. However, discrepancies can exist between objectively measured and subjectively experienced behaviour. Previous research showed that non-ambulatory people tend to overestimate their physical activity level causing a low correlation in intensity (ρ = .24) and activity time (ρ = .22) between accelerometry and the PASIPD questionnaire [Citation59], possibly explaining the discrepancies in results between the subjective and objective physical activity outcomes in this study.
The results on sleep quality, measured by the Fitbit, were unexpected, as a temporarily reduced registered sleep time and efficiency were found during the middle period of the intervention. The fact that during the same period a significant increase in physical activity was registered by the Fitbit, makes it even more surprising. Previous research showed small positive relationships between increased physical activity and improved sleep quality outcomes [Citation60], with stronger relationships in individuals with present sleep problems [Citation61]. This might apply to some of the participants in this study, as the average PSQI score pre intervention was 7.1 ± 3.3, which is above the cut-off point of 5, indicative of poor sleep quality [Citation62]. One could wonder how meaningful the observed changes are, as only temporary reductions of 13 sleep minutes and 1.5% sleep efficiency were registered. A seasonal effect might have influenced sleep quality negatively, as previous research showed a reduced sleep time in the Spring season [Citation63], which is when most of the study participants were included. There might be a ceiling effect on sleep efficiency making it difficult to improve sleep quality as the measured sleep efficiency in this study ranged between 54.5% and 98.8% with most participants already scoring above 90% in the control week, and thus, had little room for improvement [Citation64]. However, Tobit analyses did not report censored observations in sleep efficiency, and, therefore, the data were analysed with panel linear regression. Another explanation for the limited change in sleep quality could be due to factors affecting sleep that could not be influenced by an mHealth application, such as spasms or (neurological) pain [Citation65,Citation66].
The WHEELS lifestyle app showed good results on health-related quality of life, body satisfaction and experienced fatigue. According to previous research, body satisfaction and physical and mental health are related [Citation67]. Eating healthier is associated with improved body satisfaction, possibly partly explaining the improved body satisfaction in this study. The temporarily increased physical activity levels might also have influenced body satisfaction, mental health, fatigue and vitality, as they are all positively related to exercise [Citation68,Citation69]. More positive results were found in the present study with improved health-related quality of life, body satisfaction and reduced experienced fatigue, compared to the previous pilot study, which only showed an improved sleep quality according to the PSQI [Citation12]. Participants experienced a better usability of the app in the present study with an average SUS score of 72.5 compared to 58.6 in the pilot study. The improved SUS score was most likely due to the improved in-app navigation function, a Fitbit integration allowing real time energy estimations and the availability of a lifestyle coach, possibly causing a larger intervention effect and a lower dropout rate.
Based on the willingness to participate in this study, it could be assumed that all participants were open to lifestyle change and, therefore, very unlikely in the “precontemplation” SoC. No significant shift was registered in SoC on physical activity, while participants did report a subjective increase in physical activity according to the PASIPD questionnaire. However, this did not result in an enduring increased physical activity level measured by accelerometry. No significant shift in SoC was registered for nutrition, although a significant change in diet was found during the intervention. It seems one single question regarding their readiness for change on lifestyle behaviour could not verify actual change, as no interaction was found between change in SoC and nutrition outcomes either. It might be that participants assumed their behaviour prior to the intervention was already healthy, but realised, based on feedback on their nutrition and physical activity received during the intervention, that this was not the case.
Strengths & limitations
This study has several strengths. The study was conducted in an ecological setting in a manner how an mHealth application could be applied in practice. Physical activity and sleep behaviour were continuously measured with an accelerometer to track changes over time objectively. However, this study also has limitations, the most obvious one being the lack of a control group. A randomised-controlled trial is a stronger design to confirm the promising results of this study. However, this would require a larger total sample size for similar statistical power [Citation70], which is generally a challenge in population-specific research. Fitbit data used for physical activity were registered “steps” from the Fitbit, which is not specifically designed for wheelchair use. However, previous research has shown that the Fitbit is able to differentiate physical activity levels in wheelchair users [Citation32], which is confirmed by the range of the registered daily steps (190 − 32,229) of the participants within this study. Overall, the accuracy of the heart rate registered by Fitbit during wheelchair activities seems decent, but can decline due to physiological changes, i.e., in people with tetraplegia [Citation71]. Unfortunately, most outcome measures were self-reported due to a global pandemic. Body composition measurements were therefore limited and self-administered, resulting in a higher likelihood of measurement errors. However, clear instructions on how and when the measurements should be performed were given to all participants in order to limit errors, which resulted in an intraclass coefficient correlation of .997 for both pre and post WC measurements. In addition, a strong correlation was found between the observed change in body mass and change in WC (r = .809, p < .001). Although most participants (71%) stated that the global pandemic did not influence their lifestyle, it is plausible that the behaviour during this study might have been influenced due to the pandemic circumstances and results might, therefore, be less generalizable. No full lockdown took place during the study period, but small changes in governmental restrictions on society were applied during the data collection, possibly influencing lifestyle behaviour of the participants on a small scale.
Conclusions
The WHEELS lifestyle app seems a valuable tool to support healthy lifestyle behaviour in wheelchair users. Although no enduring changes on objective physical activity and sleep were found, improved nutrition behaviour and body composition were registered combined with improved body satisfaction, mental health, vitality and reduced experienced fatigue. Despite the lack of a control group, it seems that the WHEELS lifestyle app could be a valuable and easy tool for wheelchair users to support healthy behaviour in a home setting.
Disclosure statement
No potential conflict of interest was reported by the authors.
Additional information
Funding
References
- World Health Organization. Global health risks: mortality and burden of disease attributable to selected major risks. Geneva: World Health Organization; 2009.
- World Health Organization. Public spending on health: a closer look at global trends. Geneva: World Health Organization; 2018.
- Ross SE, Flynn JI, Pate RR. What is really causing the obesity epidemic? A review of reviews in children and adults. J Sports Sci. 2016;34(12):1148–1153.
- Wu Y, Zhai L, Zhang D. Sleep duration and obesity among adults: a Meta-analysis of prospective studies. Sleep Med. 2014;15(12):1456–1462.
- Weil E, Wachterman M, Mccarthy EP, et al. Obesity Among adults With disabling conditions. J Am Med Assoc. 2002;288(10):1265–1268.
- World Health Organization. WHO fact sheet noncommunicable diseases [Internet]. WHO fact sheet noncommunicable diseases. [cited 2021 Aug 12]. Available from: https://www.who.int/news-room/fact-sheets/detail/noncommunicable-diseases.
- Sequi-Dominguez I, Alvarez-Bueno C, Martinez-Vizcaino V, et al. Effectiveness of mobile health interventions promoting physical activity and lifestyle interventions to reduce cardiovascular risk Among individuals With metabolic syndrome : Systematic review corresponding author. J Med Internet Res. 2020;22(8):e17790.
- Kitsiou S, Paré G, Gerber B, et al. Effectiveness of mHealth interventions for patients with diabetes : An overview of systematic reviews. PLoS ONE. 2017;12(3):e0173160.
- Hutchesson MJ, Rollo ME, Krukowski R, et al. eHealth interventions for the prevention and treatment of overweight and obesity in adults : a systematic review with Meta-analysis. Obes Rev. 2015;16(5):376–392.
- Fjeldsoe B, Neuhaus M, Winkler E, et al. Systematic review of maintenance of behavior change Following physical activity and dietary interventions. Health Psychol. 2011;30(1):99–109.
- Bardus M, van Beurden SB, Smith JR, et al. A review and content analysis of engagement, functionality, aesthetics, information quality, and change techniques in the most popular commercial apps for weight management. Int J Behav Nutr Phys Act. 2016;13(1):35–39.
- Hoevenaars D, Holla JFM, te Loo L, WHEELS Study Group, et al. Mobile app (WHEELS) to promote a healthy lifestyle in wheelchair users With spinal cord injury or lower limb amputation : Usability and feasibility study. JMIR Form Res. 2021;5(8):e24909.
- Bartholomew LK, Markham CM, Ruiter RAC, et al. Planning health promotion programs: an intervention mapping approach. 4th ed. San Fransisco, CA: Jossey-Bass; 2016.
- Petty RE, Barden J, Wheeler SC. The elaboration likelihood model of persuasion: health promotions that yield sustained behavioral change. In DiClemente RJ, Crosby RA, Kegler MC, editors. Emerging theories in health promotion practice and research: strategies for improving public health. 1st ed. San Fransisco, CA: Jossey-Bass; 2002. p. 71–99.
- Prochaska JO, Redding CA, Evers KE. The transtheoretical model and stages of change. In Glanz K, Rimer BK, Viswanath K, editors. Health behavior and health education: theory, research, and practice. 4th ed. San Fransisco, CA: Jossey-Bass; 2008. p. 98–120.
- Brug J, van Assema P, Lechner L. Gezondheidsvoorlichting en gedragsverandering: een planmatige aanpak. 9e ed. Assen: Koninklijke van Gorcum BV.; 2017.
- Champion VL, Skinner CS. The health belief model. In Glanz K, Rimer BK, Viswanath K, editors. Health behavior and health education: Theory, research and practice. 4th ed. San Fransisco, CA: Jossey-Bass; 2008. p. 45–65.
- Latham GP, Locke EA. New developments in and directions for goal-setting research. Eur Psychol. 2007;12(4):290–300.
- McAlister AI, Perry CI, Parcel GS. How individuals, environments, and health behaviors interact: Social cognitive theory. In Glanz K, Rimer BK, Viswanath K, editors. Health behavior and health education: theory, research, and practice. 4th ed. San Fransisco, CA: Jossey-Bass; 2008. p. 169–187.
- Martin Ginis KA, van der Scheer JW, Latimer-Cheung AE, et al. Evidence-based scientific exercise guidelines for adults with spinal cord injury: an update and a new guideline. Spinal Cord [Internet]. 2018;56(4):308–314. Available from:
- Bille K, Figueiras D, Schamasch P, et al. Sudden cardiac death in athletes : the lausanne recommendations. Eur J Cardiovasc Prev Rehabil. 2006;13(6):859–875.
- Faul F, Erdfelder E, Lang AG, et al. *Power 3: a flexible statistical power analysis program for the social, behavioral, and biomedical sciences. Behav Res Methods. 2007;39(2):175–191.
- Love R, Adams J, van Sluijs EMF, et al. A cumulative Meta-analysis of the effects of individual physical activity interventions targeting healthy adults. Obes Rev. 2018;19(8):1164–1172.
- Rice IM, Rice LA, Motl RW. Promoting physical activity Through a manual wheelchair propulsion intervention in persons with multiple sclerosis. Arch Phys Med Rehabil. 2015;96(10):1850–1858.
- Dontje ML, Groot MD, Lengton RR, et al. Measuring steps with the fitbit activity tracker: An inter-device reliability study. J Med Eng Technol. 2015;39(5):286–290.
- Schofield WN. Predicting basal metabolic rate, new standards and review of previous work. Hum Nutr Clin Nutr. 1985;39:5–41.
- Buchholz AC, McGillivray CF, Pencharz PB. Differences in resting metabolic rate between paraplegic and able-bodied subjects are explained by differences in body composition. Am J Clin Nutr. 2003;77(2):371–378.
- Monroe MB, Tataranni PA, Pratley R, et al. Lower daily energy expenditure as measured by a respiratory chamber in subjects with spinal cord injury compared with control subjects. Am J Clin Nutr. 1998;68(6):1223–1227.
- Collins EG, Gater D, Kiratli J, et al. Energy cost of physical activities in persons with spinal cord injury. Med Sci Sports Exerc. 2010;42(4):691–700.
- Prochaska JO, Velicer WF. The transtheoretical change model of health behavior. Am J Health Promot. 1997;12(1):38–48.
- The Netherlands Nutrition Centre. Gezond eten [Internet]. [cited 2021. Oct 19]. Available from: https://www.voedingscentrum.nl/nl/gezond-eten-met-de-schijf-van-vijf.aspx.
- Maijers MC, Verschuren O, Stolwijk-Swüste JM, et al. Is fitbit charge 2 a feasible instrument to monitor daily physical activity and handbike training in persons with spinal cord injury ? A pilot study. Spinal Cord Ser Cases. 2018;4:84. (Available from:
- Fitbit. What should I know about Fitbit sleep stages? [Internet]. [cited 2022. May 25]. Available from: https://help.fitbit.com/articles/en_US/Help_article/2163.htm#:∼:text=Fitbit%20estimates%20your%20sleep%20stages,as%20rolling%20over%2Cetc.
- Haghayegh S, Khoshnevis S, Smolensky MH, et al. Accuracy of wristband fitbit models in assessing sleep: Systematic review and Meta-Analysis. J Med Internet Res. 2019;21(11):e16273.
- Skender S, Ose J, Chang-Claude J, et al. Accelerometry and physical activity questionnaires - a systematic review. BMC Public Health [Internet]. 2016;16(1):515.
- Trost SG, Mciver KL, Pate RR. Conducting accelerometer-based activity assessments in field-based research. Med Sci Sport Exerc. 2005;37(11):531–543.
- Ortega RM, Perez-Rodrigo C, Lopez-Sobaler AM. Dietary assessment methods: dietary records. Nutr Hosp. 2015;31:38–45.
- Osterkamp LK. Current perspective on assessment of human body proportions of relevance to amputees. J Am Diet Assoc. 1995;95(2):215–218.
- Himes J. New equation to estimate body mass index in amputees. J Am Diet Assoc. 1995;95(6):646.
- Centraal Bureau voor de Statistiek. Standaard Onderwijsindeling 2021. 2021.
- Washburn RA, Zhu W, McAuley E, et al. The physical activity scale for individuals with physical disabilities: Development and evaluation. Arch Phys Med Rehabil. 2002;83(2):193–200.
- Reboussin BA, Rejeski WJ, Martin KA, et al. Correlates of satisfaction with body function and body appearance in Middle- and older aged adults: the activity counseling trial (ACT). Psychol Health [Internet]. 2000;15(2):239–254.
- Nooijen CFJ, Post MWM, Spijkerman DCM, et al. Van den Berg-Emons RJG. Exercise self-efficacy in persons with spinal cord injury: Psychometric properties of the dutch translation of the exercise self-efficacy scale. J Rehabil Med. 2013;45(4):347–350.
- McAuley E. Self-efficacy and the maintenance of exercise participation in older adults. J Behav Med. 1993;16(1):103–113.
- Makowiec-Dabrowska T, Koszada-Wlodarczyk W. The CIS20R questionnaire and its suitability for prolonged fatigue studies. Med Pr. 2006;57(4):335–345.
- Vercoulen JHMM, Swanink CMA, Fennis JFM, et al. Dimensional assessment of chronic fatigue syndrome. J Psychosom Res. 1994;38(5):383–392.
- Buysse DJ, Reynolds CF, Monk TH, et al. The pittsburgh sleep quality index: a new instrument for psychiatric practice and research. Psychiatry Res. 1989;28(2):193–213.
- Mollayeva T, Thurairajah P, Burton K, et al. The pittsburgh sleep quality index as a screening tool for sleep dysfunction in clinical and non-clinical samples: a systematic review and Meta-analysis. Sleep Med Rev. 2016;25:52–73.
- Froehlich-Grobe K, Andresen EM, Caburnay C, et al. Measuring health-related quality of life for persons with mobility impairments: An enabled version of the short-form 36 (SF-36E). Qual Life Res. 2008;17(5):751–770.
- Aaronson NK, Muller M, Cohen PDA, et al. Translation, validation, and norming of the dutch language version of the SF-36 health survey in community and chronic disease populations. J Clin Epidemiol. 1998;51(11):1055–1068.
- Brooke J. SUS: a “quick and dirty” usability scale. In Jordan PW, Thomas B, Weerdmeester BA, McClelland AL, editors. Usability evaluation in industry. London: CRC Press; 1996.
- William HG. Econometric analysis. 6th ed. Upper saddle river: Prentice Hall; 2008. 11–19.
- Tomczak M, Tomczak E. The need to report effect size estimates revisited. An overview of some recommended measures of effect size. Trends Sport Sci [Internet]. 2014;1(21):19–25. Available from: http://www.wbc.poznan.pl/Content/325867/5_Trends_Vol21_2014_no1_20.pdf
- R Core Team (2020). A language and environment for statistical computing. R Foundation for Statistical Computing. R software. Vienna, Austria.
- Rstudio Team. RStudio: Integrated development environment for R [internet]. Boston, MA, USA: Rstudio, PBC; 2021. Available from: http://www.rstudio.com/
- Croissant Y, Millo G. Panel data econometrics in R : the plm package. J Stat Softw. 2008;27(2):1–43.
- Cavero-Redondo I, Martinez-vizcaino V, Fernandez-Rodriguez R, et al. Effect of behavioral weight management interventions using lifestyle mHealth Self-Monitoring on weight loss: a systematic review and Meta-Analysis. Nutrients. 2020;12(7):1977.
- Manore MM. Exercise and the institute of medicine recommendations for nutrition. Curr Sports Med Rep. 2005;4(4):193–198.
- Van Den Berg-Emons RJ, L'Ortye AA, Buffart LM, et al. Validation of the physical activity scale for individuals with physical disabilities. Arch Phys Med Rehabil [Internet]. 2011;92(6):923–928.
- Kredlow MA, Capozzoli MC, Hearon BA, et al. The effects of physical activity on sleep: a Meta-analytic review. J Behav Med. 2015;38(3):427–449.
- Montgomery P, Dennis JA. Physical exercise for sleep problems in adults aged 60. +Chochrane Database Syst Rev. 2002;4(4).
- Backhaus J, Junghanns K, Broocks A, et al. Test-retest reliability and validity of the pittsburgh sleep quality index in primary insomnia. J Psychosom Res. 2002;53(3):737–740.
- Mattingly SM, Grover T, Martinez GJ, et al. The effects of seasons and weather on sleep patterns measured through longitudinal multimodal sensing. Npj Digit Med [Internet]. 2021;4(76).
- Youngstedt SD. Ceiling and floor effects in sleep research. Sleep Med Rev. 2003;7(4):351–365.
- Biering-Sorensen F, Biering-Sorensen M. Sleep disturbances in the spinal cord injured: an epidemiological questionnaire investigation, including a normal population. Spinal Cord. 2001;39:505–513.
- de la Vega R, Miró J, Esteve R, et al. Sleep disturbance in individuals with physical disabilities and chronic pain: the role of physical, emotional and cognitive factors. Disabil Health J. 2019;12(4):588–593.
- Gillen MM. Associations between positive body image and indicators of men ’ s and women’s mental and physical health. Body Image [Internet]. 2015;13:67–74.
- Hausenblas HA, Fallon EA. Exercise and body image : a Meta-analysis. Psychol Health. 2006;21(1):33–47.
- Mikkelsen K, Stojanovska L, Polenakovic M, et al. Exercise and mental health. Maturitas [Internet]. 2017;106:48–56.
- Wang X, Kattan MW. Cohort studies: Design, analysis, and reporting. Chest. 2020;158(1S):S72–S8.
- Hoevenaars D, Yocarini IE, Paraschiakos S, et al. Accuracy of heart rate measurement by the fitbit charge 2 During wheelchair activities in people With spinal cord injury: Instrument validation study. JMIR Rehabil Assist Technol. 2022;9(1):e27637.