
 ?Mathematical formulae have been encoded as MathML and are displayed in this HTML version using MathJax in order to improve their display. Uncheck the box to turn MathJax off. This feature requires Javascript. Click on a formula to zoom.
Abstract
Worldwide, the recent SARS-CoV-2 virus disease outbreak has infected more than 691,000,000 people and killed more than 6,900,000. Surprisingly, Sub-Saharan Africa has suffered the least from the SARS-CoV-2 pandemic. Factors that are inherent to developing countries and that contrast with their counterparts in developed countries have been associated with these disease burden differences. In this paper, we developed data-driven COVID-19 mathematical models of two ‘extreme’: Cameroon, a developing country, and New York State (NYS) located in a developed country. We then identified critical parameters that could be used to explain the lower-than-expected COVID-19 disease burden in Cameroon versus NYS and to help mitigate future major disease outbreaks. Through the introduction of a ‘disease burden’ function, we found that COVID-19 could have been much more severe in Cameroon than in NYS if the vaccination rate had remained very low in Cameroon and the pandemic had not ended.
1. Introduction
As of 4th July 2023, the recent global disease outbreak, SARS-CoV-2 viral infection (COVID-19), has infected about 690,976,825 with about 6,896,043 deaths worldwide [Citation37,Citation51]. In the U.S., a country of approximately 329.5 million people, the number of confirmed cases of COVID-19 is 107,321,664 with nearly 1,168,197 deaths [Citation37,Citation51]. In Africa, a continent of over 1.2 billion people, there have been about 12,830,598 cases of COVID-19 infections reported and 258,804 COVID-19 reported deaths [Citation37,Citation51]. Recent data thus estimates that the African continent has accounted for approximately just 4% of the total of 4.4 million deaths due to COVID-19. This lower-than-expected number of reported COVID-19 cases in Africa is surprising, as some of the major factors that drive high burdens of COVID-19 and other infectious diseases, such as the environmental and socio-economic conditions, lack of water and sanitation infrastructure, and weak health systems, are ubiquitous in Africa [Citation4].
The epidemiologically based explanations for the low COVID-19 infections and deaths in Africa are based on considerations of well-established factors, such as warmer climates, younger age distributions, lower contact rates due to lower population density and transportation infrastructure in rural areas, outdoor life styles, strong immune systems of Africans as a consequence of living in regions with greater exposure to cholera, HIV, malaria, and other infectious diseases, and related prophylaxis and therapeutics [Citation12,Citation16,Citation24,Citation30,Citation49]. In addition, many African governments implemented early and strong non-pharmaceutical intervention (NPI) policies that may have effectively contained COVID-19 infections and deaths. For example, the first case of COVID-19 infection was reported in Sub-Saharan Africa one month later than the first case in Europe. On 22 April 2020, the World Health Organization highlighted examples of how Africa was leading the global response. NPIs such as lockdowns, social distancing, mask wearing, early border closures, less international connectivity helped lower the case load.
There is already an abundance of modelling studies on COVID-19, its specific features in various parts of the world, and strategies for preventing the spread of the disease. Such preventing measures include combinations of techniques such as vaccination [Citation2,Citation39,Citation47], isolation and quarantine [Citation13,Citation20], social media and community awareness [Citation35,Citation42,Citation43], drug therapy [Citation15,Citation53], and the effect of environment [Citation38,Citation39]. However, all these works were location-specific and did not compare the potential differences that exist from one part of the world to another. In this regard, especially in the case of Sub-Saharan Africa, most modelling studies tended to adapt ‘imported’ modelling features to the African context. To date, and to the best of our knowledge, the only existing mathematical models of COVID-19 that explicitly compare the disease severity between two ‘extreme’ locations of the world (namely, Cameroon in Sub-Saharan Africa and New York State in the United States of America) were developed in [Citation39]. These models were then used to show the importance of data reporting timeframe and location-driven modelling scheme on models' applicability.
The United States of America as a whole registered the highest number of COVID-19 cases and deaths in the world to date [Citation51]. At the state level, California, Texas, Florida and New York State ranked respectively first, second, third and fourth among the most severely hit by the pandemic. Although the first cases of COVID-19 were reported in these four U.S. states relatively at the same period ( 1 March 2020 for New York State and Florida; 4 March 2020 for Texas), except California where the first case was reported earlier on 24 January 2020 [Citation51], New York State, especially New York City, rapidly became the first U.S. epicentre of the disease pandemic [Citation28]. For this reason, we take NYS as a proxy for a COVID-19-severely-hit developed community, in comparison to a developing community where the pandemic was fairly less severe, where we take the Sub-Saharan African country Cameroon as a proxy.
Like most countries in Sub-Saharan Africa, Cameroon has a fairly young population with over 90% under 54 years, and a median age of 18.5 years [Citation12]. The average temperature in the two major cities of Cameroon, Yaounde and Douala, ranges between and
, and the average percentage annual humidity ranges between 85% and 89% [Citation49]. These environmental conditions in Cameroon are less favourable for the SARS-CoV-2 survival [Citation30] than in NYS, where the average temperature ranges between
and
and the average percentage annual humidity is approximately 63% [Citation32]. Also, the median population age in NYS is 39 years, that is twice that in Cameroon. Moreover, the population density in Cameroon is lower than that in NYS; Cameroon has a population of
millions and an area of approximately
[Citation12], which is more than 3 times the area of NYS at 141,300 km
for a comparable population size (
millions). Recall that strong COVID-19 mitigation responses such as isolation and quarantine of incoming travellers were implemented in Cameroon at the early days of the outbreaks, whereas these measures were somewhat relaxed in the U.S. at the onset of the pandemic, leading to New York State becoming the first U.S. epicentre of the disease pandemic [Citation28].
In this paper, we used data-driven COVID-19 mathematical models of Cameroon in Sub-Saharan Africa [Citation51], and New York State in the U.S. [Citation51] to study the effects of Sub-Saharan Africa-specific conditions on the so-far lower-than-expected COVID-19 infections in Cameroon, and used the U.S. specific conditions to study the effects on the higher infections in New York State. We estimated the model parameters using reported 30-day rolling average COVID-19 data for Cameroon from 17 June 2021 to 25 September 2021, and the daily reported data for New York State from 17 June 2021 to 16 August 2021.
The paper is organized as follows: In Section 2, we introduced the parameterized COVID-19 mathematical models for Cameroon and New York State, and performed a global sensitivity analysis for both models. In Section 3 we performed differential analysis of the basic reproduction number, , and, in Section 4, we introduced the ‘burden ratio’, which measures the potential disease severity in Cameroon relative to New York State. We conclude the paper in Section 5.
2. Mathematical model
In this section, we formulate the COVID-19 mathematical model by a system of ordinary differential equations based on the network shown in Figure , with the variables in Table .
Figure 1. Framework of COVID-19 model.
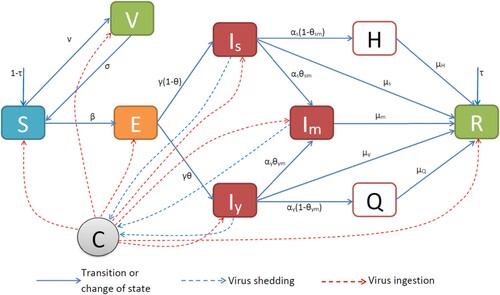
Table 1. Variables of the model.
To simplify the model, we take the total population, N, to be constant for all time. That is
(1)
(1) At the start of the outbreak, a proportion of the total population is susceptible and the other proportion, τ, has pre-acquired immunity:
at time t=0, where
.
COVID-19 is transmitted by breathing in air carrying droplets on aerosol particles that contain a minimum load of SARS-CoV-2 virus when close to an infected person or in poorly ventilated spaces with infected persons [Citation5,Citation7]. We thus assume that infection occurs when there is direct contact between a susceptible and the virus (C); this is modelled by the ratio , which is an increasing saturating (at the limit value 1) function of C, and
is the density of virus that is necessary for a successful infection half of the time. Since isolated (Q) and hospitalized (H) persons are somewhat cut-off from the ‘actively circulating’ population, we also assume that any human can ingest the virus, except H and Q.
In our model, a ‘young’ person is any human aged below 50 years and a ‘senior’ is thus anyone who is at least 50 years old. Typically, seniors are more vulnerable to COVID-19 infections and deaths than the youths [Citation8,Citation31]. As a result, we assume that the youths have a stronger immunity to COVID-19 than seniors. The self-medicating group is composed of both young and senior persons; we assume that this group of self-medicating persons are off-radar and are using locally known immune system boosters [Citation25].
Infected youths (), seniors (
) and self-medicating persons (
) shed the virus in the environment at various rates. We assume that only infected persons with serious cases are hospitalized, and those whose cases are not serious and who are not self-medicating, are treated from home or in quarantine facilities. Susceptible individuals are vaccinated (V ) at rate ν. But, people who get infected after vaccination can spread COVID-19 to other people [Citation10]. For this reason, we take that vaccinated persons lose immunity at rate σ. Reinfection to COVID-19 can occur as early as several weeks after a previous infection, although this is rare [Citation11]. Given the short time considered in our study, we assume that, unlike the vaccinated, recovered individuals do not wane immunity.
Hence, our COVID-19 model is represented by the following system of equations:
(2)
(2) where
, and all the other parameters are positive. We easily check that
.
We will use Model (Equation2(2)
(2) ) to capture the reported COVID-19 infections in Cameroon from 17 June to 25 September 2021, and in New York State from 17 June to 16 August 2021.
2.1. Cameroon (Sub-Saharan Africa) model versus New York State ( U.S.) model
We state features that model the African infection situation versus those that model the American situation by identifying the corresponding parameters in System (Equation2(2)
(2) ):
The contact rate, β: the contact rate β is expected to be smaller in Cameroon due to lower population density and transportation infrastructure in rural areas, among other reasons, as compared to the U.S., and in particular in New York State.
The vaccination rate, ν: the proportion of vaccinated Americans as of 16 August 2021 was greater than 50%, as compared to less than 3% in Cameroon in the same period. Hence, ν in New York State is greater than that in Cameroon.
The proportion of the population with pre-acquired immunity, τ: Cameroon, like most Sub-Saharan African countries, still suffers from regular outbreaks of fatal infectious diseases than the U.S. These diseases, whose treatments and control remain a permanent cause of concern, include malaria (endemic), cholera (episodic), yellow fever (endemic), HIV (endemic), and so on. Thus, τ is relatively greater in Cameroon than in New York State.
The fraction of youth who become infectious, θ: the median age in Cameroon is 18 years, while that in the U.S. is 38 years. Hence, θ is greater in Cameroon than in New York State.
The dissipation rate of the virus,
: the temperature in Cameroon (like in most Sub-Saharan Africa) is warmer throughout the year than in the U.S.; which implies that people stay outside most of the times in Cameroon than in the U.S. Ventilation and high temperature increase the SARS-CoV-2 dissipation. Hence,
2.2. Parameter estimations
In this section, we reproduce our work in [Citation39] and use biological evidence to estimate most parameters of our model. The remaining parameters that cannot be estimated due to lack of biological evidence are estimated using the method of Bayesian inference with reported rolling 30-day rolling average data for COVID-19 in Cameroon from 17 June to 25 September 2021, and with the number of daily new cases in New York State from 17 June to 16 August 2021. All the parameters are listed in Table .
Table 2. Baseline values for the model parameters.
Estimate for γ: The incubation period for COVID-19 is 1–14 days, with mean of approximately 5.2 days [Citation27,Citation48]. We take
Estimate for
and
: Using available preliminary data, the median time from onset to clinical recovery for mild cases is approximately 2 weeks and is 3–6 weeks for patients with severe or critical diseases. Among patients who have died, the time from symptom onset to outcome ranges from 2 to 8 weeks [Citation48]. We take the time from symptom onset to ‘removal’ (recovery or death) to be 2 weeks for mild cases, and 2–7 (average of 4 weeks) weeks for severe cases. Since the disease is mild for
and Q, and potentially severe for
and H, we take
Since
is composed of
and
, we take
The half-life of SARS-CoV-2 in humans depends on the source and on environmental conditions as follows [Citation30]:
Table
Note: humidity.
The average temperature in New York City between 1991 and 2020 ranged in , and the average percentage of annual humidity in New York was approximately 63% in 2020 [Citation32]. We take the mean half-life of SARS-CoV-2 in New York State to be 3.1 hours, or equivalently,
days.
The average temperature in Douala and Yaounde, the two major cities in Cameroon, ranges between and
, and the average percentage annual humidity in these two cities ranges between 85% and 89% [Citation49]. We take the mean half-life of SARS-CoV-2 in Cameroon to be 1.5 hours, or equivalently,
days.
We compute the dissipation rate of the virus in each case by the formula . Hence,
Estimate for
and
: In this work, we assume that individuals
and
are confirmed of their COVID-19 sickness 1–3 days after symptoms' onset (either through testing or symptoms checklist). We also assume that seniors are more aware and prompt to detect any health issues than younger individuals. So, we take
Estimate for
: The number of SARS-CoV-2 particles that are necessary for infection is in the range of hundreds, with an estimate of 300 [Citation5]. We take
Estimate for
and
: A respiratory droplet particle of size 1 μm would contain approximately 0.01% of SARS-CoV-2 [Citation26,Citation41]. Since a cough produces around 3000 droplets, then each cough releases 0.3 virions; a sneeze produces approximately 40,000 droplets, hence 4 virions are released [Citation14].
The daily average cough frequency in healthy adults is 18.5±0.5 and the daily average cough frequency in adults with respiratory disease is 275±0.37 [Citation52]. We take the number of coughs for to be 18.5 d
, of
to be 275 d
, and of
to be 147 d
, which correspond to
On average, normal persons sneeze and blow their nose approximately 4 times per day [Citation17] (note that sneezing is not necessarily a symptom of COVID-19). We take the daily average number of sneezes for
to be 4, for
to be 8, and for
to be 6. Hence,
One minute of loud speaking generates at least 1000 virion-containing droplets [Citation41]. we assume that one minute of normal speaking generates approximately 1000 droplets. An average person spends between 18 and 180 minutes a day talking; we take 100 minutes. Hence, an average person generates approximately 100,000 talking-droplets a day, that is,
We now compute
and obtain
Estimate for ν: The proportion of the New York State population who had a full vaccine dose on 17 June 2021, was 51.4%, and on 16 August 2021 (60 days later), was 58.5% [Citation37]. We compute the daily average over the 60 days and take
By mid-June 2021, just 2.3% of the high-risk population (approximately 812,300 people) in Cameroon had been fully vaccinated [Citation1], and only 300 of a targeted 300,000 state workers had agreed to vaccinate against COVID-19 in Cameroon by 18 November 2021 [Citation22]. With a total population of approximately 28 million, the overall vaccination rate in Cameroon is then in the order of
, which means that the average daily vaccination rate against COVID-19 in Cameroon is in the order of
d
. This vaccination rate in Cameroon is significantly smaller than that in New York State; hence we take
The parameters
and σ are estimated by using the method of multistart least square minimization to fit the simulation of the daily new infections to actual data of Cameroon [Citation37] and New York State [Citation33]. We used the following ranges for the parameters:
The following initial conditions are used for the simulations, where we take
(there is no pre-acquired immunity) in New York State due to prior global infections, and
in Cameroon:
(3)
(3) We compute the cumulative number of new COVID-19 cases up to time t by the following formula:
where
is the instantaneous rate of
transition (new infectious case in Equation (Equation2
(2)
(2) )).
We then measure the goodness of fit by computing the data-simulations relative error (RE) and the basic reproduction number () as follows (see Appendix about computing
):
(4)
(4)
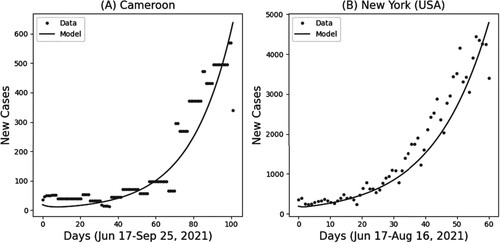
Figure shows our model simulations and actual data of the COVID-19 outbreaks in Cameroon between 17 June and 25 September 2021 (RE=6.44%, ) and in New York State between 17 June and 16 August 2021 (RE=4.3%,
). Our model with the African features correctly predicts the smaller number of COVID-19 infections in Cameroon relative to the number in New York State.
Figure 2. COVID-19 in Cameroon and New York State (U.S.A.): Model results vs data. (A) 30-day rolling number of COVID-19 new infection cases in Cameroon between 17 June and 25 September 2021: N=28 million, RE=6.44%, ; (B) Daily number of COVID-19 new infection cases in New York State between 17 June and 16 August 2021: N=20 million, RE=4.3%,
. The parameter values are in Table .
Interestingly, for New York State and
for Cameroon. To understand this, we note that both actual data sets in Figure are from 17 June 2021. During that time, the pandemic was somewhat already under control in the U.S. since more than 50% of the population had received a full dose of vaccine. However, the vaccination rate in Cameroon was less than 3% by that same date, and the trend of the number of new infections (like in most Sub-Saharan Africa) had remained relatively low, though increasing, since the onset of the pandemic. Therefore, we see that in the long run, with the condition of Figure , the disease could be over 14 times more severe in Cameroon than in New York State.
2.3. Parameter sensitivity analysis
We performed a sensitivity analysis with respect to the cumulative number of new infections, for a group of parameters which were estimated (see Figure ). The computations were done using Latin Hypercube Sampling/Partial Rank Correlation Coefficient (LHS/PRCC) with a Matlab package by [Citation23,Citation29]. The range for the parameters in the sensitivity analysis was between of their baseline values in Table .
Figure 3. Parameter sensitivity analysis for the severity of COVID-19 in Cameroon (Jun 17-Sep 25, 2021) and New York State (Jun 17-Aug 16, 2021). All the parameters have p-values except
whose p-value is
; we exclude it from the analysis. (a) Cameroon and (b) New York State (U.S.A.).
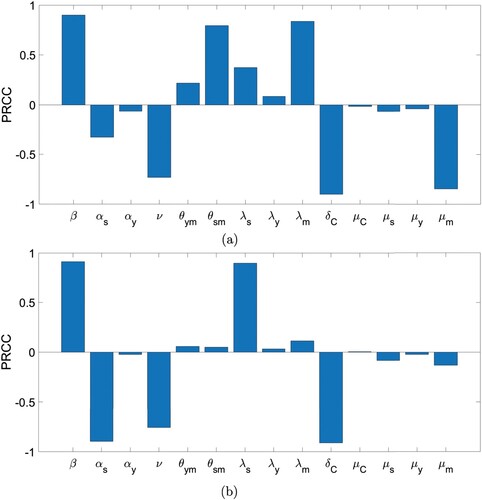
The contact rate of susceptible humans with the COVID-19 virus, β, and the virus' shedding rates, and
, are clearly the most positively correlated parameters. Indeed, these parameters are directly concerned with increasing the risk of infection within the community. In particular, in Cameroon, due to the high rate of self-medication, the shedding rate by self-medicating people,
, is more correlated than that by the senior (
) and the youth (
) groups. Moreover,
is more correlated than
since the symptoms are more effective in seniors than in the youth. In New York State,
is more correlated than
and
since the population in New York State is older than that in Cameroon, and the self-medication rate in New York State is also smaller than that in Cameroon.
The parameters and
which represent the fraction of seniors who self-medicate, and the corresponding fraction of the youth, respectively, are also positively correlated. The parameter
is more correlated than
in Cameroon since self-medication is mainly done by symptomatic seniors, while these two parameters remain relatively smaller in New York State where we assume low self-medication rates.
The vaccination rate, ν, is clearly negatively correlated both in Cameroon and New York State. The ingestion rate of the virus, , and the removal rates of infectious humans,
, and
, are also negatively correlated since they mean that the virus is being removed from the community. Interestingly, the removal rate of self-medicating humans is the most negatively correlated of the removal rates since this category represents the infectious humans who are off-radar and become potential super-spreaders. The disease's detection rates
and
are also clearly negatively correlated.
3. Differential analysis of
To advise policy makers on treatment and control strategies, in this section, we perform a differential analysis of the basic reproduction number, in Equation (Equation4
(4)
(4) ), with respect to some ‘critical’ parameters.
Policy or control strategies aimed at containing the spread of the disease require understanding how the value of in Equation (Equation4
(4)
(4) ) changes with respect to some identifiable, measurable and controllable parameters, namely,
and
. We proceed with a differential analysis of
about these parameters.
| Contact rate β : ∂βR0>0. | Policies should aim at decreasing β, the contact rate among people, with measures that include lockdown, confinement and social distancing. These measures were actively put in place in New York State (and most U.S. states) with relative success. In fact, a vast majority of contacts could not be avoided in New York State due to various reasons such as socio-economic, cultural and religious beliefs. In Cameroon (and most of Sub-Saharan Africa), the contact rate was naturally decreased by lower population density and transportation infrastructure in rural areas. | ||||
| Virus shedding rates λx,x∈{y,s,m}: ∂λxR0>0. | Policies should also aim at decreasing | ||||
| Proportion of the population with pre-acquired immunity τ : ∂τR0<0. | An increase in τ due to exposure to other infections appears to be a critical factor in curbing the disease spread. Although it cannot be advised that people should endure prior infections in order to be better prepared for future ones, it is worth noting that this is an intrinsic condition in Cameroon (and most Sub-Saharan African countries), and quite the opposite in the U.S. (and in most developed countries). According to our model, more than 70% of Cameroon's COVID-19's expected susceptible population had already acquired immunity through some prior infections at the onset of the pandemic. Thus, only less than 30% of the already very young population of Cameroon were at risk of getting infected. This hypothesis would make a substantial difference about the disease severity when compared with a case of no pre-acquired immunity due to other infections, like in New York State where the entire population could be considered susceptible. | ||||
| Vaccination rate ν : ∂νR0<0. | A proper and efficient vaccination campaign results in decreased disease burden, and eventually to controlling the outbreak. High vaccination rate in New York State during the COVID-19 outbreak has proved to be efficient in curbing the disease spread to a level that is somewhat under control. However, extremely low vaccination rates in some African countries (e.g. Cameroon) have been a source of concern for international health institutions such as WHO, CDC Africa, and the UN. As the pandemic is getting under control, it appears that those countries, where vaccination rates were very low despite efforts by their various governments to incite the population, have reported significantly lower COVID-19 fatalities than most developed countries. This observation suggests that there are intrinsic factors in each country that should be taken into account when designing global health policies. | ||||
| Virus elimination rate μ~C=δC+μCN: ∂μ~CR0<0. | Clearing the virus from the environment through cleaning and large-scale sanitization protocol is another means of controlling the disease spread. The COVID-19 virions evaporate faster in countries with warm temperatures and where people spend most times outdoors (e.g. Cameroon) than in regions of the world where people spend most times indoors due to cold winters (e.g. New York State). This could also be a factor that explains the unequal effects of COVID-19 in Cameroon versus New York State. | ||||
In designing and adopting effective treatment and control strategies, we advise policy makers to consider the following model parameters:
4. Numerical simulations of and the ‘burden ratio’
Throughout the COVID-19 pandemic, critics have argued that one possible reason for the relatively low disease severity in some developing countries than most developed countries is the quality of data reporting in these developing countries. We note that effective reporting of disease cases could be challenging due to a lack of resources. However, the vaccination rate is a relatively easy-to-measure parameter since it suffices to count the number of vaccines administered. In this section, we measure the disease severity in Cameroon, relative to New York State, as a function of some critical parameters. To do this, we compute the corresponding value of for Cameroon and New York State as we vary some values in the parameter set Ω, including the vaccination rate ν, within the disease timeframe T. Since both locations had different peaks at different times throughout the pandemic, we focus our work around 1.5 years after the first COVID-19 case was reported (vaccination in the U.S. began on 14 December 2020 [Citation44], one year after the first disease case was reported in the world), when vaccination was duly in effect and with measurable coverage. We take, as in Figure ,
Our simulations in Figure (a) of
in Cameroon, as we vary
and τ, confirm that increasing the contact rate is detrimental to the disease control (
increases) while increasing ν or τ results in decreased outbreak severity (
decreases). Similar results are obtained when we simulate
in New York State as
and τ are varied.
To measure the unequal effect of COVID-19 severity in Cameroon relative to New York State, we define the ‘burden ratio’ as follows:
(5)
(5) The
(or
for short) measures the severity of the disease outbreak in Cameroon over the time period
as we vary the values of the parameters in the set
, relative to the control case disease severity in New York State for a given set of parameter values over the time period
. If the
, then the disease is eventually more severe in the control case New York State than in Cameroon. However, if the
, then the disease is eventually more severe in Cameroon than in the control case New York State.
Figure 4. Values of in Cameroon and
relative to New York State. (a)
increases with β and decreases with ν and τ. (b)
decreases exponentially with
when
, and
when
. The dashed line represents
. All other parameters are listed in Table . (a)
in Cameroon and (b)
: COVID-19 severity in Cameroon relative to New York State.
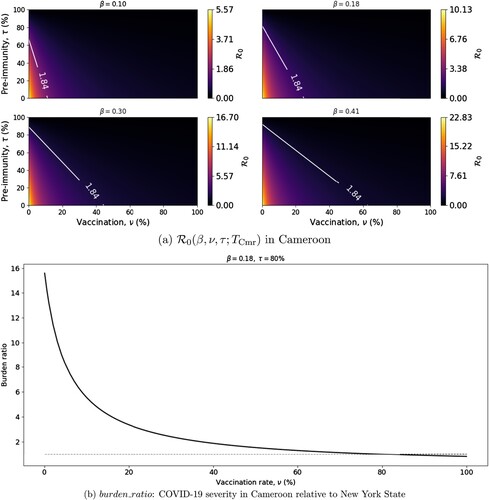
In order to investigate the effect of vaccination in Cameroon on the burden ratio relative to the disease severity in New York State as in Figure , we plot, in Figure (b), the as we vary the vaccination rate (ν) in Cameroon. We see that the
decreases exponentially, with a
when no vaccination is provided and a
when the vaccination rate in Cameroon exceeds 80%.
5. Conclusion
Data-driven COVID-19 mathematical models of Cameroon in Sub-Saharan Africa and New York State in the U.S.A. are introduced. These models are then used to gain insights into the low reported cases of COVID-19 infections in Sub-Saharan Africa versus the high reported cases in most developed countries. The parameters of the Cameroon model are fitted using the following well-known epidemiological factors of Sub-Saharan Africa: warmer climates, younger age distribution, lower contact rate, outdoor life styles, strong immune systems, early and strong COVID-19 non-pharmaceutical interventions, and low vaccination rates. Also, the parameters of the New York State model are fitted using the following factors of United States: colder climates, older age distribution, higher contact rate, non-outdoor life styles, less strong immune systems, non-uniform non-pharmaceutical interventions, and higher vaccination rates.
As a result, our fitted Cameroon model captured the low reported cases of COVID-19 infections in Cameroon from 17 June 2021 to 25 September 2021, and the fitted New York State model captured the corresponding high reported cases in New York State from 17 June 2021 to 16 August 2021. These model results show that limited COVID-19 testing capacity, weak health systems and under-reporting of COVID-19 cases are not the only explanations for the low reported cases of COVID-19 infections in Sub-Saharan Africa.
The ongoing pandemic was somewhat under control in New York State while it was increasing in Cameroon in the time interval, 17 June 2021 to 25 September 2021 (Figure ). Furthermore, the vaccination rates for New York State and Cameroon at that time were about 50% and 3%, respectively. Consequently, using the actual data within the first outbreak of COVID-19 in Cameroon, 17 June 2021 to 25 September 2021, we obtained that in Cameroon while
in New York State.
Using parameter sensitivity analysis, we illustrated that the contact rate of susceptible humans with the SARS-CoV-2 virus and the shedding rates of the virus
are the most positively correlated model parameters (Figure ). Due to the high rate of self-medication in Cameroon, the shedding rate of people who practice self-medication
is more positively correlated than that of those who do not practice self-medication in Cameroon
. However, in New York State, due to its larger number of seniors and smaller number of people who practice self-medication, the shedding rate of seniors is more positively correlated than those of the others. In both Cameroon and New York State, the vaccination rate
is negatively correlated, and the removal rate of those who practice self-medication
is the most negatively correlated of the removal rates.
Using differential analysis of the basic reproduction number, , we identified the following controllable model parameters for designing efficient COVID-19 treatment and control strategies:
Mindful of the fact that data on vaccination rates in Cameroon and other Sub-Saharan African countries are more reliable than the number of COVID-19 infections and deaths, we introduced the ‘
’ function and used it to evaluate COVID-19 severity in Cameroon versus its severity in New York State as the vaccination rate in Cameroon is varied. We summarized our results in Figure (b). In particular, we obtained that increasing the vaccination rate to more than 80% in Cameroon could decrease COVID-19 outbreak severity to below the disease control case in New York State. However, maintaining the vaccination rate in Cameroon as low as nearly 0% would eventually make the disease outbreaks approximately 16 times more severe in Cameroon than in the control case of New York State.
The model has some limitations:
The current formulation of the
We did not include considerations of waning of infection-induced immunity which arises naturally, over time, after recovery.
Our COVID-19 models for both Cameroon and New York State do not account for human genetic factors that may cause pre-acquired immunity to wane [Citation46] in the course of the disease outbreak, thus increasing the number of susceptible individuals.
Most existing compartmental SIR-type models of COVID-19 assume human–human transmission route [Citation3,Citation19]. Although research is still ongoing to better understand the spread of SARS-Cov-2, the virus is reported to be transmitted mainly between people who are in relatively close contact with each other, with an infected person releasing the virus through a cough, sneeze, speech, song, or breath [Citation50]. When compared with diseases such as HIV [Citation9,Citation18] and Ebola [Citation36,Citation40], which are ‘strictly’ human–human transmitted (by contact with contaminated blood or body fluid), it is worth noting that environmental properties do matter in the case of SARS-CoV-2 transmission. For instance, a well-ventilated space would reduce the risk of transmission of the COVID-19 [Citation50]. Furthermore, While human–human transmission cannot explicitly account for the infection dynamics when the circulating viral load is influenced by environmental conditions, the conclusions of our model could be applied to a human–human transmission scenario by assuming that there are infinitely many circulating virions.
There are currently 54 countries in Africa. Using COVID-19 mathematical models of Sub-Saharan Africa that include genetic factors and spatial structure, and potentially that include both the human–human transmission and the human–virus transmission modes, to gain insights into the low COVID-19 burden in Sub-Saharan Africa, as well as suggestions for mitigation of future global pandemics, are interesting problems for future work.
Disclosure statement
No potential conflict of interest was reported by the author(s).
Additional information
Funding
References
- A. Adidja, Y. Boum, and P. Ongolo-Zogo, Cameroon: Doubt could mean vaccine doses expire, Nature 595(30) (2021), pp. 30–30. doi:10.1038/d41586-021-01784-4.
- A.D. Algarni, A. Ben Hamed, M. Hamdi, H. Elmannai, and S. Meshoul, Mathematical COVID-19 model with vaccination: A case study in Saudi Arabia, PeerJ Comput. Sci. 8 (2022), p. e959. doi:10.7717/peerj-cs.959.
- A. Atkeson, COVID-19: Epidemiological models, Annu. Rev. Financ. Econ. 15(1) (2023). doi:10.1146/annurev-financial-110821-020639.
- A. Baker, Why Africa's COVID-19 outbreak hasn't been as bad as everyone feared, TIME USA, LLC, 2020. Accessed July 2, 2023. Available at https://time.com/5919241/africa-covid-19-outbreak/.
- S. Basu, Computational characterization of inhaled droplet transport to the nasopharynx, Sci. Rep. 11 (2021), p. 6652. doi:10.1038/s41598-021-85765-7.
- C.W. Castillo-Garsow and C. Castillo-Chavez, A tour of the basic reproductive number and the next generation of researchers, in An Introduction to Undergraduate Research in Computational and Mathematical Biology, 2020 Feb 18, pp. 87–124. doi:10.1007/978-3-030-33645-5_2.
- Center for Disease Control and Prevention, COVID-19 overview and infection prevention and control priorities in non-U.S. healthcare settings summary of changes: ITF IPC COVID-19 overview and infection prevention and control priorities in non-U.S. healthcare settings webpage, CDC COVID-19, 2021. Accessed July 5, 2023. Available at https://www.cdc.gov/coronavirus/2019-ncov/hcp/non-us-settings/overview/index.html.
- Center for Disease Control and Prevention, COVID-19 risks and vaccine information for older adults, 2023. Available at https://www.cdc.gov/aging/covid19/covid19-older-adults.html.
- Centers for Disease Control and Prevention, HIV transmission, 2020. Accessed July 8, 2023. Available at https://www.cdc.gov/hiv/basics/transmission.html.
- Center for Disease Control and Prevention, Monitoring COVID-19 cases, hospitalizations, and deaths by vaccination status: COVID-19 infection after vaccination, CDC COVID-19, 2023. Accessed July 5, 2023. Available at https://www.cdc.gov/coronavirus/2019-ncov/vaccines/effectiveness/monitoring.html.
- Center for Disease Control and Prevention, What is COVID-19 reinfection? CDC COVID-19, 2023. Accessed July 7, 2023. Available at https://www.cdc.gov/coronavirus/2019-ncov/your-health/reinfection.html#: :text=As%20the%20virus%20evolves%2C%20new,infection%2C%20although%20this%20is%20rare.
- Central Intelligence Agency, Cameroon, The World Factbook, 2023. Accessed July 2. Available at https://www.cia.gov/the-world-factbook/countries/cameroon/.
- K. Choi, H. Choi, and B. Kahng, COVID-19 epidemic under the K-quarantine model: Network approach, Chaos Solitons Fract. 157 (2022), p. 111904. doi:10.1016/j.chaos.2022.111904.
- R. Dhand and J. Li, Coughs and sneezes: Their role in transmission of respiratory viral infections, including SARS-CoV-2, Am. J. Respir. Crit. Care Med. 202(5) (2020), pp. 651–659. doi:10.1164/rccm.202004-1263PP.
- S. Drożdżal, J. Rosik, K. Lechowicz, F. Machaj, B. Szostak, J. Przybyciński, S. Lorzadeh, K. Kotfis, S. Ghavami, and M.J. Łos, An update on drugs with therapeutic potential for SARS-CoV-2 (COVID-19) treatment, Drug. Resist. Updat. 59 (2021), p. 100794. doi:10.1016/j.drup.2021.100794.
- E.F. Fedoung, A.B. Biwole, C.F. Nyangono Biyegue, M.N. Tounkam, P.A. Ntonga, V.P. Nguiamba, D.M. Essono, P. Forbi Funwi, C. Tonga, G.M. Nguenang, and V. Kemeuze, A review of Cameroonian medicinal plants with potentials for the management of the COVID-19 pandemic, Adv. Tradit. Med. (ADTM) 26 (2021), pp. 1–26.
- B. Hansen and N. Mygind, How often do normal persons sneeze and blow the nose? Rhinology 40(1) (2002), pp. 10–12.
- Hiv gov (n/d), How do you get or transmit HIV?, 2022. Accessed July 8, 2023. Available at https://www.hiv.gov/hiv-basics/overview/about-hiv-and-aids/how-is-hiv-transmitted.
- V. Iranzo and S. Pérez-González, Epidemiological models and COVID-19: A comparative view, Hist. Philos. Life Sci. 43(3) (2021), p. 104. doi:10.1007/s40656-021-00457-9.
- S. Khajanchi and K. Sarkar, Forecasting the daily and cumulative number of cases for the COVID-19 pandemic in India, Chaos 30(7) (2020), p. 071101. doi:10.1063/5.0016240.
- S. Khajanchi, S. Bera, and T.K. Roy, Mathematical analysis of the global dynamics of a HTLV-I infection model, considering the role of cytotoxic T-lymphocytes, Math. Comput. Simul. 180 (2021), pp. 354–378. doi:10.1016/j.matcom.2020.09.009.
- M.E. Kindzeka, Cameroon says workers reject COVID-19 vaccines, Voice of America News, November 18, 2021. Available at https://www.voanews.com/a/cameroon-says-workers-reject-covid-19-vaccines/6318189.html.
- D.E. Kirschner, Uncertainty and sensitivity functions and implementation, University of Michigan, 2007–2008. Available at http://malthus.micro.med.umich.edu/lab/usadata/.
- K. Kombaté, J.N. Técléssou, B. Saka, A.S. Akakpo, K.O. Tchangai, A. Mouhari-Toure, G. Mahamadou, W. Gnassingbé, A. Abilogun-Chokki, and P. Pitché, Prevalence and factors associated with self-Medication in dermatology in Togo, Dermatol Res. Pract. 2017 (2017), p. 1–5. ID 7521831.
- J.D. Kong, R.F. Tchuendom, S.A. Adeleye, J.F. David, F.S. Admasu, E.A. Bakare, and N. Siewe, SARS-CoV-2 and self-medication in Cameroon: A mathematical model, J. Biol. Dyn. 15(1) (2021), pp. 137–150. doi:10.1080/17513758.2021.1883130.
- B.U. Lee, Minimum sizes of respiratory particles carrying SARS-CoV-2 and the possibility of aerosol generation, Int. J. Environ. Res. Public Health 18(22) (2021), pp. 1–8. doi:10.3390/ijerph17196960.
- Q. Li, X. Guan, P. Wu, X. Wang, L. Zhou, Y. Tong, R. Ren, K.S. Leung, E.H. Lau, J.Y. Wong, and X.Xing, Early transmission dynamics in Wuhan, China, of novel coronavirus-Infected pneumonia, New Eng. J. Med. 382 (2020), pp. 1199–1207.
- A. Liveris, M.E. Stone Jr, H. Markel, G. Agriantonis, M. Bukur, S. Melton, V. Roudnitsky, E. Chao, S.H. Reddy, S.H. Teperman, and J.A. Meltzer, When New York city was the COVID-19 pandemic epicenter: The impact on trauma care, J. Trauma. Acute Care Surg. 93(2) (2022), pp. 247–255. doi:10.1097/TA.0000000000003460.
- S. Marino, I.B. Hogue, C.J. Ray, and D.E. Kirschner, A methodology for performing global uncertainty and sensitivity analysis in systems biology, J. Theor. Biol. 254 (2008), pp. 178–196.
- M.J. Matson, C.K. Yinda, S.N. Seifert, T. Bushmaker, R.J. Fischer, N. van Doremalen, J.O.Lloyd-Smith, and V.J. Munster, Effect of environmental conditions on SARS-CoV-2 stability in human nasal mucus and sputum, Emerg. Infec. Dis. 26(9) (2020), pp. 2276–2278. doi:10.3201/eid2609.202267.
- A.L. Mueller, M.S. McNamara, and D.A. Sinclair, Why does COVID-19 disproportionately affect older people? Aging (Albany NY) 12(10) (2020), pp. 9959–9981.
- National Oceanic and Atmospheric Administration, U.S. climate normals, National Centers for Environmental Information, 2021. Accessed December 24. Available at https://www.ncei.noaa.gov/products/land-based-stat/us-climate-normals.
- New York State Department of Health, New York State statewide COVID-19 testing, 2021. Accessed December 22. Available at http://malthus.micro.med.umich.edu/lab/usadata/.
- S. Nourridine, M.I. Teboh-Ewungkem, and G.A. Ngwa, A mathematical model of the population dynamics of disease-transmitting vectors with spatial consideration, J. Biol. Dyn. 5(4) (2011), pp. 335–365. doi:10.1080/17513758.2010.508540.
- R.K. Rai, S. Khajanchi, P.K. Tiwari, E. Venturino, and A.K. Misra, Impact of social media advertisements on the transmission dynamics of COVID-19 pandemic in India, J. Appl. Math. Comput.68(1) (2022), pp. 19–44. doi:10.1007/s12190-021-01507-y.
- S. Rewar and D. Mirdha, Transmission of Ebola virus disease: An overview, Ann. Glob. Health 80(6) (2014), pp. 444–451. doi:10.1016/j.aogh.2015.02.005.
- H. Ritchie, E. Mathieu, L. Rodés-Guirao, C. Appel, C. Giattino, E. Ortiz-Ospina, J. Hasell, B.Macdonald, D. Beltekian, and M. Roser, Coronavirus pandemic (COVID-19), Our World in Data, 2020. Available at https://ourworldindata.org/coronavirus.
- K. Sarkar, J. Mondal, and S. Khajanchi, How do the contaminated environment influence the transmission dynamics of COVID-19 pandemic? Eur. Phys. J. Spec. Top. 231(18–20) (2022), pp. 3697–3716. doi:10.1140/epjs/s11734-022-00648-w.
- N. Siewe and A.A. Yakubu, Hybrid discrete-time-continuous-time models and a SARS CoV-2 mystery: Sub-Saharan Africa's low SARS CoV-2 disease burden, J. Math. Biol. 86(6) (2023), p. 91. doi:10.1007/s00285-023-01923-7.
- N. Siewe, S. Lenhart, and A.A. Yakubu, Ebola outbreaks and international travel restrictions: Case studies of central and West Africa regions, J. Biol. Syst. 28(02) (2020), pp. 431–452. doi:10.1142/S0218339020400070.
- V. Stadnytskyi, C.E. Bax, A. Bax, and P. Anfinrud, The airborne lifetime of small speech droplets and their potential importance in SARS-CoV-2 transmission, Proc. Nat. Ac. Sci. 117(22) (2020), pp. 11875–11877. doi:10.1073/pnas.2006874117.
- P.K. Tiwari, R.K. Rai, S. Khajanchi, R.K. Gupta, and A.K. Misra, Dynamics of coronavirus pandemic: Effects of community awareness and global information campaigns, Eur. Phys. J. Plus 136(10) (2021), p. 994. doi:10.1140/epjp/s13360-021-01997-6.
- S.F. Tsao, H. Chen, T. Tisseverasinghe, Y. Yang, L. Li, and Z.A. Butt, What social media told us in the time of COVID-19: A scoping review, Lancet Digit. Health 3(3) (2021), pp. e175–e194. doi:10.1016/S2589-7500(20)30315-0.
- U S Department of Health and Human Services, COVID-19 vaccines, Assistant Secretary for Public Affairs (ASPA), 2022. Accessed July 19, 2023. Available at https://www.hhs.gov/coronavirus/covid-19-vaccines/index.html#: :text=During%20the%20COVID%2D19%20pandemic,began%20on%20December%2014%2C%202020.
- P. van den Driessche, Reproduction numbers of infectious disease models, Infect. Dis. Model. 2(3) (2017), pp. 288–303. doi:10.1016/j.idm.2017.06.002.
- C.I. van der Made, M.G. Netea, F.L. van der Veerdonk, and A. Hoischen, Clinical implications of host genetic variation and susceptibility to severe or critical COVID-19, Genome. Med. 14(1) (2022), p. 96. doi:10.1186/s13073-022-01100-3.
- J. Wang, Y.C. Chan, R. Niu, E.W.M. Wong, and M.A. van Wyk, Modeling the impact of vaccination on COVID-19 and its delta and omicron variants, Viruses 14(7) (2022), p. 1482. doi:10.3390/v14071482.
- WHO-China, Report of the WHO-China joint mission on coronavirus disease 2019 (COVID-19), WHO382 (2020), pp. 1199–1207.
- WMO, World Weather Information Service: Official forecast – Cameroon, World Meterological Organization, 2021. Available at www.worldweather.wmo.int.
- World Health Organization, Coronavirus disease (COVID-19): How is it transmitted?, 2021. Accessed July 8, 2023. Available at https://www.who.int/news-room/questions-and-answers/item/coronavirus-disease-covid-19-how-is-it-transmitted.
- Worldometer, COVID-19 corona virus pandemic, Worldometer, 2023. Accessed July 4. Available at https://www.worldometer.info/coronavirus.
- N. Yousaf, W. Monteiro, S. Matos, S.S. Birring, and I.D. Pavord, Cough frequency in health and disease, Eur. Resp. J. 41 (2013), pp. 241–243. doi:10.1183/09031936.00089312.
- Y. Yuan, B. Jiao, L. Qu, D. Yang, and R. Liu, The development of COVID-19 treatment, Front. Immunol. 14 (2023), p. 1125246. doi:10.3389/fimmu.2023.1125246.
Appendix
Computing the basic reproduction number
The basic reproduction number, denoted by, , is one of the most crucial quantities in infectious disease dynamics, as
measures how contagious a disease is. For
, the disease is expected to stop spreading. But, for
an infected person can infect, on average, one person; the spread of the disease is then stable. However, if
, an infected person can infect, on average, more than one person. Hence, the disease can spread and become endemic. Many studies have investigated the importance of this quantity in the context of an infectious disease, with [Citation45] providing a succinct review of various techniques. Quantities analogous to the basic reproduction number have also being introduced and studies in within-host modelling [Citation21], disease vector dynamics [Citation34] among others.
Disease-free equilibrium
We compute the steady-state of our system of equations when there is no disease. That is, we set right-hand-sides of Equation (Equation2(2)
(2) ) to 0 and solve for the model variables when
and C=0. Thus, we get the following disease-free equilibrium:
(A1)
(A1)
Next generation matrix method for computing
The following definitions are borrowed from [Citation6]:
Definition A.1
The next generation matrix is , where F is the Jacobian of the rates of flows from uninfected to infected classes evaluated at the disease-free equilibrium, and T is the Jacobian of the rates of all other flows to and from infected classes evalauated at the disease-free equilibrium (EquationA1
(A1)
(A1) ).
Definition A.2
The basic reproduction number () is the spectral radius (largest eigenvalue) of the next generation matrix:
.
where
with