
 ?Mathematical formulae have been encoded as MathML and are displayed in this HTML version using MathJax in order to improve their display. Uncheck the box to turn MathJax off. This feature requires Javascript. Click on a formula to zoom.
Abstract
The growth rate of a population serves as a measure of its Darwinian fitness, while its sensitivity indicates the intensity of selection. Generally, the sensitivity of r decreases with age, resulting in an expected increase in population mortality over time. However, this does not hold true for many populations, especially those exhibiting negative senescence. Both evolutionary entropy and its sensitivity serve as complementary measures for assessing fitness and the intensity of selection. The sensitivity of entropy is typically a convex function of age, implying stronger selection pressures in younger and older age groups. We show that the sensitivity functions of entropy exhibit a greater range of behaviours compared to those of the growth rate alone. This strongly suggests that evolutionary entropy offers an extremely valuable measure for capturing the diversity in aging patterns within populations, complementing what can be captured by the growth rate alone.
2020 Mathematics Subject Classifications:
1. Introduction
Senescence, the process of age-related deterioration in organisms, has been a topic of great interest in the field of theoretical biology and mathematical evolution [Citation1,Citation2,Citation12,Citation15,Citation16,Citation28]. One notable aspect of senescence is the gradual decline in fertility as individuals age. In the context of evolutionary biology, an individual's reproductive fitness plays a crucial role in determining their ability to pass on genetic material to subsequent generations. Fertility, defined as the capacity to reproduce, is a fundamental component of reproductive fitness. As organisms age, various physiological changes occur, leading to a decline in fertility.
The logarithm of the growth rate, also known as the Malthusian parameter [Citation8], was introduced to assess the Darwinian fitness of a population. It quantifies the reproductive success of a population based on its fertility and mortality life history parameters. Hamilton's groundbreaking 1966 paper [Citation16] had as a key assumption that fitness is equivalent to the Malthusian parameter in age-structured populations. However, it has since been shown that the growth rate alone fails to explain the variation in aging patterns observed in natural populations.
The sensitivity of the growth rat is, a concept introduced by Lloyd Demetrius in his 1969 paper [Citation7] in order to measure the intensity of natural selection, reflecting how fitness responds to changes in individual life histories within a population [Citation15]. The sensitivity of the growth rate is typically a decreasing function of age, suggesting that the fertility and mortality rates of a population should decrease over time. However, numerous populations deviate from this trend [Citation15,Citation19], indicating that the real-world situation is considerably more complex and necessitates alternative analytical approaches.
Evolutionary entropy was subsequently introduced by Demetrius in his significant articles of 1974 [Citation8] and 1976 [Citation10]. Later on, Nathan Keyfitz popularized evolutionary entropy in his well known book [Citation20] crediting Demetrius as the originator of the concept.
Evolutionary entropy, also debated in the comprehensive survey [Citation13], functions as a supplementary metric of fitness, offering insights into the resilience of a population. Consequently, investigations into the sensitivity of evolutionary entropy, which evaluate its response to variations in age-specific fertility and mortality parameters, provide a quantitative assessment of the magnitude of natural selection. In contrast to the sensitivity of the growth rate, the sensitivity of evolutionary entropy typically exhibits a convex pattern across different age cohorts, displaying relatively lower values in younger age groups and progressively higher values in older populations.
There are thus two main evolutionary strategies the first one, known as the strategy of reproductive potential, aims to maximize fertility, while the other one, known as the strategy of evolutionary entropy, adapts reproduction to environmental conditions [Citation13]. This subject is rich and has deep consequences. In this paper, we address the demographic quantities related to these strategies. Almost all the species referred to in this paper suffer from senescence with some exceptions [Citation19,Citation27].
The trade-off theory of aging, proposed by Williams in the seminal work [Citation29], posits that resources allocated to reproduction come at the expense of maintenance and repair mechanisms within an organism. This trade-off creates a finite pool of resources available for both reproduction and somatic maintenance, ultimately leading to a decline in fertility and an increase in age-related degeneration. The loss of fertility is seen as a consequence of the reallocation of resources towards somatic maintenance, prolonging an individual's lifespan but diminishing reproductive potential.
Theoretical biology has provided valuable insights into the mechanisms underlying reproductive senescence. The seminal work by Vaupel et al. [Citation28] emphasized the importance of early-life reproductive investment in determining subsequent lifespan, suggesting that investment in reproduction early in life can accelerate the aging process, leading to a shorter reproductive lifespan.
In addition to fertility decline, the study of mortality plateaus is also relevant to understanding senescence [Citation23]. Demetrius [Citation11,Citation12] discussed the concept of mortality plateaus, where mortality rates reach a plateau during late adulthood, suggesting a deceleration in the aging process. He argued that mortality plateaus may emerge due to selective forces acting on late-life survival, leading to the maintenance of certain physiological functions and reduced vulnerability to age-related diseases.
Senescence and the loss of fertility have significant evolutionary implications. From an evolutionary standpoint, genes that promote early-life reproductive success may be favoured, even if they contribute to an accelerated decline in fertility later in life. This trade-off between early-life reproduction and longevity shapes the genetic composition of populations, as individuals with different reproductive strategies leave varying genetic legacies.
In order to better explain the diversity in evolutionary patterns among species and understand the variation in aging and survivorship trajectories of populations, we conducted an analysis comparing the senescence of 48 species, previously studied in [Citation19] where ageing, age patterns of mortality and reproduction are compared for species across the tree of life. For these species, we examined and contrasted the sensitivity of the growth rate with that of evolutionary entropy.
We conclude this section with a note on the bibliography pertaining to the subject of this article, along with some classical references. In the seminal paper by Medawar [Citation24], the concept of senescence is introduced, and its evolutionary implications are discussed. Despite predating the era of mathematical modelling, it remains a foundational work on the topic. Charlesworth [Citation3] offers a comprehensive overview of evolutionary processes in age-structured populations, encompassing mathematical models of senescence and the impacts of age-dependent selection.
Kirkwood's landmark paper [Citation22] introduces the concept of the disposable soma theory of aging. While not primarily focussed on mathematical models, it lays the foundation for understanding senescence in the context of resource allocation and evolutionary trade-offs, and the book by the same author [Citation3] further explores the mentioned relationships.
The paper [Citation17] examines the genetic factors influencing the evolution of senescence in Drosophila. It was complemented in 2015 in [Citation4], where changes in the fitness of Drosophila are studied.
The work [Citation25] addresses the challenge of quantifying the rate of aging in biological populations. It proposes mathematical approaches to estimate aging rates based on mortality data.
Article [Citation28] explores the effects of heterogeneity in individual senescence rates on population dynamics, providing insights into the variability of aging within populations.
The review article [Citation26] addresses unsolved problems regarding senescence and discusses the literature about the subject.
The recent paper [Citation6] delves into perplexities surrounding the subject of ageing and senescence, which persist to this day. It explores various hypotheses within this intriguing field of research.
The work of Stephen Kirkland and Michael Neumann, as compiled in their book [Citation21], provides us with a highly precise technical framework for addressing the issues pertaining to the sensitivity of eigenvalues with respect to the entries of a wide range of matrices. This encompasses all discrete matrix models commonly employed in the field of population dynamics.
The manuscript's organization is as follows: Section 2 provides a comprehensive examination of the formal mathematical definitions of growth rate, evolutionary entropy, and reproductive potential within the framework of Leslie age-structured models. In Section 3, we conduct an extensive analysis of the sensitivities of the growth rate and evolutionary entropy for the 48 species investigated in the referenced study [Citation19]. Lastly, in Section 4, we contend that our findings demonstrate the indispensability of considering both parameters and their respective sensitivities to acquire a profound comprehension of the intricacy inherent in the assortment of aging patterns observed in the natural world.
2. Background
There exist several matrix models that describe the dynamics of stage-structured populations, with the Leslie and Lefkovitch models being the most significant. These models enable us to determine the growth rate, sensitivity, and elasticity of stage-structured populations, making them widely used in population studies. For the purpose of this paper, we will exclusively focus on Leslie models since most other concepts in population dynamics are time-dependent and derived from them. The following section is based on [Citation9,Citation14,Citation15].
Let be the vector that characterizes an age-structured population at time t, where
represents the number of individuals in age class j. The number of individuals in the population at time t+1 is given by the projection matrix:
(1)
(1) We assume that matrix A is primitive. According to the Perron-Frobenius theorem [Citation5], A possesses a positive, algebraically simple, and strictly dominant eigenvalue λ, corresponding to positive right and left eigenvectors u and v. The eigenvalue λ is known as the Perron value of matrix A and is the unique real root of the characteristic Euler-Lotka equation:
(2)
(2) where
represents the survivorship of the population, i.e. the probability of an individual surviving up to age class j, which is given by
(3)
(3) This equation specifies that
equals 1 for the first age class
, indicating that all individuals in the initial age class survive. For subsequent age classes
, the survivorship
is the product of the survival probabilities
, representing the probability of an individual surviving up to each preceding age class.
We denote by λ the multiplicative growth rate of the population, or, for short, the growth rate of the population.
The logarithm of the growth rate of a population is defined as the rate of increase in the total population numbers
. It is then easily seen that
(4)
(4) Thus, for large values of t, we can approximate the population size as
. It then follows that
(5)
(5) The Malthusian parameter r thus follows from the identity
(6)
(6) The Malthusian parameter r of a population has a straightforward interpretation: if r is positive
, the population size is increasing; if r is negative
, the population size is decreasing; and if r is zero
, the population is stationary.
2.1. The evolutionary entropy
Evolutionary entropy, represented by H, quantifies the rate at which a population reverts to its steady-state condition following a random perturbation. It emerges as a consequence of the stochastic nature of demographic processes. By denoting as the probability that the mother of a randomly selected newborn belongs to age class j, which can be computed analytically using the Leslie model, we can express evolutionary entropy as:
(7)
(7) Let us define the demographic entropy function S as:
(8)
(8) S represents the uncertainty in the age of the mother of a randomly chosen newborn. Populations with higher values of S exhibit broader reproductive spans, fewer offspring, and a later age of sexual maturity. Conversely, populations with lower values of S have narrower reproductive spans, a larger number of offspring, and an earlier age of sexual maturity.
The mean lifespan of a population and the net reproductive value
are defined as
The generation time T and the mean generation time
are defined as
for stationary populations
and we have
.
The evolutionary entropy H is connected to the demographic entropy S by the identity
(9)
(9) where T is a measure of the generation time of a population, representing the average age of mothers at the birth of their offspring.
H serves as a measure of the demographic stability of a population, indicating the rate at which fluctuations in population numbers decay. Additionally, it reflects the effective rate of increase in finite populations, which corresponds to the asymptotic rate of increase in the number of typical genealogies generated by an individual within a population.
2.2. The reproductive potential
The reproductive potential of a population, Φ, is the mean of the different contributions of age classes to r, and is given by
(10)
(10) where
is the age-specific net reproductive function, the mean number of offspring that a mother is expected to birth after class j
, such that
(11)
(11) From (Equation7
(7)
(7) ) and (Equation10
(10)
(10) ), we arrive at the relationship between Φ and H:
(12)
(12) When
and H coincide. However, this does not happen for most natural populations: in general, H and r are distinct.
Evolutionary entropy is central to directionality theory [Citation13]. The latter describes evolutionary patterns which relate long-term changes in evolutionary entropy with the ecological constraints as defined by the equilibrium – opportunistic condition.
Equilibrium species are characterized by . This implies that r<H, so their growth is bounded by entropy. Equilibrium species experience a unidirectional increase in entropy. They also have large values of S. In environmental conditions which induce a unidirectional increase in entropy, by natural selection, survival rates will increase at later ages comparatively to intermediate ages, and mortality rates will plateau at extreme ages.
Opportunistic species are characterized by . Thus, r>H, so their growth is unconstrained. Larger populations experience a unidirectional decrease in entropy while smaller populations experience a random, nondirectional change in entropy. By natural selection, in environmental conditions which induce a unidirectional decrease in entropy, survival rates will decrease at later ages (mortality rates will increase exponentially with age) in larger populations, and experience random and nondirectional changes in smaller populations. S is small for opportunistic species.
2.3. Comparison between growth rate and evolutionary entropy
Sensitivity studies of r and H measure how each responds to changes in the age-specific fertility, , and mortality,
, parameters of a population. The larger the sensitivity to a certain parameter, the bigger its contribution is to r or H.
The sensitivity of r is a monotonically decreasing function of age whenever r is positive because in growing populations changes in
have a larger effect on r at younger ages.
The sensitivity of H is a convex function of age, reflecting the fact that the demographic stability of a population is constrained by the geometric shape of , so it is more responsive to changes in the
and
parameters at younger and later ages, where
is smaller, comparatively to at intermediate ages, where
is larger.
The Malthusian parameter r determines fitness in populations of infinite size while the entropy H determines fitness in populations of finite size. If fitness is determined by r, then the intensity of natural selection is stronger in earlier age classes in growing populations. If fitness is determined by H, though, then it is a convex function of age; consequently, the intensity of selection is stronger in younger and older classes, and milder in intermediate classes.
3. Population dynamics: a comparative analysis of 48 species
3.1. Methodology
Jones et al. [Citation19] conducted a study on the fertility, mortality, and survivorship trajectories of 48 species across different taxa. They analyzed the data from the mean age of reproductive maturity up to a terminal age when only 5% of the adults survived. Based on the relative mortality at the terminal age, the species were classified on a continuum of senescence, ranging from strong deterioration with age (observed in human populations) to negative senescence (common in large tree populations).
To further explore the variation in survivorship curves among species, we obtained several demographic properties (Table ), as well as the sensitivity of the Malthusian parameter r and of the evolutionary entropy H (Figures ) of all 48 populations. As in [Citation19], the species were ordered according to their senescence level, from the most senescent, represented by Japanese homo sapiens, to the least senescent, represented by Avicennia marina.
Figure 1. Sensitivity of r (red) and H (blue) with respect to , left to right: H. sapiens (Japanese)
, H. sapiens (Swedish)
, L. rothschildi
, P. reticulata
, H. sapiens (hunter gatherers)
, and F. glacialoides
.
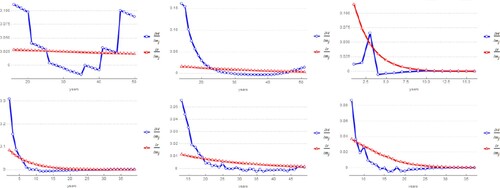
Figure 2. Sensitivity of r and H : O. orca
, D. longispina
, P. leo
, P. cynocephalus
, M. quadricornifera
and C. capreolus
.
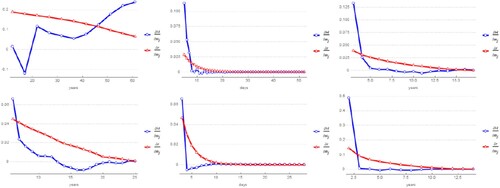
Figure 3. Sensitivity of r and H : C. elaphus
, C. elegans
, P. humanus
, P. troglodytes
, D. melanogaster
and R. rupicapra
.
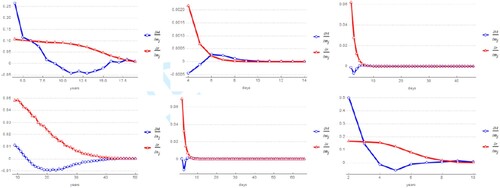
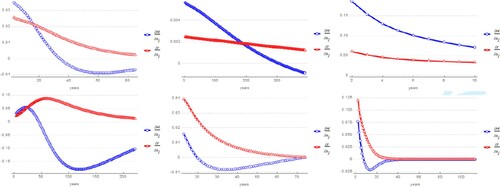
Figure 4. Sensitivity of r and H : O. aries
, C. capitata
, A. melbus
, C. olor
, M. oeconomus
and H. cumulicola
.
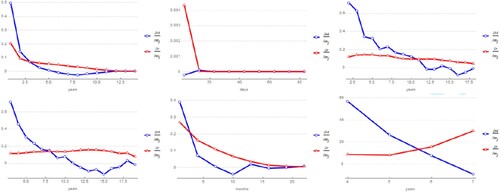
Figure 5. Sensitivity of r and H : P. sylvestris
, C. johnsoni
, M. flaviventris
, A. nisus
, C. flava
and A. marmorata
.
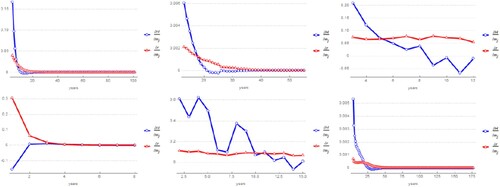
Figure 6. Sensitivity of r and H : G. orbignyan
, L. vivipara
, U. minor
, B. pyrenaica
, F. albicollis
and R. maximum
.
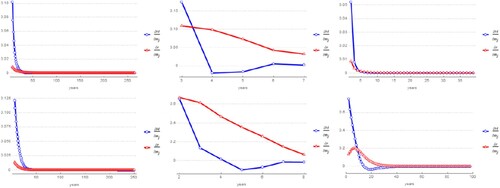
Figure 7. Sensitivity of r and H : P. major
, H. magnipapillata
, P. longicarpus
, A. acanthocarpa
, H. rufescens
and R. aurora
.
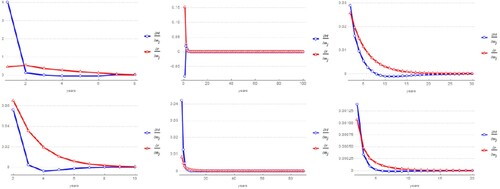
Table 1. Population dynamics: comparison of and H of 48 species.
Figures – illustrate the sensitivity of r and H with respect to age-specific fertility , while Figures – show the sensitivity of r and H with respect to age-specific mortality
. The corresponding values of r and H are displayed below the figures. The analysis focussed on the sensitivity of the reproductive classes only. For species with a total of
, the sensitivity of r and H was obtained from reproductive maturity until either the population converged to within 1% of its quasi-stationary distribution or the sensitivity of r and H with respect to both
and
converged. The calculations were performed using Mathematica, with the data available online in the supplementary [Citation18] material of [Citation19].
Figure 8. Sensitivity of r and H : P. clavata
, V. furcatum
, L. digitata
, Q. rugosa
, G. agassizii
and A. marina
.
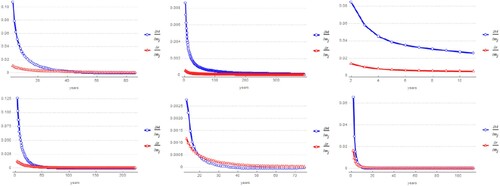
Figure 9. Sensitivity of r (red) and H (blue) with respect to , left to right: H. sapiens (Japanese)
, H. sapiens (Swedish)
, L. rothschildi
, P. reticulata
, H. sapiens (hunter gatherers)
, and F. glacialoides
.
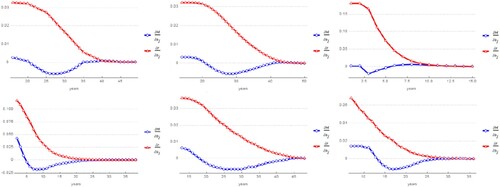
Figure 10. Sensitivity of r and H : O. orca
, D. longispina
, P. leo
, P. cynocephalus
, M. quadricornifera
and C. capreolus
.
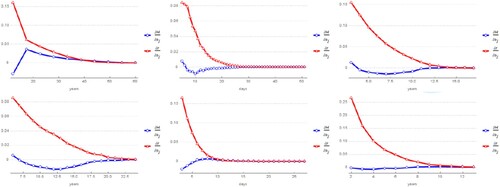
Figure 11. Sensitivity of r and H : C. elaphus
, C. elegans
, P. humanus
, P. troglodytes
, D. melanogaster
and R. rupicapra
.
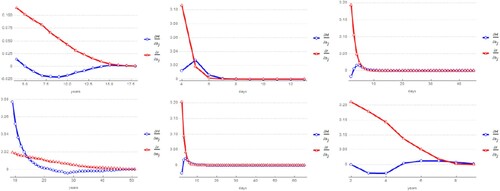
Figure 12. Sensitivity of r and H : O. aries
, C. capitata
, A. melbus
, C. olor
, M. oeconomus
and H. cumulicola
.
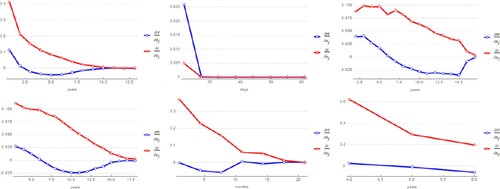
Figure 13. Sensitivity of r and H : P. sylvestris
, C. johnsoni
, M. flaviventris
, A. nisus
, C. flava
and A. marmorata
.
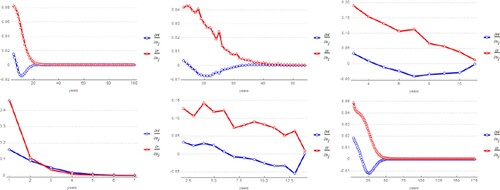
Figure 14. Sensitivity of r and H : G. orbignyan
, L. vivipara
, U. minor
, B. pyrenaica
, F. albicollis
and R. maximum
.
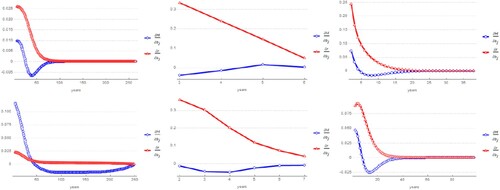
Figure 15. Sensitivity of r and H : P. major
, H. magnipapillata
, P. longicarpus
, A. acanthocarpa
, H. rufescens
and R. aurora
.
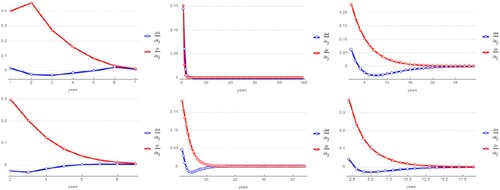
Figure 16. Sensitivity of r and H : P. clavata
, V. furcatum
, L. digitata
, Q. rugosa
, G. agassizii
and A. marina
.
3.2. Discussion of results
Figures – show that the sensitivity functions of r (in red) and H (in blue) differ in the early reproductive classes but generally approach a plateau when the age class increases. The shape of the sensitivity functions of H exhibits greater variation. The sensitivity of r tends to decrease with age, while the sensitivity of H is typically convex. Another distinction is that H appears to be more sensitive than r to changes in (blue curve above the red curve in Figures –), but less sensitive to changes in
(red curve above the blue curve in Figures –).
Opportunistic species (refer to Table ) display a pattern shared by only a few equilibrium species (such as L. rothschildi, O. orca, and R. maximum). In these species, the sensitivity of H with respect to and/or
initially increases in the early reproductive classes while the sensitivity of r decreases. Generally, the sensitivity of H is a convex function of age, so it should initially decrease in conjunction with the sensitivity of r before increasing in intermediate age classes, while the sensitivity of r continues to decline. However, opportunistic species deviate from this trend. This characteristic is particularly evident in the analysis of C. elegans (second plot in Figures and ).
4. Conclusions
Darwin's theory of natural selection provides a framework for understanding the process of evolution and the factors that contribute to the fitness of populations. While the logarithm of the growth rate or the Malthusian parameter (r) has traditionally been used as a measure of Darwinian fitness, the sensitivity of r allows for quantifying the intensity of selection. However, as observed in many populations with negative senescence [Citation15,Citation19], the mortality of a population does not necessarily increase with age, contradicting the expected pattern of decreasing sensitivity of r with age.
Evolutionary entropy (H) and its sensitivity offer complementary perspectives on fitness and the intensity of selection. The convex nature of the sensitivity of H with respect to age implies that the intensity of selection is stronger in younger and older age classes, reflecting the demographic stability constraints imposed by the age-specific net reproductive function. The greater variety observed in the sensitivity functions of H compared to r highlights the usefulness of evolutionary entropy as a measure for capturing the diversity in aging patterns across populations.
By considering both the growth rate and evolutionary entropy, we can gain a more comprehensive understanding of the dynamics of populations and their adaptive responses to changing environments. These measures provide valuable insights into the fitness and selective pressures acting on different age classes within a population, contributing to our understanding of the complexities of evolution and the diversity of aging patterns observed in nature.
Disclosure statement
No potential conflict of interest was reported by the author(s).
Additional information
Funding
References
- R.C. Brooks and M.G. Garratt, Life history evolution, reproduction, and the origins of sex-dependent aging and longevity, Ann. N. Y. Acad. Sci. 1389(1) (2017), pp. 92–107.
- H. Caswell, Extrinsic mortality and the evolution of senescence, Trends. Ecol. Evol. (Amst.) 22(4) (2007), pp. 173–174.
- B. Charlesworth, Evolution in Age-Structured Populations Vol. 2, Cambridge University Press, Cambridge, 1994.
- B. Charlesworth, Causes of natural variation in fitness: Evidence from studies of drosophila populations, Proc. Natl. Acad. Sci. 112(6) (2015), pp. 1662–1669.
- J.M. Cushing, An Introduction to Structured Population Dynamics, CBMS-NSF Regional Conference Series in Applied Mathematics. SIAM, Philadelphia, 1998.
- C. de Vries, M. Galipaud, and H. Kokko, Extrinsic mortality and senescence: A guide for the perplexed, Peer Comm. J. 3 (2023), Article ID e29.
- L. Demetrius, The sensitivity of population growth rate to pertubations in the life cycle components, Math. Biosci. 4(1-2) (1969), pp. 129–136.
- L. Demetrius, Demographic parameters and natural selection, Proc. Natl. Acad. Sci. 71(12) (1974), pp. 4645–4647.
- L. Demetrius, Natural selection and age-structured populations, Genetics 79(3) (1975), pp. 535–544.
- L. Demetrius, Measures of variability in age-structured populations, J. Theor. Biol. 63(2) (1976), pp. 397–404.
- L. Demetrius, Mortality plateaus and directionality theory, Proc. R. Soc. B: Biol. Sci. 268(1480) (2001), pp. 2029–2037.
- L. Demetrius, Of mice and men: When it comes to studying ageing and the means to slow it down, mice are not just small humans, EMBO Rep. 6(S1) (2005), pp. S39–S44.
- L.A. Demetrius, Boltzmann, Darwin and directionality theory, Phys. Rep. 530(1) (2013), pp. 1–85.
- L. Demetrius, V.M. Gundlach, and G. Ochs, Complexity and demographic stability in population models, Theor. Popul. Biol. 65 (2004), pp. 211–225. https://doi.org/10.1016/j.tpb.2003.12.002.
- L. Demetrius, V.M. Gundlach, and M. Ziehe, Darwinian fitness and the intensity of natural selection: Studies in sensitivity analysis, Theor. Popul. Biol. 249 (2007), pp. 641–653. https://doi.org/10.1016/j.jtbi.2007.08.016.
- W.D. Hamilton, The moulding of senescence by natural selection, J. Theor. Biol. 12(1) (1966), pp. 12–45.
- K.A. Hughes and B. Charlesworth, A genetic analysis of senescence in drosophila, Nature 367(6458) (1994), pp. 64–66.
- O.R. Jones, A. Scheuerlein, R. Salguero-Gómez, C.G. Camarda, R. Schaible, B.B. Casper, J.P. Dahlgren, J. Ehrlén, M.B. García, E.S. Menges, P.F. Quintana-Ascencio, H. Caswell, A. Baudisch, and J.W. Vaupel. Supplementary information, 2014. Accessed: 25/10/2022.
- O.R. Jones, A. Scheuerlein, R. Salguero-Gómez, C.G. Camarda, R. Schaible, B.B. Casper, J.P.Dahlgren, J. Ehrlén, M.B. García, E.S. Menges, P.F. Quintana-Ascencio, H. Caswell, A.Baudisch, and J.W. Vaupel, Diversity of ageing across the tree of life, Nature 505(7482) (2014), pp. 169–173. https://doi.org/10.1038/nature12789.
- N. Keyfitz, Applied Mathematical Demography, Wiley, Springer, NewYork, 1985.
- S.J. Kirkland and M. Neumann, Group Inverses of M-matrices and Their Applications, Applied Mathematics and Nonlinear Science Series, CRC Press, Chapman & Hall/CRC, Boca Raton, 2012.
- T.B.L. Kirkwood, Evolution of ageing, Nature 270(5635) (1977), pp. 301–304.
- J.J.E. Koopman, M.P. Rozing, A. Kramer, J.M. Abad, P. Finne, J.G. Heaf, A.J. Hoitsma, J.M.J. De Meester, R. Palsson, M. Postorino, P. Ravani, C. Wanner, K.J. Jager, D. van Bodegom, and R.G.J.Westendorp, Calculating the rate of senescence from mortality data: An analysis of data from the ERA-EDTA registry, J. Gerontol. Ser. A 71(4) (2015), pp. 468–474.
- P.B. Medawar, An Unsolved Problem of Biology, University College London, H. K. Lewis & Co., London, 1952.
- L. Partridge and N.H. Barton, On measuring the rate of ageing, Proc. R. Soc. B: Biol. Sci. 263(1375) (1996), pp. 1365–1371.
- M. Roper, P. Capdevila, and R. Salguero-Gómez, Senescence: Why and where selection gradients might not decline with age, Proc. R. Soc. B 288(1955) (2021), Article ID 20210851.
- R. Schaible, A. Scheuerlein, M.J. Dańko, J. Gampe, D.E. Martínez, and J.W. Vaupel, Constant mortality and fertility over age in hydra, Proc. Natl. Acad. Sci. 112(51) (2015), pp. 15701–15706.
- J.W. Vaupel, A. Baudisch, M. Dölling, D.A. Roach, and J. Gampe, The case for negative senescence, Theor. Popul. Biol. 65(4) (2004), pp. 339–351.
- G.C. Williams, Pleiotropy, natural selection, and the evolution of senescence, Evolution 11(4) (1957), pp. 398–411.