
 ?Mathematical formulae have been encoded as MathML and are displayed in this HTML version using MathJax in order to improve their display. Uncheck the box to turn MathJax off. This feature requires Javascript. Click on a formula to zoom.
Abstract
Leishmaniasis, an infectious disease, manifests itself mostly in two forms, cutaneous leishmaniasis (CL) and, a more severe and potentially deadly form, visceral leishmaniasis (VL). The current control strategy for leishmaniasis relies on chemotherapy drugs such as sodium antimony gluconate (SAG) and meglumine antimoniate (MA). However, all these chemotherapy compounds have poor efficacy, and they are associated with toxicity and other adverse effects, as well as drug resistance. While research in vaccine development for leishmaniasis is continuously progressing, no vaccine is currently available. However, some experimental vaccines such as LEISH-F1+MPL-SE (V) have demonstrated some efficacy when used as drugs for CL patients. In this paper we use a mathematical model to address the following question: To what extent vaccine shots can enhance the efficacy of standard chemotherapy treatment of leishmaniasis? Starting with standard MA treatment of leishmaniasis and combining it with three injections of V , we find, by Day 84, that efficacy increased from 29% to 65–91% depending on the amount of the vaccine. With two or just one injection of V , efficacy is still very high, but there is a definite resurgence of the disease by end-time.
1. Introduction
Leishmaniases are a group of diseases caused by protozoan obligate intracellular parasites from more than 20 Leishmania species. The parasites are transmitted to humans by a bite of an infected female sand fly, which injects into the body the flagellated form of the parasite, the promastigote. Promastigotes are endocytozed into phagocytic cells (macrophages) and quickly transform into amastigotes (non-flagellated Leishmania). The amastigotes then mature and multiply, and eventually cause the infected cells to burst.
The main two forms of the disease are cutaneous leishmaniasis (CL) and visceral leishmaniasis (VL). CL is the more common form of the disease, while VL is the more severe form of the disease. If not treated, VL is expected to cause death in more than 90% of the cases. Incidence of 0.7–1 million new cases of leishmaniasis occur annually, while 310 million people are vulnerable to infection.
The immune response to leishmaniasis is taken by CD4 and CD8
T cells. The T cells produce inflammatory cytokines that kill the intracellular parasites [Citation53]. But in most cases, the immune system is unable to resolve the disease on its own. Currently, the control strategy for leishmaniasis relies on pharmacological treatment. But only a handful of chemotherapeutic agents are in use, and each of the options has several limitations, such as adverse effects (e.g. cardiotoxicity), poor efficacy, and drug resistance [Citation73, Citation75, Citation86]. Over the last decades, only a few drugs have been approved, and currently, combinations of drugs are recommended by WHO.
Several vaccines have been developed to activate the immune system against the parasite in both CL and VL patients. Although work on vaccine development is continuously progressing [Citation64], no vaccine is currently available to prevent any form of the disease.
In this paper, we focus on Leishmania vaccine LEISH-F1+MPL-SE, a recombinant protein through genetically engineered-cells. LEISH-F1 acts as an antigen, and MPL-SE is an adjuvant [Citation90]. In clinical trials [Citation25, Citation65] it was shown that as immunotherapy LEISH-F1+MPL-SE confers benefits in CL and VL patients, and the benefits increase when used in combination with meglumine antimoniate, one of the antimony-carbohydrate complexes.
A review article [Citation23] suggests that chemotherapy along with immunotherapy can elicit a protective immune response and clear infection more effectively. More specifically, we consider the following question: To what extent can one of the experimental vaccines enhance the efficacy of chemotherapy treatment of leishmaniasis? In this paper, we address this question in a case where LEISH-F1+MPL-SE (as an immunotherapy drug) is combined with one of two pentavalent antimonial drugs: meglumine antimoniate (MA) and stibugluconate (also called sodium antimony gluconate (SAG)). Both drugs are first-line chemotherapy drugs for the treatment of leishmaniasis [Citation28, Citation37, Citation86]. Using a mathematical model, we evaluate the efficacy of various combinations of the vaccine with one of the two drugs. The model is based on an earlier mathematical model by Siewe et al. [Citation79] on the immune response to infection by Leishmania, which was extended in order to include the effects of the drugs.
2. Mathematical model
The model variables are listed in Table in units of g/cm. The immune system includes pro-inflammatory macrophages M1, anti-inflammatory macrophages M2, dendritic cells D, and T cells, which are taken to represent CD4
Th1 cells and CD8
T cells combined. Cytokines produced by the inflammatory immune cells are IL-2, IL-12, IFN-γ, TNF-α and nitric oxide (NO); IL-10 and TGF-β are produced by M2 macrophages. T cells are activated by dendritic cells presenting pieces of the parasites by MHC class I. T cells are also activated by IL-12, a process blocked by IL-10, and IL-2 increases the proliferation of T cells. IFN-γ is produced by T cells, TNF-α and NO are produced by macrophages, and macrophages kill the intracellular parasites. TNF-α mediates the polarization of M2 into M1 macrophages.
Table 1. List of variables of the model.
Macrophage polarization plays a role in leishmaniasis [Citation69]. TNF-α and IFN-γ induce polarization from M2 to M1, while IL-10 and TGF-β induce polarization from M1 to M2.
Meglumine antimoniate (A) enters macrophages and enhances their production of TNF-α and NO by M1 macrophages and IL-10 production by M2 macrophages [Citation34]. SAG (S) induces macrophages to produce NO [Citation37]; triggers MHC class I in dendritic cells, hence the production of IL-12 by the increased activities of M1 macrophages [Citation7, Citation31, Citation37], and stimulates T cells without antigen, i.e. by the production of IL-2 by T cells [Citation7, Citation37].
Leishmania vaccine LEISH-F1+MPL-SE (V) increases the production of IFN-γ by the CD4 T cells (both in patients and in healthy individuals) [Citation14, Citation16, Citation90], and thereby increases the activity of M1 macrophages in their production of TNF-α [Citation7]; it also increases the IL-2 production by CD4
T cells [Citation16].
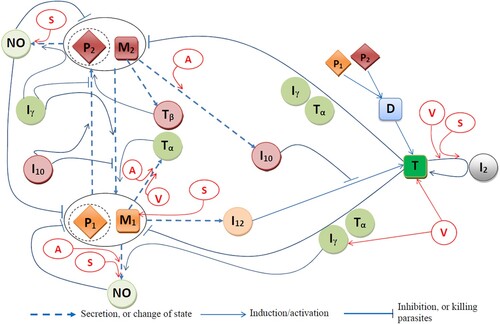
Figure is a network of interactions among the model variables; the parasites within M1 and M2 macrophages are denoted by and
, respectively. The mathematical model is based on Figure , and it is represented by a system of ODEs. The equations are given below with full explanations and references.
Figure 1. Effects of vaccine LEISH-F1+MPL-SE (V), and drugs sodium antimony gluconate (SAG, S) and meglumine antimoniate (MA, A) on the immune response to Leishmania infection.
2.1. Equation for dendritic cells D
Dendritic cells are activated by ingesting parasites . We denote the average number of parasites in a bursting dendritic cell, or a macrophage, by N, and assume, as in [Citation79], that the mass of 150 parasites is equal to the mass of one macrophage. By the Michaelis-Menten law, the activation of D is proportional to
where we take the Michaelis-Menten parameter
such that
where
is the average bursting pressure of the parasites; hence
The density of dendritic cells satisfies the equation:
(1)
(1) where
is proportional to the density of inactive dendritic cells
. We assume, for simplicity, that the number of inactive dendritic cells remains constant during infection.
2.2. Equations for macrophages  and
and
In the sequel, we take the activation rate of cells by a cytokine X to be proportional to , and, the resistance to activation of cells, to be proportional to
. We take
to be the steady-state, or average, of X and refer to it as the half-saturation of X.
The dynamics of the density of is given by:
(2)
(2) The first term on the right-hand side is the recruitment of new macrophages from the host immune system. The second term on the right-hand side is the gain in
due to
-induced and
-induced transition from
to
[Citation6, Citation17, Citation50, Citation94], respectively. The third term is the loss of
due to the transition to
, a process stimulated by
and
[Citation32], and inhibited by
[Citation46, Citation59, Citation84]. The fourth term is the loss of
due to bursting [Citation9, Citation21, Citation38], modelled by the Hill dynamics, where
is the parasite pressure at the bursting of
.
The dynamics of the density of satisfies the equation:
(3)
(3) where the fourth term on the right-hand side accounts for bursting. The remaining terms are similar or complementary to the terms in the right-hand side of Equation (Equation2
(2)
(2) ).
2.3. Equations for the parasites and
The parasites reside in
and the parasites
reside in
. The Leishmania density
satisfies the equation:
(4)
(4) where
.
The first term on the right-hand side of Equation (Equation4(4)
(4) ) is a logistic growth of Leishmania within
, where
is the carrying capacity for
in
;
[Citation9, Citation21, Citation38]. Note that if
exceeds
, there is no growth.
When polarizes to
(the second term on the right-hand side of Equation (Equation2
(2)
(2) )), the parasites
in
become parasites in
, and this is accounted for by the second term on the right-hand side of Equation (Equation4
(4)
(4) ). When
bursts,
parasites are released, with a total mass of
. We assume that θ-fraction of them is ingested by
macrophages, and this is represented by the third term on the right-hand side of Equation (Equation4
(4)
(4) ); the remaining
-fraction are ingested by
macrophages (the third term on the right-hand side of Equation (Equation5
(5)
(5) )). The fourth term on the right-hand side of Equation (Equation4
(4)
(4) ) accounts for the gain of
from bursting
macrophages.
Recall that the density of parasites reduces when
bursts or when
polarizes to
. The fifth term of Equation (Equation4
(4)
(4) ) is the loss of parasites
due to the bursting of
; this term is the parasite-equivalence of the third term in the right-hand side of Equation (Equation2
(2)
(2) ) where the average mass of parasites in macrophage
at bursting time is
. The sixth term is the loss in
due to the transition from
to
. Similarly, this sixth term is the parasite-equivalence of the second term in Equation (Equation2
(2)
(2) ). The seventh term on the right-hand-side of Equation (Equation4
(4)
(4) ) accounts for the killing of parasites within
, which is enhanced by NO [Citation42, Citation82],
[Citation1, Citation2, Citation6], and
[Citation52, Citation56, Citation58, Citation96]. We assume that when a macrophage of
dies, all the Leishmania inside it also die. Accordingly, we get the corresponding death rate of
to be
, where
is the average number of Leishmania in one
macrophage at the time when the macrophage undergoes apoptosis.
The equation for Leishmania density is the following:
(5)
(5) The various terms are similar, or complementary, to the terms in Equation (Equation4
(4)
(4) ).
2.4. Equation for T cells T
The density of T cells satisfies the equation: (6)
(6) The first term on the right-hand side represents the
-induced proliferation of T cells [Citation22, Citation88]. The second term is the activation of T cells by contact with dendritic cells in the
environment. The third term represents activation of naive T cells (
cells) by contact with the inflammatory M1 macrophages in the
environment. The fourth term is the production of T cells that will become memory T cells.
2.5. Equations for cytokines
Equation for interleukin-2 ():
production by T cells [Citation1] is enhanced by SAG [Citation7, Citation37] and LEISH-F1+MPL-SE [Citation16]. Hence,
(7)
(7)
Equation for interleukin-10 ():
is produced primarily by
[Citation1, Citation61], and this production is enhanced by MA [Citation34], so that
(8)
(8)
Equation for interleukin-12 ():
is produced primarily by
, and this process is inhibited by
(and
, which we combined with
) [Citation1, Citation10, Citation70]. SAG enhances the production of IL-12 [Citation7, Citation31, Citation37]. Hence,
(9)
(9)
Equation for interferon-γ ():
is secreted by the T cells [Citation2, Citation10, Citation41], a process that is enhanced in presence of vaccine LEISH-F1+MPL-SE [Citation25], so that
(10)
(10) where
is the augmented secretion rate of IFN-γ due to the MPL-SE adjuvant. We set
if the MPL-SE adjuvant is not given, or if the full vaccine LEISH-F1+MPL-SE adjuvant is given.
Equation for nitric oxide (NO): Nitric oxide is produced by and
macrophages, and this production is enhanced by
[Citation13, Citation76, Citation82], SAG [Citation37], and MA [Citation34]. Hence,
(11)
(11)
Equations for TNF-α () and TGF-β (
): TNF-α is produced by T cells [Citation62] and by M1 macrophages [Citation55, Citation71], and V [Citation16, Citation25] and A [Citation34] increase the production of TNF-α by macrophages. Hence,
(12)
(12) TGF-β is secreted by M2 macrophages [Citation19, Citation54, Citation66], so that
(13)
(13)
2.6. Equations for MA (A), SAG (S) and LEISH-F1+MPL-SE vaccine (V)
We use a PK/PD (pharmacokinetic/pharmacodynamic) model for the drugs. We denote by an amount of MA administered at times
and by
the kinetic profile of the drug as it decays in time. We assume that the decay is exponential, so that
where
is some positive parameter. The PD term accounts for depletion of the drug through its effect on M1 macrophages, namely, inducing the secretion of NO. We assume that this term has the form
where
is a positive parameter. Then the dynamic of A takes the following form:
(14)
(14) where
is the intrinsic degradation of the drug.
The equations for SAG and vaccine LEISH-F1+MPL-SE have similar forms: (15)
(15)
(16)
(16) where
and
have the same form as
with some parameters
.
3. Model simulations
All computations are done using the Python ODE solver odeint(), which uses a fourth-order Runge–Kutta scheme. In all the simulations we take an initial load of Leishmania parasites, while all other initial values are taken to be close, but not necessarily identical, to their steady state estimated in Section 5 (in units of g/cm):
Table
3.1. Simulations with no drugs
Figures and show simulations of all the model variables in a no-drug case, when a leishmaniasis patient does not heal (Figure ) and when a patient heals (Figure ); correspondingly, the killing rates of parasites by and NO are larger in Figure by a factor of 3.
Figure 2. No self-healing; ,
. (a) All variables with no self-healing and (b) all macrophages and parasites with no self-healing.
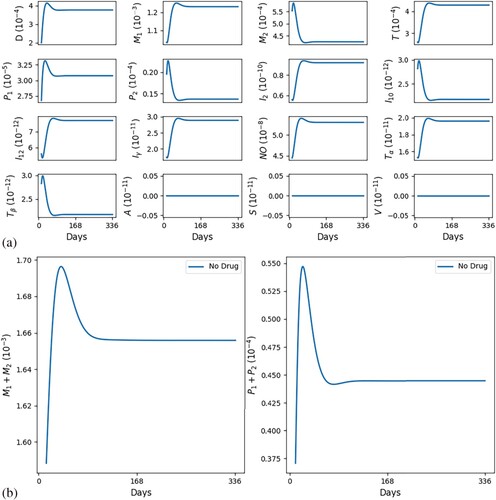
Figure 3. Self-healing; (factor of 3) ,
. (a) All variables with self-healing and (b) all macrophages and parasites with self-healing.
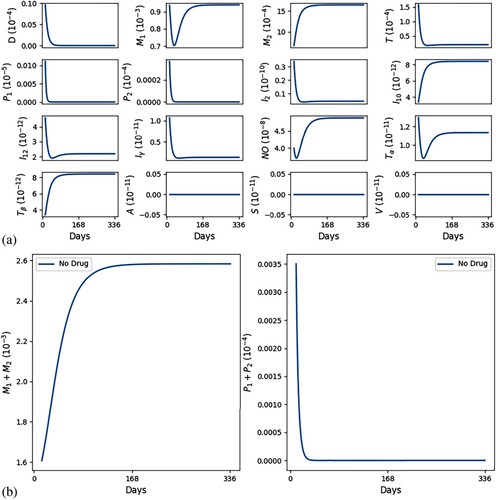
In Figures and we see that, as t increases, cells and cytokines converge to approximately the half-saturation values listed in Table , which were estimated in Section 5. This shows consistency in the parameter estimates. We also note that the steady state of is larger than that of
(
), which is in agreement with [Citation16] (Figure (a)).
Table 2. Descriptions, values, and sources of the model parameters.
In both figures, the initial values of the inflammatory cytokines are below their steady states (or half-saturation) and this results in the initial increase in (and their corresponding hosts
). But, following this initial increase,
starts to continuously decrease; in the healing case of Figure (b),
while
is continuously increasing, whereas in the non-healing case of Figure (b),
remains positive, with
g/cm
and
decreases below the half-saturation level.
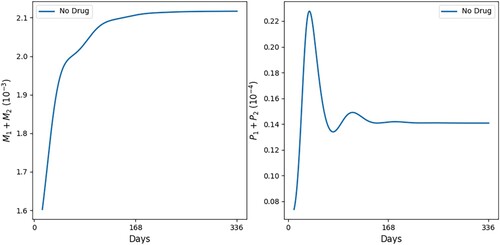
Figure shows additional profiles of and
for some intermediate values of killing rates. The competition between the killing of parasites and their growth within macrophages results in oscillations in
, which eventually subside. The oscillations in
are associated with their bursting by
.
Figure 4. All macrophages and parasites with no healing: (factor of 1.7) ,
.
3.2. Simulations with drugs in clinical trials
3.2.1. Meglumine antimoniate and vaccine
Nascimento et al. [Citation65] conducted clinical trials with a combination of leishmania vaccine LEISH-F1+MPL-SE, or its adjuvant MPL-SE, and chemotherapy compound MA. The effect of MPL-SE is to increase the production of IFN-γ [Citation74]. The clinical trials included three groups of CL patients:
All groups were treated with MA (A) in 4 cycles of 21 days; in the first 10 days they were injected with 10 mg/kg daily, and the remaining 11 days, they were at rest.
Group 1 receives shots of the vaccine LEISH-F1+MPL-SE (V) at Days 0, 28, and 56, with LEISH-F1 at 510or 20 µ g, and MPL-SE at 25 µ g.
Group 2 receives adjuvant MPL-SE shots at Days 0, 28, and 56, at 25 µ g.
Group 3 receives only MA.
Figure represents the schedule of the treatments.
Figure 5. Schedule for drug administration. As in [Citation65], shots of the vaccine LEISH-F1+MPL-SE adjuvant are given at Days 0, 28 and 56 for the LEISH-F1 and the MPL-SE adjuvant; meglumine antimoniate is administered daily, in cycles of 21 days, for the first 10 days followed by 11 days of rest.
![Figure 5. Schedule for drug administration. As in [Citation65], shots of the vaccine LEISH-F1+MPL-SE adjuvant are given at Days 0, 28 and 56 for the LEISH-F1 and the MPL-SE adjuvant; meglumine antimoniate is administered daily, in cycles of 21 days, for the first 10 days followed by 11 days of rest.](/cms/asset/6670ea56-b9c9-4d61-8e36-b182c88df4cc/tjbd_a_2257746_f0005_ob.jpg)
The results reported in [Citation65] are the following: At Day 84 of treatment, 80%, 50% and 38% of patients in Group 1, Group 2 and Group 3, respectively, had recovered (i.e. ). In our simulations, we represent the recovery rate by the relative difference between the parasite load without drug and the parasite load with drug at Day 84, that is,
(17)
(17) Figure shows our simulations of the experiments in [Citation65]. In the simulations, we represented the effect of the MPL-SE adjuvant alone by a constant augmented secretion rate of IFN-γ,
, in Equation (Equation10
(10)
(10) ): we took
. All other parameters in the drug equations are estimated, or fitted, in Section 5.
Figure 6. Treatment of leishmaniasis with MA (A), vaccine LEISH-F1+MPL-SE (V) and MPL-SE adjuvant as in [Citation65]. The numbers in parentheses represent the recovery rates.
![Figure 6. Treatment of leishmaniasis with MA (A), vaccine LEISH-F1+MPL-SE (V) and MPL-SE adjuvant as in [Citation65]. The numbers in parentheses represent the recovery rates.](/cms/asset/44648a59-7122-4e81-ae19-a80d82906f85/tjbd_a_2257746_f0006_oc.jpg)
Figure shows the profiles of and
during 84 days. From Equation (Equation17
(17)
(17) ) we computed the recovery rates of Group 1 at 79.80%, Group 2 at 49.60%, and Group 3 at 37.83%, in agreement with the results of the clinical trials in [Citation65].
In Figure , we show the profiles of the total parasite load under the same treatment protocol as in Figure , but with alternative doses of vaccine LEISH-F1, namely, 5 and 20 µ g. The simulations show that doubling the dose of LEISH-F1 significantly increases the recovery rate of the combination MA+LEISH-F1+MPL-SE.
Figure 7. Treatment of leishmaniasis with MA (A), vaccine LEISH-F1+MPL-SE (V) and MPL-SE adjuvant as in [Citation65]. Profiles of total parasites load with alternative doses of V . The numbers in parentheses represent the recovery rates.
![Figure 7. Treatment of leishmaniasis with MA (A), vaccine LEISH-F1+MPL-SE (V) and MPL-SE adjuvant as in [Citation65]. Profiles of total parasites load with alternative doses of V . The numbers in parentheses represent the recovery rates.](/cms/asset/f49cd429-9c39-4ba7-a2f6-935342d276f9/tjbd_a_2257746_f0007_oc.jpg)
3.2.2. Sodium antimony gluconate and vaccine
We next proceed to simulate treatment with the combination of LEISH-F1+MPL-SE and sodium antimony gluconate (SAG), a first-choice compound for the treatment of leishmaniasis.
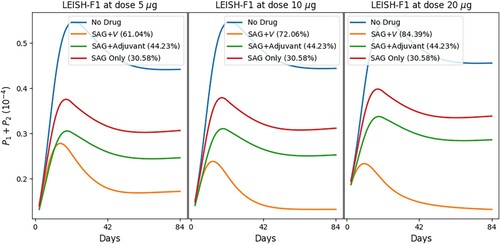
Figure shows the simulations of various combinations of SAG, vaccine LEISH-F1+MPL-SE, and MPL-SE adjuvant with schedules similar to those in Figure . We note that our simulations, in Figure , with SAG only and in Figure with MA only, show that the latter is more effective, which is in agreement with experimental results by Yesilova et al. [Citation95]. We also observe a similar pattern as with MA in Figures and , that doubling the dose of vaccine LEISH-F1+MPL-SE yields increased recovery rates.
Figure 8. Treatment of leishmaniasis with SAG, vaccine LEISH-F1+MPL-SE (V) and MPL-SE adjuvant. The numbers in parentheses represent the recovery rates.
3.3. Simulations with drugs under standard protocol
Meglumine antimoniate (MA) and sodium antimony gluconate (SAG) are first-line drugs in the treatment of leishmaniasis [Citation28]. A standard protocol of treatment is injection of 20 mg/kg daily for 20 days (in some cases up to 28 days) [Citation15]. Each of the drugs has its own set of adverse effects; see [Citation27, Citation68] for MA, and [Citation89, Citation92] for SAG.
In the following simulations, we combine the vaccine LEISH-F1+MPL-SE (V) with MA and evaluate the efficacy of the combinations at Day 84; drugs are administered for 20 days and the vaccine shots are given three times, twice or just once.
Figures and show the profiles of the total parasite loads and recovery rates of treatment with meglumine antimoniate in a single regimen and in combination with vaccine LEISH-F1+MPL-SE, where we give 3 vaccine shots (at Days 0, 28 and 56) in Figure , and 2 vaccine shots (at Days 0 and 28) in Figure (a), and 1 vaccine shot (at Day 0) in Figure (b). We see in all cases that combination therapy yields a much better recovery rate than chemotherapy alone, and doubling the dose of vaccine results in a significant increase in the recovery rate. Figure also shows, in comparison with Figure , that reducing the number of vaccine shots decreases efficacy and accentuates disease resurgence irrespective of the vaccine dose. Similar simulations have been carried out with the chemotherapy SAG (not shown here).
Figure 9. Standard protocol treatment of leishmaniasis with MA and vaccine LEISH-F1+MPL-SE. The vaccine is given at Days 0 and 28 and 56, and the chemotherapy is administered at Days 0–20, daily. The numbers in parentheses are the recovery rates at Day 84.
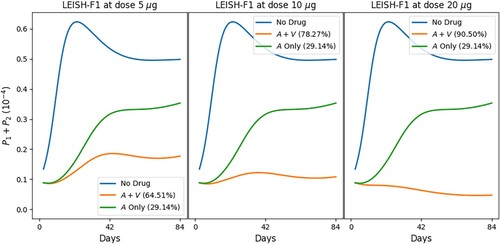
Figure 10. Standard protocol treatment of leishmaniasis with MA and vaccine LEISH-F1+MPL-SE. The vaccine is given at (a) Days 0 and 28 and (b) Day 0; the chemotherapy is administered at Days 0–20, daily. The numbers in parentheses are the recovery rates at Day 84. (a) 2 vaccine dose and (b) 1 vaccine dose.
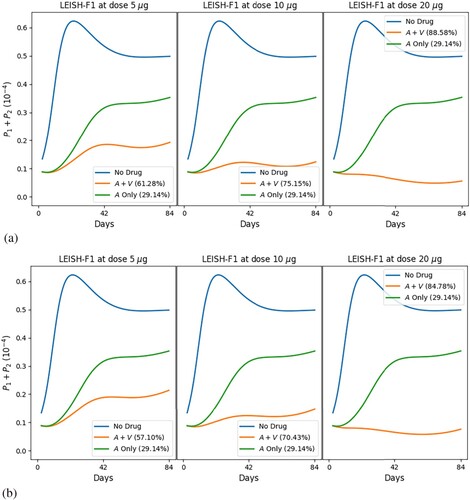
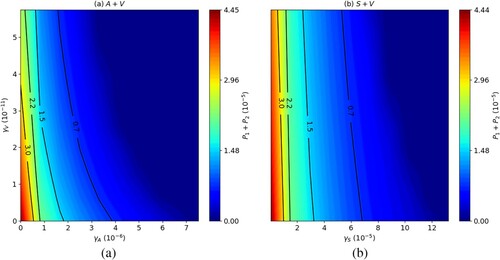
Figure shows the effect on at day 84 of combining the drug MA with the LEISH-F1+MPL-SE vaccine (Figure (a)), and SAG with the LEISH-F1+MPL-SE vaccine (Figure (b)), for various doses of
and
. In both figures, increasing the doses
of MA and
of the vaccine, and of
of SAG and
, simultaneously, yields a better reduction in parasite load. However, increasing
or
while keeping
fixed yields a much better reduction in parasite load than increasing
only.
Figure 11. Long-run total parasite load ( at day 84),
, combination of (a) MA with LEISH-F1+MPL-SE and (b) SAG with LEISH-F1+MPL-SE. The parasite loads are in units of g/cm
.
We conclude this section by noting that the model system (Equation1(1)
(1) )–(Equation16
(16)
(16) ) has a unique solution for all
. Indeed this follows for the following general theorem:
Theorem 3.1
Consider a system of differential equations
(18)
(18) and assume that the
's are continuously differentiable functions satisfying the following conditions in the nonnegative quadrant
If
Proof.
The inequalities in (iv) certainly hold if t is small. Hence, if the assertion (iv) is not true, then there is a smallest time τ such that (iv) holds for but not for
. To derive a contradiction, we get from Equation (Equation16
(16)
(16) ) and (i), the inequality
where
. Hence
(19)
(19)
(20)
(20) so that the second inequality in (iv) follows with
.
We next use the conditions (ii) and (iii) to get
and, by the second inequality in (iv),
Hence
This completes the proof of (iv) by contradiction.
As easily seen, the system (Equation1(1)
(1) )–(Equation16
(16)
(16) ) satisfies the conditions (i)–(iii) of Theorem 3.1. Hence, the system has a unique solution for all t>0, and each variable satisfies the inequality in (iv).
4. Conclusion and discussion
Leishmaniasis is a disease caused by a parasite from one of 20 Leishmania species. The most common forms of the disease are cutaneous leishmaniasis (CL) and visceral leishmaniasis (VL); the latter is likely to be deadly if not treated. The current control strategy for leishmaniasis relies on chemotherapy drugs such as sodium antimony gluconate (SAG) or meglumine antimoniate (MA). However, all these chemotherapy compounds have poor efficacy, and they are associated with toxicity and other adverse effects, as well as drug resistance.
A number of experimental vaccines have been developed, although no vaccine is currently available. However, some studies show that vaccines such as LEISH-F1+MPL-SE (V) have some efficacy as drugs for CL patients. This suggests that treatment of leishmaniasis can be improved by combining such a vaccine with one of the chemotherapy agents. Indeed, clinical trials, reported in [Citation65], show significant improvement when V was combined with MA.
In this paper, we study, by a mathematical model, the efficacy of various combinations of V with MA, or with SAG. The model is an extension of [Citation79, Citation80] that enables the inclusion of these drugs. We first demonstrated that the model predicts, what is well known, that even with no treatment, some patients recover, or partially recover; this we show by modifying some ‘personal’ parameters in the model equations (Figures –).
We next repeated with simulations the clinical trials in [Citation65] with MA and MA, and showed, in Figures and , that the efficacy of treatments is in agreement with the percentage of recovery reported in [Citation65]. In Figure we showed similar results in simulating clinical trials with SAG and SAG
.
We next considered the current standard treatment with MA, where the drug is administered daily for 20 days [Citation15]. In order to improve efficacy we added to this treatment 3 injections of V in the same schedule used in clinical trials [Citation16, Citation65], namely: at Days 0, 28, 56, and in the same amounts. In Figure we found that, by Day 84, the efficacy of treatment with MA alone was just 29%, but in combination with vaccine V , the efficacy increased significantly, to 65%, 78% and 91% when the amount of injection doubled from 5 to 10, and from 10 to 20 µ g. Furthermore, these recovery rates already occurred by Day 42. Similar results were obtained with SAG.
We next asked the question of whether we could get such improvements in MA if we reduce the number of vaccine injections, administering it at Days 0 and 28, or just at Day 0. We found, as in Figure (a), that with 2 shots the efficacy is still high (with 62%, 76% and 89%) but the density of the parasites begins to grow after the first 40–50 days, which indicates eventual resurgence of leishmaniasis. With one vaccine shot, given at Day 0, we see, in Figure (b), that the profiles for the total parasite load are qualitatively similar to those in Figure (a), but with smaller efficacy (58%, 71% and 85%) and higher tendency toward disease resurgence.
The model has as many variables (species) as were needed in order to be able to evaluate the efficacy of drugs and vaccines. This, necessarily, resulted in introducing many unknown parameters. We estimated some of these parameters making assumptions, such as ‘steady-state’ in some of the dynamical equations. Other parameters were ‘fitted’ using a few reported clinical trials. We addressed this shortcoming of the model by performing sensitivity analysis, showing that some randomized changes in parameters do not qualitatively change model's predictions.
In this paper, we demonstrated that by combining vaccine LEISH-F1+MPL-SE with a standard treatment with chemotherapy drug, such as meglumine antimoniate, we can improve very significantly the efficacy of treatment. But these conclusions will need to be confirmed in actual clinical trials, with attention also to potential side effects.
5. Parameter estimations
We denote by the average density/concentration of species X in patients before the beginning of therapy and take
5.1. Estimate for
The level of T cells (CD4 T cells+CD8
T cells) was measured in non-relapsing and relapsing VL patients immediately after treatment and 6–12 months post-treatment [Citation49]. We take the 12-month post-treatment relapsing VL case to correspond to an active VL infection:
Since the mass of one cell is approximately
g, we take
5.2. Estimates for and
The level of macrophages was estimated in [Citation79, Citation80] as g/cm
. As in [Citation79, Citation80], we take the ratio
, so that
5.3. Estimates for and
We have
We have the ratio
, as in [Citation79, Citation80]. Hence,
5.4. Estimate for and
The level of circulating TNF-α in CL patients without treatment is pg/ml [Citation48] (Table , Figure ). We assume that it is the same for VL patients without treatment so that
In [Citation26], the lymphoproliferative response level to drug-sensitive and drug resistance VL patients was measured for TNF-α, IFN-γ, IL-10 and TGF-β; Figs. 1–4 in [Citation26] show that
and
is significantly higher than
. But, as pointed out in [Citation26], the high level of
was mostly associated with treatment failure. Assuming that the ratios of
and
to
remain the same in the infected tissue, and that
, we get
In tuberculosis patients, IL-2 concentration before therapy was 164.5 pg/ml and after 2-month therapy, it was 92.11 pg/ml [Citation8], while the concentration of IL-12 in tuberculosis patients was 11.86 pg/ml compared to 5.1 pg/ml for healthy individuals [Citation3]. We take
The density of NO is 1.34 g/mole. The serum concentration in health is
[Citation30]; in sickle cell disease, it increases to
g/cm
[Citation4]. We take
For each cytokine X, we take
.
5.5. Estimate for
The half-life of nitric oxide is approximately 445 seconds (0.00515 days) [Citation36]. Hence,
5.6. Estimate for
The half-life of meglumine antimoniate is approximately 3.42 hours (0.14 days) [Citation35] (Figure (a)). Hence,
5.7. Estimate for
The half-life of SAG is approximately 10 hours (0.42 days) [Citation57]. Hence,
5.8. Estimate for
Meglumine antimoniate, in standard treatment, is administered by intravenous or injection route with a usual dose of 20 milligrams (mg) per kilogram (kg) of body weight per day [Citation12]; in a clinical trial by Nascimentao et al. [Citation65], meglumine antimoniate was given at 10 mg/kg per day. We estimate the dose to be per 1000 cm. We accordingly take
5.9. Estimate for
SAG (or sodium stibogluconate) is administered by injectable solutions, intravenously or intramuscular, at a dose of 20 mg/kg per day [Citation11]. We accordingly take, in standard treatment,
and
5.10. Estimate for
Chakravarty et al. [Citation16] and Nascimento et al. [Citation65] performed clinical trials with LEISH-F1+MPL-SE vaccine in the prevention of VL and suggested the following doses: 510and 20 µ g of LEISH-F1 antigen + 25 µ g MPL-SE adjuvant. We assume that the vaccine works through the immune system more effectively than chemotherapy drugs, and take, in the case of 10 µ g of LEISH-F1 + 25 µ g of MPL-SE adjuvant,
5.11. Estimate for
We assume that the rate of transition for to
by
is the same as by
and take, as in [Citation79],
5.12. Estimates for and
We assume that the strength of IFN-γ and TNF-α in augmenting the death of parasites is the same as that by NO, and take, as in [Citation79],
5.13. Estimate by equations (without drugs)
Equation (Equation1
Equation (Equation6
Equation (Equation7
Equation (Equation8
Equation (Equation9
Equation (Equation10
Equation (Equation11
Equation (Equation12
Equation (Equation13
6. Parameter sensitivity analysis
We performed a sensitivity analysis with respect to the total parasite load at Day 84, , without self-healing with no drugs, for the transition/activation parameters
,
,
,
,
,
,
,
,
and
, the bursting rates
,
, and the fraction of parasites phagocyted by M1 macrophages after burst, θ (Figure ).
Figure 12. Parameter sensitivity analysis for the total parasite load after 84 days. The p-values are less than .01.
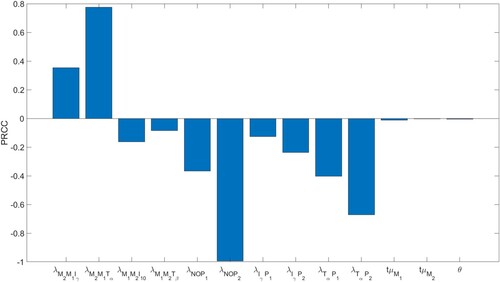
The computations were done using Latin Hypercube Sampling/Partial Rank Correlation Coefficient (LHS/PRCC) with a Matlab package by [Citation47, Citation60]. The range for the parameters in the sensitivity analysis was between of their baseline values in Tables and .
Table 3. Descriptions, values, and sources of the model parameters.
Expectedly, increasing any one of the strength of NO-, - or
-effect on parasites
and
, namely
and
result in decreased total parasite load. It is worth noting that the NO-effect on parasites is the most negatively correlated with respect to
.
Increased transition from M1 to M2 macrophages increases , since the burst rate of
is smaller than the burst rate of
, which enables additional growth time of the parasites in
. This explains why
and
are positively correlated, while
and
are negatively correlated.
Data availability statement
All relevant data are within the manuscript and its Supporting information files.
Disclosure statement
No potential conflict of interest was reported by the author(s).
Funding
The author(s) reported there is no funding associated with the work featured in this article.
References
- M. Akdis, S. Burgler, R. Crameri, T. Eiwegger, H. Fujita, E. Gomez, S. Klunker, N. Meyer, L. O'Mahony, O. Palomares, C. Rhyner, N. Quaked, A. Schaffartzik, W.V.D. Veen, S. Zeller, M. Zimmermann, and C.A. Akdis, Interleukins, from 1 to 37, and interferon-γ: Receptors, functions, and roles in diseases, J. Allergy Clin. Immunol. 127 (2011), pp. 701–721.
- J. Alexander and F. Brombacher, T Helper1/T Helper2 cells andresistance/susceptibility to Leishmania infection: Is this paradigm still relevant?, Front. Immunol. 3 (2012), pp. 1–13.
- Q. Alfaham and A.A.J. Aljanaby, Interleukin 12 has an important role in patients infected with mycobacterium tuberculosis, Int. J. Pharm. Res. 2020 (2020), pp. 1448–1453.
- C. Antwi-Boasiako and A.D. Campbell, Low nitric oxide level is implicated in sickle cell disease and its complications in ghana, Vasc. Health Risk Manag. 14 (2018), pp. 199–204.
- E. Bajetta, M.D. Vechio, R. Mortarini, R. Nadeau, A. Rakhit, L. Rimassa, C. Fowst, A. Borri, A. Anichini, and G. Parmiani, Pilot study of subcutaneous recombinant human interleukin 12 in metastatic melanoma, Clin. Cancer Res. 4 (1998), pp. 75–85.
- J. Barbi, H.M. Snider, N. Bhardwaj, C.M.L. Davila, J.E. Durbin, and A.R. Sastokar, Signal transducer and activator of transcription 1 in T cells plays an indispensable role in immunity to Leishmania major by mediating Th1 cell homing to the site of infection, FASEB J. 23 (2009), pp. 3990–3999.
- J.M. Basu and S. Roy, Sodium antimony gluconate (SAG) mediates antileishmanial effect by stimulating innate and cellular arms of the immune system, Sci. Cult. 73 (2007), pp. 138–143.
- M. Berktas, H. Guducuoglu, H. Bozkurt, K.T. Onbasi, M.G. Kurtoglu, and S. Andic, Change in serum concentrations of interleukin-2 and interferon-gamma during treatmentof tuberculosis, J. Int. Med. Res. 32 (2004), pp. 324–330.
- J.D. Berman, D.M. Dwyer, and A.J. Wyler, Multiplication of leishmania in human macrophages in vitro, Infect. Immun. 26 (1979), pp. 375–379.
- S. Bertholet, H.L. Dikensheets, F. Sheikh, A.A. Gam, R.P. Donnelly, and R.T. Kenney, Leishmania donovani-induced expression of suppressor of cytokine signaling 3 in human macrophages: A novel mechanism for intracellular parasite suppression of activation, Infect. Immun. 71 (2003), pp. 2095–2101.
- BioXcel Corporation, Drugs & Diseases: Sodium Stibogluconate (rx), Medscape, 2023. Available at https://reference.medscape.com/drug/pentostam-stibogluconate-sodium-342669
- S.E. Borborema, J.A. Osso Jr, H.F. Andrade Jr, and N. d Nascimento, Biodistribution of meglumine antimoniate in healthy and Leishmania (Leishmania)infantum chagasi-infected BALB/c mice, Mem. Inst. Oswaldo Cruz 108 (2013), p. 623–630.
- O. Brandonisio, M.A. Panaro, M. Sisto, A. Acquafredda, L.F.D. Leogrande, and V. Mitolo, Nitric oxide production by leishmania-infected macrophages and modulation by cytokinesand prostaglandins, Parassitologia 43 (2001), pp. 1–6.
- A.M. Carvalho, A. Magalhães, L.P. Carvalho, O. Bacellar, P. Scott, and E.M. Carvalho, Immunologic response and memory t cells in subjects cured of tegumentaryleishmaniasis, BMC Infect. Dis. 13 (2013), pp. 529–536.
- CDC, Parasites -- Leishmaniasis: Resources for Health Professionals, Global Health, Division of Parasitic Diseases and Malaria, 2023.
- J. Chakravarty, S. Kumar, S. Trivedi, V.K. Rai, A. Singh, J.A. Ashman, E.M. Laughlin, R.N. Coler, S.J. Kahn, A.M. Beckmann, K.D. Cowgill, S.G. Reed, S. Sundar, and F.M. Piazza, A clinical trial to evaluate the safety and immunogenicity of the LEISH-F1+MPL-SE vaccinefor use in the prevention of visceral leishmaniasis, Vaccine 29 (2011), pp. 3531–3537.
- M.M. Chan, N. Adapala, and C. Chen, Peroxisome proliferator-activated receptor-γ-mediated polarization of macrophages in leishmaniaInfection, PPAR Res. 2012 (2012), pp. 1–11.
- K.P. Chang and D.M. Dwyer, Hamster macrophage interactions in vitro: Cell entry, intracellular survival, and multiplication of amastigotes, J. Exp. Med. 147 (1978), pp. 515–530.
- T. Chanmee, P. Ontong, K. Konno, and N. Itano, Tumor-associated macrophages as major players in the tumor microenvironment, Cancers 6 (2014), pp. 1670–1690.
- E.D. Crouser, K.S. Knox, M.W. Julian, G. Shao, S. Abraham, S. Liyanarachchi, J.E. Macre, M.D. Wewers, M.A. Gavrilin, P. Ross, A. Abbas, and C. Eng, Gene expression profiling identifies MMP-12 and ADAMDEC1 as potential pathogenic mediators of pulmonary sarcoidosis, Am. J. Respir. Crit. Care Med. 179 (2009), pp. 929–938.
- J. Delgado-Dominguez, H. Gonzales-Aguilar, M. Ahuirre-Garcia, L. Gutierrez-Kobeh, M. Berzunza-Cruz, A. Ruiz-Remigio, M. Robles-Flores, and I. Becker, Leishmania mexicana lipophosphoglycan differentially regulates PKCα-induced oxidative burst inmacrophages of BALB/c and C57BL/6 mice, Paras. Immunol. 32 (2010), pp. 440–449.
- S. Dhanji and H.S. Teh, Il-2-activated CD8+CD44high cells express both adaptive and innate immune system receptors and demonstrate specificity for syngeneic tumor cells, J. Immunol. 171 (2003), pp. 3442–3450.
- N. Didwania, M. Shadab, A. Sabur, and N. Ali, Alternative to chemotherapy—The unmet demand against leishmaniasis, Front. Immunol. 8 (2017), pp. 1779–1790.
- J.H. Donohue and S.A. Rosenberg, The fate of interleukin-2 after in vivo administration, J. Immunol. 130 (1983), pp. 2203–2208.
- M.S. Duthie, V.S. Raman, F.M. Piazza, and S.G. Reed, The development and clinical evaluation of second-generation leishmaniasis vaccines, Vaccine 30 (2012), pp. 134–141.
- M.A. Elmekki, M.M. Elhassan, H.A. Ozbak, and M.M. Mukhtar, Elevated TGF-beta levelsin drug-resistant visceral leishmaniasis, Ann. Saudi Med. 36 (2016), pp. 73–77.
- I. Esfandiarpour, S. Farajzadeh, Z. Rahnama, E.A. Fathabadi, and A. Heshmatkhah, Adverse effects of intralesional meglumine antimoniate and its influence on clinical laboratory parameters in the treatment of cutaneous leishmaniasis, Int. J. Dermatol. 51 (2012), pp. 1221–1225.
- F. Frézard, P.S. Martins, M.C. Barbosa, A.M. Pimenta, W.A. Ferreira, J.E. de Melo, J.B. Mangrum, and C. Demicheli, New insights into the chemical structure and composition of the pentavalent antimonial drugs, meglumine antimonate and sodium stibogluconate, J. Inorg. Biochem. 102 (2008), pp. 656–665.
- R. Garg, N. Singh, and A. Dube, Intake of nutrient supplements affects multiplication of leishmania donovani in hamsters, Parasitology 129 (2004), pp. 685–691.
- A. Ghasemi, S. Zahedi Asl, Y. Mehrabi, N. Saadat, and F. Azizi, Serum nitric oxide metabolite levels in a general healthy population: Relation to sex and age, Life Sci. 83 (2008), pp. 326–331.
- M. Ghosh, K. Roy, and S. Roy, Immunomodulatory effects of antileishmanial drugs, J. Antimicrob. Chemother. 68 (2013), pp. 2834–2838.
- D. Gong, W. Shi, S.J. Yi, H. Chen, J. Groffen, and N. Heisterkamp, TGF-β signaling plays a critical role in promoting alternative macrophage activation, BMC Immunol. 13 (2012), pp. 31–40.
- S.J. Green, M.S. Meltzer, J.B.H. Jr, and C.A. Nacy, Activated macrophages destroy intracellular leishmania major amasgtigotes by an L-aarginine-dependent killing mechanism, J. Immunol. 144 (1990), pp. 278–283.
- A.P.C. Gélvez, J.A.P. Diniz Junior, R.T.S. Santa Brígida, and A.P.D. Rodrigues, AgNP-PVP-meglumine antimoniate nanocomposite reduces leishmania amazonensis infection in macrophages, BMC Microbiol. 21 (2021), pp. 211–224.
- M.A. Gómez, A. Navas, M.D. Prieto, L. Giraldo-Parra, A. Cossio, N. Alexander, and N.Gore Saravia, Immuno-pharmacokinetics of meglumine antimoniate in patients with cutaneous leishmaniasis caused by leishmania (Viannia), Clin. Infect. Dis. 72 (2021), pp. e484–e492.
- T.S. Hakim, K. Sugimori, E.M. Camporesi, and G. Anderson, Half-life of nitric oxide in aqueous solutions with and without haemoglobin, Physiol. Meas. 17 (1996), pp. 267–277.
- A.K. Haldar, P. Sen, and S. Roy, Use of antimony in the treatment of leishmaniasis: Current status and future directions, Mol. Biol. Int. 2011 (2011), pp. 1–23.
- E. Handman and D.T. Spira, Growth of leishmania amastigotes in macrophages from normal and immune mice, Z. Parasitenk. 53 (1977), pp. 75–81.
- W. Hao, E.D. Crouser, and A. Friedman, Mathematical model of sarcoidosis, PNAS 111 (2014), pp. 16065–16070.
- R.L. Hengel, B.M. Jones, M.S. Kennedy, M.R. Hubbard, and J.S. McDougal, Markersof lymphocyte homing distinguish CD4 T cell subsets that turn overin response to HIV-1 infection in humans, J. Immunol. 163 (1999), pp. 3539–3548.
- C.J. Henry, D.A. Ornelles, L.M. Mitchell, K.L. Brzoza-Lewis, and E.M. Hiltbold, IL-12 produced by dendritic cells augments CD8+ T cell activation through the production of the chemokines CCL1 and CCL17, J. Immunol. 12 (2008), pp. 8576–8584.
- M.F. Horta, B.P. Mendes, E.H. Roma, F.S.M. Noronha, J.P. Macêdo, L.S. Oliveira, M.M. Duarte, and L.Q. Vieira, Reactive oxygen species and nitric oxide in cutaneous leishmaniasis, J. Paras. Res. 2012 (2012), pp. 315–326.
- I. Jomantaite, N. Dikopoulos, A. Kroger, F. Leithauser, H. Hauser, R. Schirmbeck, and J. Reimann, Hepatic dendritic cell subsets in the mouse, Eur. J. Immunol. 34 (2004), pp. 355–365.
- E. Jonasch and F.G. Haluska, Interferon in oncological practice: Review of interferon biology, clinical applications, and toxicities, Oncologists 6 (2001), pp. 34–55.
- M. Khodoum, C. Lewis, J.Q. Yang, T. Orekov, C. Potter, T. Wynn, M. Mentink-Kane, G.K.K. Hershey, M. Wills-Karp, and F.D. Finkelman, Differences in expression, affinity,and function of soluble (s)IL-4Rα and sIL-13Rα2 suggest opposite effects on allergic responses, J. Immunol. 179 (2007), pp. 6429–6438.
- K.A. Kigerl, J.C. Gensel, D.P. Ankeny, J.K. Alexander, D.J. Donnelly, and P.G. Popovich, Identification of two distinct macrophage subsets with divergent effects causing either neurotoxicity or regeneration in the injured mouse spinal cord, J. Neurosci. 43 (2009), pp. 13435–13444.
- D.E. Kirschner, Uncertainty and Sensitivity Functions and Implementation, Source code, University of Michigan, 2007–2008. Available at http://malthus.micro.med.umich.edu/lab/usadata/.
- A. Kocyigit, S. Gur, M.S. Gurel, V. Bulut, and M. Ulukanligil, Antimonial therapy induces circulating proinflammatory cytokines in patients with cutaneous leishmaniasis, Infect. Immun. 70 (2002), pp. 6589–6591.
- R.C. Kuschnir, L.S. Pereira, M.R.T. Dutra, L. de Paula, M.L. Silva-Freitas, G. Corrêa-Castro, S. da Costa Cruz Silva, G. Cota, J.R. Santos-Oliveira, and A.M. Da-Cruz, High levels of anti-leishmania igg3 and low cd4+ t cells count were associated with relapses in visceral leishmaniasis, BMC Infect. Dis. 21 (2021), pp. 369.
- H. Lagler, M. Willheim, F. Traunmuller, K. Wahl, H. Winkler, M. Ramharter, W. Graninger, and andS. Winkler, Cellular profile of cytokine production in a patient with visceral leishmaniasis: γδ+ T cells express both type 1 cytokines and interleukin-10, Scan. J. Immunol. 57 (2003), pp. 291–295.
- T. Le, L. Leung, W.L. Carroll, and K.R. Shibbler, Regulation of interleukin-10 gene expression: Possible mechanisms accounting for its up regulation and for maturational differences in its expression by blood mononuclear cells, Blood 89 (1997), pp. 4112–4119.
- F.Y. Liew, C. Parkinson, S. Millott, A. Severn, and M. Carrier, Tumour necrosis factor (TNF alpha) in leishmaniasis. I. TNF alpha mediates host protection against cutaneous leishmaniasis, Immunology 69 (1990), pp. 570–573.
- D. Liu and J.E. Uzonna, The early interaction of leishmania with macrophages and dendritic cells and its influence on the host immune response, Front. Cell. Infect. Microbiol. 2 (2012), pp. 83–90.
- Z. Liu, W. Kuang, Q. Zhou, and Y. Zhang, TGF-β1 secreted by m2 phenotype macrophages enhances the stemness and migration of glioma cells via the smad2/3 signalling pathway, Int. J. Mol. Med. 42 (2018), pp. 3395–3403.
- H.L. Lu, X.Y. Huang, Y.F. Luo, W.P. Tan, P.F. Chen, and Y.B. Guo, Activation of m1macrophages plays a critical role in the initiation of acute lung injury, Biosci. Rep. 38 (2018), pp. BSR20171555.
- M.L. Lohmann-Matthes, B. Lüttig, and S. Hockertz, Involvement of membrane-associated TNF in the killing of leishmania donovani parasites by macrophages, Behring Inst. Mitt. 88 (1991), pp. 125–132.
- Mandell, Douglas, and Bennett, Principles and Practice of Infectious Diseases: Antimonygluconate, Saunders 8th, 2015.
- P.P. Manna, S.K. Hira, A. Basu, and S. Bandyopadhyay, Cellular therapy by allogeneic macrophages against visceral leishmaniasis: Role of TNF-α, Cell. Immunol. 290 (2014), pp. 152–163.
- A. Mantovani, A. Sica, S. Sozzani, P. Allavena, A. Vecchi, and M. Locati, The chemokine system in diverse forms of macrophage activation and polarization, Trends Immunol. 25 (2004), pp. 677–686.
- S. Marino, I.B. Hogue, C.J. Ray, and D.E. Kirschner, A methodology for performing global uncertainty and sensitivity analysis in systems biology, J. Theor. Biol. 254 (2008), pp. 178–196.
- F.O. Martinez, Regulators of macrophage activation, Eur. J. Immunol. 41 (2011), pp. 1531–1534.
- A.K. Mehta, D.T. Gracias, and M. Croft, TNF activity and T cells, Cytokine 101 (2018), pp. 14–18.
- L. Ming-Cai and H. Shao-Heng, Il-10 and its related cytokines for treatment of inflammatory bowel disease, World J. Gastroentorol. 10 (2015), pp. 620–625.
- M. Moafi, H. Rezvan, R. Sherkat, and R. Taleban, Leishmania vaccines entered in clinical trials: A review of literature, Int. J. Prev. Med. 10 (2019), pp. 134–141.
- E. Nascimento, D.F. Fernandes, E.P. Vieira, A. Campos-Neto, J.A. Ashman, F.P. Alves, R.N. Coler, L.Y. Bogatzki, S.J. Kahn, A.M. Beckmann, S.O. Pine, K.D. Cowgill, S.G. Reed, and F.M. Piazza, A clinical trial to evaluate the safety and immunogenicity of the LEISH-F1+MPL-SEVACCINE when used in combination with meglumine antimoniate for the treatment of cutaneousleishmaniasis, Vaccine 28 (2010), pp. 6581–6587.
- E. Obeid, R. Nanda, Y.X. Fu, and O.I. Olopade, The role of tumor-associated macrophages in breast cancer progression (review), Int. J. Oncol. 43 (2013), pp. 5–12.
- J.C. Oliver, L.A. Bland, C.W. Oettinger, M.J. Arduino, S.K. McAllister, S.M. Aguero, and M.S. Favero, Cytokines kinetics in an in vitro whole blood model following an endotoxin challenge, Lymphokine Cytokine Res. 12 (1993), pp. 115–120.
- A.L. Oliveira, Y.M. Brustoloni, T.D. Fernandes, M.E. Dorval, R.V. Cunha, and M.N. Bóia, Severe adverse reactions to meglumine antimoniate in the treatment of visceral leishmaniasis: A report of 13 cases in the southwestern region of Brazil, Trop. Doct. 39 (2009), pp. 180–182.
- C.M.S. Pacheco, G.V.A. Flores, K. Gonzalez, C.M. de Castro Gomes, L.F.D. Passero, T.Y. Tomokane, W. Sosa-Ochoa, C. Zúniga, J. Calzada, A. Saldaña, C.E.P. Corbett, F.T. Silveira, and M.D. Laurenti, Macrophage polarization in the skin lesion caused by neotropical species of leishmania sp, J. Immunol. Res. 2021 (2021), pp. 5596876–5596883.
- M.A. Panaro, O. Brandonisio, A. Cianciulli, P. Cavallo, V. Lacasella, P. Paradies, G. Testini, D.de Caprariis, V. Mitolo, and D. Otranto, Cytokine expression in dogs with natural Leishmania infantum infection, Parasitoly 136 (2009), pp. 823–831.
- N. Parameswaran and S. Patial, Tumor necrosis factor-α signaling in macrophages, Crit. Rev. Eukaryot Gene Expr. 20 (2010), pp. 87–103.
- R. Phillips, M. Svensson, N. Aziz, A. Maroof, N. Brown, L. Beattie, N. Signoret, and P.M. Kaye, Innate killing of leishmania donovani by macrophages of the splenic marginal zone requires IRF-7, PLoS Pathog. 6 (2010), pp. 1–13.
- S. Pradhan, R.A. Schwartz, A. Patil, S. Grabbe, and M. Goldust, Treatment options for leishmaniasis, Clin. Exp. Dermatol. 47 (2022), pp. 516–521.
- V.S. Raman, M.S. Duthie, C.B. Fox, G. Matlashewski, and S.G. Reed, Adjuvants for leishmania vaccines: From models to clinical application, Front. Immunol. 3 (2012), pp. 144–158.
- R.M. Reguera, Y. Pérez-Pertejo, C. Gutiérrez-Corbo, B. Domínguez-Asenjo, C. Ordóñez, C. García-Estrada, M. Martínez-Valladares, and R. Balaña-Fouce, Current and promising novel drug candidates against visceral leishmaniasis, Pure Appl. Chem. 91 (2019), pp. 1385–1404.
- A. Sarkar, P. Saha, G. Mandal, D. Mukhopadhyay, S. Roy, S.K. Singh, S. Das, R.P. Goswami, B. Saha, D. Kumar, P. Das, and M. Chatterjee, Monitoring of intracellular nitric oxide in leishmaniasis: Its applicability in patients with visceral leishmaniasis, Cytometry A 79 (2011), pp. 35–45.
- N. Siewe and A. Friedman, Increase hemoglobin level in severe malarial anemia while controlling parasitemia: A mathematical model, Math. Biosci. 326 (2020), pp. 108374.
- N. Siewe and A. Friedman, Tgf-β inhibition can overcome cancer primary resistance to pd-1 blockade: A mathematical model, PLoS ONE 16 (2021), pp. 1–16.
- N. Siewe, A.A. Yakubu, A.R. Satoskar, and A. Friedman, Immune response to infection by leishmania: A mathematical model, Math. Biosci. 276 (2016), pp. 28–43.
- N. Siewe, A.A. Yakubu, A.R. Satoskar, and A. Friedman, Granuloma formation in leishmaniasis: A mathematical model, J. Theor. Biol. 412 (2017), pp. 48–60.
- R. Simó, A. Barbosa-Desongles, A. Lecube, C. Hernandez, and D.M. Selva, Potential role of tumor necrosis factor-α in down regulating sex hormone-binding globulin, Diabetes 61 (2012), pp. 372–382.
- S.V. Spitsin, J.L. Farber, M. Bertovich, G. Moehren, H. Koprowski, and F.H. Michaels, Human- and mouse-inducible nitric oxide synthase promoters require activation of phosphatidylcholine-specific phospholipase C and NF-kappa B, Mol. Med. 3 (1997), pp. 315–326.
- S. Srivastav, W.B. Ball, P. Gupta, J. Giri, A. Ukil, and P.K. Das, Leishmania donovani prevents oxidative burst-mediated apoptosis of host macrophages through selective induction of suppressors of cytokine signaling (SCOS) proteins, J. Biol. Chem. 289 (2014), pp. 1092–1105.
- M. Stein, S. Keshav, N. Harris, and S. Gordon, Interleukin 4 potentially enhances murine macrophage mannose receptor activity: A marker of alternative immunologic macrophage activation, J. Exp. Med. 176 (1992), pp. 287–292.
- B. Tirado-Rodriguez, E. Ortega, P. Segura-Medina, and S. Huerta-Yepez, TGF-β: An important mediator of allergic disease and a molecule with dual activity in cancer development, J. Immunol. Res. 2014 (2014), pp. 1–15.
- S.R.B. Uliana, C.T. Trinconi, and A.C. Coelho, Chemotherapy of leishmaniasis: Present challenges, Parasitology 145 (2018), pp. 464–480.
- R. van Furth, Cells of the mononuclear phagocyte system. Nomenclature in terms of sites and conditions, in Mononuclear Phogocytes: Functional Aspects. Part 1., R. van Furth, ed., Martinus Nijhoff Publishers, The Hague, 1980, pp. 1–30.
- J.F. Viallard, J.L. Pellegrin, V. Ranchin, T. Schaeverbeke, J. Dehais, M. Longy-Boursier, J.M. Ragnaud, B. Leng, and J.F. Moreau, Th1 (IL-2 interferon-gamma (IFN-gamma)) andTh2 (IL-10, IL-4) cytokine production by peripheral blood mononuclear cells (PBMC) from patients with systemic hupus erythematocus (SLE), Clin. Exp. Immunol. 115 (1999), pp. 189–195.
- S. Vikrant, D. Gupta, and S.S. Kaushal, Sodium stibogluconate-associated acute interstitial nephritis in a patient treated for visceral leishmaniasis, Saudi J. Kidney Dis. Transpl. 26 (2015), pp. 757–760.
- I.D. Vélez, K. Gilchrist, S. Martínez, J.R. Ramírez-Pineda, J.A. Ashman, F.P. Alves, R.N. Coler, L.Y. Bogatzki, S.J. Kahn, A.M. Beckmann, K.D. Cowgill, S.G. Reed, and F.M. Piazza, Safety and immunogenicity of a defined vaccine for the prevention of cutaneous leishmaniasis, Vaccine 28 (2009), pp. 329–337.
- H.H. Wacker, R.J. Radzun, and M.R. Parwaresch, Kinetics of Kupffer cells as shown by parabiosis and combined autoradiographic/immunohistochemical analysis, Virchows Arch. B Cell Pathol. Incl. Mol. Pathol. 51 (1986), pp. 71–78.
- E.S. Wise, M.S. Armstrong, J. Watson, and D.N. Lockwood, Monitoring toxicity associated with parenteral sodium stibogluconate in the day-case management of returned travellers with new world cutaneous leishmaniasis [corrected], PLoS Negl. Trop. Dis. 6 (2012), pp. e1688.
- J.K. Wong, M.C. Strain, R. Prrata, E. Reay, S. Sankaran-Walters, C.C. Ignacio, T. Russell, S.K. Pillai, D.J. Looney, and S. Dandekar, In vivo cd8+ T-cell suppression of SIV viremia is not mediated by CTL clearance of productively infected cells, PLoS Pathog. 6 (2010), pp. 1–12.
- X. Wu, W. Xu, X. Feng, Y. He, X. Liu, Y. Gao, S. Yang, Z. Shao, C. Yang, and Z. Ye, TNF-a mediated inflammatory macrophage polarization contributes to the pathogenesis of steroid-induced osteonecrosis in mice, Int. J. Immunopathol. Pharmacol. 28 (2015), pp. 351–361.
- Y. Yesilova, H.A. Surucu, N. Ardic, M. Aksoy, A. Yesilova, S. Oghumu, and A.R. Satoskar, Meglumine antimoniate is more effective than sodium stibogluconate in the treatment of cutaneous leishmaniasis, J. Dermatolog. Treat. 27 (2016), pp. 83–87.
- P. Zanger, I. Kotter, P.G. Kremsner, and G. Gabrysch, Tumor necrosis factor alpha antagonist drugs and leishmaniasis in Europe, Clin. Microb. Infect. 18 (2012), pp. 670–676.