
 ?Mathematical formulae have been encoded as MathML and are displayed in this HTML version using MathJax in order to improve their display. Uncheck the box to turn MathJax off. This feature requires Javascript. Click on a formula to zoom.
ABSTRACT
A study on green analytical chemistry aims to develop eco-friendly alternatives to hazardous substances and minimize waste generation. The study thoroughly examined various tools to determine their greenness. A newly validated RP-UPLC method was then employed quantitatively to detect Triamcinolone Acetonide (TRA) in a creamy pharmaceutical formulation using UPLC BEH C18 (50 × 2.1 mm, 1.7μm) column for analysis, with a detection wavelength set at 240 nm. The Box-Behnken design was developed to efficiently determine the optimal chromatographic conditions while minimizing the required trials. The study effectively assessed the impact of three independent variables on various responses, including retention time, tailing factor, and theoretical plates. The variables examined ethanol ratio, pH levels, and flow rate were meticulously tested to optimize experimental conditions. The utilization of desirability and overlay plots, along with a mobile phase of ethanol and purified water in a volumetric ratio of 30:70 and pH adjustment to 5.0. Calibration curves were constructed to assess the linearity of TRA within the concentration range of 2.5-50 µg/mL, yielding correlation coefficients (r = 0.9999). The accuracy was validated through recovery studies with the acceptable range of 99.6-101.2%. The specificity of the method has been validated by conducting forced degradation studies per ICH guidelines.
GRAPHICAL ABSTRACT
1. Introduction
The advancements in chromatographic practices that prioritize environmental sustainability are remarkable. When comparing ethanol to acetonitrile and methanol, it has been demonstrated that ethanol exhibits greater sustainability and enhanced safety, and this recognition is well-founded. A recent study has demonstrated that alternative solvents can yield comparable outcomes to conventional solvents (Citation1, Citation2). Ultra-performance liquid chromatography (UPLC) is a fantastic technique that has earned an excellent reputation for its unmatched accuracy, exceptional precision, and impressive responsiveness in detecting various elements on different substrates. This highly versatile and reliable technique makes it a preferred choice for objectives across multiple domains. Its low solvent usage, short analysis time, and high accuracy have made it a popular selection in green analytical chemistry (GAC). Pharmaceutical companies also use UPLC to assess active pharmaceutical ingredients (APIs) and impurities while minimizing waste production (Citation3). We must evaluate their potential environmental impact to ensure that our analytical methodologies are practical and environmentally sustainable. Fortunately, various resources are available to us, including the well-known AGREE tool. Moreover, AGREEprep, GAPI, ComplexGAPI, analytical method volume intensity (AMVI), and analytical eco-scale (ESA) have been developed with the explicit aim of encouraging the implementation of sustainable analytical procedures. Integrating these resources into our research endeavors can significantly enhance our overall success while upholding our ethical obligation to safeguard the environment (Citation4).
BBD is a widely favored experiment due to its numerous advantages. This method is known for its simplicity and efficiency, which means fewer experimental runs are required than with alternative designs. This is beneficial as it optimizes efficiency and saves valuable resources for researchers. Additionally, the design facilitates the identification of both linear and quadratic effects of variables, which allows for a more comprehensive understanding of the experimental system. With the Box-Behnken design, researchers can determine the most favorable conditions for the response variables, enabling the optimization of processes and the creation of novel products. The BBD is a valuable experimental design and analysis tool (Citation5). BBD is an excellent tool to improve the accuracy of experimental results significantly. By optimizing chromatographic conditions using BBD, the development and validation of the HPLC analytical technique become more precise. The optimized conditions can be routinely used for analyses, making the HPLC procedures more efficient. In addition, the peak parameter is adjusted until it reaches the required level of satisfaction. Even if multiple parameters need to be analyzed, the BBD technique is easy to manage and will produce reliable results (Citation6). A central composite design (CCD) is a type of response surface methodology (RSM) that is highly versatile. It involves adding axial and center points to a factorial or fractional factorial design. By controlling the alpha value, which determines how far the axial points should be from the center of the design, a star-shaped pattern is created. In addition to estimating the pure error, the center points are also used to check the curvature of the response surface. The CCD allows for fitting a quadratic model and exploring interactions and nonlinearities. However, it should be noted that the choice of the alpha value can also affect the quality of the design since it requires more runs than other RSMs. The BBD is, without a doubt, one of the most popular RSMs used in experimental design. BBD is designed to avoid extreme combinations of factors, using a three-level factorial design that exclusively uses the midpoints of the edges and center points. One of the critical advantages of BBD over CCD is that it requires fewer runs and is more uniform across the design space. Additionally, BBD's design matrix can be generated with fewer experimental runs, making it a more economical and viable option than CCD. However, it should be noted that BBD has some limitations. For example, it cannot estimate the full quadratic model for factors with fewer than four factors or those that are hard to change. Despite these limitations, BBD remains an excellent option for experimental design (Citation7, Citation8).
The Six Sigma methodology has been increasingly recognized in the pharmaceutical industry lately. This approach has proven effective in improving process efficiency and reducing inefficiencies. It has been explicitly designed to enhance efficiency and mitigate errors. Research has shown that this methodology has a very high capability index (Cpk), which makes it even more appealing for those in the industry looking to optimize their processes (Citation9).
Triamcinolone acetonide (TRA), depicted in Figure S1, is a glucocorticoid derivative with comparable pharmacological characteristics to cortisol. However, it demonstrates tremendous potential in its anti-inflammatory and immunosuppressive efficacy. Consequently, TRA has gained extensive utilization in treating diverse dermatologic conditions, including allergic rhinitis, joint pain, asthma, frozen shoulders, acute sprains, and ocular diseases (Citation10). The compound known as TRA possesses a chemical structure denoted as 9-Fluoro-11β,21-dihydroxy-16α,17-(1-methylethylidenedioxy) pregna-1,4-diene-3,20-dione t. It has a molecular formula of C24H31FO6 and a molecular weight of 434.5. The physical characteristics of TRA are reported to be those of a white or nearly white crystalline powder. Regarding solubility, TRA is described as practically insoluble in water and only sparingly soluble in ethanol (96 percent) (Citation11, Citation12).
An extensive review of the scientific literature has found that the United States Pharmacopeia (USP) and the British Pharmacopeia (BP) have documented the HPLC method for estimating TRA. This method entails a run time that is 1.5 times the retention time of TRA, which is approximately 16 min. Additionally, it has been determined that a limited range of analytical methods are available for identifying the specified pharmaceutical compound, including HPLC (Citation13–24), LC/MS (Citation25–30), UPLC (Citation31–33), and UPLC/MS (Citation34–40).
Based on the data displayed in , the Six Sigma methodology has been thoroughly analyzed and compared to a previous approach. The results suggest that the proposed method is superior to the earlier approach in estimating TRA and the corresponding chemicals and degradation products. The novel approach displays more selectivity and environmental sustainability, setting it apart from other methodologies.
Table 1. Summary data for the process capability six-pack, including reported and proposed techniques.
Literature reviews revealed that there is no currently available methodology for estimating TRA in the presence of degraded products, including green chromatography, which is both safe and environmentally friendly. Accordingly, the purpose of this proposal is to develop an eco-friendly, novel, and efficient UPLC method for measuring TRA in a cream dosage form that adheres to Box-Behnken design principles and Six Sigma practices. As part of this study, RP-UPLC techniques were used to assess both the stability of the TRA as well as their degradation simultaneously. The eco-friendliness of the developed method was assessed using a variety of tools. Based on the results, the proposed approach demonstrates more environmental friendliness than previous approaches. We replaced the hazardous acetonitrile with more environmentally friendly ethanol using the UPLC technique we developed. According to the recommended method, it has proven to be more reliable and faster than previous methods previously reported.
2. Experimental
2.1. Chemicals and reagents
The working standard and Top-flam 15 gm cream were supplied by Hikma Pharmaceuticals located in (6th of October, Egypt). Ethanol HPLC grade and analytical grades of orthophosphoric acid, sodium hydroxide, hydrogen peroxide, and hydrochloric acid were acquired from (Fischer, USA).
2.2. Instrumentation
Waters (Massachusetts, USA) has improved the ACQUITY Arc System to permit linkage and a simple transition between HPLC and UHPLC. The UV detector, temperature-controlled column management (operable between 4 and 90 degrees Celsius), autosampler needle (which reduces carryover by continuously cleansing the needle during injections) and Empower 3 software (which processes and reports on data) are all included with every arc UHPLC system.
2.3. Diluent
Use the mobile phase as a solvent.
2.4. Stock standard solutions
After preparing stock solutions containing 500 µg/mL of the drugs, dilutions ranging from 2.5 to 50 µg/mL were made.
2.5. Analysis of dosage form
We accurately transferred 1.0 g of Cream, measuring the equivalent of 1.0 mg of TRA, into a 100-mL volumetric flask. After adding 75 milliliters of solvent, we sonicated the mixture for 5 min and then filled it to the mark. To guarantee a clear solution with a concentration of 10 µg/mL, we filtered the mixture through a suitable filter with a 0.45-m pore size.
2.6. Chromatographic conditions
Following a comprehensive analysis, we utilized cutting-edge instruments, including the Arc UHPLC. Specifically, we employed the ACQUITY UPLC BEH C18 column, featuring specifications of 50 × 2.1 mm, 1.7μm, a constant flow rate of 0.75 mL/min, and ambient temperature. To ensure accuracy, we implemented an isocratic elution technique with 30:70 v/v ethanol and acidic water at pH 5.0, set the detection wavelength at 240 nm, and injected 10 µL of samples.
2.7. Construction of calibration curves
To achieve the desired concentrations for the research, we diluted the standard solution of TRA. The concentrations ranged from 2.5 to 50 µg/mL, allowing us to conduct our experiments precisely and accurately.
2.8. Application of Six Sigma methodology
The process capability index is essential for industries to improve their production processes. By analyzing the behavior of the process, the index helps to minimize scrap and enhance product quality and consistency while reducing production costs and losses due to poor quality. A high Cpk value indicates that the process is operating close to its set center limit despite significant variability, while a low Cpk value indicates that the process needs improvement. Therefore, calculating the Cpk number is crucial for industries to ensure optimal process performance. To satisfy most clients, a Cpk of 1.33 [4 sigma] or greater is required (Citation41).
2.9. Design of experiment for optimizing RP-UPLC method
After conducting our preliminary screening study, we determined the critical parameters affected by chromatographic separation. To achieve the best resolution and shortest retention time for both drugs, we used three variables at three levels of BBD with RSM. These variables included pH, ethanol ratio in the mobile phase, and flow rate. We conducted 15 experimental runs, focusing on retention time, tailing factor, and theoretical plate. Using the data displayed in , we developed a second-order polynomial equation that accurately describes the quadratic models. We also used a 3D response surface to show how the independent variables interact. We used the desirability function and overlay plots to forecast the best possible outcome.
Table 2. Box-Behnken experimental design variables and responses for optimal approach.
3. Results and discussion
3.1. Preliminary investigation
Our study aims to improve the UPLC technique for measuring TRA in the cream dosage form. We conducted several trials to determine the best wavelength and column type and to optimize the mobile phase ratio. After scanning the 200-400 nm wavelength with a concentration of 10 μg/mL of TRA, we discovered that the ideal wavelength for achieving maximum sensitivity and low noise is 240 nm. Our findings will contribute to developing a specialized and robust UPLC technique with a low tailing factor, high theoretical plate, and shortest retention time. Based on our thorough testing of various columns, the Acquiity UPLC BEH C18 column (50 mm × 2.1 mm, 1.7μm) outperforms the Cortecs Shield C18 (50 mm × 2.1 mm, 1.6 μm) and Zorbax SB-C18 RRHD (50 mm × 2.1 mm, 1.8 μm) columns. Its minimal void volume distinguishes it as the most efficient choice for separating the tested pharmaceuticals. These preliminary findings could be helpful for those looking for a reliable column to use in their pharmaceutical research. The optimal mobile phase for estimating TRA drug was ethanol and acidic water. As per a recent experiment to evaluate the TRA drug, we discovered that ethanol and acidic water were the optimal mobile phases. Upon adjusting the ethanol ratio, pH, and flow rate, we observed significant changes in the retention time, tailing factor, and theoretical plate. Based on the findings, the mobile phase's flow rate, pH, and ethanol ratio were the most critical factors affecting the experiment's responses. These factors significantly influenced the experiment's results and should be considered in future experiments.
3.2. Design of experiments (DoE)
The RSM is a powerful tool for optimizing chromatographic methods for analysis. BBD’s design-of-experiments strategy determines the best chromatographic parameters with minimal experimental trials and time investment. This approach expertly highlights the significance of certain factors and yields second-order polynomial equations for the response classifier. Using the BBD is the most innovative approach when optimizing the chromatographic methods. It is essential to highlight that using the BBD can significantly reduce the number of necessary trials. However, it is crucial to determine that it may not be able to consider all possible combinations of variables at extreme values, particularly at the highest or lowest levels. Therefore, analyzing these scales may result in less than optimal outcomes. Although the BBD is an effective method for improving processes, it has yet to be recommended for determining responses at extreme values of independent variables (Citation42). After thoroughly analyzing three rounds of experiments using a zero level of pH 4.0, a flow rate of 1.0, and an ethanol ratio of 20%, we successfully identified the pure errors involved. We have also reduced the impact of external factors by randomizing the remaining 12 runs.
3.3. Statistical modeling methodology
Based on the analysis, the model and its terms are statistically significant if the P-value is less than 0.05. The regression models’ R-squared and modified R-squared values were within acceptable ranges (R > 0.8), suggesting a reasonable fit with a polynomial equation and aiding the model’s predictive potential estimation. This points to appropriate data matching. Furthermore, the high predicted R-squared values highlight the model's critical forecasting accuracy for future estimations. The implementation of lack-of-fit approaches was employed to assess the adequacy of the models thoroughly. It is essential that the model and the experimental design fit together well and that any differences shown were not statistically significant. To identify the most optimal model, the p-value associated with the model must be statistically significant, often shown by a value less than 0.05 (Citation43). The lack of fit p-value should be deemed non-significant (p > 0.05), as indicated in .
Table 3. ANOVA for the quadratic model of retention time response.
Table 4. ANOVA for the quadratic model of tailing factor response.
Table 5. ANOVA for the quadratic model of theoretical plate response.
3.4. Effects of different factors
3.4.1. The influence of factors on retention time
Based on the Model F-value of 24.22, it can be inferred that the model is significant. Moreover, the P-values for A (flow rate), B (pH), and C (ethanol ratio%) are below 0.0500, indicating that these model terms are appropriate and necessary. The statistical data indicates that the observed F-value cannot be attributed to random noise, with a probability of only 0.13%, see . Our analysis reveals that variables have a multifaceted effect on the retention time response of TRA. While a negative linear impact is evident, suggesting that an increase in variables leads to a decrease in retention time response, there is also a positive quadratic influence. This implies that a range of optimal variable values maximizes the retention time response. Furthermore, when two variables interact, they respond similarly, as indicated by the positive sign before the interacting terms. Therefore, it is crucial to consider the impact of variables on the TRA retention time response to achieve optimal results. Based on the findings presented in , it can be concluded that the flow rate (A), pH (B), and ethanol ratio (C) have a significant impact on the retention time of TRA. The association between these variables has been demonstrated using a polynomial equation, 3D graphs, and contour plots. In particular, the ratio of the mobile phase is a crucial factor in determining the retention time of TRA. As the ethanol ratio and pH increase, the retention time of TRA substantially decreases. Conversely, an increase in the ethanol ratio and pH leads to a significant reduction in the retention time of TRA. Using an intermediate ratio for the mobile phase and pH has also resulted in a longer retention time for TRA. Experienced chemists know that there are better methods for developing analytical techniques than prolonging retention times. This is because elongated run times for the chromatogram can result in wasteful use of mobile phase and time. The TRA analytical approach was created using the highest ratio and pH for the mobile phase to make the TRA analytical approach, ensuring maximum effectiveness and minimal waste (Citation43). The analysis indicates that the flow rate (A) is the most significant factor significantly affecting the retention time. It has been observed that as the flow rate increases, the retention time decreases, and vice versa. Moreover, the two predictor variables, ethanol ratio, and pH, show an inverse relationship. Increasing the buffer's pH while maintaining a low ethanol ratio decreases the retention time response. It is worth noting that the retention time response was positively impacted by the combination of flow rate (A) and pH (B). Additionally, both flow rate (A) and ethanol ratio (C) have been found to benefit retention time. Using linear regression analysis, we obtained a second-order polynomial Equation (1) showcasing the association between the responses and predictor variables. These remarkable findings will help us optimize our processes and achieve superior outcomes (Citation44).
(1)
(1)
Figure 1. The effects of pH and flow rate (a, b), ratio and flow rate (c, d), and (e, f) pH and ratio on TRA retention time in the form of contour and 3D-response surface plots.


Where: Rt is the retention time response for TRA drug, A (Flow rate), B (pH), C (Ethanol ratio%), AB (Flow rate * pH), AC (Flow rate * Ratio), and BC (pH * Ratio) reflect the interaction of the variables, while A² (Flow rate²), B² (pH²), and C² (Ethanol ratio%²) are the quadratic term.
3.4.2. The influence of factors on tailing factor
Based on the F-value of 16.71, it is safe to say that the model is significant. It is rare for an F-value this large to occur due to noise, as it only happens around 0.32% of the time. Furthermore, with p-values less than 0.0500, it is evident that the model terms are sufficient. Including A, C, AC, BC, A2, B2, and C2 as essential model terms is crucial, as shown in . The flow rate (A) positively affects the tailing factor. However, it should be noted that this influence on peak tailing is relatively minor. Using a higher tailing factor for the chromatographic method is not recommended, as this may yield unsatisfactory results (Citation45). The data presented in demonstrate the significant influence of flow rate (A), pH (B), and ethanol ratio (C) on the TRA tailing factor. A polynomial Equation (2), 3D graphs, and contour plots were employed to illustrate these variables’ relationships. The mobile phase ratio is critical among the key factors determining TRA tailing factor. Notably, a substantial ethanol ratio and pH increase significantly reduce the TRA tailing factor. Conversely, the TRA tailing factor decreases significantly with an increased ethanol ratio and pH. It is worth noticing that the combination of flow rate (A) and pH (B) had a positive impact on the tailing factor response. Also, pH (B) and ethanol ratio (C) positively impacted the tailing factor response. Furthermore, flow rate (A) and ethanol ratio (C) have improved tailing factors. We obtained a second-order polynomial Equation (2) using linear regression analysis demonstrating the relationship between the responses and predictor factors. These extraordinary discoveries will assist us in optimizing our procedures and achieving superior results (Citation46).
(2)
(2)
Figure 2. Contour and 3D-response surface plots (a, b) for the influence of pH and flow rate, (c, d) for the influence of ratio and flow rate, and (e, f) for the influence of pH and ratio on the TRA tailing factor.


Where: Tf is the tailing factor response for TRA drug.
3.4.3. The influence of factors on theoretical plates
Based on the F-value of 83.43, the model is significant. This large F-value could only occur due to noise about 0.01% of the time. When the p-value is less than 0.0500, it suggests that the model terms are necessary. The essential model terms are A, B, C, AC, A2, B2, and C2 (). Based on the data presented in , flow rate (A), pH (B), and ethanol ratio (C) all play a significant role in the TRA theoretical plates. A polynomial Equation (3), 3D graphs, and contour plots were utilized to showcase the correlations between these variables. In terms of the TRA theoretical plates, it is crucial to consider the ethanol ratio (C). A higher ethanol ratio can lead to a substantial increase in TRA theoretical plates. However, it should also be noted that increasing flow rate (A) and pH (B) can significantly decrease the TRA theoretical plates. The combination of flow rate (A) and pH (B) had a negative influence on theoretical plates. Therefore, a lower flow rate was selected for the approach. On the other hand, pH (B) and ethanol ratio (C) positively affected the theoretical plates (Citation47).
(3)
(3)
Figure 3. The impacts of pH and flow rate (a, b), ratio and flow rate (c, d), and pH and ratio (e, f) on the theoretical plates of TRA as contour and 3D-response surface plots.


Where: N is the theoretical plate response for TRA drug.
3.5. The composite desirableness functions
We have successfully predicted the ideal separation criterion based on our numerical optimization function and the overlay plots depicted in Supplementary Figure S2 a-f. By increasing attractiveness, we have achieved a low tailing factor, a high theoretical plate, and a less than 3.0 min retention time. After several parameter variations in the lab, we identified the most critical parameters and tested the suggested strategy. As depicted in , we have discovered that using acidic water: ethanol (70:30, v/v) at pH 5.0 adjusted by phosphoric acid with a flow rate of 0.75 mL/min yields the best chromatographic method. This method produces a high resolution, an asymmetric peak, and a shorter retention period, ensuring the efficiency and accuracy of our study.
Figure 4. HPLC Chromatograms of (a) standard solution of TRA and (b) test solution.

3.6. Lean Six Sigma approach
The process capability index, or Cpk, is valuable for industries seeking to improve their processes. By utilizing this metric to its fullest potential, institutions can effectively address inefficiencies that arise from poor quality. Cpk serves as a statistical measure that evaluates the proximity of a particular process to its desired center limit while considering significant fluctuations. A higher Cpk score indicates that a procedure consistently performs well and produces reliable results. Conversely, a lower Cpk value suggests that the process requires improvement as it fails to meet expectations. The TRA assay test was conducted using the suggested and reported method in analysis batches of pharmaceutical products. After conducting an analysis using Minitab software, a process capability six-pack report was produced. It unequivocally confirms that the inspection techniques utilized are of the highest quality, consistently remaining within the control limits on the X bar and R charts. Furthermore, the most recent 20 subgroups reveal a homogenous and random data dispersion, almost identical to the processing core. The statistical techniques employed, including capability charts, mean probabilities, and histograms, demonstrate that the process aligns with the desired outcome. In addition, the statistical analysis shows that the Cpk values for TRA have successfully reached the acceptable cutoff point of 1.33, signifying the effectiveness of the stated and recommended methods. Based on the data presented in a and 7b, the proposed method is more precise than the reported method, as demonstrated by the higher Cpk values. The Cpk value for TRA using the suggested method was 2.37, while the Cpk value for the reported process was 2.18, as shown in a and 5b, respectively. Furthermore, provides additional evidence supporting the proposed approach, as it offers lower levels of variance, standard error, and deviation compared to previously reported techniques. Overall, these results suggest that the proposed method is superior to existing processes and has the potential to improve the accuracy and precision of future studies significantly (Citation48).
Figure 5. Process capability sixpack for (a) reported and (b) proposed techniques using Minitab18.

3.7. Evaluating the greenness of methods
3.7.1. AMVI tool
Liquid chromatography method assessment is most reliable and expertly conducted through the AMVI method. A waste generation method guarantees accurate measurements of solvent consumption and waste generated during an analytical procedure. It is necessary to perform a specific HPLC analysis to generate a standardized AMVI, as it produces reliable results. A simple and guaranteed formula is provided for calculating the total solvent consumption of the analytical technique. Including all chemicals and solvents used to prepare and analyze samples is important when calculating total solvent consumption.
Multiply the number of duplicate samples by the sum of solvents for sample preparation and UPLC to calculate the overall amount of solvent employed. Divide the total number of interest peaks by the collected solvent in a technique to calculate the AMVI value. An ecological assessment of analytical methods can be established using the following equation. Sustainable methods have a lower AMVI rating.
Liquid chromatography systems can be efficiently computed using the AMVI method. A chromatographic protocol, such as liquid chromatography, can be easily adapted to this methodology and is highly effective. Also, it is versatile enough to be used in various lab settings, making it a great tool (Citation49). Given that indicates a lower AMVI score of 372, the proposed method may be more eco-friendly.
Table 6. The AMVI evaluation of the suggested approach.
3.7.2. Analytical Eco-Scale Assessments (ESA)
After assessing its sustainability, we calculated the ecological impact of an approach using the Eco-Scale tool. Chemicals used, potential hazards, energy consumption, and waste production are all factors taken into consideration by the tool to determine a penalty score. The system has a high eco-score of 77 based on subtracting penalty points from a perfect score of 100, indicating a high ecological sustainability level. Eco-Scale classifies this system as ‘excellent green,’ which is an excellent achievement (Citation50). As shown in , the penalties are detailed.
Table 7. Points deduction for determining the ESA score using the suggested approach.
3.7.3. AGREE tool
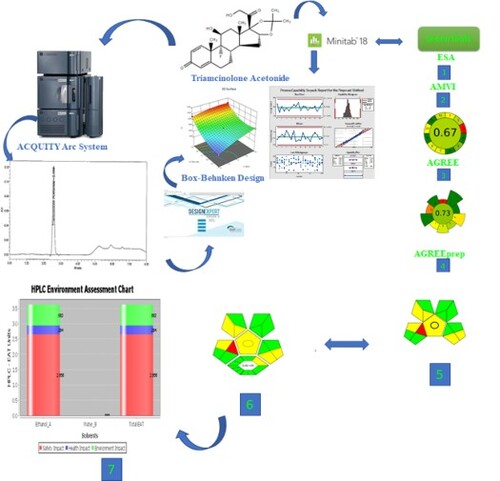
The AGREE tool offers an exceptional evaluation process that comprehensively considers sustainability, both generally and environmentally. Its foundation lies in the 12 fundamental GAC principles, each receiving a score between 0 and 1 based on its level of support for ecological sustainability. With the resulting graph displaying each standard's achievement levels in red, yellow, and green and the size of each section corresponding to the metric measured, the AGREE technique has become widely used for assessing an entity's environmental sustainability (Citation51). The 12 principles presented in Figure S3a serve as the guiding concepts for this methodology, ensuring its effectiveness in evaluating sustainability. a displays the AGREE pictogram, which signifies the idea of ecological sustainability. The central score of 0.67 is a strong indication of this sustainability concept. The shades of green in the pictogram represent the level of sustainability attained, with the color intensity varying accordingly. The AGREE pictogram is a highly effective tool for evaluating the method's sustainability.
Figure 6. (a) AGREE, (b) AGREEprep, (c) GAPI, and (d) ComplexGAPI pictograms for assessing the ‘greenness’ of the suggested approach.


3.7.4. AGREEprep tool
Sample preparation is critical to the analytical method, and acquiring strength is paramount. Our organization takes the AGREEprep metric very seriously to ensure that our sample preparation processes have a minimal negative environmental impact. This cutting-edge technique involves several evaluation steps coordinated with ecologically friendly sample preparation methods. We follow the GAC's 12 principles and adhere to the GSP's 10 criteria through the AGREEprep metric for sustainable and environmentally friendly sample preparation processes. With the AGREEprep measure, we have a breakthrough way to assess the environmental impact of various sample preparation procedures. The AGREEprep approach simplifies the sample preparation process by incorporating ten fundamental principles into the evaluation process. We found it fascinating to observe how each section's competency is assessed with a score ranging from 0 to 1, with 1 being the ideal level of performance (Citation52). The distinct graphical symbols assigned to each of the ten sectors in Figure S3b made it incredibly easy to comprehend. The practicality of the methodology for the environment is shown in Figure 6b, with a value of 0.73, which is accomplished.
3.7.5. GAPI tool
An environmental sustainability evaluation tool is an excellent way to assess suggested techniques for their potential environmental impact. The process is evaluated thoroughly, from sample preparation to final analysis, and is then categorized into green, yellow, and red levels depending on the ecological impact. These levels can also be divided into high, moderate, and low categories, making it easier to understand the overall impact of the analytical method. Using this tool, we can make educated decisions on the effects of our analytical methods on the environment and apply more environmentally friendly approaches. The GAPI methodology is a reliable and comprehensive way of assessing analytical techniques’ ecological viability, providing us with the necessary information to make informed decisions about our environmental impact (Citation53). As shown in c, the GAPI system is significantly more effective than other analytical procedures when considering all relevant factors during the analytical process. This can be attributed to its five distinguishing traits and fifteen descriptive components, all covered in the process from sample preparation to decision-making. The effectiveness of this strategy is also confirmed by its ecological implications, as shown in Figure S4a. Overall, the GAPI system is a highly effective analytical tool that can provide valuable insights into complex systems.
3.7.6. ComplexGAPI tool
The ComplexGAPI metric, depicted in Figure S4b, is a new technique that improves the traditional GAPI metric by adding a secondary hexagonal layer for pre-analysis operations. This method evaluates a range of variables such as contextual factors, reactants, solvents, compatibility with sustainable economic frameworks, instrumentation, post-reaction processing, and purification, among others. The sustainability impact of each component is assessed using a color-coded system like the GAPI method, with red, yellow, and green representing severe, moderate, and minor environmental concerns, respectively. As seen in d, this approach covers various techniques. The ComplexGAPI metric is a comprehensive and innovative way of evaluating GAC characteristics in various methodologies (Citation54).
3.7.7. HPLC-EAT
HPLC-EAT is a software application that evaluates liquid chromatographic procedures. This tool helps individuals assess the safety, environmental, and health consequences of all solvents used in the process, making it easier to make informed decisions. We were impressed to see how user-friendly and straightforward the software is to use after looking at e. However, it is essential to note that the tool focuses solely on solvents’ environmental consequences. It does not consider other aspects of GAC, such as tools, energy, and sample preparation conditions. The software uses data to provide a score, with a lower score of 3.622, as highlighted in Figure S5, indicating that the evaluated strategy is environmentally sustainable (Citation55).
3.8. Greenness assessment of the suggested approach vs. the reported
The sustainability approaches were thoroughly assessed to compare the proposed methodology with the existing literature. A summary of the results is presented in Table S1 as well as in supplementary files 2a–g. A comprehensive evaluation was conducted using seven green tools. Compared with AGREE and AGREEprep, the proposed technique produces less waste and uses ethanol as a hazardous chemical replacement. As shown in a and b, AGREE and AGREEprep pictograms exhibit a spectrum of green hues varying in intensity. Since GAPI's proposed UPLC method uses green solvent and generates less than 3 mL waste, it shows (Citation8) green, (Citation6) yellow, and (Citation1) red, as opposed to published methods (Citation31) and (Citation33), which generate much waste. This method also does not require plasma extraction, additional treatment, as in the reported method (Citation34), or special conditions for preserving, transporting, or storing samples. As shown in c, our study's results validate this approach's ecological efficiency. Due to a slightly hazardous reagent and an easy-to-follow process with a purity of over 98%, the recommended strategy outperformed the GAPI tool for the same reasons. d illustrates that each strategy encloses considerable characteristics. In evaluating methodologies involving GAC attributes, the ComplexGAPI metric offers an all-inclusive method. Based on the data analysis, the AMVI tool's proposed strategy is more promising than previously published methods. Flow rates of 0.75 mL/min, run times under 8 min, and sample preparation volumes under 100 mL are recommended when using the AMVI tool for solvent consumption UPLC. Since this method consumes more solvents for sample preparation, its AMVI score needs to catch up due to its solvent consumption HPLC value of 375 (Citation33). This method has a lower AMVI score of 372 than the more environmentally friendly method shown in Table S1. All solvents used in HPLC-EAT chromatography are evaluated for their impact on the environment, health, and safety. Analytical strategies are rated on their greenness using a green score. Table S1 illustrates that the proposed and reported methods (Citation33) have a higher environmental impact than the reported methods (Citation31, Citation34). No assumptions are made about the type of solvent used in HPLC, the preparation of samples, and the instrumentation when using the HPLC-EAT tool. In e, a lower score indicates the environmental sustainability of the strategy under study, as calculated by the software. The ESA tool scored 79 and 85, respectively, based on the first and second approaches (Citation31) and (Citation33). The scores of these methods exceeded those of the suggested and reported methods (Citation34), which scored 77 and 70, respectively. Unlike the other methods, a forced degradation investigation was included in the proposed method. Nevertheless, penalties associated with forced degradation reagents did affect the overall ESA score. However, the ESA rated the system highly for ecological sustainability, giving it a 77 out of 100. The penalty points are summarized in Table S1. Table S2 describes each UPLC technique, including the proposed method. Analyzing the developed method in comparison to other methods will provide practical insight.
4. Method validation
The approaches we proposed have been evaluated using ICH criteria. The findings show that these techniques are reliable and effective for analysts (Citation56).
4.1. Linearity and range
The calibration curve for the TRA drug was carefully created by plotting its peak area against its concentration. To achieve a wide range of 2.5–50 µg/mL, a series of dilutions were conducted from the stock solution of the TRA drug with a concentration of 500 µg/mL. presents the calibration curves closely examined to obtain regression analysis data, including the slope, intercept, and correlation coefficient R2. Furthermore, the LOD and LOQ were precisely determined using the calibration curves at low concentrations.
Table 8. Parameters for regression and validation of the suggested UPLC method.
4.2. Limit of detection (LOD) and Limit of quantification (LOQ)
The LOD and LOQ values have been determined successfully through validated Excel spreadsheets, utilizing formulas (3.3 σ/S) and (10 σ/S). These formulas play a critical role in calculating the standard deviation of the y-intercept and the slope of the calibration curve. The results of our study, displayed in , indicate an inverse relationship between the sensitivity of the proposed methodologies and the corresponding LOQ and LOD values.
4.3. Precision
We performed comprehensive intra-day and inter-day determination assessments on one and two days by preparing six determinants. These tests were carried out to determine the method's repeatability and intermediate precision. RSD = (SD*100) / mean was used to obtain the percentage of the relative standard deviation. The result was less than 2%, showing that the proposed method's precision is outstanding, as shown in .
4.4. Accuracy and recovery
Based on the experimental data in Table S3, the recovery test values for the three concentration levels of the standard analyte used in triplicate 10 μL injections indicate a high degree of agreement between actual and experimental values. This suggests that the analytical method used is reliable and accurate in determining the concentration of the analyte.
4.5. Robustness
The robustness of a methodology is measured by its ability to remain consistent even when its parameters are slightly adjusted. To test this, standards were prepared and injected after modifying drug parameters. Table S4 outlines numerous changes, such as varying the wavelength by 2 nm, adjusting the flow rate by 0.1 mL/min, column temperature change by 2°C, and altering the pH of the mobile phase by 0.2. These adjustments allowed for a thorough examination of the methodology's robustness.
4.6. System suitability
To verify that the system is appropriate, it is necessary to ensure that certain critical factors are within the specified limits. For example, the resolution between two adjacent peaks must be at least 2, while the number of theoretical plates that indicate column efficiency should be greater than 2000. Additionally, the tailing or asymmetry factor should not exceed a value of 2, as outlined in Table S5. These are all important considerations when evaluating the performance of a chromatography system.
4.7. Assay of pharmaceutical formulation
Using the UPLC technique, we evaluated the Assay test solution by creating three samples in duplicate. The results recorded in Table S6 show good assay outcomes for the examined drugs TRA in Top – Flam 15 gm Cream.
4.8. Specificity
4.8.1. Selectivity
The technique for determining TRA is highly selective and does not interfere with solvents or excipients. We conducted a thorough assessment by inserting blank samples (matrix) into the recommended UPLC system and analyzing their impact on the exciting peaks. a displays the injection of a placebo, which was performed to check that there is no significant carryover or interference with the interest peak (b) and confirm the selectivity of the proposed method.
Figure 7. Placebo (a) and degradation profiles of TRA after exposure to (b) no effect, (c) heat, (d) 30% H2O2, (e) 10 N HCl, and(f) 10 N NaOH, respectively.


4.8.2. Forced degradation
Considering the potential degradation of active pharmaceutical ingredients (APIs) over time is crucial. For instance, researchers have performed forced degradation on API to assess its stability and potential degradation after administration. This study analyzes various types of degradation, such as oxidative, basic hydrolysis, acid and thermal degradation. It is essential to comprehend these factors to ensure the safety and effectiveness of the drug. In UPLC tests, all degradation peaks were separated from the parent peak with a purity angle less than the purity threshold, as provided in Table S7, revealing that each peak was pure.
4.8.2.1. Thermal degradation
The thermal degradation process for the TRA drugs involved reflux in a water bath at 70 °C for two hours. The resulting solutions were injected against the blank to achieve a 10 µg/mL concentration, as illustrated in c. The obtained results demonstrated the established method's specificity to the API even in the presence of their degradation products, with no interference detected. We can find the complete results of the previous stress investigations in Table S7.
4.8.2.2. Oxidative degradation
After preparing two 100 mL volumetric flasks containing 1 mg of pure TRA, we filled them with 30 mL of 30% H2O2 each. We left both flasks in the dark for 24 h. Then, we completed both flasks to the mark using the diluent so that the final concentration of each flask was also 10 µg/mL. Finally, we injected the final solutions of TRA against the diluent. d shows the TRA degradation profiles using 30% H2O2.
4.8.2.3. Acid hydrolysis
The samples were neutralized after subjecting two round bottom flasks containing 10 mg of TRA to 5 mL of 10 N HCl and soaking them in a water bath set at 70°C for three hours using a diluted 10 N NaOH solution. The final concentration of the TRA drug in the solvent was established at 10 µg/mL. The final solution was then injected against the blank. e shows the degradation profile of the TRA drug in 10 N HCl.
4.8.2.4. Basic hydrolysis
To ensure accurate results, it is crucial to repeat the steps taken during the acid hydrolysis. Instead of using 10 N HCl, we used 5 mL of 10 N NaOH. Before injecting the final dose (10 µg/mL) against the blank, we neutralized both samples using 10 N HCl. For a clear visualization of the TRA degradation profiles in 10 N NaOH, refer to f.
5. Conclusion
In the current study, we evaluated the greenness of the validated chromatographic procedures using six different greenness assessment tools. These tools included the analytical eco-scale, AMVI, HPLC-EAT, AGREE, AGREEprep, GAPI, and ComplexGAPI. The effectiveness of the existing process was also evaluated using the Lean Six Sigma methodology, which utilized the process capability index. The results indicate that the suggested approach is highly cost-effective and sustainable. BBD and RSM were employed with the least permitted experimental runs to adjust the chromatographic conditions to achieve the lowest retention time, acceptable tailing factor, and high theoretical plate for the TRA drug. Ethanol is a good choice for a solvent due to its safety and environmental benefits. UPLC is an excellent tool for green chemistry to reduce analysis times and minimize waste production. This approach is commendable for any lab that values sustainability and safety. The assay has proven its accuracy in detecting and quantifying the targeted pharmaceuticals while maintaining selectivity and sensitivity, even in byproducts that have undergone degradation. Additionally, there was no interaction between the principal peak and their degradants.
Supplemental Material
Download MS Word (1.1 MB)Acknowledgments
The authors extend their appreciation to the Deputyship for Research and Innovation, Ministry of Education in Saudi Arabia for funding this research work through the project number 445-9-666.
Disclosure statement
No potential conflict of interest was reported by the author(s).
Additional information
Funding
References
- Dharuman, N.; Lakshmi, K.S.; Krishnan, M. Environmental Benign RP-HPLC Method for the Simultaneous Estimation of Anti-Hypertensive Drugs Using Analytical Quality by Design. Green Chem. Lett. Rev 2023, 16, 2214176. doi:10.1080/17518253.2023.2214176.
- Kokilambigai, K.S.; Lakshmi, K.S. Analytical Quality by Design Assisted RP-HPLC Method for Quantifying Atorvastatin with Green Analytical Chemistry Perspective. J. Chromatogr. Open 2022, 2, 100052. doi:10.1016/j.jcoa.2022.100052.
- Mohamed, M.A. Stability-Indicating New RP-UPLC Method for Simultaneous Determination of a Quaternary Mixture of Paracetamol, Pseudoephedrine, Chlorpheniramine, and Sodium Benzoate in (Cold–Flu) Syrup Dosage Form. J. AOAC Int 2022, 105, 703–16. doi:10.1093/jaoacint/qsac002.
- Imam, M.S.; Abdelrahman, M.M. How Environmentally Friendly is the Analytical Process? A Paradigm Overview of ten Greenness Assessment Metric Approaches for Analytical Methods. Trends Environ. Anal. Chem 2023, 38, 00202. doi:10.1016/j.teac.2023.e00202.
- Czyrski, A.; Sznura, J. The Application of Box-Behnken-Design in the Optimization of HPLC Separation of Fluoroquinolones. Sci. Rep. 2019, 9, 19458. doi:10.1038/s41598-019-55761-z.
- Al-Kadhi, N.S.; Mohamed, M.A.; Ahmed, H.A.; Nassar, H.F. Facile Synthesis and eco-Friendly Analytical Methods for Concurrent Estimation of Selected Pharmaceutical Drugs in Their Solutions: Application to Quality by Design, Lean six Sigma, and Stability Studies. BMC Chem 2023, 17, 136. doi:10.1186/s13065-023-01028-8.
- Zolgharnein, J.; Shahmoradi, A.; Ghasemi, J.B. Comparative Study of Box-Behnken, Central Composite, and Doehlert Matrix for Multivariate Optimization of Pb (II) Adsorption Onto Robinia Tree Leaves. J Chemometr 2013, 27, 12–20. doi:10.1002/cem.2487.
- Bezerra, M.A.; Santelli, R.E.; Oliveira, E.P.; Villar, L.S.; Escaleira, L.A. Response Surface Methodology (RSM) as a Tool for Optimization in Analytical Chemistry. Talanta 2008, 76, 965–977. doi:10.1016/j.talanta.2008.05.019.
- Mohamed, M.A. Simultaneous Quantification of Cephalexin and Sodium Benzoate in Their Dosage Forms by High Analytical Technique. Application of Lean Six Sigma and In-Vitro Dissolution Studies. Ann. Pharm. Fr 2021, 79, 152–169. doi:10.1016/j.pharma.2020.09.006.
- Peng, S.; Li, Y. Pharmacological Effects and Clinical Application of Triamcinolone Acetonide. New Chin. Med 2001, 32, 45–6.
- British Pharmacopoeia Stationery Office. Medicines, and Healthcare Products Regulatory Agency. 2023; 2.
- U.S. Pharmacopoeia. United States Pharmacopoeia Convention Inc. 2023; 43.
- Sudsakorn, S.; Kaplan, L.; Williams, D.A. Simultaneous Determination of Triamcinolone Acetonide and Oxymetazoline Hydrochloride in Nasal Spray Formulations by HPLC. J. Pharm. Biomed. Anal 2006, 40, 1273–1280. doi:10.1016/j.jpba.2005.09.018.
- Van Heugten, A.J.; De Boer, W.; de Vries, W.S.; Markesteijn, C.M.; Vromans, H. Development and Validation of a Stability-Indicating HPLC-UV Method for the Determination of Triamcinolone Acetonide and its Degradation Products in an Ointment Formulation. J. Pharm. Biomed. Anal 2018, 149, 265–270. doi:10.1016/j.jpba.2017.11.026.
- Matysova, L.; Hajkova, R.; Šícha, J.; Solich, P. Determination of Methylparaben, Propylparaben, Triamcinolone Acetonide and its Degradation Product in a Topical Cream by RP-HPLC. Anal. Bioanal. Chem. 2003, 376, 440–443. doi:10.1007/s00216-003-1756-x.
- de LT Vieira, M.; Singh, R.P.; Derendorf, H. Simultaneous HPLC Analysis of Triamcinolone Acetonide and Budesonide in Microdialysate and rat Plasma: Application to a Pharmacokinetic Study. J. Chromatogr. B 2010, 878, 2967–2973. doi:10.1016/j.jchromb.2010.08.048.
- Khan, M.S.; Ravi, P.R.; Mullapudi, T.V. Dose Identification of Triamcinolone Acetonide for Noninvasive pre-Corneal Administration in the Treatment of Posterior Uveitis Using a Rapid, Sensitive HPLC Method with Photodiode-Array Detector. Biomed. Chromatogr 2022, 36, e5264. doi:10.1002/bmc.5264.
- Baker, M.M.; Belal, T.S.; Mahrous, M.S.; Ahmed, H.M.; Daabees, H.G. A Validated Stability-Indicating HPLC-DAD Method for Simultaneous Determination of Econazole Nitrate, Triamcinolone Acetonide, Benzoic Acid and Butylated Hydroxyanisole in Cream Dosage Form. Anal. Methods 2016, 8, 2185–2200. doi:10.1039/C5AY02746B.
- Fernandes-Cunha, G.M.; Saliba, J.B.; Siqueira, R.C.; Jorge, R.; Silva-Cunha, A. Determination of Triamcinolone Acetonide in Silicone oil and Aqueous Humor of Vitrectomized Rabbits’ Eyes: Application for a Pharmacokinetic Study with Intravitreal Triamcinolone Acetonide Injections (Kenalog® 40). J. Pharm. Biomed. Anal 2014, 89, 24–27. doi:10.1016/j.jpba.2013.10.025.
- Elsharkawy, L.; Hegazy, M.A.; Elgendy, A.E.; Ahmed, R.M. Experimental Design Approach for Development of HPLC Method for Simultaneous Analysis of Triamcinolone, Nystatin, and Gramicidin in Industrial Wastewater. Separations 2023, 10, 342. doi:10.3390/separations10060342.
- Anwar, M.S.; Khan, A.; Khan, I.; Khan, S.A.; Ahmad, L.; Kaleem, W.A.; Mahzari, A.; Al-Megrin, W.A.; Almatroudi, A.; Allemailem, K.S.; Khan, F.U. Evaluation of Marketed Herbal Medicines for the Simultaneous Estimation of Steroidal Adulterants Using FTIR and RP-HPLC-UV. Microchem. J 2023, 190, 108745. doi:10.1016/j.microc.2023.108745.
- Sophian, A. Development and Validation of HPLC-Photodiode Array Method for Detecting Steroids in Skin Whitening Products Simultaneously. Indonesian J. Pharm 2023, 34, 120–127. doi:10.22146/ijp.3530.
- Ivković, B.; Crevar, M.; Cvetanović, A.; Ubavkić, K.; Marković, B. Development and Validation of RP-HPLC Method for Quantification of Trace Levels of Topical Corticosteroids in Ambiphilic Cream. Acta Chromatogr 2023, 35, 46–51. doi:10.1556/1326.2021.00998.
- Denizhan, N.; Yilmaz, S.; Sağlikoğlu, G.; Kilinç, E.; Yengin, Ç; Der, F.G. Electrochemical and Liquid Chromatographic Analysis of Triamcinolone Acetonide in Pharmaceutical Formulations. TurkJAC 2022, 4, 59–66. doi:10.51435/turkjac.1132742.
- Neal, S.P.; Wilson, K.M.; Velosa, D.C.; Chouinard, C.D. Targeted Glucocorticoid Analysis Using ion Mobility-Mass Spectrometry (IM-MS). J. Mass Spectrom. Adv. Clin. Lab 2022, 24, 50–56. doi:10.1016/j.jmsacl.2022.03.003.
- Yao, Q.; Guo, Y.; Xue, J.; Kong, D.; Li, J.; Tian, X.; Hao, C.; Zhou, T. Development and Validation of a LC-MS/MS Method for Simultaneous Determination of six Glucocorticoids and its Application to a Pharmacokinetic Study in Nude Mice. J. Pharm. Biomed. Anal 2020, 179, 112980. doi:10.1016/j.jpba.2019.112980.
- Chang, C.W.; Huang, T.Y.; Tseng, Y.C.; Chang-Chien, G.P.; Lin, S.F.; Hsu, M.C. Positive Doping Results Caused by the Single-Dose Local Injection of Triamcinolone Acetonide. Forensic Sci. Int 2014, 244, 1–6. doi:10.1016/j.forsciint.2014.07.024.
- Nam, Y.S.; Kwon, I.K.; Lee, Y.; Lee, K.B. Quantitative Monitoring of Corticosteroids in Cosmetic Products Manufactured in Korea Using LC–MS/MS. Forensic Sci. Int 2012, 220, e23–8. doi:10.1016/j.forsciint.2011.12.011.
- Matabosch, X.; Pozo, O.J.; Papaseit, E.; Farré, M.; Marcos, J.; Segura, J.; Ventura, R. Detection and Characterization of Triamcinolone Acetonide Metabolites in Human Urine by Liquid Chromatography/tandem Mass Spectrometry After Intramuscular Administration. Rapid Commun. Mass Spectrom 2014, 28, 1829–1839. doi:10.1002/rcm.6965.
- Gineys, N.; Giroud, B.; Vulliet, E. Analytical Method for the Determination of Trace Levels of Steroid Hormones and Corticosteroids in Soil, Based on PLE/SPE/LC-MS/MS. Anal. Bioanal. Chem. 2010, 397, 2295–2302. doi:10.1007/s00216-010-3787-4.
- Nováková, L.; Matysová, L.; Solich, P. Advantages of Application of UPLC in Pharmaceutical Analysis. Talanta 2006, 68, 908–918. doi:10.1016/j.talanta.2005.06.035.
- Doty, A.C.; Zhang, Y.; Weinstein, D.G.; Wang, Y.; Choi, S.; Qu, W.; Mittal, S.; Schwendeman, S.P. Mechanistic Analysis of Triamcinolone Acetonide Release from PLGA Microspheres as a Function of Varying in Vitro Release Conditions. Eur. J. Pharm. Biopharm. 2017, 113, 24–33. doi:10.1016/j.ejpb.2016.11.008.
- Oliva, A.; Monzón, C.; Santoveña, A.; Fariña, J.B.; Llabrés, M. Development of an Ultra High Performance Liquid Chromatography Method for Determining Triamcinolone Acetonide in Hydrogels Using the Design of Experiments/Design Space Strategy in Combination with Process Capability Index. J. Sep. Sci. 2016, 39, 2689–2701. doi:10.1002/jssc.201600273.
- Pengfei, Z.; Qi, Y. Development of a UPLC-ESI-MS/MS Method for the Determination of Triamcinolone Acetonide in Human Plasma and Evaluation of its Bioequivalence After a Single Intramuscular Injection in Healthy Volunteers. Front. Pharmacol 2023, 14, 1223112. doi:10.3389/fphar.2023.1223112.
- Kim, N.S.; Yoo, G.J.; Lee, J.H.; Park, H.J.; Cho, S.; Shin, D.W.; Kim, Y.; Baek, S.Y. Determination of 43 Prohibited Glucocorticoids in Cosmetic Products Using a Simultaneous LC-MS/MS Method. Anal. Methods 2017, 9, 2104–2115. doi:10.1039/C6AY03065C.
- Nan, K.; Sun, S.; Li, Y.; Qu, J.; Li, G.; Luo, L.; Chen, H.; Cheng, L. Characterisation of Systemic and Ocular Drug Level of Triamcinolone Acetonide Following a Single sub-Tenon Injection. Br. J. Ophthalmol. 2010, 94, 654–658. doi:10.1136/bjo.2009.172106.
- Liu, H.; Yang, M.; Wu, P.; Guan, J.; Men, L.; Lin, H.; Tang, X.; Zhao, Y.; Yu, Z. Simultaneous Determination of Triamcinolone Acetonide Palmitate and Triamcinolone Acetonide in Beagle dog Plasma by UPLC-MS/MS and its Application to a Long-Term Pharmacokinetic Study of Triamcinolone Acetonide Palmitate Lipid Emulsion Injection. J. Pharm. Biomed. Anal 2015, 104, 105–111. doi:10.1016/j.jpba.2014.11.028.
- Sun, W.; Ho, S.; Fang, X.R.; O’Shea, T.; Liu, H. Simultaneous Determination of Triamcinolone Hexacetonide and Triamcinolone Acetonide in Rabbit Plasma Using a Highly Sensitive and Selective UPLC–MS/MS Method. J. Pharm. Biomed. Anal 2018, 153, 267–273. doi:10.1016/j.jpba.2018.02.052.
- Houtman, C.J.; Ten Broek, R.; Brouwer, A. Steroid Hormonal Bioactivities, Culprit Natural and Synthetic Hormones and Other Emerging Contaminants in Waste Water Measured Using Bioassays and UPLC-tQ-MS. Sci. Total Environ 2018, 630, 1492–1501. doi:10.1016/j.scitotenv.2018.02.273.
- Herrero, P.; Borrull, F.; Marcé, R.M.; Pocurull, E. Pressurised Liquid Extraction and Ultra-High Performance Liquid Chromatography-Tandem Mass Spectrometry to Determine Endogenous and Synthetic Glucocorticoids in Sewage Sludge. Talanta 2013, 103, 186–193. doi:10.1016/j.talanta.2012.10.030.
- Mahmoud, O.A.; Omran, A.A.; Binsaleh, A.Y.; Almalki, M.A.; Mohamed, M.A. Chromatographic Techniques for Assessment of Bisoprolol Fumarate and Perindopril Arginine in Solid Formulations Under Various Stress Conditions and Application to Six Sigma, Content Uniformity, and Comparative Dissolution Approaches. J. AOAC Int. 2023, 1–15. doi:10.1093/jaoacint/qsad077.
- Czyrski, A.; Sznura, J. The Application of Box-Behnken-Design in the Optimization of HPLC Separation of Fluoroquinolones. Sci. Rep. 2019, 9, 19458. doi:10.1038/s41598-019-55761-z.
- Ekpenyong, M.; Antai, S.; Asitok, A.; Ekpo, B. Response Surface Modeling and Optimization of Major Medium Variables for Glycolipopeptide Production. Biocatal. Agric. Biotechnol 2017, 10, 113–121. doi:10.1016/j.bcab.2017.02.015.
- Ameeduzzafar; El-Bagory, I.; Alruwaili, N.K.; Imam, S.S.; Alomar, F.A.; Elkomy, M.H.; Ahmad, N.; Elmowafy, M. Quality by Design (QbD) Based Development and Validation of Bioanalytical RP-HPLC Method for Dapagliflozin: Forced Degradation and Preclinical Pharmacokinetic Study. J. Liq. Chromatogr. Relat. Technol 2020, 43, 53–65. doi:10.1080/10826076.2019.1667820.
- Elkady, E.F.; Fouad, M.A.; Mozayad, A.N. Application of Box-Behnken Experimental Design and Response Surface Methodology for Selecting the Optimum RP-HPLC Conditions for the Simultaneous Determination of Methocarbamol, Indomethacin and Betamethasone in Their Pharmaceutical Dosage Form. BMC Chem 2022, 16, 114. doi:10.1186/s13065-022-00908-9.
- Harish, V.; Almalki, W.H.; Alshehri, A.; Alzahrani, A.; Gupta, M.M.; Alzarea, S.I.; Kazmi, I.; Gulati, M.; Tewari, D.; Gupta, G.; Dua, K. Quality by Design (QbD) Based Method for Estimation of Xanthohumol in Bulk and Solid Lipid Nanoparticles and Validation. Molecules 2023, 28, 472. doi:10.3390/molecules28020472.
- Ibrahim, A.M.; Hendawy, H.A.M.; Hassan, W.S.; Shalaby, A.; El-sayed, H.M. Six Sigma Quality Approach for HPLC-UV Method Optimization. Microchem. J 2019, 144, 303–308. doi:10.1016/j.microc.2018.09.023.
- Hartman, R.; Helmy, R.; Al-Sayah, M.; Welch, C.J. Analytical Method Volume Intensity (AMVI): A Green Chemistry Metric for HPLC Methodology in the Pharmaceutical Industry. Green Chem. 2011, 13, 934–939. doi:10.1039/C0GC00524J.
- El-Maghrabey, M.H.; Sivasankar, V.; El-Shaheny, R.N., Eds. Green Chemical Analysis and Sample Preparations; Springer Nature: London, UK, 2022.
- Gałuszka, A.; Migaszewski, Z.M.; Konieczka, P.; Namieśnik, J. Analytical Eco-Scale for Assessing the Greenness of Analytical Procedures. TrAC, Trends Anal. Chem 2012, 37, 61–72. doi:10.1016/j.trac.2012.03.013.
- Kowtharapu, L.P.; Katari, N.K.; Sandoval, C.A.; Rekulapally, V.K.; Jonnalagadda, S.B. Green Chromatographic Method for Determination of Active Pharmaceutical Ingredient, Preservative, and Antioxidant in an Injectable Formulation: Robustness by Design Expert. ACS Omega 2022, 7, 34098–34108. doi:10.1021/acsomega.2c03387.
- Wojnowski, W.; Tobiszewski, M.; Pena-Pereira, F.; Psillakis, E. AGREEprep–Analytical Greenness Metric for Sample Preparation. TrAC, Trends Anal. Chem 2022, 149, 116553. doi:10.1016/j.trac.2022.116553.
- Płotka-Wasylka, J. A new Tool for the Evaluation of the Analytical Procedure: Green Analytical Procedure Index. Talanta 2018, 181, 204–209. doi:10.1016/j.talanta.2018.01.013.
- Płotka-Wasylka, J.; Wojnowski, W. Complementary Green Analytical Procedure Index (ComplexGAPI) and Software. Green Chem. 2021, 23, 8657–8665. doi:10.1039/D1GC02318G.
- Gaber, Y.; Törnvall, U.; Kumar, M.A.; Amin, M.A.; Hatti-Kaul, R. HPLC-EAT (Environmental Assessment Tool): A Tool for Profiling Safety, Health and Environmental Impacts of Liquid Chromatography Methods. Green Chem. 2011, 13, 2021–2025. doi:10.1039/C0GC00667J.
- ICH Harmonized Tripartite Guideline. Validation of Analytical Procedures: Text and Methodology Q2 (R1). Current Step 2005, 4, 1–17.