
ABSTRACT
The distribution of traditional breeding dens on the Varanger Peninsula (70–71°N) in northernmost Fennoscandia indicates that this area once harboured a large Arctic fox population. Early 20th century naturalists regarded the coastal tundra of the Fennoscandian Low Arctic to be a stronghold for the species. At the start of our research in 2004, however, the local Arctic fox population was critically small and most neighbouring populations had been extirpated. Here, we synthesize the results of 11 years of research to highlight ecosystem drivers behind the critical state of the Arctic fox in Low-Arctic Fennoscandia. We identify two fundamental drivers: (1) an increasingly climate-driven irregularity of the lemming cycle and (2) a management- and climate-driven increase in the abundance of red fox that is subsidized by more ungulate carrion. Arctic fox reproductive success is low when lemmings are scarce (despite high vole abundance), while red foxes exclude Arctic foxes from high-quality breeding territories in summer and from marine and terrestrial carrion in winter. Red fox culling on Varanger Peninsula may have prevented the extirpation of the Arctic fox population. However, one decade after the onset of this management action the Arctic fox population has failed to increase either because the action has been insufficient or because demographic and environmental stochasticity has precluded a positive response. We discuss options for future research and management of the Arctic fox in the Fennoscandian Low Arctic.
Introduction
The Arctic fox (Vulpes lagopus) is distributed across the Arctic tundra – a biome vast in its areal extent and heterogeneous in its climate and ecosystem states (Ims, Ehrich et al. Citation2013). How the Arctic fox relates to this heterogeneity per se is a question fundamental to our understanding of how this species will cope with future climate change. In particular, ecosystem-based studies at the bioclimatic margin of the Arctic tundra could make valuable contributions (Holt & Keitt Citation2005).
In this paper, we synthesize the results from a 11-year study focused on the Arctic fox and its ecosystem at the Varanger Peninsula, in northernmost Fennoscandia. Located at 70–71°N 30°E, the Varanger Peninsula and the adjacent Nordkinn Peninsula form the western fringe of the extensive Eurasian Arctic tundra. Tundra habitats also extend further south-west along the Scandes mountain chain, where all other Arctic fox studies in Fennoscandia are conducted (Berteaux et al. Citation2017). The Scandes mountain tundra, however, is not defined as proper Arctic (Walker et al. Citation2005) because it is located south of the Arctic tree line and embedded in boreal forest. In most ecological respects, the mountain tundra is similar to its Low-Arctic counterpart, except that the tundra in the Low Arctic is surrounded by marine ecosystems. This is likely to affect the Arctic fox because the marine ecosystem yields resources for terrestrial predators such as foxes (e.g., Roth Citation2002; Roth Citation2003; Killengreen et al. Citation2011; Killengreen et al. Citation2012; Ehrich et al. Citation2015).
Located at the western margin of the Eurasian Arctic, the Varanger Peninsula differs in some respects from other coastal Arctic tundra. Relative to its latitude, the winter climate on the Varanger Peninsula is mild. Therefore, in the context of future climate change, the present states of the climate, the ecosystem and the Arctic fox population on the Varanger Peninsula may help to forecast the situation in other Arctic regions.
Our research on the Varanger Peninsula was initiated in 2004 as part of the Norwegian Environment Agency’s Arctic fox conservation programme. Early 20th century zoologists regarded Finnmark as the stronghold of the Arctic fox in Norway, partly owing to the influence of marine subsidies (see Hersteinsson & Macdonald Citation1992 for a review). At the turn of the last millennium, after an almost century long decline of the Arctic fox in Fennoscandia, regional extirpation was deemed likely and new research and management efforts were urgently needed (Angerbjörn et al. Citation2013). The Arctic fox was already gone from large parts of its former range in the Scandes mountain tundra. A lack of research and monitoring had left the situation for the Arctic fox in Finnmark, the northernmost county of Norway and the county that encompasses the Varanger Peninsula, unclear.
In agreement with the Norwegian Environment Agency, our aims for the Arctic Fox in Finnmark project were: (1) to document the state of the Arctic fox population (abundance and distribution) in eastern Finnmark – Varanger and Nordkinn peninsulas as well as the adjacent mountain tundra of Laksefjordvidda to the south; (2) to study the structure and dynamics of ecosystem components likely to affect the Arctic fox, i.e., food resources and competitors; and (3) to assess whether the management action of culling red foxes (Vulpes vulpes) on the Varanger Peninsula released the Arctic fox from the competitive pressure from its larger congener (Elmhagen et al. Citation2017).
We here focus on the ecosystem perspective (aim 2) of the Arctic Fox in Finnmark project. This perspective has also been strengthened by means of three other research projects that included the Varanger Peninsula, namely EcoFinn during 2005–2012 (i.e., Henden et al. Citation2014), Arctic Predators during 2007–2011 (i.e., Ehrich et al. Citation2015) and the ongoing Climate-ecological Observatory for Arctic Tundra (Ims, Jepsen et al. Citation2013).
Ecosystem structure
Bioclimatic zones and ecological communities
Bordering the ice-free, southern section of the Barents Sea, the coastal lowlands of the Varanger Peninsula have annual average temperatures above zero (0–2°C), while the peninsula’s interior, with highlands rising to 600 m above sea level, has below-zero annual temperatures (−3 to 0°C) (Ims, Jepsen et al. Citation2013; Hanssen-Bauer & Tveito Citation2014) and sporadic permafrost (Farbrot et al. Citation2013; Isaksen Citation2014). The northern and eastern coastal lowlands, as well as the interior highlands, have mean July temperatures ≤ 10°C and belong to the bioclimatic tundra zone E (Walker et al. Citation2005), while the south-western lowlands have 11–13°C July means and are forested by mountain birch (Betula pubescens; ). Wetlands (bogs and mires) are present, but not extensive. There are also relatively few lakes and ponds on the Varanger Peninsula.
The most extensive tundra plant community is dwarf-shrub heath (Killengreen et al. Citation2007; Ravolainen et al. Citation2010). Local variation in bedrock and topography creates considerable climatic and edaphic gradients over short distances that lead to a spatial mosaic of vegetation types (Ravolainen et al. Citation2010). The most productive vegetation types – thickets of tall willow shrubs and lush meadow vegetation – are at the bottom of the main riparian valleys (Ravolainen et al. Citation2011; Ravolainen et al. Citation2013; Ravolainen et al. Citation2014). In contrast, large portions of the inland highlands (above 350–450 m asl) are low-productive barrens sparsely covered with prostrate vascular plants and cryptogams (Ims, Jepsen et al. Citation2013).
Steep climatic gradients (Karlsen et al. Citation2005), the high diversity of vegetation types/habitats within the tundra, and the proximity of forested and marine ecosystems give rise to a rather complex tundra food web comprising a mixture of boreal and Arctic species (). Along the coastline, there are also some abundant marine species (colonial seabirds and littoral vertebrate and invertebrate species) as well as supplies of animal carrion from the open sea. Waterfowl breeding in limnic wetlands, such as ducks and geese, are only locally common (Strann & Ims Citation2014). Below, we describe the herbivores and carnivores in the terrestrial food web () that are likely to influence the Arctic fox population on the Varanger Peninsula.
Figure 1. Map of eastern Finnmark showing the baited camera stations on the Varanger Peninsula (dots), the Nordkinn Peninsula (squares and stars for outer and inner Nordkinn Peninsula, respectively) and Laksefjordvidda (triangles). Small rodent trapping plots are denoted with white squares. The locations of three areas where breeding of avian predators in summer and snow tracks of mammals in winter were surveyed are shown as hatched areas. The distribution of Arctic fox dens is shown as grey shadings by means of density kernels (created using a quadratic kernel function in ArcGIS 10.2.2. Sub-Arctic forest is shown as dark green areas.
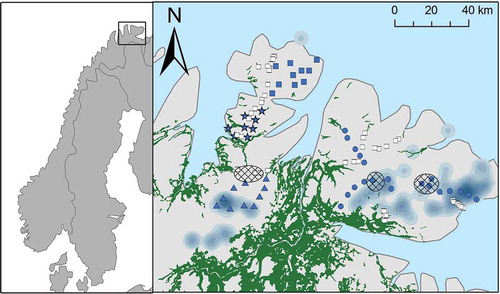
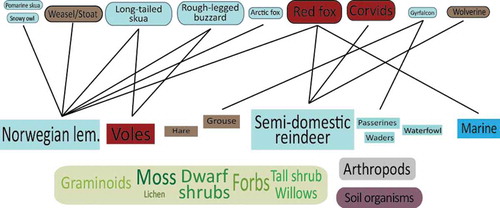
Figure 2. Depiction of the main components of plant-based vertebrate food webs on the Varanger Peninsula (modified from Ims, Ehrich et al. Citation2013). The size of the boxes reflects our current knowledge about the relative functional importance of the different species and functional groups. Only major trophic relationships are represented by lines. For vertebrates, mainly boreal forest species are shown in red, species found in both boreal forest and Arctic tundra are shown in brown, while typically Arctic tundra species are shown in pale blue.
Herbivores
By monitoring the small rodent populations in eastern Finnmark () by means of small quadrat trappings in early summer and fall (Killengreen et al. Citation2007) and snow tracking in winter (Killengreen et al. Citation2013), we have established that there are three functionally important small rodent species on the Varanger Peninsula (Killengren et al. Citation2007; Henden, Ims, Yoccoz, Sørensen et al. Citation2011; Ravolainen al. Citation2014). The grey-sided vole (Myodes rufocanus; maximum body mass 55 g) is the most abundant species in the extensive dwarf-shrub heaths, while the tundra vole (Microtus oeconomus; maximum body mass 90 g) is the most abundant species in the spatially restricted riparian grassland and Salix shrub habitats. The Norwegian lemming (Lemmus lemmus; maximum body mass 100 g) occurs in most habitats during its population outbreaks, but its abundance increases with altitude (Ims et al. Citation2011). One aspect of the rodents’ winter ecology, potentially important to foxes, is evident from our snow tracking in late March. In the peak and crash phase of the rodent cycle, we have observed substantial movement of lemmings on the snow surface (up to an average of >10 crossing tracks per km/day), while we did not usually observe vole tracks, despite a clear numerical dominance of voles in the trap samples during the preceding fall and subsequent summer (Killengreen et al. Citation2011).
Willow ptarmigans (Lagopus lagopus) and mountain hares (Lepus timidus) are mostly restricted to riparian habitats with tall willow shrubs (Henden, Ims, Yoccoz & Killengreen et al. Citation2011). Such habitats form a very small fraction of the tundra landscape, which is probably one reason why these medium-sized herbivores are much less abundant on the Varanger Peninsula than they are further east in the Eurasian low Arctic (Ehrich et al. Citation2012).
Besides the small rodents, semi-domestic reindeer (Rangifer tarandus) is the functionally most important herbivore on the Varanger Peninsula, with a total population size in the range of 12 000–17 000 individuals during our project (Reindeer Husbandry and Carnivores Citation2016). Over the last decades, reindeer have increased across Finnmark County (Hausner et al. Citation2011). Like most reindeer in the Arctic, the Varanger herds migrate seasonally between coastal tundra (summer pastures) and inland sub-Arctic forests (winter pastures). While most reindeer migrate to winter pastures south of the peninsula in November/December, where they stay until late April, a fraction of the population remains on the Varanger Peninsula during the winter (Henden et al. Citation2014). In some winters, these winter-resident reindeer amount to several thousand individuals. According to the herders, climate change and the areal restriction of winter pastures have contributed to increase the number of winter-resident reindeer on the Varanger Peninsula in recent years. Although we cannot quantify the mortality rate of winter-resident reindeer, it is expected to be particularly high because of the low winter forage (lichens) availability and unfavourable snow conditions (Tveraa et al. Citation2007; Tveraa et al. Citation2013). Furthermore, our analysis of red fox diets (see below) indicates that substantial amounts of reindeer carrion are available to carnivores during most winters on the Varanger Peninsula. Steeply increasing in abundance, moose (Alces alces) is another ungulate that has probably gained importance as a carrion resource to the red fox. About 1200–1500 moose reside on the Varanger Peninsula (Ims, Jepsen et al. Citation2013), mostly in the forests and forest–tundra transition zones in the peninsula’s south-western corner ().
Carnivores
The Arctic fox on Varanger Peninsula belongs to two functional groups – guilds – of carnivores (). One group is scavengers on reindeer carrion in winter. The other functional group consists of rodent specialists that mostly breed in peak years of the rodent cycle.
We have monitored the spatial and temporal dynamics of the scavenger guild every winter since 2005 with an extensive system of carrion-baited camera-trap stations along gradients from the sea and forest to the interior of the coastal peninsulas and the Laksefjordvidda mountain tundra (). Ranked in order of descending occurrence (Henden et al. Citation2014), the species within the scavenger guild utilizing reindeer carrion in winter are: common raven (Corvus corax), red fox, wolverine (Gulo gulo), golden eagle (Aquila chrysaetos), white-tailed eagle (Haliaeetus albicilla), hooded crow (Corvus cornix) and Arctic fox. The wolf (Canis lupus) has been absent for many decades (Tveraa et al. Citation2007). Scavenger species richness declines with increasing distance from sub-Arctic forests, mainly due to declining frequency of eagles and hooded crows (Killengreen et al. Citation2012).
A particular important aspect of the camera-trap monitoring is that it allows us to assess the relative proportions of the two fox species in time and space. In 2005, the first winter of the project, no Arctic fox appeared at our 48 camera-trap stations, whereas red foxes were recorded at 80% of the stations (Fig. 3). However, every winter since 2006, we have recorded Arctic foxes at a proportion of the camera-trap stations on the Varanger Peninsula (). Outside the Varanger Peninsula, Arctic foxes have only been recorded during two winters on Laksefjordvidda (and only at two camera-trap stations). On the Nordkinn Peninsula, where the species was breeding during the 1990s (Frafjord & Krempig Citation2001), no Arctic fox was recorded at any of the 18 camera-trap stations.
Figure 3. (a) Time series of Arctic fox and red fox occupancy rates based on baited camera-trap stations on the Varanger Peninsula, where red fox culling took place, and Laksefjordvidda (100 km to the south-west of Varanger Peninsula; see ), without culling. The estimates are obtained from occupancy models for which true absence from camera stations can be distinguished from non-detection by incorporating presence/absence and detection/non-detection as two distinct components in the model (Henden et al. Citation2014). We allowed the detection probabilities to vary between years. (b) The number of red foxes culled by field inspectors of the Norwegian Environment Agency and volunteers.
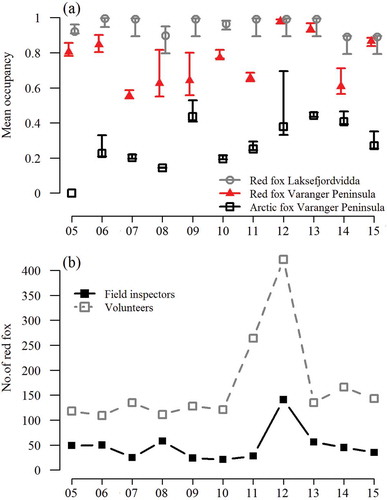
Throughout the project period, Arctic fox occupancy rates at the camera stations on the Varanger Peninsula have always been substantially lower than those of the red fox (). Compared to the Varanger Peninsula, red fox occupancy rates on the Laksefjordvidda mountain tundra have mostly been higher and exhibited less inter-annual variability (). It is likely that the more temporally variable occupancy rate of red foxes on the Varanger Peninsula is the result of the red fox culling programme. This programme was initiated in 2005 and as of 2016 2355 red foxes have been culled (). Field inspectors from the Norwegian Environment Agency cull red foxes mainly in the interior of the peninsula by means of snowmobiles in March–April, while local people hunt red foxes mainly along the coast in all seasons. The culling programme has not included the Nordkinn Peninsula and Laksefjordvidda.
Analysis of DNA extracted from the yearly collection of scats sampled at dens in late winter/spring since 2008 has yielded population estimates for Arctic fox on the Varanger Peninsula in the range 3–21 individuals (). The stark numerical dominance of the red fox over the Arctic fox is illustrated by the year 2012 when the populations of both fox species peaked after the distinct lemming peak in 2011 (,). However, while the population size estimate for the Arctic fox was 20 individuals (), 561 red foxes were culled. In contrast, Brodkorp (1914) reported 95% Arctic foxes in a batch of 300 foxes shot on the Varanger Peninsula during the winter 1880/81. Since the two fox species were not distinguished in subsequent harvest statistics from Finnmark (Henden, Ims et al. Citation2009), we do not know the exact timing of the shift in the dominance of the two fox species. According to local people, however, the Arctic fox was commonly seen in eastern Finnmark until approximately 1980, after which observations became very rare.
Table 1. Annual population size estimates and the underlying sample statistics for the Arctic fox on the Varanger Peninsula based on DNA extracted from scat samples collected at dens in late winter. The population size estimates were obtained from capwire, a capture–mark–recapture modelling approach allowing for heterogeneous (Two-Innate Rates Model) capture probability across individuals (Miller et al. Citation2005; Pennell et al. Citation2013). Ninety-five percent confidence intervals are provided in parentheses.
Surveys of species belonging the guild of predators specialized on rodents have been conducted since summer 2006 in two areas in the interior of the Varanger Peninsula (), while breeding Arctic foxes are recorded as part of the national Norwegian scheme for monitoring Arctic fox dens (Berteaux et al. Citation2017). There are presently 42 known Arctic fox dens on the Varanger Peninsula (). During the project, there have been signs of Arctic fox activity in 17 dens and breeding has been recorded in eight dens. Beside the Arctic fox there are two other carnivorous mammals that can be characterized as small rodent specialists—stoats (Mustela erminea) and least weasels (Mustela nivalis)—both of which are recorded regularly in snow tracking transects. Among the avian predators feeding on small rodents, the long-tailed skua (Stercorarius longicaudus) is the most widespread and abundant, with densities exceeding one breeding pair per km2 during rodent peaks. Rough-legged buzzards (Buteo lagopus) also breed regularly in the increase and peak phases of the rodent cycle, whereas snowy owls (Bubo scandiacus) have only been observed breeding in one of the three rodent peaks that occurred in the study area.
Ecosystem dynamics
There are three dynamics aspects of the ecosystem on the Varanger Peninsula that could explain the current state of the Arctic fox population: (1) the rodent cycle and its influence on rodent-dependent predators; (2) the relation between reindeer carrion and red foxes; and (3) the relation between red foxes and Arctic foxes.
Rodent cycle and rodent-dependent predators
Time series of rodent population density in early summer and number of breeding specialist rodent predators show that there have been three cyclic peaks since 2004 (). For the rodents, the three peaks are quite different both in terms of total and species-specific densities (). The peak in 2011 was the highest, in particular for lemming and tundra voles, while the densities of grey-sided vole have had an increasing trend during the monitoring period. It is also important to note that the Norwegian lemming has been almost absent in the catches since the 2011 peak and therefore appears to have missed the last peak in 2015. That lemmings are missing during certain rodent peaks appears to be a common phenomenon in northern Fennoscandia (Angerbjörn et al. Citation2001; Ekerholm et al. Citation2001; Ims et al. Citation2011). In fact, a paucity of lemming peaks in Finnmark was observed between 1988 and 2007, although the grey-sided vole had a regular four- to five-year cycle in the same period (Oksanen et al. Citation2008; Ims et al. Citation2011). The irregularity of the lemming outbreak dynamics compared to the more regular vole cycle has been attributed to higher sensitivity of lemmings to winter climate (Ims et al. Citation2008; Ims et al. Citation2011). Speculations that the increased abundance of semi-domestic reindeer has had a negative knock-on effect on lemming are not supported by data (Ims et al. Citation2007).
Figure 4. Time series of rodent densities and predator breeding performances on the Varanger Peninsula. (a) Rodent population density indices (individuals per 100 trap-nights) based on all small-quadrat sampling sites on the Varanger Peninsula in June (see ). (b) Litter and pup production for the Arctic fox obtained from the Norwegian den monitoring programme (Berteaux et al. Citation2017). (c) Density of successfully breeding pairs of long-tailed skua in four study blocks of 4 km2 and (d) number of rough-legged buzzard clutches with nearly fledged young in late July at traditional breeding sites in two survey areas in the interior of the peninsula (see and Killengreen et al. Citation2013).
Arctic foxes on the Varanger Peninsula showed a distinct reproductive response to the two rodent peaks including lemmings (). Pup production was highest during the 2011 lemming peak (four litters, mean litter size 6.8, range 2–11), whereas the average litter size for the other years was generally very small (mean 3.0, range 1–5, n = 11). In the last rodent peak in 2015, no Arctic fox was recorded breeding despite Arctic foxes being observed at six dens during the spring. The annual reproductive output of the Arctic fox population was differentially related to lemming and voles (). That is, while both number of litters and mean litter size per year were significantly correlated (Spearman coefficients) with the lemming density index (number of litters: rs = 0.71, p = 0.006; litter size: rs = 0.70, p = 0.007), none of the correlation coefficients with the two vole species were significant (all rs < 0.20, p > 0.35). Previous studies have also concluded that the Arctic fox is a Lemmus specialist (Angerbjörn et al. Citation1999; Elmhagen et al. Citation2002), but our study seems to be among the first to indicate that the Arctic fox may not show any distinct reproductive response to Microtus and Myodes voles.
Reproductive responses to the rodent cycle are also evident for the long-tailed skua and the rough-legged buzzard (c, d). Most notably, both avian predators succeeded well also in the 2015 rodent peak without lemmings, when the Arctic fox failed to breed. Snowy owls, on the other hand, only bred in the 2011 lemming peak (nine pairs). That year, pomarine skuas (Stercorarius pomarinus) also reproduced on the Varanger Peninsula (Øien Citation2011). Indeed, it seems that lemmings are more able than voles to promote breeding in the most typical Arctic members of the rodent-dependent guild of predators, namely the snowy owl, the pomarine skua and the Arctic fox (Ims, Ehrich et al. Citation2013).
Reindeer and red fox dynamics
The numbers of winter-resident reindeer are temporally and spatially variable across the coastal tundra peninsulas in Finnmark. Henden et al. (Citation2014) used camera-traps to estimate the response of scavengers to spatial variation of reindeer density, which was estimated by aerial surveys in late winters of 2009–2011. This study also included two peninsulas to the west of Nordkinn and Varanger. The red fox was the most widespread mammalian scavenger and its area occupancy increased strongly with reindeer density, especially in years with reindeer densities exceeding 1.5 individuals per km2. This result supports the hypothesis that more ungulate carrion has paved the way for an increased abundance of red foxes in Fennoscandia (Elmhagen et al. Citation2017). This phenomenon has likely been accentuated in Finnmark during the last decades because of both the considerable increase in reindeer density, associated with high density- and climate-dependent winter mortality, and the disruption of the reindeer migration (Tveraa et al. Citation2007; Hausner et al. Citation2011; Henden et al. Citation2014).
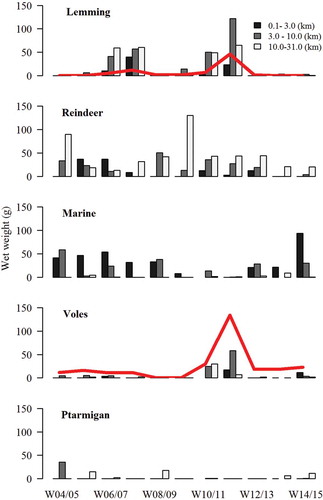
The role of reindeer carrion as a driver of increased abundance and spatial expansion of the red fox population in Finnmark has been further supported by our analyses of stomach contents of culled red foxes on the Varanger Peninsula (Killengreen et al. Citation2011). The time series of red fox winter diet () show three main components: rodents, reindeer and marine resources. These components showed a profound spatio-temporal variation. Rodents dominated in the peak and crash phases of the rodent cycle, in particular at some distance (> 3 km) from the coast. When the Norwegian lemming was present during the rodent peak, it was clearly the most important prey (compare with ). The dietary predominance of lemmings over the two vole species is likely due to its extensive activity on the snow surface in winter. Reindeer was the most important prey item during the low phases of the rodent cycle, in particular in the interior of the peninsula. This effect, however, was less evident during the last low phase, in 2012–14. The amount of reindeer carrion consumed by foxes is likely to be jointly determined by the availability of other food items – rodents – and the availability of reindeer carrion, which is determined by the number of winter reindeer residents and their mortality. Unsurprisingly, marine resources (mostly seabirds) were the dominant items in the red fox diet close to the coast (Killengreen et al. Citation2011). These marine subsidies are clearly important in winters when both rodents and reindeer carrion are scarce.
Figure 5. Relations between annual Arctic fox reproductive output (black dots denote mean litter size and circles denote number of litters) and density (individual per 100 trap-nights in June) of (a) the Norwegian lemming and (b) the grey-sided vole.
Figure 6. Time series of main components of red fox winter diet, according to three distance zones from coast line on the Varanger Peninsula. The diets are based on wet weights of stomach contents of red foxes culled in winter (January–April). Dynamics of Norwegian lemmings and voles (sum of grey-sided voles and tundra vole) based on density indices from the preceding early summer (see ) are superimposed on the diet graphs.
Relation between red foxes and Arctic foxes
The camera-trap data allowed us to analyse the spatio-temporal area occupancy of Arctic foxes in eastern Finnmark as a function of the presence of red foxes as well as other potentially influential covariates (Hamel et al. Citation2013). Since 2005, the first winter of the camera-trap monitoring, when no Arctic fox was recorded, Arctic foxes have colonized areas with very few records of red foxes, fox culling (Varanger Peninsula) and high lemming density. Among the determinants of Arctic fox colonization probability, red fox presence was the most important, suggesting that red foxes effectively prevent Arctic foxes from exploiting abundant food resources like carrion of reindeer and marine animals. Temporal and spatial reduction in the presence of red fox on Varanger Peninsula induced by the culling programme () is likely to enhance population viability of the Arctic fox (Henden et al. Citation2010).
Isotope signatures of winter fur of both fox species also support the conjecture that the red fox limits the food resource use of the Arctic fox. Arctic fox fur was sampled at dens (Ehrich et al. Citation2015), while red foxes fur was taken from individuals culled by the inspectors of the Norwegian Environment Agency (Killengreen et al. Citation2011). The diet of Arctic foxes, in terms of isotopic niche, was narrower than that of red foxes even in lemming peak years (). Ehrich et al. (Citation2015) found that the signature of marine subsidies was lacking in Arctic foxes from the Varanger Peninsula, while it was frequently prevalent in other Arctic fox populations across the Arctic. Arctic foxes no longer use old Arctic fox dens located close to seabird cliffs along the coast of the Varanger Peninsula (). A century ago, 17–20% of Arctic foxes in Finnmark were of the blue morph (Johnsen Citation1947), understood to be the coastal ecotype (Hersteinsson & Macdonald Citation1992), but we have never observed blue foxes on the Varanger Peninsula during this project.
Figure 7. Fox diet width depicted as minimum convex polygons of stable isotope ratios of winter fur sampled during the lemming peaks of 2007 and 2011. The isotopic signatures of winter fur reflect fox diets at the end of the preceding summer. Values in the upper right corner of the graph reflects diets of marine origin.
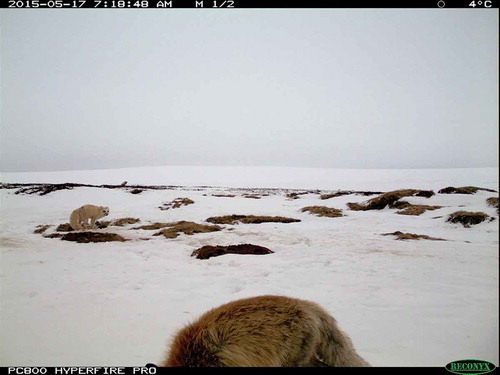
Many studies have shown that competition with red foxes for breeding territories may limit Arctic fox distribution in the tundra (Elmhagen et al. Citation2017). On the Varanger Peninsula, Arctic foxes appear to be expelled from tundra habitats with high primary and secondary productivity (Killengreen et al. Citation2007). Anecdotal observations from the Russian Low Arctic indicate that a single visit of a red fox at Arctic fox dens may be sufficient to expel breeding Arctic foxes (Rodnikova et al. Citation2011). To obtain more data on the interactions between the two fox species at dens, we started monitoring Arctic fox dens on the Varanger Peninsula using camera-traps in 2015. That year, which was a rodent peak without successful Arctic fox reproduction, at all of the six dens where Arctic foxes were recorded red foxes were also recorded (). Note, however, that this rodent peak did not include lemmings (see above). Camera monitoring at dens may allow determination of the critical levels of red fox disturbance that lead to den abandonment and breeding failure of Arctic foxes. Long-term monitoring is likely to be essential because Arctic fox sensitivity to red foxes is expected to depend on different phases of the rodent cycle, the spatio-temporal variability of other food resources and the efficiency and timing of red fox culling (Henden, Yoccoz et al. Citation2009).
Figure 8. Photograph from a camera-trap at an Arctic fox den, 17 May 2015. A red fox is seen in the foreground, while an Arctic fox just outside a den entrance is seen in the background. An Arctic fox pair had been regularly present on this den until the appearance of the red fox seen in this photograph. No Arctic fox was recorded at this den after 18 May.
Conclusion
In Fennoscandia, the Arctic fox population has declined towards critically low numbers during the last century, and their distribution has become more restricted spatially. The situation in the northernmost part of Fennoscandia – Finnmark – once an Arctic fox stronghold, appears to be even more critical than it is in the mountain tundra further south. Indeed, the Arctic fox has been extirpated across most of the sub-Arctic and Low-Arctic tundra in Finnmark as well as the adjacent Swedish and Finnish Lapland. The absence of recorded breeding in the latest rodent peak in a population that may have counted as few as three individuals in 2015 () means that the Arctic fox on the Varanger Peninsula is very close to sharing the fate of formerly neighbouring populations.
We have identified both proximate and ultimate drivers in the ecosystem that are likely to have contributed to this state of affairs. First, red foxes seem to expel Arctic foxes from critical food resources in winter and from breeding territories in summer. Second, the temporary loss of lemming peak years reduces Arctic fox reproductive output, with low litter sizes and breeding failures, to a level where the population may not be able to sustain itself (Loison et al. Citation2001; Henden et al. Citation2008). That a regular vole cycle is still running in Low-Arctic Fennoscandia does not seem to suffice for the Arctic fox. The ultimate drivers are likely to be both climatic and anthropogenic. The loss of lemming peak years appears to have a climatic origin, with mild winters at low altitudes along the coast of the Fennoscandian Low Arctic. Mild spells causing ice-encrusted vegetation appear to be more detrimental to lemmings than voles (Ims et al. Citation2011). The Low-Arctic coast of Finnmark provides subsidies to foxes that are important in years with few lemmings (Roth Citation2003). While these rich resources may have been available to Arctic foxes in the past, they now appear to be monopolized by red foxes. The increase of red foxes and their strong numerical and competitive dominance over Arctic foxes are most likely driven by an increase in the abundance of ungulate carrion, which ultimately is likely to have both anthropogenic and climatic origins. In particular, abundant reindeer carrion in winter now allows red foxes to enter the otherwise low-productive highlands on the Varanger Peninsula that may have been the last uncontested foothold for the Arctic fox.
While culling red foxes may have prevented the extirpation of Arctic foxes on the Varanger Peninsula during the course of this project, the Varanger population has not rallied like Arctic fox populations assisted by management actions further south in the Scandes mountain tundra (Angerbjörn et al. Citation2013; Elmhagen et al. Citation2017). It is difficult to firmly conclude whether these different developments are due to differences in ecosystem state, because there are also alternative explanations. One alternative explanation is that the low initial population size at the Varanger Peninsula has made it prone to both demographic stochasticity (binomial variance in vital rates) and environmental stochasticity (e.g., the irregularity of the lemming dynamics) that may have overshadowed the positive influence of red fox culling. Another alternative is that Arctic fox populations further south in Fennoscandia have been subjected to combinations of other conservation actions, such as supplementary feeding and release of foxes bred in captivity (Berteaux et al. Citation2017; Landa et al. Citation2017). In fact, Angerbjörn et al. (Citation2013) suggested that such multiple actions saved the Arctic fox from regional extirpation in Fennoscandia at the turn of the millennium. Trials of such additional conservation measures will now be conducted to elucidate whether the Arctic fox on the Varanger Peninsula, at the western fringe of the Low-Arctic tundra, is no longer rescuable by any reasonable means given the current state of the ecosystem.
Acknowledgements
We thank the many people that have contributed to the fieldwork and the results that we have summarized in this paper. Norwegian Environment Agency inspectors, in particular Arne Petter Sarre and Alfred Ørjebu, have been instrumental in obtaining samples for the analyses of red fox dietss. We thank Nina Elisabeth Eide, Kristine Roaldsnes Ulvund, Lars Rød-Eriksen, Torveig Balstad, Line Birkeland Eriksen and Merethe Spets at the Norwegian Institute for Nature Research for handling and processing scat samples for DNA analyses.
Disclosure statement
No potential conflict of interest was reported by the authors.
Additional information
Funding
References
- Angerbjörn A., Eide N.E., Dalén L., Elmhagen B., Hellström P., Ims R.A., Killengreen S., Landa A., Meijer T., Mela M., Niemimaa J., Norén K., Tannerfeldt M., Yoccoz N.G. & Henttonen H. 2013. Carnivore conservation in practice: replicated management actions on a large spatial scale. Journal of Applied Ecology 50, 1–12.
- Angerbjorn A., Tannerfeldt M. & Erlinge S. 1999. Predator–prey relationships: Arctic foxes and lemmings. Journal of Animal Ecology 68, 34–49.
- Angerbjörn A., Tannerfeldt M. & Lundberg H. 2001. Geographical and temporal patterns of lemming population dynamics in Fennoscandia. Ecography 24, 298–308.
- Berteaux D., Thierry A.-M., Alisauskas R., Angerbjörn A., Buchel E., Ehrich D., Eide N.E., Flagstad Ø., Fuglei E., Gilg O., Goltsman M., Henttonen H., Ims R.A., Killengreen S.T., Kondratyev A., Kruckenberg H., Kulikova O., Landa A., Lang J., Menyushina I., Mikhnevich J., Norén K., Ollila T., Ovsyanikov N., Pokrovskaya L., Pokrovsky I., Rodnikova A., Roth J., Sabard B., Samelius G., Schmidt N.M., Sittler B., Sokolov A.A., Sokolova N.A., Stickney A., Unnsteinsdóttir E.R. & White P. 2017. Harmonizing circumpolar monitoring of Arctic fox: benefits, opportunities, challenges, recommendations. Polar Research 36, article no. 2, doi: 10.1080/17518369.2017.1319602.
- Brodtkorp E.N. 1914. Nogen iagttagelser om vidtet i Østfinnmarken. (Observations of game species in eastern Finnmark.) Norges Jæger Og Fiskeforbunds Tidskrift 43, 313–319.
- Ehrich D., Henden J.-A., Ims R.A., Doronina L.O., Killengren S.T., Lecomte N., Pokrovsky I.G., Skogstad G., Sokolov A.A., Sokolov V.A. & Yoccoz N.G. 2012. The importance of willow thickets for ptarmigan and hares in shrub tundra: the more the better? Oecologia 168, 141–151.
- Ehrich D., Ims R.A., Yoccoz N.G., Lecomte N., Killengreen S.T., Fuglei E., Rodnikova A.Y., Ebbinge B.S., Menyushina I.E., Nolet B.A., Pokrovsky I.G., Popov I.Y., Schmidt N.M., Sokolov A.A., Sokolova N.A. & Sokolov V.A. 2015. What can stable isotope analysis of top predator tissues contribute to monitoring of tundra ecosystems? Ecosystems 18, 404–416.
- Ekerholm P., Oksanen L. & Oksanen T. 2001. Long-term dynamics of voles and lemmings at the timberline and above the willow limit as a test of hypotheses on trophic interactions. Ecography 24, 555–568.
- Elmhagen B., Berteaux D., Burgess R.M., Ehrich D., Gallant D., Henttonen H., Ims R.A., Killengreen S.T., Niemimaa J., Norén K., Ollila T., Rodnikova A., Sokolov A.A., Sokolova N.A., Stickney A.A. & Angerbjörn A. 2017. Homage to Hersteinsson & Macdonald: climate warming and resource subsidies cause red fox range expansion and Arctic fox decline. Polar Research 36, article no. 3, doi: 10.1080/17518369.2017.1319109.
- Elmhagen B., Tannerfeldt M. & Angerbjörn A. 2002. Food-niche overlap between Arctic and red foxes. Canadian Journal of Zoology 80, 1274–1285.
- Farbrot H., Isaksen K., Etzelmüller B. & Gisnås K. 2013. Ground thermal regime and permafrost distribution under a changing climate in northern Norway. Permafrost and Periglacial Processes 24, 20–38.
- Frafjord K. & Krempig L. 2001. Fjellrev i Finnmark. (Arctic fox in Finnmark.) Lappmeisen 25, 40–45.
- Hamel S., Killengreen S., Henden J.-A., Yoccoz N.G. & Ims R.A. 2013. Disentangling the importance of interspecific competition, food availability, and habitat in species occupancy: recolonization of the endangered Fennoscandian Arctic fox. Biological Conservation 160, 114–120.
- Hanssen-Bauer I. & Tveito O.E. 2014. Klima og klimaendringer. (Climate and climate change.) Ottar 302, 31–36.
- Hausner V.H., Fauchald P., Tveraa T., Pedersen E., Jernsletten J.-L., Ulvevadet B., Ims R.A., Yoccoz N.G. & Bråthen K.A. 2011. The ghost of development past: the impact of economic security policies on Saami pastoral ecosystems. Ecology and Society 16, article no. 4. doi: 10.5751/ES-04193-160304.
- Henden J.A., Bårdsen B.J., Yoccoz N.G. & Ims R.A. 2008. Impacts of differential prey dynamics on the potential recovery of endangered Arctic fox populations. Journal of Applied Ecology 45, 1086–1093.
- Henden J.-A., Ims R.A. & Yoccoz N.G. 2009. Nonstationary spatio-temporal small rodent dynamics: evidence from long-term Norwegian fox bounty data. Journal of Animal Ecology 78, 636–645.
- Henden J.-A., Ims R.A., Yoccoz N.G., Hellström P. & Angerbjörn A. 2010. Strength of asymmetric competition between predators in food webs ruled by fluctuating prey: the case of foxes in tundra. Oikos 119, 27–34.
- Henden J.-A., Ims R.A., Yoccoz N.G. & Killengreen S.T. 2011. Declining willow ptarmigan populations: the role of habitat structure and community dynamics. Basic and Applied Ecology 12, 413–422.
- Henden J.-A., Ims R.A., Yoccoz N.G., Sørensen R. & Killengreen S.T. 2011. Population dynamics of tundra voles in relation to configuration of willow thickets in southern Arctic tundra. Polar Biology 34, 533–540.
- Henden J.-A., Stien A., Bårdsen B.-J., Yoccoz N.G., Ims R.A. & Hayward M. 2014. Community-wide mesocarnivore response to partial ungulate migration. Journal of Applied Ecology 51, 1525–1533.
- Henden J.-A., Yoccoz N.G., Ims R.A., Bårdsen B.-J. & Angerbjörn A. 2009. Phase-dependent effect of conservation efforts in cyclically fluctuating populations of Arctic fox (Vulpes lagopus). Biological Conservation 142, 2586–2592.
- Hersteinsson P. & Macdonald D.W. 1992. Interspecific competition and the geographical distribution of red and Arctic foxes Vulpes vulpes and Alopex lagopus. Oikos 64, 505–515.
- Holt R.D. & Keitt T.H. 2005. Species’ borders: a unifying theme in ecology. Oikos 108, 3–6.
- Ims R.A., Ehrich D., Forbes B.C., Huntley B., Walker D.A., Wookey P.A., Berteaux D., Bhatt U.S., Bråthen K.A., Edwards M.E., Epstein H.E., Forchhammer M.C., Fuglei E., Gauthier G., Gilbert S., Leung M., Menyushina I.E., Ovsyanikov N.G., Post E., Raynolds M.K., Reid D.G., Schmidt N.M., Stien A., Sumina O.I. & Van Der Wal. R. 2013. Terrestrial ecosystems. In H. Meltofte (ed.): Arctic biodiversity assessment. Status and trends in Arctic biodiversity. Pp. Pp. 385–440. Akureyri: Conservation of Arctic Flora and Fauna.
- Ims R.A., Henden J.-A. & Killengreen S.T. 2008. Collapsing population cycles. Trends in Ecology & Evolution 23, 79–86.
- Ims R.A., Jepsen J.U., Stien A. & Yoccoz N.G. 2013. COAT – Climate-ecological Observatory for Arctic Tundra. Fram Centre Report Series 1. Tromsø: Fram Centre.
- Ims R.A., Yoccoz N.G., Bråthen K.A., Fauchald P., Tveraa T. & Hausner V. 2007. Can reindeer overabundance cause a trophic cascade? Ecosystems 10, 607–622.
- Ims R.A., Yoccoz N.G. & Killengreen S.T. 2011. Determinants of lemming outbreaks. Proceedings of the National Academy of Sciences of the United States of America 108, 1970–1974.
- Isaksen K. 2014. Permafrost på Varangerhalvøya. (Permafrost on Varanger Peninsula.) Ottar 302, 12–13.
- Johnsen S. 1947. Fjellreven. (The Arctic fox.) In B. Føyn et al. (eds.): Fjellreven. Norges Dyreliv 1: pattedyrene. (The Artic fox. Norway’s fauna 1: the mammals.) Pp. 308–322. Oslo: Cappelen.
- Karlsen S.R., Elvebakk A. & Johansen B. 2005. A vegetation-based method to map climatic variation in the Arctic–boreal transition area of Finnmark, north-easternmost Norway. Journal of Biogeography 32, 1161–1186.
- Killengreen S.T., Ims R.A., Henden J.A., Yoccoz N.G. & Ehrich D. 2013. Prosjekt “Fjellrev i Finnmark”: Rapport for 2008–2012. (Arctic Fox in Finnmark project. Report for 2008–2012.) Tromsø: Institute for Arctic and Marine Biology, University of Tromsø.
- Killengreen S.T., Ims R.A., Yoccoz N.G., Bråthen K.A., Henden J.-A. & Schott T. 2007. Structural characteristics of a Low Arctic tundra ecosystem and the retreat of the Arctic fox. Biological Conservation 135, 459–472.
- Killengreen S.T., Lecomte N., Ehrich D., Schott T., Yoccoz N.G. & Ims R.A. 2011. The importance of marine vs. human-induced subsidies in the maintenance of an expanding mesocarnivore in the Arctic tundra. Journal of Animal Ecology 80, 1049–1060.
- Killengreen S.T., Strømseng E., Yoccoz N.G. & Ims R.A. 2012. How ecological neighbourhoods influence the structure of the scavenger guild in Low Arctic tundra. Diversity and Distributions 18, 563–574.
- Landa A., Flagstad Ø., Areskoug V., Linnell J.D.C., Strand O., Ulvund R.U., Thierry A.-M., Rød-Eriksen L. & Eide N.E. 2017. The endangered Arctic fox populations in Norway – the failure and success of captive breeding and reintroduction. Polar Research 36, article no. 9, doi: 10.1080/17518369.2017.1325139.
- Loison A., Strand O. & Linnell J.D.C. 2001. Effect of temporal variation in reproduction on models of population viability: a case study for remnant Arctic fox (Alopex lagopus) populations in Scandinavia. Biological Conservation 97, 347–359.
- Miller C.R., Joyce P. & Waits L.P. 2005. A new method for estimating the size of small populations from genetic mark–recapture data. Molecular Ecology 14, 1991–2005.
- Øien I.J. 2011. Polarjoen hekker på Varangerhalvøya i Finnmark. (The pomarine skua breeds on Varanger Peninsula in Finnmark.) Vår Fuglefauna 34, 126–129.
- Oksanen T., Oksanen L., Dahlgren J. & Olofsson J. 2008. Arctic lemmings, Lemmus spp. and Dicrostonyx spp.: integrating ecological and evolutionary perspectives. Evolutionary Ecology Research 10, 415–434.
- Pennell M.W., Stansbury C.R., Waits L.P. & Miller C.R. 2013. Capwire: a R package for estimating population census size from non-invasive genetic sampling. Molecular Ecology Resources 13, 154–157.
- Ravolainen V.T., Bråthen K.A., Ims R.A., Yoccoz N.G., Henden J.-A. & Killengreen S.T. 2011. Rapid, landscape scale responses in riparian tundra vegetation to exclusion of small and large mammalian herbivores. Basic and Applied Ecology 12, 643–653.
- Ravolainen V.T., Bråthen K.A., Ims R.A., Yoccoz N.G. & Soininen E.M. 2013. Shrub patch configuration at the landscape scale is related to diversity of adjacent herbaceous vegetation. Plant Ecology & Diversity 6, 257–268.
- Ravolainen V.T., Bråthen K.A., Yoccoz N.G., Nguyen J.K. & Ims R.A. 2014. Complementary impacts of small rodents and semi-domesticated ungulates limit tall shrub expansion in the tundra. Journal of Applied Ecology 51, 234–241.
- Ravolainen V.T., Yoccoz N.G., Bråthen K.A., Ims R.A., Iversen M. & González V.T. 2010. Additive partitioning of diversity reveals no scale-dependent impacts of large ungulates on the structure of tundra plant communities. Ecosystems 13, 157–170.
- Reindeer Husbandry and Carnivores. 2016. Reindeer population size, Varanger/Polmak. Accessed on the internet at http://www.reinbase.no/en-us/About-reindeer-husbandry/Population-size on on 31 January 2016.
- Rodnikova A., Ims R.A., Sokolov A., Skogstad G., Sokolov V., Shtro V. & Fuglei E. 2011. Red fox takeover of Arctic fox breeding den: an observation from Yamal Peninsula, Russia. Polar Biology 34, 1609–1614.
- Roth J.D. 2002. Temporal variability in Arctic fox diet as reflected in stable-carbon isotopes; the importance of sea ice. Oecologia 133, 70–77.
- Roth J.D. 2003. Variability in marine resources affects Arctic fox population dynamics. Journal of Animal Ecology 72, 668–676.
- Strann K.-B. & Ims R.A. 2014. Det særegne dyrelivet. (The special fauna.) Ottar 302, 60–67.
- Tveraa T., Fauchald P., Yoccoz N.G., Ims R.A., Aanes R. & Høgda K.A. 2007. What regulate and limit reindeer populations in Norway? Oikos 116, 706–715.
- Tveraa T., Stien A., Bårdsen B.-J., Fauchald P. & Bohrer G. 2013. Population densities, vegetation green-up, and plant productivity: impacts on reproductive success and juvenile body mass in reindeer. Plos ONE 8, e56450, doi: 10.1371/journal.pone.0056450.
- Walker D.A., Raynolds M.K., Daniels F.J.A., Einarsson E., Elvebakk A., Gould W.A., Katenin A.E., Kholod S.S., Markon C.J., Melnikov E.S., Moskalenko N.G., Talbot S.S. & Yurtsev B.A. 2005. The circumpolar Arctic vegetation map. Journal of Vegetation Science 16, 267–282.