
ABSTRACT
There is growing interest in being able to automatically extract colours of garments from images. Automatic image analysis may allow the development of data-driven approaches to, for example, colour forecasting. A neural network (pix2pix) was trained on streetstyle fashion images to predict the semantic class of each pixel in the image. The trained network was able to correctly identify the class of each pixel in 93% of cases. A total of 10 participants were each asked to select three colours from each of 10 additional images to represent the clothes being worn. Colour palettes were extracted from the images using cluster analysis of those pixels identified by pix2pix as being clothes and compared with cluster analysis of the whole image. The work shows that pixel-based semantic analysis is effective for automatically generating colour palettes for clothes in digital images. This approach can provide effective software tools for colour designers.
1. Introduction
There is currently growing interest in the development of techniques that can automatically analyse digital images and that can extract valuable insights about these images. In some cases, the focus is on providing consumers with tools. In one study, for example, a mobile application was developed that can determine the clothing colours that are harmonised to a user’s personal skin and hair colouring (Hong & Kim, Citation2019). VisualistApp is a new application that enables creatives to curate and manage their digital image libraries and to create mood boards and colour palettes (VisualistApp, Citation2022). Another potential application is to generate automatic systems that can enable design professionals to carry out their jobs more efficiently. For example, one of the tasks that is frequently undertaken in the colour forecasting domain is to generate mood boards based on images from fashion shows or other critical sources that are then used to extract insights on form, materials or colour trends. The number of available images that should be considered in such a task is becoming so huge as to make the task unmanageable. This is especially the case if we consider sourcing images from social media influencers, for example. So, although humans can perform this task well with a limited number of images, when the number of images becomes very large it can become impractical for a human to extract a colour palette. This work is concerned with methods to automatically extract the colours of clothes and fashion accessories from digital images using machine learning methods. Specifically, a type of deep-learning neural network is used to take an image as input and identify every pixel in the image as belonging to one of several classes (such as clothes and hair). The output annotated images can enable the colours associated with each of the classes to be identified. This work could form the basis of new software tools that could enable designers and colour forecasters to extract colour insights from large sets of images.
2. Literature review
Several papers have been published that are concerned with the automatic generation and/or creation of mood boards (Gu, Wu, Yu, & Lou, Citation2013; Zabotto, Amaral, Hornos, & Benze, Citation2019). Increasingly, these applications use various tools from machine learning. Machine learning describes a set of methods that enable software to process and analyse data and can be considered to be a sub-discipline of Artificial Intelligence. Traditionally, machine learning tools have been categorised as being either supervised or unsupervised. The former requires many examples from which the algorithms can ‘learn’ whereas the latter does not require such training examples. Both supervised and unsupervised machine learning were used to extract key colours automatically from fashion runway images in a previous study (Lai & Westland, Citation2020). In another study, logistic regression was used to predict fashion trends from fashion runway images (Chakraborty, Hoque, & Kabir, Citation2020). The supervised machine learning methods typically require large amounts of data for training purposes but the technological advances that are characterised by the term Industry 4.0 are making such data readily available. A comparison was made between traditional and big-data approaches to trend forecasting (DuBreuil & Lu, Citation2020) and a fashion classification system was developed based on machine learning (Park & Choi, Citation2020). The emergence of the metaverse and the likely increase in interest in digital fashion is likely to lead to even more digital innovations (Sayem, Citation2022) and has led to questions about whether Higher Education is currently preparing graduates sufficiently for a data-rich algorithm-driven world (Merryman & Lu, Citation2021).
One of the developments in machine learning that promises new capabilities is that of generative adversarial networks, also known as GANs. GANs were developed by Goodfellow in 2014 (Goodfellow et al., Citation2014). This type of network was originally developed as a type of unsupervised machine learning and has been used to, for example, generate a video of someone speaking based on a single image of that person (the so-called deep-fake phenomenon). More recently, the GANs method has been applied to semi-supervised or supervised learning. For example, the pix2pix algorithm (Isola, Zhu, Zhou, & Efros, Citation2017) that is used in this paper is able to transform one image into another but requires many pairs of training images (for example, an input image and the corresponding image that we would like the network to produce).
Semantic classification has received significant attention in recent years, particularly in the fashion industry (Ge, Zhang, Wang, Tang, & Luo, Citation2019; Liu, Luo, Qiu, Wang, & Tang, Citation2016). Many studies have employed complex machine learning techniques and utilised large-scale image set. In order to train the network for class classification, human-parsing is a key step in preparing the training dataset. Deepfashion system used the human-parsing by experts (Liu et al., Citation2016) and other influencial fashion attributes classification used the Macro–micro adversarial network (Luo et al., Citation2018). However, many of these systems simply identify that an image contains an object, such as a dress. A very limited number of studies have addressed pixel-level image segmentation as part of solving the annotated segmentation problem in fashion colour forecasting. The advantage of pixel-based classification is that we then know exactly which pixels in the image constitute the semantic objects – the dress or the shoes, for example – and this enables us to identify the specific colours that are associated with those objects.
One of the potential applications of this work is to use the pix2pix method to identify, for example, which pixels in an image correspond to clothes or fashion accessories. Method such as k-means clustering (Lloyd, Citation1982) exist that can find the dominant colours in an image, but simple application of k-means will often produce colours that include the background colour or the colour of other non-relevant objects. The proposal in this paper is that we can use the pix2pix algorithm to highlight those pixels in an image that relate to fashion or fashion-related items and then use k-means on these pixels to produce more meaningful colour palettes. In order to perform pixel-based semantic segmentation it is necessary that the system generates an image as the output rather than, for example, a word. This type of network falls into a category referred to as image-to-image translation and the pix2pix algorithm used in this work is one implementation of such a system. We note that other similar systems and/or implementations exist such as U-net (Sun, Li, Qiu, & Liu, Citation2018). The idea of using pix2pix to perform pixel-level object recognition was inspired from an earlier study (Abdullayeva, Citation2019).
3. Experiments
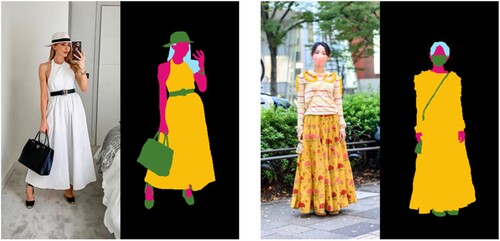
A total of 2000 images were downloaded from the internet using the tag ‘streetstyle’ with Google Image Search. The images were all cropped to be 512 × 256 pixels in size and each contained a single person. The reason that this image size was used was because this was the size requirement of the neural network that would subsequently be used. Student designers were employed to generate a corresponding labelled image for each of the original images. The labelled or annotated images were such that every pixel was assigned one of five colours depending upon whether the pixel was identified as the class: skin, hair, accessories, clothing or null (see for example). The designers produced the labelled images using Adobe Photoshop image software. The 2000 images were randomly split into a training set (1600 images) and a test set (400 images).
Figure 1. Two example images from the training set showing the corresponding annotated images that were produced for training purposes. The colour code used was black (null), green (shoes and accessories), cyan (hair), magenta (skin) and yellow (clothing).
A MATLAB implementation of the pix2pix image-to-image translation network was used (Isola et al., Citation2017). The network takes an original image as the input and attempts to generate the corresponding annotated or labelled image as the output. Taking as an example, the network will take the image on the left of each pair of images as input and will try to generate the annotated image on the right. The network was trained using the training set for 5, 10, 15, 20, 25, 30, 35, 40 and 45 epochs. During each epoch, each of the images in the training set was presented to the network in turn and changes to the network were made so that the output more closely matched the target labelled output. Therefore 10 epochs would involve 16,000 iterations (10 epochs x 1600 images). The network was implemented on an Apple MacBook Pro (M1 Pro Chip, 32GM) and training took approximately 2 h per epoch.
After training, the network could be used to produce a labelled image from an input image and the labelled image was compared with the ground-truth labelled image that was prepared by the student designers. As a performance metric, the class of each pixel in the network-labelled image was compared to the class of the pixel in the human-labelled image and the per cent of pixels that were correctly classified was calculated. Although the labelled images contained only five colours the output from the network usually contained more than five colours; in this case, each pixel in the output was converted to the closest of the five colours. Such a thresholding approach is normal in classification problems such as this one (Kittler & Illingworth, Citation1986).
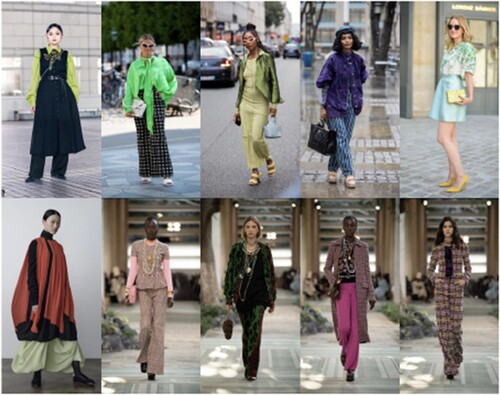
The use of the separate test set of images provides some evaluation of the extent to which the network can generalise and perform well on input images that were not used during the training phase. The per cent correct rate for each of the five classes for the testing dataset is calculated, but an additional measure of performance was to calculate an F score to measure the performance of the model, based on Sokolova, Japkowicz, and Szpakowicz (Citation2006). As an additional test of generalisation, 10 additional images were obtained (illustrated in ). These images were a combination of streetstyle and fashion runway images and separate to the 1600 images that were previously used.
Figure 2. The collection of ten additional fashion images.
A total of ten participants took part in an experiment in which they were each asked to use a colour-picker tool to select three colours from each of the 10 images that represent the clothing in the images. The colour palettes produced by each person were compared with the colour palettes produced by two automatic methods:
k-means clustering was applied to the whole image generate the three dominant colours and
k-means clustering was only applied to the pixels of each image classified as clothing according to the pix2pix network.
In other words, the first method performs clustering on all of the pixels in the image to generate dominant colours whereas the second method only analyses the pixels that are identified being in the class of clothes. In the second case, it was the pix2pix network that was trained on the 1600 streetstyle images that was used to predict the class membership of each pixel. There are many methods for implementing a k-means algorithm. For simplicity and to allow easy replication of the work by other researchers the MATLAB k-means command was used to generate colours from an image or from a selection of pixels from an image.
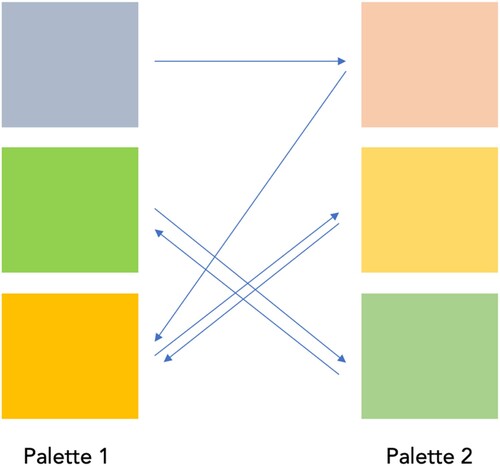
In order to quantify the similarity between palettes picked by participants and those generated by automatic methods, a palette-difference metric is needed. The metric that was used was the Minimum Colour Difference Metric (MICDM) developed by Yang, Chen, Westland, and Xiao (Citation2020) and used in some other studies (e.g. Lai & Westland, Citation2020). In this metric the RGB values of the colour in each palette are converted to CIELAB values and colour differences are calculated according to the CIELAB equation (Westland, Ripamonti, & Cheung, Citation2012). As illustrated in , for each patch in each palette the colour difference is calculated between it and its most similar patch in the other palette. In the case of 3-colour palettes this leads to a total of 6 colour differences and these are averaged to generate the palette difference ΔEp. Lower values of ΔEp correspond to more similar palettes. Values of ΔEp between pairs of palettes has been shown to correlate well with the magnitude of the visual colour difference between the palettes (Yang et al., Citation2020).
Figure 3. Schematic representation of the ΔEp palette difference metric. For each patch in each palette the closest patch in the other palette is found and the colour difference is calculated. In this case that results in 6 colour differences and these are averaged to produce the ΔEp value.
For the model performance using the additional image-dataset, the pix2pix network with the performance checkpoint will be used, by considering both correctly classified rate and F-value.
4. Results
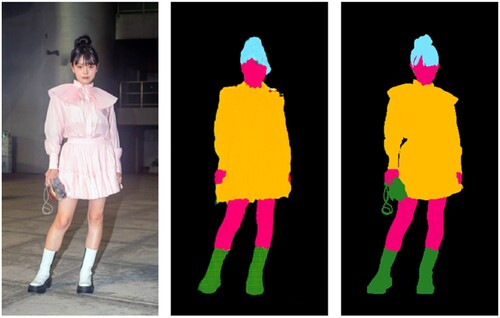
shows a typical output for one of the networks using one of the images from the testing dataset. In , 97% of the pixels were correctly classified.
Figure 4. Example performance for the network trained for 40 epochs on input image (left). The output image (middle) shows the output of the network and 97% of the pixels are correctly classified compared with the ground truth data (right).
Although is interesting, it is more useful to consider the statistics of the performance of the networks on the training and testing images. Performance on the testing images is more indicative of how we might expect the networks to perform when processing images that may be of interest in the future. shows the pixel classification performance for each of the trained networks for the test set. The highest performance is for a network trained for 40 epochs; on average over 98% of pixels are correctly classified.
Table 1. Minimum, mean and maximum percent of pixels that were correctly classified for the validation set and the range between the upper band and lowest band in each epoch using the testing dataset.
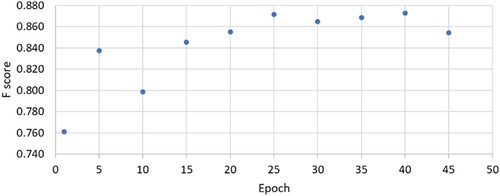
shows the F-value distribution (Sokolova et al., Citation2006) on the clothes class using the testing dataset. Considering the clothes class only, the F-scores increase with number of trainng epochs but there is some evidence that after about 25 epochs the performance stabilises. The F scores indicate that any of the networks trained for between 25 and 45 epochs could probably be used, but in the later part of this study it was the network trained for 40 epochs that was used.
Figure 5. F score distribution on clothes class on the testing set.
The final stage of the analysis is to use a k-means algorithm to select 3 colours from either the whole image or from the image pixels that are classed as being clothing, comparing the performance of the simple k-means clustering and the pix2pix neural network.
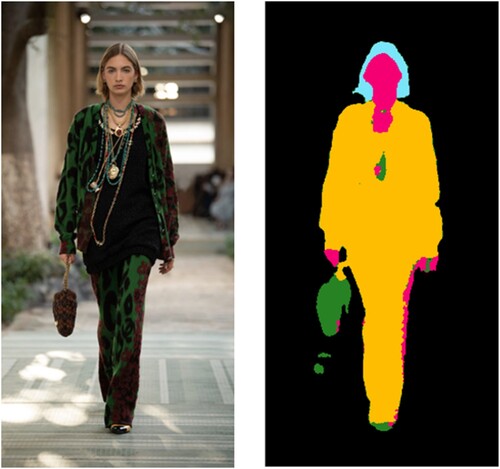
shows the application of the pix2pix network trained for 40 epochs for one of the 10 additional images.
Figure 6. Application of the pix2pix trained network to one of the additional images (from left to right): original image and output image for the 40-epoch pix2pix network.
In , the original image is shown on the far left and then to the right of that we can see the colours selected by the participants. Each participant was asked to select three colours and the colours on each row are those selected by a participant (therefore there are 10 rows). The three colours selected using k-means from the whole image are shown to the right of the participants’ colours and on the far right we can see the three colours selected using k-means from pixels in the image that were deemed to be clothing according to the pix2pix network.
Figure 7. Sample image from the additional images (from left to right): the original image, the colours selected by the participants to represent the clothes in the experiment, the three colours selected by an application of k-means to the whole image, the three colours selected by an application of k-means to pixels that belong to the clothing or accessories class as denoted by the trained pix2pix network.
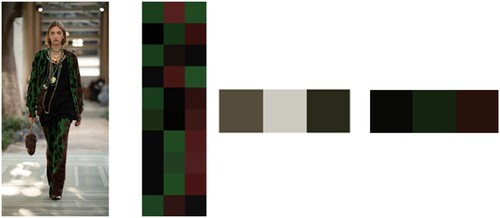
Based on a casual inspection of it is clear that the colours generated using the pix2pix method are much closer to the colours selected by the human participants than are the colours generated by a simple k-means clustering algorirthm. However, we can quantify the similarity of the two automatically selected palettes to the palettes selected by the participants using the ΔEp metric. To do this, ΔEp is calculated between the automatically generated palettes and the palettes generated by each participant in turn; a score is then produced by averaging over all participants. For the case shown averaging over all of the 10 additional fashion images, this generates a ΔEp score of 16.42 for the use of k-means on the whole image and a ΔEp score of 8.02 for the use of k-means on the clothing pixels. Note that these results were obtained using the pix2pix network that was trained for 40 epochs.
It is evident that for all ten images the colour palette generated using the pix2pix method is a closer match (indicated by a smaller ΔEp value) to the colour palettes selected by the participants than the colour palettes generated by the regular k-means method.
5. Discussion
The work has shown that a pix2pix neural network is able to generate labelled images that show the object classification of each pixel in input fashion images. In this study a performance of about 93% was obtained on a set of 400 test images. One limitation of the work was that only five semantic classes were included in the study. It is not clear whether the use of more classes would necessitate either a greater number of training images or a longer training time, or both. However, the generalisation performance of the trained network was good and it was also shown to perform quite well on a separate set of images that included some from fashion runways.
One application of this work is to provide a method to generate a colour palette from a fashion image that represents the clothes. This might be useful as part of a tool for designers who could use the method to efficiently analyse images from a fashion show, for example, or as a way to analyse the colours in thousands of fashion images (perhaps from social media). It was shown that the use of pix2pix to identify the pixels of the clothing and accessories followed by a simple k-means clustering algorithm produces colour palettes that are more closely matched to palettes selected by humans than the use of the simple k-means algorithm on its own. However, there are other methods of generating colour palettes from fashion images. For example, in a previous study it was shown that people detection following by k-means was also better than k-means on its own for a set of fashion runway images (Lai & Westland, Citation2020). In a different study, the pix2pix algorithm was used to generate colour palettes directly from an image (Colormind, Citation2022). Although in this last case, Colormind, the network generated the colour palettes from the whole image, it would be possible to use the same approach to generate colour palettes that relate to the clothes by changing the training conditions. However, all of these studies show that the use of deep learning technologies such as GANs are showing great potential to extract meaningful insights from images. The use of the pix2pix method is particularly interesting because of its potential to be able to separately extract the colour palettes for items such as shoes, handbags, skirts etc. These might lead to the possibility of analysing hundreds of thousands of images on social media and being able to derive geographically specific insights such as ‘these colours are trending for handbags in Milan’. The challenge is being able to obtain sufficiently large numbers of labelled training data. This has been identified as problem for machine learning generally (Bell, Citation2022).
In this study the use of a pixel-based classification network followed by k-means produces more reasonable colour palettes than applying k-means to the whole image. One could argue that it is obvious that this would be the case; however, it is only the case because the network can perform pixel-level semantic classification so well. A more stringent comparison would be to compare the pix2pix methods with a method that simply identifies the foreground from the background and applies k-means only to foreground pixels. The use of people detection as a way to identify the foreground from the background was carried out in a previous paper (Lai & Westland, Citation2020); in that study, there was still a problem with the foreground including lots of pixels that were not clothes such as skin and hair pixels. It is likely therefore that pixel-level classification using pix2pix would represent an improvement over a more generic background-removal process but some further work is needed to establish if this is the case.
Disclosure statement
No potential conflict of interest was reported by the author(s).
References
- Abdullayeva, A. (2019). Retrieved August 3, 2022. https://towardsdatascience.com/clothes-and-color-extraction-with-generative-adversarial-network-80ba117e17e6.
- Bell, J. (2022). What Is machine learning? Machine learning and the city: Applications in architecture and urban design. Hoboken: Wiley.
- Chakraborty, S., Hoque, S. A., & Kabir, S. F. (2020). Predicting fashion trend using runway images: Application of logistic regression in trend forecasting. International Journal of Fashion Design, Technology and Education, 13(3), 376–386. doi:10.1080/17543266.2020.1829096
- Colormind. (2022). Retrieved August 4, 2022. http://colormind.io/blog/.
- DuBreuil, M., & Lu, S. (2020). Traditional vs. big-data fashion trend forecasting: An examination using WGSN and EDITED. International Journal of Fashion Design, Technology and Education, 13(1), 68–77. doi:10.1080/17543266.2020.1732482
- Ge, Y., Zhang, R., Wang, X., Tang, X., & Luo, P. (2019). Deepfashion2: A versatile benchmark for detection, pose estimation, segmentation and re-identification of clothing images. In: Proceedings of the IEEE/CVF Conference on Computer Vision and Pattern Recognition (pp. 5337–5345).
- Goodfellow, I., Pouget-Abadie, J., Mirza, M., Xu, B., Warde-Farley, D., Ozair, S., & Bengio, Y. (2014). Generative adversarial nets. In: Proceedings of the International Conference on Neural Information Processing Systems (NIPS) (pp. 2672–2680).
- Gu, Z., Wu, Z., Yu, J., & Lou, J. (2013). A color schemer for webpage design using interactive mood board. In: International Conference on Human-Computer Interaction (pp. 555–564). Springer.
- Hong, H. R., & Kim, Y. I. (2019). A mobile application for personal colour analysis. Cogent Business & Management, 6(1).
- Isola, P., Zhu, J. Y., Zhou, T., & Efros, A. A. (2017). Image-to-image translation with conditional adversarial networks. In: Proceedings of the IEEE Conference on Computer Vision and Pattern Recognition (pp. 1125–1134).
- Kittler, J., & Illingworth, J. (1986). Minimum error thresholding. Pattern Recognition, 19(1), 41–47. doi:10.1016/0031-3203(86)90030-0
- Lai, P., & Westland, S. (2020). Machine learning for colour palette extraction from fashion runway images. International Journal of Fashion Design, Technology and Education, 13(3), 334–340. doi:10.1080/17543266.2020.1799080
- Liu, Z., Luo, P., Qiu, S., Wang, X., & Tang, X. (2016). Deepfashion: Powering robust clothes recognition and retrieval with rich annotations. In: Proceedings of the IEEE Conference on Computer Vision and Pattern Recognition (pp. 1096–1104).
- Lloyd, S. P. (1982). Least squares quantization in PCM. IEEE Transactions on Information Theory, 22(2), 129–137. doi:10.1109/TIT.1982.1056489
- Luo, Y., Zheng, Z., Zheng, L., Guan, T., Yu, J., & Yang, Y. (2018). Macro-micro adversarial network for human parsing. In: Proceedings of the European Conference on Computer Vision (ECCV) (pp. 418–434).
- Merryman, L., & Lu, S. (2021). Are fashion majors ready for the era of data science? A study on the fashion undergraduate curriculums in US institutions. International Journal of Fashion Design, Technology and Education, 14(2), 139–150. doi:10.1080/17543266.2021.1884752
- Park, N., & Choi, Y. (2020). A form attribute classification system for fashion items. International Journal of Fashion Design, Technology and Education, 13(1), 11–19. doi:10.1080/17543266.2019.1664641
- Sayem, A. S. M. (2022). Digital fashion innovations for the real world and metaverse. International Journal of Fashion Design, Technology and Education, 15(2), 139–141. doi:10.1080/17543266.2022.2071139
- Sokolova, M., Japkowicz, N., & Szpakowicz, S. (2006). Beyond accuracy, F-score and ROC: a family of discriminant measures for performance evaluation. In: AI 2006: Advances in Artificial Intelligence: 19th Australian Joint Conference on Artificial Intelligence, Hobart, Australia, December 4-8, 2006. Proceedings 19 (pp. 1015–1021). Springer.
- Sun, F., Li, L., Qiu, X., & Liu, Y. (2018). U-net: Machine reading comprehension with unanswerable questions. arXiv preprint arXiv:1810.06638.
- VisualistApp. (2022). Retrieved July 7, 2022. https://www.visualistapp.com/.
- Westland, S., Ripamonti, C., & Cheung, V. (2012). Computational colour science using MATLAB. Hoboken: John Wiley & Sons.
- Yang, J., Chen, Y., Westland, S., & Xiao, K. (2020). Predicting visual similarity between colour palettes. Color Research & Application, 45(3), 401–408. doi:10.1002/col.22492
- Zabotto, C. N., Amaral, D. C., Hornos, C. J., & Benze, B. G. (2019). Automatic digital mood boards to connect users and designers with Kansei engineering. International Journal of Industrial Ergonomics, 74, 102829. doi:10.1016/j.ergon.2019.102829