
 ?Mathematical formulae have been encoded as MathML and are displayed in this HTML version using MathJax in order to improve their display. Uncheck the box to turn MathJax off. This feature requires Javascript. Click on a formula to zoom.
Abstract
Deadwood, a vital component of forest ecosystems, constitutes a quintessential carbon reservoir that must be disclosed under the United Nations Framework Convention on Climate Change. This reservoir, comprising fallen logs, snags, and stumps, markedly affects carbon dynamics over decades. In this study, deadwood carbon stocks were quantified using data from 2674 sites in Japan surveyed between 2011 and 2015 via the National Forest Soil Carbon Inventory, and the deadwood carbon attributes in the country were explored. Deadwood were surveyed using the line intersect method for fallen logs and the belt transect method for stumps and snags. In Japan, the deadwood carbon stock (measured in t-C/ha) was quantified at 7.5 ± 9.74 (mean ± SD), with fallen logs at 3.26 ± 4.43, stumps at 2.45 ± 5.69, and snags at 1.80 ± 5.27, with significant differences detected among these stocks (p < .001). Considering deadwood carbon accumulation in Japan, planted forests exhibited a significantly larger (p < .001) deadwood carbon stock than natural forests. Moreover, planted forests exhibited a higher proportion of fallen logs than snags and stumps, indicating the effects associated with logs left on forest floors after thinning. Based on these findings, deadwood carbon stocks have the potential to bolster the validation and refinement of computational models used in carbon accounting.
Introduction
Deadwood, comprising fallen logs, snags, and stumps [Citation1,Citation2], plays a pivotal role in forest ecosystems, retaining accumulated carbon over extended periods due to its gradual decomposition [Citation3–5]. Given the decelerated carbon reduction rate of deadwood, which takes several decades to halve [Citation6–10], the deadwood carbon store has a substantial influence on long-term forest carbon cycling. Furthermore, microbial and fungal decomposition leads to nutrient release that significantly contributes to forest nutrient cycling [Citation11,Citation12]. Moreover, the presence of deadwood fosters habitat diversity [Citation13–16] and promotes biodiversity in forest ecosystems [Citation17].
Deadwood is a crucial component of forest carbon pools, and its quantification becomes a vital means to understand the impact on the overall carbon balance of forests and their response to climate change. The Food and Agriculture Organization of the United Nations (FAO) [Citation18] states that deadwood constitutes approximately 10% of overall forest carbon stocks, although divergent proportions are evident across ecosystems. In Malaysian tropical forests, deadwood comprises over 50% of aboveground carbon in harvested forests [Citation19], and in North American forests of the Pacific Northwest, it constitutes around 20% of total biomass [Citation2]. Similarly, Puerto Rico’s deadwood and litter combine for a 20% carbon stock [Citation20]. Collectively, these findings indicate the pivotal role of deadwood in carbon stocks across diverse forest settings.
Notably, deadwood carbon stocks exhibit substantial variability compared with other carbon reservoirs. The FAO has reported a global mean carbon stock of 9.7 t-C/ha for deadwood [Citation1], although climate-driven fluctuations have been observed, ranging from 3.1 t-C/ha in boreal tundra woodland climates to 64.4 t-C/ha in subtropical desert climates [Citation1]. Japan is predominantly characterized by warm–humid or humid–continental climates, which have average carbon stocks of 13.2 t-C/ha (range: 0.2–43.8 t-C/ha) and 23.0 t-C/ha (range: 1.6–150.0 t-C/ha), respectively [Citation21]. In Chinese forests, snags, fallen logs, and litter collectively average 5.59 t-C/ha [Citation22], whereas Canada’s deadwood density is 31–78 t-C/ha [Citation23]. These variations highlight the heterogeneity of deadwood carbon stocks even within similar temperate climatic contexts.
The quantity of carbon stocks in deadwood is intricately influenced by various factors inherent in forest processes. These factors encompass the incidence of deadwood in forests, rates of decomposition, and the dynamics of removal. For example, Lutz et al.'s study [Citation24] underscores the crucial role of large-diameter trees in the formation of snag and deadwood biomass, elucidating factors contributing to carbon stock in deadwood. Similarly, Aryal et al. [Citation25] provide insights into the decomposition rates of fine wood in tropical successional forests, offering implications for ecosystem carbon stock. Deadwood plays a significant role in ecosystems, impacting carbon stock and decomposition throughout the ecosystem [Citation8,Citation26]. Therefore, an accurate assessment of current carbon stock levels in deadwood necessitates considering both input (incidence of deadwood) and output (decomposition and removal of deadwood) variables. Furthermore, deadwood carbon stocks are subject to influences from both natural and anthropogenic factors, regardless of whether the forest is in a natural state or under managed planting.
In forest ecosystems, the primary natural factors leading to substantial deadwood generation include forest fires, pest infestations, and severe weather events. Forest fires alone contribute an annual deforestation extent of approximately 67 million ha, equating to 1.7% of global forest cover [Citation27]. Furthermore, estimations indicate that pest invasions and weather-induced damage affect approximately 141.6 million ha, accounting for 5% of the total forested area worldwide [Citation27]. Due to variations in data pertaining to forest disturbances, direct comparisons of affected regions are challenging. Nevertheless, an analysis spanning six distinct global regions revealed the divergent drivers behind forest disturbances [Citation27]. With forest fires excluded, pests emerge as the most pronounced natural influencer across nearly all regions, whereas weather-related disasters prevail as the principal factor in Asia. Multiple reports have highlighted the contributions of these natural factors to deadwood formation and the ensuing carbon stocks. For instance, in the subalpine forests of the United States, standing live trees store an average of 104 t-C/ha, whereas snag carbon stocks decrease to 53 t-C/ha due to forest fires [Citation28]. Similarly, in Canada, the occurrence of deadwood has been widely linked to pest infestations [Citation29,Citation30]. In the Gulf of Mexico, hurricanes have resulted in substantial deadwood accumulation, approximating 37.9–43.9 Tg C, as indicated by field measurements and Landsat data analysis of tree mortality rates [Citation31]. These accounts collectively highlight the significant roles played by distinct natural factors in shaping deadwood occurrence.
In Japan, the amount of deadwood generated due to natural causes is limited. Nonetheless, weather-induced disasters, such typhoons and severe storms, contribute to deadwood occurrence. For example, the Ise Bay Typhoon in 1959 generated 33 t-C/ha of deadwood in Japan [Citation31]. Although comprehensive nationwide data on deadwood occurrence is lacking, insights can be inferred from the area affected by weather disasters, i.e. 4670 ha between 2010 and 2020, which represents 0.2% of Japan’s total forest area [Citation32]. Similarly, the fire-impacted forest area in Japan is 449 ha, constituting a mere 0.02% of the total forest area [Citation33]. Furthermore, the impact of pest infestations on deadwood occurrence in Japanese forests appears minimal. Pine wilt disease, for instance, affects a timber volume of 298,000 m3, representing only 1.5% of pine timber in plantation forests [Citation34]. Analogously, oak decline stands at 192,000 m3, representing just 0.1% of the total broadleaf forest area [Citation34]. With cedar and cypress forests constituting approximately 70% of Japan’s planted forest area [Citation35], the influence of insect infestations within pine and oak forests remains limited. Therefore, deadwood generation in Japan is primarily attributed to non-natural factors.
The main causes of substantial deadwood occurrence in forests are anthropogenic factors, chiefly silvicultural activities. Timber operations yield fallen logs and stumps, accounting for approximately 20% of aboveground biomass [Citation36]. Particularly in Japan, where around 50% of planted forests have attained harvest maturity, ongoing logging activities ensure a steady supply of stumps for a defined period. Planted forests in Japan undergo regular silvicultural interventions to promote tree growth, thereby intensifying the likelihood of deadwood generation from fallen logs and stumps. On a global scale, approximately 7% (294 million ha) of forested expanse comprises planted forests [Citation37]. Japan is one of several countries with substantial forest coverage, ranking third after Germany and Sweden, and features a notable prevalence of planted forests [Citation37]. In countries with high planted forest ratios, the output of fallen logs and stumps resulting from silvicultural actions can significantly influence carbon sequestration dynamics.
The substantial output of deadwood from forests is shaped by a combination of factors encompassing its removal from the forest domain and subsequent decomposition. Harvest intervals, forest residue management [Citation38,Citation39], and utilization as an energy resource all contribute to deadwood output. Sweden and Finland exemplify active removal of fallen logs and stumps from forests for use as energy resources. In Japan, the introduction of the Feed-in Tariff system for renewable energy in 2012 bolstered wood biomass utilization from thinning and forest residues. This trend indicates a progression toward reliance on domestic wood resources, as evidenced by the domestic production of wood chips surpassing imports in 2014, with domestic production in 2021 (9.350 million m3 vs. 5.394 million m3 in imports) accounting for 63% of the total.
Efforts to preserve biodiversity may impede deadwood removal from forests. In Sweden, forest regulations mandate the maintenance of biodiversity, stipulating the retention of a specified tree quota within the forest setting. This conservation directive could also conceivably impact deadwood quantities [Citation40].
Despite the inherent challenge in measuring deadwood carbon stocks, forests represent pivotal global carbon reservoirs that are vital for comprehending sustainable forest management, ecosystem interplay, and climate dynamics. Therefore, this study aims to accurately estimate forest-wide carbon stocks through deadwood carbon quantification. Deadwood is one of the five carbon pools defined by the United Nations Framework Convention on Climate Change [Citation21]. Japan, bound by obligations under the Kyoto Protocol and the Paris Agreement, engages in forest carbon sequestration reporting, estimating carbon stocks in soil, litter, and deadwood through the CENTURY-Jfos process model. The model-derived calculations require improvement and validation, including on-site surveys. In response, the National Forest Soil Carbon Inventory (NFSCI) conducts comprehensive national-level investigations into soil, litter, and deadwood carbon stocks within Japanese forests. The initial NFSCI phase (2006–2010) covered 2462 sampling sites over a five-year period. Although prior studies have reported on carbon stocks in fallen logs [Citation41], carbon stocks in snags and stumps have not been reported. Leveraging NFSCI data from 2674 sampling sites (2011–2015), individual carbon stocks in fallen logs, snags, and tree stumps were calculated in the current study, with the aim of revealing differences in carbon sequestration between managed plantations and natural forests. Additionally, the environmental factors influencing carbon retention in deadwood were analyzed.
Materials and methods
Study site and survey plot
The scope of this investigation encompassed Japan’s forests, excluding zones designated for agricultural and residential use. The country’s total forest area spans approximately 25.08 million ha, constituting roughly two-thirds of its entire land area. Within this, natural forests extend over approximately 14.79 million ha, equivalent to around 60% of the overall forest area, whereas artificial forests comprise approximately 10.29 million ha, accounting for approximately 40% of the total forest area. Coniferous trees dominate the forest ecosystems, comprising 50% of trees, with broadleaf trees constituting 44% (Forestry Agency, National Forest Inventory of Japan, 3rd phase). Among coniferous trees, species such as Japanese cedar (Cryptomeria japonica), Japanese cypress (Chamaecyparis obtusa), and pine trees (Pinus spp.) collectively occupy approximately 90% of the total forest area, whereas representative broadleaf species include oak (Quercus spp.) and beech (Fagus spp.) (Forestry Agency, National Forest Inventory of Japan, 3rd phase). According to the Köppen climate classification, Japan’s climate is categorized as either warm–temperate–humid or humid–continental. The mean annual temperature ranges from 4.8 to 22.3 °C across prefectures from north to south, and average annual precipitation varies from 1251 to 2386 mm (Mesh Climate Data of Japan 2010; statistical period: 1981–2010).
Survey plots were derived from the Forest Ecosystem Diversity Basic Survey (FEDBS; previously the Forest Resource Monitoring Survey) conducted by the Forestry Agency. These plots were set up at 4 × 4 km grid intervals to cover the entire forested area of Japan, with each intersection representing a forested area. Within the scope of the NFSCI, one-fifth of these plots were selected for analysis. This study leveraged data from 2674 plots surveyed during the 2nd NFSCI phase (2011–2015) ().
Figure 1. Distribution of survey sites (solid circles) in Japan. Green indicates forested areas determined by JAXA (Japan Aerospace Exploration Agency)'s ALOS (Advanced Land Observing Satellite).
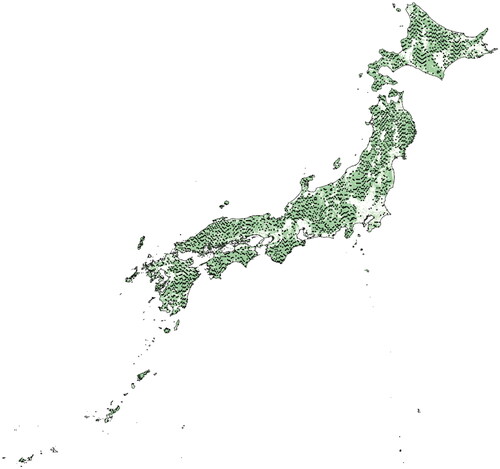
Within each grid point, a circular area of 1000 m2 was demarcated by drawing straight lines approximately 17.8 m in length in the north–south and east–west directions from the grid site’s center. Subsequently, surveys were conducted to assess deadwood intersecting these lines ( and ). Deadwood was categorized into coniferous trees, broadleaf trees, unidentified large stumps, and bamboo. Additionally, the degree of decomposition was determined based on deadwood appearance, and the diameter of the intersecting sections was measured.
Figure 2. Design of a sampling plot.
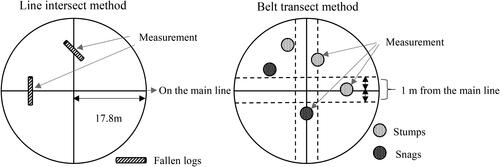
Table 1. Survey methods by deadwood composition.
Classification of dead wood
In this study, dead trees were categorized into three groups: fallen logs, stumps, and snags. Dimensions and decay stages were also determined, as they are essential for accurately gauging the volume of deadwood in a forest area. The study was conducted using two different methods, which are described in detail below.
Measurement of fallen logs
Fallen logs were surveyed using the line intersect method [Citation42–44] based on the Intergovernmental Panel on Climate Change Good Practice Guidance for Land Use, Land-Use Change, and Forestry framework. For logs that intersected east–west and north–south lines, diameters were measured along these lines. Inclusion criteria for analysis were as follows: logs with a diameter exceeding 5 cm, devoid of roots due to felling or breakage, a length surpassing 1.5 m, and exhibiting exposed roots coupled with a length (excluding roots) greater than 1.5 m. The carbon stocks of fallen logs were calculated by multiplying wood density (as detailed in ) with the corresponding carbon stocks contingent on the extent of decomposition. The following equations were used to determine the dead wood carbon stock of fallen logs (1) (kg/m2):
(1)
(1)
where
Table 2. Wood density in each decay class of deadwood.
CDWfd (kg/m2) is the dead wood carbon stock of fallen logs for each species category (including undetermined) and decay class.
Vf (m3/ha) is the wood volume of fallen logs.
D (mm) is the diameter of fallen logs.
Lns (m) indicates the horizontal length of the north–south line.
Lew (m) is the horizontal length of the east–west line.
d is the decay class of dead wood, with six levels from 0 to 5.
Msd (g/cm3) is the wood density classified according to decay classes (0–5) for each species category ().
CC (g/kg) is the carbon concentration; the carbon concentration of dead logs was set at 500 g/kg regardless of species or decay level.
Measurement of stumps and snags
Stumps and snags were measured using the belt transect method. Measurements were conducted within a 1 m range on both east–west and north–south lines, targeting stumps and snags present in this designated area. Diameters and heights were measured, species were identified, and decomposition stages were determined. Stumps were delineated by a diameter ≥5 cm and standing height ≤1.5 m from the ground, and if fallen, stumps with root lengths >1.5 m were excluded. Snags comprised specimens with diameter ≥5 cm at breast height and height >1.5 m from the ground. Aboveground biomass was derived from diameter and height values, integrated into the following formula. Additionally, belowground biomass was estimated using diameter data, with this data added to aboveground biomass to obtain total biomass. Carbon stocks were subsequently determined by multiplying total biomass by wood density and carbon stock values specific to each species and decomposition stage.
The formulas used for dead wood carbon stock of stumps and snags calculation were as follows (2) (kg/m2):
(2)
(2)
where
CDWssd (kg/m2) is the dead wood carbon stock of stumps and snags for each species category (including undetermined) and decay class.
d is the decay class of dead wood, with six levels from 0 to 5.
Vss (cm3/m2) is the wood volume of stumps and snags.
VSi (cm3) is volume of the ith stump.
m is the total number of stumps measured at the relevant grid point.
VDj (cm3) is the volume of the jth snag.
n is the total number of snags measured at the relevant grid point.
Lns (m) indicates the horizontal length of the north–south line.
Lew (m) is the horizontal length of the east–west line.
Msd (g/cm3) is the wood density classified according to decay classes (0–5) for each species category ().
CC (g/kg) is the carbon concentration; the carbon concentration of dead logs was set at 500 g/kg regardless of species or decay level.
Statistical analysis
Mapping the distribution of survey sites involved importing data from the NFSCI, representing 2674 sites, into QGIS 3.18. The data utilized for the description of the green forested area in the illustration originates from the Global PALSAR Mosaic and Forest/Non-forest Map (1 km resolution version) developed by the Japan Aerospace Exploration Agency (JAXA) Earth Observation Research Center (EORC) [Citation46]. Statistical analysis of deadwood carbon stocks was performed using R version 4.3.2 to calculate the mean, median, and standard deviation. Additionally, histograms were generated using the hist function. Deadwood was classified as fallen logs, stumps, and snags, and differences in their carbon stocks were tested for significance using the Tukey–Kramer method (TukeyHSD function). The impact of forest management on carbon stocks was evaluated by categorizing the growing environment into planted and natural forests, with differences tested through Welch’s t-test (t.test function). The carbon stocks in fallen logs, stumps, and snags in both forest types were also subjected to the same analytical approach.
Environmental factors affecting deadwood carbon stocks
The environmental factors impacting deadwood carbon stocks were estimated using a general linear model. The dependent variable was the deadwood carbon stocks (fallen logs, stumps, and snags) per grid point, obtained through on-site surveys conducted during the 2nd NFSCI. Given the non-normal distribution of the carbon stocks histogram, a logarithmic transformation was applied. Notably, carbon quantities lower than 0.1 t-C/ha were recorded as 0, necessitating a logarithmic transformation using the formula log10 (original data + 0.1). This resulted in an approximately normal distribution in the histogram. The mean and standard deviation for log-transformed values were −0.279 and 0.424, respectively.
Nine independent variables, hypothesized to influence deadwood carbon stocks, were selected based on the literature and experience (). Meteorological factors, including temperature, elevation, and precipitation, were extracted from mesh climate values for each grid point, based on their latitude and longitude [Citation47]. These data were sourced from statistical records covering the period 1981 to 2010, providing annual and monthly temperature and precipitation values at 1 km mesh intervals. Elevation data, structured with 250 m spacing within each mesh (1 km2), included maximum, minimum, and mean values, incorporating terrain attributes, such as elevation, maximum slope, direction, and valley density.
Table 3. List of explanatory variables, databases and data.
Aboveground attributes, including dominant tree species, ownership classification, forest type, and forestry operation, were analyzed using data from FEDBS phase 2 (2004–2008) and phase 3 (2009–2013). The congruence of grid sites between this survey and FEDBS enabled deadwood analysis using aboveground biomass data. Therefore, FEDBS definitions were used. Dominant tree species were visually determined and recorded for one or two major species comprising the canopy. Forest types were classified into planted forests, natural forests, and others. The ‘others’ category included clear-cut areas, undeveloped woodlands, and bamboo groves. Natural forests refer to forests with standing trees other than planted forests. Planted forests were defined by the presence of standing trees established through planting or seeding, with the proportion of standing trees of the target species for such planting/seeding being 50% or higher. Forestry operation was recorded if clear-cutting, multilayered thinning, selective thinning, or intermediate thinning had been conducted within the past 10 years (the total period of the 2nd and 3rd phases of the FEDBS).
Of 2674 survey sites, 2255 sites were used for analysis, excluding the “Not Available” data. Data on more than 400 sites were missing due to survey inaccessibility, survey incompleteness, and deadwood carbon stock calculation failure.
As some of the independent variables were qualitative in nature, they were converted into dummy variables for numerical representation, focusing on four variables: dominant tree species, ownership classification, forest type, and forestry operation (). To mitigate multicollinearity, a reference category, with a designated value of 0, was selected for each variable: “conifer” for dominant tree species, “national forest” for ownership classification, “natural forest” for forest type, and “no forestry operation history” for forestry operation, indicating no clear-cutting, multilayered thinning, selective thinning, or intermediate thinning within the past 10 years. Standardized values were used for quantitative variables (Mean annual temperature [MAT], Digital elevation model; [DEM], precipitation, volume, and forest age) to ensure compatibility for analysis.
Correlation of variables
The correlation between explanatory variables was determined using the pairs panels function in the psych package [Citation48]. As the number of explanatory variables increased, the risk of overfitting also increased, potentially inflating the apparent goodness of fit. Therefore, in cases where highly correlated pairs of explanatory variables were identified, it was necessary to exclude one of the variables to mitigate this concern. Furthermore, to discern the presence of multicollinearity among explanatory variables, the variance inflation factor (VIF) was calculated, using the VIF function in the car package [Citation49], following the method outlined by Zuur [Citation50].
Model selection
An analysis was conducted to elucidate the factors influencing carbon stocks in deadwood, and the optimal model was determined. Due to the large number of variables, a stepwise selection process facilitated by the stepAIC function in the MASS package [Citation51] was adopted, making it easier to determine a model incorporating interaction terms [Citation52]. Among the variables, data points with a value of 0 were excluded for volume, age, precipitation, and DEM. Logarithmic transformations were applied to continuous variables such as age, DEM, precipitation, and volume. Furthermore, all quantitative variables were standardized. The inclusion of interaction terms is based on the assumption that certain variables may exhibit synergistic effects on environmental factors. To incorporate interaction terms into the model, the product of explanatory variables was included alongside individual variables.
In the model selection process, the Akaike Information Criterion (AIC) was computed for all possible combinations of the nine explanatory variables. The model with the lowest AIC among the calculated models was considered the most effective for explaining the factors influencing deadwood carbon stocks.
Results
Deadwood carbon stocks in Japan
The NFSCI conducted surveys across 2674 forest sites in Japan between 2011 and 2015. For the analysis, data from 2255 of these sites were used. Carbon content per unit area at the surveyed sites ranged from 0 to 97.3 t-C/ha, with mean ± standard deviation (SD) and median values of 7.50 ± 9.74 and 4.17 t-C/ha, respectively (). Of the 2255 analyzed sites, 420 had carbon stocks below 0.1 t-C/ha, and 105 exhibited 0 t-C/ha (23% of total sites). Consequently, the carbon stocks histogram had a left-skewed distribution.
Table 4. All (planted, natural, and other), planted, and natural forest deadwood carbon stocks in Japan, and their respective carbon stocks by composition (t-C/ha).
Deadwood carbon stocks in Japan by composition
Deadwood was categorized into fallen logs, stumps, and snags, and their mean carbon stocks were compared. Carbon stocks were 3.26 ± 4.43 t-C/ha for fallen logs, 2.45 ± 5.69 t-C/ha for stumps, and 1.80 ± 5.27 t-C/ha for snags (). Multiple comparisons via the Tukey–Kramer method indicated that carbon stocks in fallen logs were significantly larger than those in stumps, whereas carbon stocks in snags were significantly smaller than those in stumps (p < .001).
Deadwood carbon stocks in Japanese planted and natural forests
Forest management effects were compared between planted and natural forest environments (). Carbon stocks in these forests were compared based on forest-type classifications in the 2nd and 3rd phases of the FEDBS, with stocks in planted forests (9.0 ± 10.42 t-C/ha) found to be significantly greater (p < .001) than those in natural forests (6.2 ± 8.90 t-C/ha).
Carbon stocks in fallen logs, stumps, and snags in Japanese planted and natural forests
Deadwood (fallen logs, stumps, and snags) carbon stocks were compared between planted and natural forests, and significant differences were detected. For instance, in planted forests, fallen logs and stumps exhibited elevated carbon stocks compared with those in natural forests. Specifically, the carbon stocks of fallen logs were 3.73 ± 4.80 and 2.90 ± 4.09 t-C/ha in planted and natural forests, respectively. Similarly, stumps exhibited carbon stocks of 3.89 ± 7.28 t-C/ha in planted forests and 1.12 ± 3.14 t-C/ha in natural forests. Additionally, snag carbon stocks were 1.37 ± 3.89 and 2.20 ± 6.30 t-C/ha in planted and natural forests, respectively (). These differences were statistically significant at p < .001.
Analysis of factors influencing deadwood carbon stocks
A linear model was used to analyze factors impacting deadwood carbon stocks. Among the explanatory variables, DEM and MAT, precipitation and MAT, MAT and ownership classification, forest age and forest type, and dominant tree species and forest type showed significant but weak correlations (). Subsequent VIF analysis confirmed the absence of multicollinearity, with all VIF values below 3 (). All nine variables, considering their inter-relationships, were included in the regression analysis. Following model evaluation, the optimal model with the lowest AIC value and the highest R2 value was selected. In this model, five out of the nine variables significantly influenced carbon stocks (). Prominent variables included ownership classification, dominant tree species, forestry operation, volume, and DEM. The coefficient of determination (multiple R2) was 0.175, the adjusted coefficient of determination (adjusted R2) was 0.164, and the AIC was 2065. Each selected variable not only has a standalone impact but also exhibits statistically significant interactions with other variables. Consequently, the main effects of the chosen five variables are constrained by significant interactions. Overall, these findings reflect the environmental and forest characteristics of Japan.
Discussion
Significant carbon sequestration in planted forests in Japan
Ugawa [Citation41] had reported higher carbon stocks of 4.2 t-C/ha for fallen logs compared with our results (3.26 t-C/ha) (). This discrepancy can be attributed to differences in survey methods and measurement targets between the two studies. The initial NFSCI (2006–2010) included stumps within the fallen logs category, whereas the 2nd NFSCI measured stumps and fallen logs separately. As a result, carbon stocks in fallen logs during the 2nd NFSCI were lower than in the first NFSCI. Furthermore, the comprehensive evaluation of all snags and stumps during the 2nd NFSCI enabled more precise carbon stock measurements.
Comparisons were drawn between Japan’s deadwood carbon stocks, as derived from the NFSCI, and those of six global regions. Although Japan’s average deadwood carbon stock value of 7.5 t-C/ha contrasts with the worldwide average (9.7 t-C/ha) [Citation1], it is consistent with the Asian average (6.9 t-C/ha) [Citation1] (). Nevertheless, significant regional disparities were apparent. Over the past two decades, deadwood carbon stocks in managed forests with thinning history in Japan have ranged from 6.7 t-C/ha for Larix kaempferi to 22.3 t-C/ha for Cryptomeria japonica [Citation53]. Our 2nd NFSCI outcomes fall within the range reported by Takahashi [Citation53].
Figure 3. Deadwood carbon stocks in six global regions. Deadwood carbon stocks in Japan and worldwide [Citation1].
![Figure 3. Deadwood carbon stocks in six global regions. Deadwood carbon stocks in Japan and worldwide [Citation1].](/cms/asset/7871400d-1a66-4f24-9986-f6de0188b006/tcmt_a_2315087_f0003_b.jpg)
Our comparison of deadwood carbon stocks between Japan’s planted forests and natural forests highlighted the higher carbon sequestration capacity of planted forests. There was a marked expansion of planted forest coverage, propelled by forest policy initiatives implemented since the 1960s [Citation54]. By the 1980s, planted forests spanned 10 million ha, constituting 40% of Japan’s forested area [Citation54].
The liberalization of timber imports in 1964 led to a decline in thinning material prices in Japan. This economic shift rendered thinning material sales impractical due to high transportation costs, which culminated in the practice of leaving deadwood in forested areas, known as “abandonment thinning” [Citation55]. This trend resulted in an increase in deadwood volume in planted forests due to fallen logs remaining in forested terrain, in contrast to natural forests. Consequently, deadwood carbon stocks in planted forests have increased.
Conversely, countries such as Russia, Brazil, Canada, and the United States have a much lower proportion of planted forests, accounting for <10% of their forested areas [Citation37]. Their predominant focus is on maintaining substantial acreage of natural forests. Consequently, the quantity of deadwood in natural forests markedly influences national-level deadwood volumes. Factors increasing deadwood volumes within natural forests include tree competition for essential resources, such as light, water, and nutrients [Citation56]. Weaker trees, experiencing slower growth and heightened susceptibility to mortality, contribute to this dynamic [Citation57]. Notably, unlike planted forests, deadwood within natural ecosystems persists within forest boundaries, preserving ecosystem diversity and forest attributes, as evidenced in numerous studies [Citation14,Citation58,Citation59]. In primeval forests, particularly in the north, a large amount of deadwood is considered a characteristic feature.
Collectively, these findings suggest that despite similar planted-to-natural forest area proportions in Japan, planted forests accommodate greater deadwood volumes. This trend is potentially influenced by changes in forest policy and the timber market.
Impact of forest management on the percentage of fallen logs, stumps, and snags
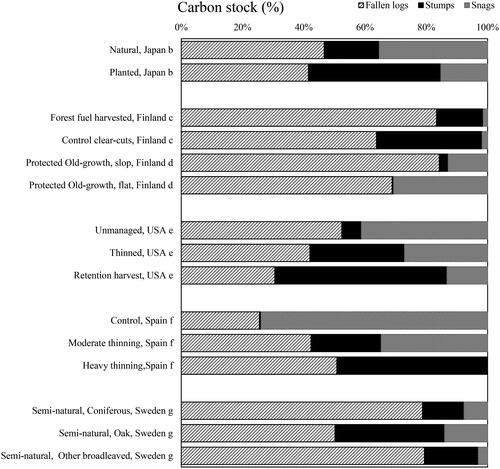
The influence of forest management on the distribution of fallen logs, stumps, and snags within forests warrants examination. In natural Japanese forests, the proportions of fallen logs, stumps, and snags were 47%, 18%, and 35%, whereas in planted forests, they were 41%, 43%, and 15%, respectively (). Comparatively, stumps and snags exhibited larger and smaller proportions, respectively, in planted forests than in their natural counterparts. Notably, the most significant discrepancy in carbon stocks occurred in stumps, with a threefold increase in their proportion observed in planted forests. These findings highlight the link between forest management intensity and the distribution of fallen logs, stumps, and snags.
Figure 4. Distribution of fallen logs, stumps, and snags by forest management in various countries.
Tree species: Japan: this study. Finland: European red pine or Scots pine (Pinus sylvestris L.), Norway spruce (Picea abies (L.) Karst.). USA: western hemlock (Tsuga heterophylla (Raf.) Sarg.) or grand fir (Abies grandis (Dougl. ex D. Don) Lindl.). Spain: French bay gooseberry (Pinus pinaster Ait.). Sweden: European oak (Quercus robur), Norway spruce (Picea abies (L.) Karst.), birch (Betula pendula Roth, Betula pubescens Ehrhs), poplar (Populus tremula L.).
Forest practices, such as thinning and logging, in Japanese planted forests tend to generate fallen logs and stumps, engendering higher carbon stocks within these forested domains. An assessment of fallen logs supplied from 2004 to 2013 (227/2027 grid sites) corroborated this trend. Specifically, fallen logs from sites with thinning and clear-cutting histories yielded significantly higher (p < .001) carbon stocks, at 0.46 t-C/ha, compared with 0.31 t-C/ha in sites without such histories. This discrepancy can be attributed to the inclusion of felled trees as fallen logs in sites with a history of thinning or clearing.
Stumps, constituting 21% of trunk dry weight in Swedish poplar forests [Citation36] and 17% of total tree biomass in Norway spruce forests in Finland [Citation60], displayed differing patterns (). Using the data from the NFSCI, we estimated the occurrence of stumps (270/1982 grid points), including a history of logging, thinning, intermediate cutting, and clear-cutting. Carbon input from stumps was 0.49 t-C/ha, whereas carbon accumulation in areas without such history was significantly lower at 0.21 t-C/ha (p < .001). In Japan, stumps are rarely harvested during tree treatments, leading to larger carbon stocks attributed to stumps remaining after treatment. Natural forests, however, exhibit stumps primarily resulting from fallen snags, which have a limited carbon stock impact due to the lower probability of snags.
Snags accumulated more carbon in natural forests than in their planted counterparts. This disparity arises from the managed nature of planted forests, where trees are felled preemptively according to “forest density management charts” [Citation61] for thinning and growth predictions, limiting the occurrence of snags. Conversely, snags thrive in natural forests through natural mortality or fallen logs, increasing carbon stocks.
A comparative assessment of forest management intensity between Japan and Finland revealed intriguing contrasts. Although both countries host substantial planted forests, the notable distinction lies in stump proportions. Japan’s practice of sparing stumps during forest operations (due to their unprofitability and the labor-intensive nature of stump harvesting) contributes to their higher prevalence in the country, whereas Finland practices stump harvesting for biomass power generation and other purposes [Citation62]. Stump removal reportedly increases bioenergy production and improves site conditions and disease incidence, although the impact of stump harvesting on biodiversity is under debate [Citation63].
Forests in the United States and Spain, which have fewer planted forests, also exhibit significant stump proportions, akin to Japan [Citation64–66]. This convergence may be attributed to forestry management, fostering dead wood accumulation in a manner similar to natural cycles. In addition, it is due to stumps not being harvested as energy resource.
In summary, the degree and method of forest management play a pivotal role in shaping the distribution of fallen logs, stumps, and snags, thereby influencing carbon stocks within forest ecosystems.
Future prospects of deadwood carbon stocks in Japan
The trajectory of future carbon stocks in Japanese deadwood remains uncertain. Multiple influences, including both human activities and natural factors, and the interactions between these elements make it difficult to predict future changes accurately.
The Century Model, as employed by Hashimoto et al. [Citation67], provides insights into potential future scenarios. Projections suggest an increase of carbon sequestration in deadwood with longer rotation periods. Specifically, longer tree retention periods, such as 30-, 50-, and 100-year rotations involving thinning and thinned logs all left on the forest floor, are anticipated to yield higher deadwood carbon accumulation compared with situations involving thinning and forest floor removal. Notably, policy orientation toward the retention or removal of fallen logs post-thinning could also exert an influence on carbon stocks.
Much of Japan’s forest management is driven by active encouragement of thinning and reforestation with high-quality seedlings, facilitated by special measures introduced in 2008. These initiatives, aimed at accelerating forest growth and enhancing carbon stocks, substantiate Japan’s commitment to forest absorption targets mandated by the Paris Agreement (Special Measures Law for Promotion of Thinning in Forests, 2008). With a projected annual thinning coverage of approximately 450,000 ha by 2030 in Japan, it is foreseeable that an escalation in thinning activities will increase the carbon stock of stumps. The current annual thinning (440,000 ha) and main felling (77,947 ha) practices in Japan steadily contribute to stump carbon stock. Moreover, the maturation of coniferous trees is expected to increase the carbon stock of stumps, which will be further increased by enlarging stump sizes as trees mature.
The occurrence of deadwood due to natural factors, such as large-scale insect infestations, as observed in Europe and North/Central America [Citation27], and natural disasters, including fires, storms, and heavy rain, can markedly increase deadwood abundance. Although Japan’s current supply of deadwood arising from natural factors is limited, shifting climatic dynamics could lead to an escalated influx of deadwood due to these phenomena. Furthermore, with rising temperatures, termites as decomposers may further accelerate the decomposition of deadwood [Citation68].
In addition, the impact of dead wood being removed from the forest was discussed. The Japanese government uses woody biomass as an energy resource to address climate change and expand renewable energy sources. Woody biomass, including deadwood and forest residues resulting from logging, is expected to be used for energy. Increasing the utilization rate of woody biomass could change the output of deadwood. Currently, Japan produces approximately 8 million tons of woody biomass annually, with a 9% utilization rate that is projected to rise to about 30% by 2025 [Citation69]. To achieve this goal, effective woody biomass application is essential. A decrease in residual deadwood left in the forest could reduce the carbon fixation capacity within forest ecosystems. Conversely, the use of deadwood beyond the forest boundary, such as in construction, could contribute to carbon stocks outside the forest.
In Japan, stumps play a crucial role in preventing soil erosion [Citation70], a significant concern given the nation’s high average annual precipitation (Mesh Climate Data of Japan 2010; statistical period: 1981–2010), and mountainous terrain (70%). Indeed, in a country where heavy rainfall and typhoons pose substantial soil disaster risks, trees help prevent soil erosion even after they are cut down and become stumps [Citation70]. This dual function of stumps as erosion safeguards and carbon repositories is emphasized in governmental surveys [Citation71]: “absorbing carbon dioxide to contribute to preventing global warming” is highly desired, along with the role of “preventing disasters such as landslides and floods.” Consequently, the removal of stumps in planted forests is unlikely to continue to be promoted in Japan.
Conclusion
This study presents a comprehensive assessment of carbon stocks in Japanese deadwood, spanning the period 2011–2015, offering insights into broader forest carbon dynamics. We determined the carbon stocks of fallen logs, stumps, and snags, comprising Japan’s dead wood composition, revealing distinct variations in their carbon content. Notably, Japanese planted forests emerged as reservoirs of larger carbon stocks compared with their natural counterparts. This disparity is attributed to the abandonment of fallen logs in planted forests during the study period, increasing carbon stocks through unattended accumulation. Furthermore, we identified factors that affect deadwood carbon stocks, including ownership classification, dominant tree species, forestry operations, volume, and DEM. These findings provide data that will be useful for implementing the Paris Agreement and verifying the carbon dynamics of deadwood pools reported in Japan using a carbon dynamic model. However, the amount of deadwood is expected to vary substantially in the future owing to changes in wood use and forest management policies.
In the future, clarification of deadwood carbon stocks may take on increased importance given the efforts to achieve carbon neutrality by 2050 and the growth of the carbon credit market in line with the Sustainable Development Goals. The outcomes of the present study can be used to validate and improve models driving future forest management strategies and accounting frameworks.
Acknowledgments
This research is the outcome of the National Forest Soil Carbon Inventory (NFSCI) conducted and supported by the Forestry Agency in Japan. This work was supported by the JSPS KAKENHI under Grant Number JP22H02400. We thank the various sampling and analysis companies for their cooperation in collecting and analyzing soil samples. We are also grateful to the Forest Soil Division at the Forestry and Forest Products Research Institute for generating dependable and advanced datasets. In particular, we wish to express our sincere gratitude to Dr. Toru HASHIMOTO and Dr. Yoshiyuki INAGAKI for their expert validation of deadwood data. We also thank Dr. Kazuhito MORISADA, Dr. Nagaharu TANAKA, and Dr. Hisao SAKAI for their cooperation and advice regarding this research.
Disclosure statement
The authors report there are no competing interests to declare.
Data availability statement
Data are not available – access to data is restricted because the data is under government jurisdiction and control.
Correction Statement
This article has been corrected with minor changes. These changes do not impact the academic content of the article.
Additional information
Funding
References
- FAO. Global Forest resources assessment 2005.FAO Forestry Paper 147. Rome, FAO; 2006.
- Harmon ME, Franklin JF, Swanson FJ, et al. Ecology of coarse woody debris in temperate ecosystems. In: Macfadyen A, Jovanovich HB, editors. Advances in ecological research. London: Academic Press, 1986;15. p. 133–302.
- Krankina ON, Harmon ME. Dynamics of the dead wood carbon pool in northwestern Russian boreal forests. Water Air Soil Pollut. 1995;82(1-2):227–238. doi: 10.1007/BF01182836.
- Chambers J, Higuchi N, Schimel J, et al. Decomposition and carbon cycling of dead trees in tropical forests of the Central Amazon. Oecologia. 2000;122(3):380–388. doi: 10.1007/s004420050044.
- Luyssaert S, Schulze ED, Börner A, et al. Old-growth forests as global carbon sinks. Nature. 2008;455(7210):213–215. doi: 10.1038/nature07276.
- Sakai Y, Takahashi M, Ishizuka S, et al. Estimating decay rates of dead wood by changes in wood density in coniferous plantation in Japan. Jpn J For Environ. 2008;50(2):153–165. Japanese with English summary.
- Köhl M, Stümer W, Kenter B, et al. Effect of the estimation of forest management and decay of dead woody material on the reliability of carbon stock and carbon stock changes – a simulation study. For Ecol Manage. 2008;256(3):229–236. doi: 10.1016/j.foreco.2008.04.004.
- Russell MB, Woodall CW, Fraver S, et al. Residence times and decay rates of downed woody debris biomass/carbon in eastern US forests. Ecosystems. 2014;17(5):765–777. doi: 10.1007/s10021-014-9757-5.
- Russell MB, Fraver S, Aakala T, et al. Quantifying carbon stores and decomposition in dead wood: a review. For Ecol Manage. 2015;350:107–128. doi: 10.1016/j.foreco.2015.04.033.
- Seibold S, Rammer W, Hothorn T, et al. The contribution of insects to global forest deadwood decomposition. Nature. 2021;597(7874):77–81. doi: 10.1038/s41586-021-03740-8.
- Attiwill PM, Adams MA. Nutrient cycling in forests. New Phytol. 1993;124(4):561–582. doi: 10.1111/j.1469-8137.1993.tb03847.x.
- Bani A, Pioli S, Ventura M, et al. The role of microbial community in the decomposition of leaf litter and deadwood. Appl Soil Ecol. 2018;126:75–84. doi: 10.1016/j.apsoil.2018.02.017.
- Jonsson BG, Kruys N, Ranius T. Ecology of species living on dead wood – lessons for dead wood management. Silva Fenn. 2005;39(2):289–309. doi: 10.14214/sf.390.
- Dittrich S, Jacob M, Bade C, et al. The significance of deadwood for total bryophyte, lichen, and vascular plant diversity in an old-growth spruce forest. Plant Ecol. 2014;215(10):1123–1137. doi: 10.1007/s11258-014-0371-6.
- Ódor P, Heilmann-Clausen J, Christensen M, et al. Diversity of dead wood inhabiting fungi and bryophytes in semi-natural beech forests in Europe. Biol Conserv. 2006;131(1):58–71. doi: 10.1016/j.biocon.2006.02.004.
- Moreira-Arce D, Vergara PM, Fierro A, et al. Standing dead trees as indicators of vertebrate diversity: bringing continuity to the ecological role of senescent trees in austral temperate forests. Ecol Indic. 2021;129:107878. (doi: 10.1016/j.ecolind.2021.107878.
- Ekbom B, Schroeder LM, Larsson S, et al. Stand specific occurrence of coarse woody debris in a managed boreal forest landscape in Central Sweden. For Ecol Manage. 2006;221(1-3):2–12. doi: 10.1016/j.foreco.2005.10.038.
- FAO. Global Forest resources assessment 2010 (FAO Forestry Paper 163). Rome (Italy): FAO; 2010.
- Pfeifer M, Lefebvre V, Turner E, et al. Deadwood biomass: an underestimated carbon stock in degraded tropical forests? Environ Res Lett. 2015;10(4):044019. doi: 10.1088/1748-9326/10/4/044019.
- Oswalt SN, Brandeis TJ, Woodall CW. Contribution of dead wood to biomass and carbon stocks in the Caribbean: St. John, U.S. Virgin Islands. Biotropica. 2008;40(1):20–27. doi: 10.1111/j.1744-7429.2007.00343.x.
- IPCC. Chapter 4: forest land. In: Eggleston S, Buendia L, Miwa K, et al. editors. 2006 IPCC guidelines for national greenhouse gas inventories. Kanagawa (Japan): Intergovernmental Panel on Climate Change; 2006. p. 11–12
- Peng S, Wen D, He N, et al. Carbon storage in China’s forest ecosystems: estimation by different integrative methods. Ecol Evol. 2016;6(10):3129–3145. doi: 10.1002/ece3.2114.
- Fredeen AL, Bois CH, Janzen DT, et al. Comparison of coniferous forest carbon stocks between old-growth and young second-growth forests on two soil types in Central British Columbia, Canada. Can J For Res. 2005;35(6):1411–1421. doi: 10.1139/x05-074.
- Lutz JA, Struckman S, Germain SJ, et al. The importance of large-diameter trees to the creation of snag and deadwood biomass. Ecol Process. 2021;10(1):1–14. doi: 10.1186/s13717-021-00299-0.
- Aryal DR, De Jong BHJ, Gaona SO, et al. Fine wood decomposition rates decline with the age of tropical successional forests in southern Mexico: implications to ecosystem carbon storage. Ecosystems. 2022;25(3):661–677. doi: 10.1007/s10021-021-00678-w.
- Puhlick JJ, Weiskittel AR, Fraver S, et al. Assessing the role of natural disturbance and forest management on dead wood dynamics in mixed-species stands of Central Maine, USA. Can J For Res. 2016;46(9):1092–1102. doi: 10.1139/cjfr-2016-0177.
- van Lierop P, Lindquist E, Sathyapala S, et al. Global forest area disturbance from fire, insect pests, diseases and severe weather events. For Ecol Manage. 2015;352:78–88. doi: 10.1016/j.foreco.2015.06.010.
- Bradford JB, Fraver S, Milo AM, et al. Effects of multiple interacting disturbances and salvage logging on forest carbon stocks. For Ecol Manage. 2012;267:209–214. doi: 10.1016/j.foreco.2011.12.010.
- Kurz WA, Stinson G, Rampley GJ, et al. Risk of natural disturbances makes future contribution of Canada’s forests to the global carbon cycle highly uncertain. Proc Natl Acad Sci USA. 2008;105(5):1551–1555. doi: 10.1073/pnas.0708133105.
- Kurz WA, Dymond CC, Stinson G, et al. Mountain pine beetle and forest carbon feedback to climate change. Nature. 2008;452(7190):987–990. doi: 10.1038/nature06777.
- Suzuki SN, Tsunoda T, Nishimura N, et al. Dead wood offsets the reduced live wood carbon stock in forests over 50 years after a stand-replacing wind disturbance. For Ecol Manage. 2019;432:94–101. doi: 10.1016/j.foreco.2018.08.054.
- Forestry Agency J. Weather-related disasters in private forests. In: Forest and forestry statistics handbook. Tokyo: Forestry Agency J. National Forestry Extension Association in Japan; 2022. p. 54.
- Forestry Agency J. Fire damage. In: Forest and forestry statistics handbook. Tokyo: Forestry Agency J. National Forestry Extension Association in Japan; 2022. p. 52.
- Forestry Agency J. Current state of forest resources. In: Forest and forestry statistics handbook. Tokyo: Forestry Agency J. National Forestry Extension Association in Japan; 2022. p. 55.
- Forest Agency. Annual report on trends in forest and forestry in Japan – fiscal year 2019 (summary). 2019. Available from: https://www.maff.go.jp/e/data/publish/
- Johansson T, Hjelm B. Stump and root biomass of poplar stands. Forests. 2012;3(2):166–178. doi: 10.3390/f3020166.
- FRA. Global Forest Resources Assessment 2020: Main report. Rome: Food and Agriculture Organization of the United Nations; 2020.
- Krueger I, Schulz C, Borken W. Stocks and dynamics of soil organic carbon and coarse woody debris in three managed and unmanaged temperate forests. Eur J For Res. 2017;136(1):123–137. doi: 10.1007/s10342-016-1013-4.
- Paletto A, De Meo I, Cantiani P, et al. Effects of forest management on the amount of deadwood in Mediterranean oak ecosystems. Ann For Sci. 2014;71(7):791–800. doi: 10.1007/s13595-014-0377-1.
- Simonsson P, Gustafsson L, Östlund L. Retention forestry in Sweden: driving forces, debate and implementation 1968–2003. Scand J For Res. 2015;30(2):154–173. doi: 10.1080/02827581.2014.968201.
- Ugawa S, Takahashi M, Morisada K, et al. Carbon stocks of dead wood, litter, and soil in the forest sector of Japan: general description of the National Forest Soil Carbon Inventory. Bull FFPRI. 2012;11(4):207–221.
- Warren WG, Olsen P. A line intersect technique for assessing logging waste. For Sci. 1964;13:267–276.
- Van Wagner C. The line intersect method in forest fuel sampling. For Sci. 1968;14:20–26.
- Brown J. Handbook for inventorying downed woody material. Ogden (UT): U.S. Department of Agriculture, Intermountain Forest and Range Experiment Station; 1974. p. 24.
- Forestry Agency of Japan. Implementation report of the National Forest Carbon Inventory in FY2007. Tokyo: Forestry Agency of Japan; 2007. p.39–59
- JAXA’s Earth Observation Research Center. Global PALSAR-2/PALSAR/JERS-1 mosaics and forest/non-forest maps [Internet]. 2016. Available from: https://www.eorc.jaxa.jp/ALOS/en/dataset/fnf_e.htm
- Japan Meteorological Agency. Mesh Climate Data of Japan [Internet]. 2012. Available from: https://nlftp.mlit.go.jp/ksj/gml/datalist/KsjTmplt-G02.html
- Revelle WR. Package “psych”: procedures for personality and psychological research, software, 2017. Available from: https://cran.r-project.org/package=psych
- Fox J, Weisberg S. Package “car”: companion to applied regression [Internet]. Thousand Oaks (CA). Available from: https://cran.r-project.org/web/packages/car/index.html
- Zuur AF, Ieno EN, Elphick CS. A protocol for data exploration to avoid common statistical problems. Methods Ecol Evol. 2010;1(1):3–14. doi: 10.1111/j.2041-210X.2009.00001.x.
- Brian A, Venables B, Bates DM, et al. Package ‘MASS’: support functions and datasets for Venables and Ripley’s MASS. 2023. Available from: https://cran.r-project.org/web/packages/MASS/index.html
- Akaike H. Information theory and an extension of the maximum likelihood principle. Trees Struct Funct. 2015;29(6):655–662.
- Takahashi M, Ishizuka S, Ugawa S, et al. Carbon stock in litter, deadwood and soil in Japan’s forest sector and its comparison with carbon stock in agricultural soils. Soil Sci Plant Nutr. 2010;56(1):19–30. doi: 10.1111/j.1747-0765.2009.00425.x.
- Yamaura Y, Oka H, Taki H, et al. Sustainable management of planted landscapes: lessons from Japan. Biodivers Conserv. 2012;21(12):3107–3129. doi: 10.1007/s10531-012-0357-4.
- Fenton RT. Japanese forestry and its implications. Singapore: Marshall Cavendish Academic; 2005. p. 307.
- Das A, Battles J, Stephenson NL, et al. The contribution of competition to tree mortality in old-growth coniferous forests. For Ecol Manage. 2011;261(7):1203–1213. doi: 10.1016/j.foreco.2010.12.035.
- Peet RK, Christensen NL. Competition and tree death. Bioscience. 1987;37(8):586–595. doi: 10.2307/1310669.
- Linder P, Östlund L. Structural changes in three mid-boreal Swedish forest landscapes, 1885-1996. Biol Conserv. 1998;85(1-2):9–19. doi: 10.1016/S0006-3207(97)00168-7.
- Ohlson M, Söderström L, Hörnberg G, et al. Habitat qualities versus long-term continuity as determinants of biodiversity in boreal old-growth swamp forests. Biol Conserv. 1997;81(3):221–231. doi: 10.1016/S0006-3207(97)00001-3.
- Kaarakka L, Vaittinen J, Marjanen M, et al. Stump harvesting in Picea abies stands: soil surface disturbance and biomass distribution of the harvested stumps and roots. For Ecol Manage. 2018;425:27–34. doi: 10.1016/j.foreco.2018.05.032.
- Ando T. Ecological study on density management of same-aged simple forests. For Res Pap. 1968;210:1–153. Japanese
- Eräjää S, Halme P, Kotiaho JS, et al. The volume and composition of dead wood on traditional and forest fuel harvested clear-cuts. Silva Fenn. 2010;44(2):203–211. doi: 10.14214/sf.150.
- Rahman A, Khanam T, Pelkonen P. Is stump harvesting for bioenergy production socially acceptable in Finland? J Clean Prod. 2019;229:1233–1242. doi: 10.1016/j.jclepro.2019.05.045.
- Williams NG, Powers MD. Carbon storage implications of active management in mature Pseudotsuga menziesii forests of Western Oregon. For Ecol Manage. 2019;432:761–775. doi: 10.1016/j.foreco.2018.10.002.
- Ruiz-Peinado R, Bravo-Oviedo A, López-Senespleda E, et al. Do thinnings influence biomass and soil carbon stocks in Mediterranean Maritime pinewoods? Eur J For Res. 2013;132(2):253–262. doi: 10.1007/s10342-012-0672-z.
- Keren S, Diaci J. Comparing the quantity and structure of deadwood in selection managed and old-growth forests in South-East Europe. Forests. 2018;9(2):76. doi: 10.3390/f9020076.
- Hashimoto S, Ugawa S, Morisada K, et al. Potential carbon stock in Japanese forest soils – simulated impact of forest management and climate change using the CENTURY model. Soil Use Manag. 2011;28(1):45–53. doi: 10.1111/j.1475-2743.2011.00372.x.
- Austin AT, Classen AT, Eggleton P, et al. Termite sensitivity to temperature affects global wood decay rates. Science. 2022;377(6613):1440–1444.
- Forestry Agency. Annual report on forest and forestry in Japan. For Econ. 2020;68(5):29–34.
- Kawaguchi T, Yamamoto K. The deforestation and soil erosion (In Japanese). Forestry Experiment Collection Report; 1948;57. p. 1–19.
- Forestry and Fisheries. Statistics of Agriculture; Survey on awareness and intention toward forest resource recycling; 2015;3. p. 17. Japanese.
Appendix
Figure A1. Correlation coefficients for each pair of the nine explanatory and objective variables.
Variable names are displayed on the diagonal line from the upper left to the lower right of the matrix. The upper right of the matrix graph shows the correlation coefficients, the lower left a scatter plot, and the center a histogram and probability density.
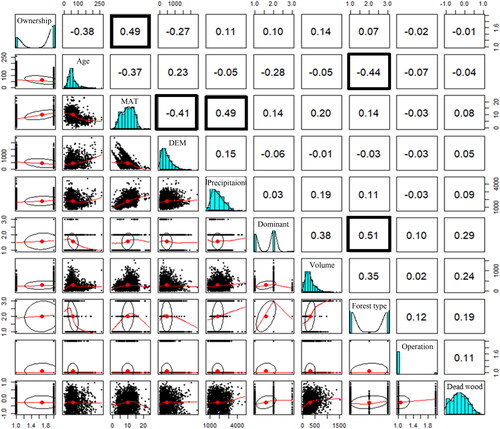
Table A1. Selection of explanatory variables using the VIF function.
Table A2. Environmental factors affecting carbon stocks in deadwood.