
Abstract
Stress is a common factor that reduces production performance. However, the physiology of stress is not fully understood. In this study, 40-day-old rabbits were injected 1.0 mg/kg BW Dexamethasone to induce stress. A metabolomic study on serum of stress-induced rabbits was performed to research the metabolism mechanism of stress by using ultra-performance liquid chromatography coupled to mass spectrometry (UPLC–MS). Clear separations between stress rabbits and control rabbits were observed by principal component analysis (PCA) based on the data obtained using both analytical techniques and 90 significantly changed metabolites were identified as potential biomarkers of stress. Stress rabbits were characterised by altered levels of serum lysophosphatidylcholines, amino acids, phosphatidyl choline, and nucleosides, which were related to multiple perturbed metabolic pathways and contributed to the elucidation of the complex mechanism of stress. These were main linked to three different pathways: pyrimidine metabolism, aminoacyl-tRNA biosynthesis, and biosynthesis of amino acid. In summary, we provided a comprehensive understanding of metabolic alterations in the main stress-targeted tissues, helping to understand the potential mechanisms underlying stress.
Stress alters the metabolic composition of serum in rabbits.
In rabbits, dexamethasone‐induced chronic stress alters 90 metabolites in serum.
HIGHLIGHTS
Introduction
In modern culture, vulnerability to uncontrollable and unpredictable stress is considered to be a normal occurrence in daily life. Animal stress refers to a set of abnormal reactions induced by stimuli in the organism, such as ambient temperature, noise, transport, feeding density, dietary nutrient concentration, and immunity during development. Numerous studies have shown that stress has a great impact on the health status, production performance, immune performance, blood biochemical indicators, meat quality, and body organs of animals (Franci et al. Citation1996; Marai et al. Citation2002; Li et al. Citation2009; Chiericato et al. 1995). Stress can induce the peroxidation of phospholipids as well as protein and DNA damage (Raschke et al. Citation2006). It also influences the metabolic levels of animals when animals are stressed, causing metabolic disorders and other metabolic diseases (Belhadj Slimen et al. Citation2016; Incalza et al. Citation2018). It has a major function, including hypertension, adiposity, and insulin resistance, in metabolic syndrome(Ceriello and Motz Citation2004). Furthermore, in modern rabbit farming systems, the excessive pursuit of growth rate, fur quality, and feed remuneration has made modern rabbit breeds increasingly vulnerable to different stress factors. While certain stress-related physiological and biochemical processes have been established, there are still many unanswered questions, such as how the entire biological system reacts to stress, which mostly includes small molecules, how the self-recovery phase of the body progresses after stress, and how stress-related illnesses arise.
The stimulation of the stress response relies mainly on the excitation of the sympathetic nervous system and the hypothalamic-pituitary-adrenal (HPA) axis and high circulating levels of glucocorticoid hormones (de Quervain et al. Citation1998; Atsak et al. Citation2016), thereby adjusting the body's metabolism and producing the corresponding stress response. Dexamethasone (DEX), a type of glucocorticoid (GORT), can induce stress by the HPA and change metabolism in animals (Humbert et al. Citation2001; Gounarides et al. Citation2008). In rats, DEX treatment could significantly change several pathways, such as amino acid metabolism, pyrimidine metabolism, et al. (Malkawi et al. Citation2018). In broilers, DEX-induced stress decreased the absorption of glycylsarcosine (Chang et al. Citation2015).
Serum metabolites can reflect the metabolic changes in the body and are useful for monitoring metabolic processes under stress (Zhang et al. Citation2010). The serum is readily collectible and can directly reflect pathophysiological responses to disease. Metabolomics, based on the quantitative analysis of metabolites in biofluids and tissues of living systems, provides a powerful approach to study the multivariate metabolic responses to physiological stressors (Nicholson et al. Citation1999). Therefore, the purpose of this study was to investigate the characteristics of DEX-induced stress and metabolic especially for the metabolism of nutrients changes in the serum of rabbits, and to provide a scientific reference for the studies with the DEX-treated animal models.
Methods and materials
Animals
Rabbits were housed in homemade plastic cages (60 × 40 × 40 cm). Temperature and lighting were maintained according to commercial conditions (20–25 °C, 12 light/12 dark). The diets were formulated according to the recommendation of de Blas and Mateos (De.Blas et al. Citation1998). All rabbits had free access to feed and water during the rearing period. Agricultural University Animal Care and Use Committee (SDAUA-2017-029) and were in accordance with the Guidelines for Experimental Animals established by the Ministry of Science and Technology (Beijing, China).
At 40 days of age, 40 rabbits (Hyla, male-female ratio of 1:1) with similar body weight (1388 ± 8.5 g) were divided into two groups: one received a subcutaneous injection of dexamethasone (DEX, 1.0 mg/kg body weight, 8:00 am per day) (Huang et al. Citation1997; Kil et al. Citation1997) for 7 d and the other received sham-treatment (Control, saline, 1.0 mg/kg body weight). After the last injection, six rabbits with similar weights from each group were fasted for 3 h and then electrically stunned and slaughtered. Then the blood (10 ml) was collected from a carotid vein and centrifuged at 3000 rpm for 10 min at 4 °C to obtain serum that was kept at −80 °C.
Metabolites extraction
Serum samples were thawed on ice. 100 μL of serum was taken and placed in an EP tube, then extracted with 400 μL of prechilled methanol, followed by vortexing. The samples were incubated on ice for 5 min and then were centrifuged at 15,000 rpm, 4 °C for 5 min.
UHPLC-MS/MS analysis
LC-MS/MS testing was conducted by Novogene Co., Ltd. (Beijing, China). LC-MS/MS analyses were performed using a Vanquish UHPLC system (Thermo Fisher) coupled with an Orbitrap Q Exactive series mass spectrometer (Thermo Fisher). Samples were injected onto an Hyperil Gold column (100 × 2.1 mm, 1.9 μm) using a 16-min linear gradient at a flow rate of 0.2 mL/min. The eluents for the positive polarity mode were eluent A (0.1% FA in Water) and eluent B (Methanol). The eluents for the negative polarity mode were eluent A (5 mM ammonium acetate, pH 9.0) and eluent B (Methanol).The solvent gradient was set as follows: 2% B, 1.5 min; 2–100% B, 12.0 min; 100% B, 14.0 min; 100–2% B, 14.1 min; 2% B, 17 min. Q Exactive series mass spectrometer was operated in positive/negative polarity mode with a spray voltage of 3.2 kV, capillary temperature of 320 °C, sheath gas flow rate of 35 arb, and aux gas flow rate of 10 arb.
Database search
The raw data files generated by UHPLC-MS/MS were processed using the Compound Discoverer 3.1 (CD3.1, Thermo Fisher) to perform peak alignment, peak picking, and quantitation for each metabolite. The main parameters were set as follows: retention time tolerance, 0.2 min; actual mass tolerance, 5 ppm; signal intensity tolerance, 30%; signal/noise ratio, 3; and the minimum intensity, 100,000. After that, peak intensities were normalised to the total spectral intensity. The normalised data were used to predict the molecular formula based on additive ions, molecular ion peaks, and fragment ions. And then peaks were matched with the mzCloud (https://www.mzcloud.org/), mzVault, and MassList database to obtain the accurate qualitative and relative quantitative results. Statistical analyses were performed using the statistical software R (R version R-3.4.3), Python (Python 2.7.6 version), and CentOS (CentOS release 6.6), When data were not normally distributed, normal transformations were attempted using of area normalisation method.
Data analysis
These metabolites were annotated using the KEGG database (http://www.genome.jp/kegg/), HMDB database (http://www.hmdb.ca/), and Lipidmaps database (http://www.lipidmaps.org/). Principal components analysis (PCA) and partial least squares discriminant analysis (PLS‐DA) were performed at metaX (a flexible and comprehensive software for processing metabolomics data). We applied univariate analysis (t-test) to calculate the statistical significance (p-value). The metabolites with VIP > 1 and p-value < .05 and fold change (FC) ≥ 1.2 or FC ≤ 0.833 were considered to be differential metabolites. Volcano plots were used to filter metabolites of interest which were based on Log2(FC) and − log10(p-value) of metabolites. For clustering heat maps, the data were normalised using z-scores of the intensity areas of differential metabolites and were plotted by the Pheatmap package in R language. The functions of these metabolites and metabolic pathways were studied using the KEGG database. When the p-value of the metabolic pathway <.05, metabolic pathways were considered as statistically significant enrichment.
Results
Metabolite
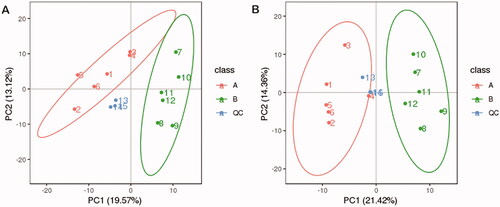
The aim of this research was to define the metabolic alterations induced by stress exposure (dexamethasone simulated) with regard to the control samples (DEX vs. control). A total of 18,532 ion features were detected from UHPLC-MS/MS analysis. The tight grouping of the QC samples in the PCA score plots further confirmed the high reproducibility and instrumental stability throughout the run (Figures ). The 622 identified metabolites were annotated by functional and classified.
Figure 1. Principal component analysis (PCA) score plot of control, stress-control and quality control (QC) samples under the positive ion mode(POS) (A) and negative ion mode(NEG) (B). PCA based on the UHPLC-MS/MS spectra of QC samples and metabolites in serum samples obtained from the stress (DEX-injection) group and control group, A represented stress samples and B represented control samples.
Multivariate data analysis
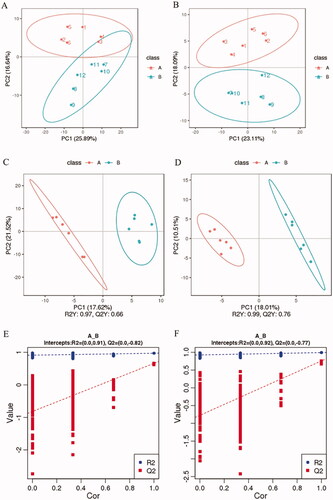
The principal component analysis (PCA) model was constructed from aligned peak data from the control group and the dexamethasone-injected group. The first component explained 25.89%, 23.11% of the variance as shown in positive ion mode (POS) (Figure ) and negative ion mode (NEG) (Figure ), respectively. The results of partial least squares discriminant analysis (PLS‐DA) were shown in Figures , the large degree of separation between the two groups of samples in the figure indicates that the classification effect is significant, the values of parameters were R2Y:0.97, Q2Y:0.66 and R2Y:0.99, Q2Y:0.76 in POS and NEG, respectively. Permutation analysis of the PLS-DA model was also performed under positive and negative ion modes (Figures ). The results showed that the PLS-DA model fitting was valid and unlikely to be established by chance. The results showed that the experimental data were highly reliable.
Figure 2. PCA scores of total samples under the positive ion mode (A) and negative ion mode (B), respectively (n = 6). Partial least squares discriminant analysis (PLS‐DA) with a 2 D score plot of stress group and controls under the positive ion mode (C) and negative ion mode (D), respectively. Permutation analysis plotting R2 and Q2 from 200 permutation tests in the PLS-DA model, under the positive ion mode (E) and negative mode (F), respectively. A represented stress samples and B represented control samples.
Significantly different metabolite
For all identified metabolites, we identified metabolites that differed significantly between the two groups using VIP score using the PLS-DA model, p-value based on Student's t-test were calculated, and FC (Foldchange). The criteria were FC > 1.2 or FC < 0.833, p-value < .05, and VIP > 1. A total of 90 significantly changed endogenous metabolites related to stress exposure are listed in Tables . Results of the Volcano plot were shown in Figure , and each point in the figure represented a differential metabolite. For stress rabbits (DEX injected), as compared with the control group, there were 16,18 metabolites significantly up-regulated and 33,23 metabolites significantly down-regulated in POS (Figure ) and NEG (Figure ). Lysophosphatidylcholine (LPC) was significantly changed in stress-rabbits compared with the control group rabbits. Moreover, the quantities of the differential metabolites were plotted in a heatmap using hierarchical clustering analysis, as shown in Figure .
Figure 3. Volcano plot by metabolomics analysis under the positive ion mode (A) and negative ion mode (B), respectively (n = 6). The red points represent significantly up-regulated different metabolites (FC > 1.2, p-value <0.05, and VIP > 1) according to the univariate statistical analysis, the green points indicate metabolites that were significantly down-regulated (FC <0.833, p-value <.05, and VIP > 1).
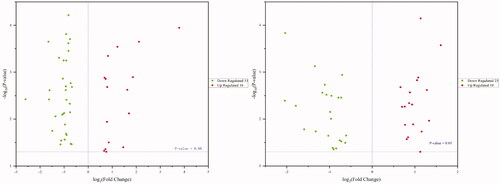
Figure 4. Heat maps of significantly different metabolites in serum of rabbits under the positive ion mode (A) and negative ion mode (B), respectively (n = 6). The colour in the panel represents the relative levels of each metabolite: blue represents low levels, and red represents high levels. In maps, class A represented stress samples and class B represented control samples.
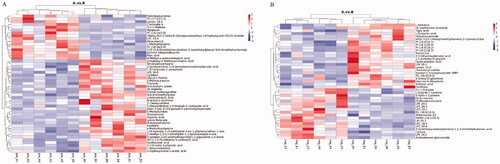
Table 1. Positively identified significantly differentially expressed metabolites in the rabbit serum after chronic dexamethasone (DEX) treatment in under the positive ion mode (n = 6).
Table 2. Positively identified significantly differentially expressed metabolites in the rabbit serum after chronic dexamethasone (DEX) treatment under the negative ion mode (n = 6).
KEGG functional pathway
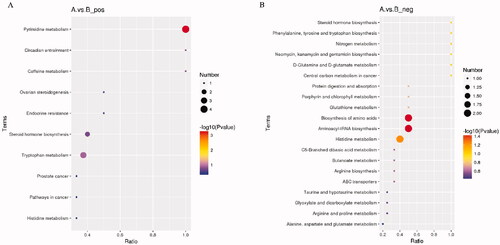
To explore the involved pathways of these altered plasma metabolites, KEGG pathway enrichment analyses were performed according to the altered metabolites under both positive and negative ion modes. As shown in Figure , some essential pathways were detected, including pyrimidine metabolism, aminoacyl-tRNA biosynthesis, and biosynthesis of an amino acid (p-value < .05).
Figure 5. Affected metabolomic pathways of differentially expressed metabolites according to the KEGG database matched results under the positive ion mode (A) and negative ion mode (B), respectively (n = 6). The size of each spot represents the metabolite number, and the colour represents p-value. In maps, class A represented stress samples and class B represented control samples.
Discussion
Our previous studies have demonstrated that a chronic stress model for rabbits is established (Liu et al. Citation2020). Based on this model, we used a metabolic approach to reveal the mechanism underlying the change of rabbits to chronic stress and identify the biomarkers in serum monitoring stress. The serum is an optimal target as it is readily available with minimal stress for animals and is the primary carrier of various metabolites whose levels are susceptible to stress (Arimura et al. Citation1976; Ippolito et al. Citation2014). In this study, we investigated the metabolic abnormalities linked to chronic exposure to DEX in serum using the LC-MS/MS approach. Glucocorticoids, an important terminal regulator on the HPA axis, triggers a series of physiological responses that mobilise and redistribute the body's stored energy and inhibit some essential functions (e.g. growth and development) (Lv et al. Citation2018), thus the body develops in a direction conducive to survival and balance internal energy (Schreck Citation1993).
Pathway analysis was performed on the featured metabolites to identify the most relevant pathways involved in DEX administration. Pyrimidine metabolism, aminoacyl-tRNA biosynthesis, and biosynthesis of the amino acid were the most significantly enriched pathways with different impacts as shown in Figure . The importance of pyrimidines lies in the fact that they are structural components of a broad spectrum of key molecules that participate in diverse cellular functions, such as the synthesis of DNA, RNA, lipids, and carbohydrates. Pyrimidine metabolism is not only an important pathway to maintain appropriate pyrimidine pools in cells, but also the products of pyrimidine degradation produce diversified molecular precursors for other biological molecules, such as pantotic acid, vitamin B5, and neurotransmitters (Tiedje et al. Citation2010). In our study, we identified that deoxycytidine, cytidine, thymine, and 5-methylcytosine degraded by pyrimidine were decreased in the serum of stress rabbits. As it ranks first in KEGG enriched pathways in POS, pyrimidine metabolism may be involved in stress.
In the process of protein translation, a specific amino acid is catalysed by aminoacyl-tRNA synthetase to bind to the 3′ end of the corresponding tRNA molecule through a high-energy bond to form aminoacyl-tRNA. Therefore, the biosynthesis of aminoacyl-tRNA is important for amino acid translocation during protein translation (McClain Citation1993). The aminoacyl-tRNA pathway and aminoacyl tRNA synthetase enzymes are key factors required for protein biosynthesis(Ibba and Soll Citation2000). Among the differential metabolites identified in this study, L-Glutamic acid and L-Histidine were significantly down-regulated in the blood of chronically stressed rabbits. The expression of several serum amino acids after DEX administration was low due to its mobilisation from protein and its subsequent breakdown as a source of carbon during gluconeogenesis. This indicates that the biosynthesis of aminoacyl-tRNA in the blood is inhibited after stress, and tRNA aminoacylation is an important marker of protein synthesis, that is, chronic stress can significantly reduce the rate of protein synthesis.
Amino acids have been proved to be involved in the changes of the physiological metabolic process (Bennett and Edelman Citation1969). Amino acids and their metabolites are basic substrates and regulators in many metabolic pathways and have gained increased attention from more and more researchers (Emery Citation2013; Dixon et al. Citation2014). Amino acids have been found to impact the levels of monoamine neurotransmitters (NE, 5-HT, DA) (Markus Citation2008), as well as regulating mood and depressive-like behavioural performance (Lee et al. Citation2013; CitationStrzelecki et al., 2013 ), and are closely bound up with systemic energy levels (Kugaya and Sanacora Citation2005). Accordingly, in our study, the results of serum metabolomics suggest that the abnormality of biosynthesis of amino acid in stressed rabbits was significantly changed. In addition, this amino acid profile supported the phenotypes of weight loss observed in these animals.
Conclusions
In brief, we generated an untargeted metabolomic profile between stress and control groups in serum samples, we identified 49 significantly altered metabolites under positive ion mode and revealed 41 significantly altered metabolites under negative ion mode. KEGG analyses revealed that the altered metabolites mostly enriched in pyrimidine metabolism, aminoacyl-tRNA biosynthesis, and biosynthesis of amino acid. Therefore, the identified metabolites could be considered as candidate biomarkers for the diagnosis decision of stress, and the involved pathways and underlying mechanisms are worth further investigation.
Author contributions
Hongli Liu, Lei Liu, and Fuchang Li planned the experiment and finalised the draft of the manuscript with consent from all contributing authors. Hongli Liu and Bin Zhang carried out the experiment, finalised, and analysed the collected data. All authors have read and agreed to the published version of the manuscript.
Supplemental Material
Download MS Word (14.5 KB)Supplemental Material
Download MS Excel (943 KB)Disclosure statement
The authors declare no conflict of interest in the submission of this manuscript.
Data availability statement
The data that support the findings of this study are available from the corresponding author upon reasonable request.
Additional information
Funding
References
- Arimura A, Smith WD, Schally AV. 1976. Blockade of the stress-induced decrease in blood GH by anti-somatostatin serum in rats. Endocrinology. 98(2):540–543.
- Atsak P, Guenzel FM, Kantar-Gok D, Zalachoras I, Yargicoglu P, Meijer OC, Quirarte GL, Wolf OT, Schwabe L, Roozendaal B. 2016. Glucocorticoids mediate stress-induced impairment of retrieval of stimulus-response memory. Psychoneuroendocrinology. 67:207–215.
- Belhadj Slimen I, Najar T, Ghram A, Abdrrabba M. 2016. Heat stress effects on livestock: molecular, cellular and metabolic aspects, a review. J Anim Physiol Anim Nutr. 100(3):401–412.
- Bennett GS, Edelman GM. 1969. Amino acid incorporation into rat brain proteins during spreading cortical depression. Science. 163(3865):393–395.
- Ceriello A, Motz E. 2004. Is oxidative stress the pathogenic mechanism underlying insulin resistance, diabetes, and cardiovascular disease? The common soil hypothesis revisited. Arterioscler Thromb Vasc Biol. 24(5):816–823.
- Chang WH, Li JJ, Zhang S, Zheng AJ, Yuan JL, Cai HY, Liu GH. 2015. Effects of glucocorticoid-induced stress on absorption of glycylsarcosine in jejunum of broilers. Poult. Sci. 94(4):700–705.
- Chiericato GM, Boiti C, Canali C, Rizzi C, Ravarotto L. 1995. Effects of heat stress and age on growth performance and endocrine status of male rabbit. World Rabbit Sci. 3(3). 125-131
- de Quervain DJ-F, Roozendaal B, McGaugh JL. 1998. Stress and glucocorticoids impair retrieval of long-term spatial memory. Nature. 394(6695):787–790.
- De.Blas, C, Mateos, G.G, The nutrition of the rabbit, Feed formulation, De.Blas, C, Wiseman, J, Commonwealth Agricultural Bureau, Wallingford, UK, 1998, 241, 253,
- Dixon M, MacDonald A, White F, Stafford J. 2014. Disorders of amino acid metabolism, organic acidaemias and urea cycle disorders. In: Clinical paediatric dietetics. John Wiley & Sons, Ltd,UK; p. 381–525.
- Emery PW. 2013. Amino acids: metabolism. In: Caballero B, editor. Encyclopedia of human nutrition. 3rd ed. Waltham (MA): Academic Press; p. 72–78.
- Franci O, Amici A, Margarit R, Merendino N, Piccolella E. 1996. Influence of thermal and dietary stress on immune response of rabbits. J Anim Sci. 74(7):1523–1529.
- Gounarides JS, Korach-André M, Killary K, Argentieri G, Turner O, Laurent D. 2008. Effect of dexamethasone on glucose tolerance and fat metabolism in a diet-induced obesity mouse model. Endocrinology. 149(2):758–766.
- Huang W, Lin M, Won S. 1997. Staphylococcal enterotoxin A-induced fever is associated with increased circulating levels of cytokines in rabbits. Infect Immun. 65(7):2656–2662.
- Humbert B, Le Bacquer O, Nguyen P, Dumon H, Darmaun D. 2001. Protein restriction and dexamethasone as a model of protein hypercatabolism in dogs: effect of glutamine on leucine turnover. Metabolism. 50(3):293–298.
- Ibba M, Soll D. 2000. Aminoacyl-tRNA synthesis. Annu Rev Biochem. 69:617–650.
- Incalza MA, D'Oria R, Natalicchio A, Perrini S, Laviola L, Giorgino F. 2018. Oxidative stress and reactive oxygen species in endothelial dysfunction associated with cardiovascular and metabolic diseases. Vascul Pharmacol. 100:1–19.
- Ippolito DL, Lewis JA, Yu C, Leon LR, Stallings JD. 2014. Alteration in circulating metabolites during and after heat stress in the conscious rat: potential biomarkers of exposure and organ-specific injury. BMC Physiol. 14:14.
- Kil HK, Alberts MK, Liggitt HD, Bishop MJ. 1997. Dexamethasone treatment does not ameliorate subglottic ischemic injury in rabbits. Chest. 111(5):1356–1360.
- Kugaya A, Sanacora G. 2005. Beyond monoamines: glutamatergic function in mood disorders. CNS Spectr. 10(10):808–819.
- Lee Y, Son H, Kim G, Kim S, Lee DH, Roh GS, Kang SS, Cho GJ, Choi WS, Kim HJ. 2013. Glutamine deficiency in the prefrontal cortex increases depressive-like behaviours in male mice. J Psychiatry Neurosci. 38(3):183–191.
- Li Y, Cai HY, Liu GH, Dong XL, Chang WH, Zhang S, Zheng AJ, Chen GL. 2009. Effects of stress simulated by dexamethasone on jejunal glucose transport in broilers. Poult Sci. 88(2):330–337.
- Liu H, Liu L, Li F. 2020. Effects of glucocorticoids on the gene expression of nutrient transporters in different rabbit intestinal segments. Animal. 14(8):1693–1700.
- Lv Z-P, Peng Y-Z, Zhang B-B, Fan H, Liu D, Guo Y-M. 2018. Glucose and lipid metabolism disorders in the chickens with dexamethasone-induced oxidative stress. J Anim Physiol Anim Nutr. 102(2):e706–e717.
- Malkawi A, Alzoubi K, Jacob M, Matic G, Ali A, Al Faraj A, Almuhanna F, Dasouki M, Abdel Rahman A. 2018. Metabolomics based profiling of dexamethasone side effects in rats. Front Pharmacol. 9:46.
- Marai IFM, Habeeb AAM, Gad AE. 2002. Rabbits’ productive, reproductive and physiological performance traits as affected by heat stress: a review. Livest Prod Sci. 78(2):71–90.
- Markus CR. 2008. Dietary amino acids and brain serotonin function; implications for stress-related affective changes. Neuromolecular Med. 10(4):247–258.
- McClain WH. 1993. Rules that govern tRNA identity in protein synthesis. J Mol Biol. 234(2):257–280.
- Nicholson JK, Lindon JC, Holmes E. 1999. “Metabonomics”: understanding the metabolic responses of living systems to pathophysiological stimuli via multivariate statistical analysis of biological NMR spectroscopic data. Xenobiotica Fate Foreign Compd. Xenobiotica. 29(11):1181–1189.
- Raschke M, Rowland IR, Magee PJ, Pool-Zobel BL. 2006. Genistein protects prostate cells against hydrogen peroxide-induced DNA damage and induces expression of genes involved in the defence against oxidative stress. Carcinogenesis. 27(11):2322–2330.
- Schreck CB. 1993. Glucocorticoids: metabolism, growth, and development. In: Schreibman MP, Scanes CG, Pang PKT, editors. The endocrinology of growth, development, and metabolism in vertebrates. Academic Press, Elsevier Inc,Netherlands; p. 367–392.
- Strzelecki D, Kropiwnicki P, Rabe-Jabłońska J.2013. Augmentation of antipsychotics with glycine may ameliorate depressive and extrapyramidal symptoms in schizophrenic patients – a preliminary 10-week open-label study. Psychiatria Polska.47(4):609-620.
- Tiedje KE, Stevens K, Barnes S, Weaver DF. 2010. Beta-alanine as a small molecule neurotransmitter. Neurochem Int. 57(3):177–188.
- Zhang F, Jia Z, Gao P, Kong H, Li X, Lu X, Wu Y, Xu G. 2010. Metabonomics study of urine and plasma in depression and excess fatigue rats by ultra fast liquid chromatography coupled with ion trap-time of flight mass spectrometry. Mol Biosyst. 6(5):852–861.