
 ?Mathematical formulae have been encoded as MathML and are displayed in this HTML version using MathJax in order to improve their display. Uncheck the box to turn MathJax off. This feature requires Javascript. Click on a formula to zoom.
Abstract
Feed additives are individually authorised within the European Union (EU) specifying the conditions of their use under real-world conditions. These criteria often include minimum or maximum level of their content in compound feed. In addition, feed business operators are obliged to indicate on the feed the level of the added content of the feed additive. While it is the task of the EU Member States official laboratories to perform control analyses to establish compliance with these provisions, the European Union Reference Laboratory for Feed Additives (EURL-FA) is organising since 2012 annual proficiency tests (PTs) for Member States’ National Reference Laboratories (NRLs). PTs organised by the EURL-FA are based on the principles that compound feed samples are prepared containing a known content of the target feed additive. These PT samples are then sent to the NRLs for analysis and the results reported back to the EURL-FA are subjected to statistical assessment to establish the laboratory specific proficiency to correctly analyse compound feed samples for the respective feed additive. In the current study, we looked at the outcome of this assessment across different PTs. The topics addressed were (1) the evaluation of the overall measurement capability of NRLs in respect to coccidiostats, trace elements and vitamin D3, (2) the challenge related to the preparation of homogenous test materials with particle-based feed additives, (3) a possible connection between the modified composition of preparations containing vitamin A and analytical results and (4) the impact of a training course on the proficiency of laboratories regarding carotenoid analysis.
HIGHLIGHTS
Official control laboratories in Member States monitor the levels of feed additives in animal nutrition, thus ensuring compliance with target levels and legal limits.
The European Union Reference Laboratory for feed additives (EURL-FA) conducts proficiency testing (PT) to evaluate the measurement capability of individual official control laboratories.
The comparison of results across different PTs facilitates the assessment of overall laboratory performance, addresses challenges like the preparation of test material with particle-based feed additives, investigates stability issues in vitamin A feed additives, and highlights the efficacy of hands-on training courses in enhancing laboratory performance.
Keywords:
Introduction
Feed additives are an important component in animal nutrition and cover a broad range of different substances. These are for instance trace elements, vitamins, coccidiostats, enzymes and microorganisms. Within the European Union (EU), feed additives are authorised according to Regulation (EC) No 1831/2003 (European Union Citation2003), requiring a product specific pre-market authorisation by the European Commission based on a risk assessment conducted by the European Food Safety Authority (EFSA). In the case of a favourable decision of the European Commission, each feed additive is authorised via a Commission Implementing Regulation specifying the conditions of use and allocating a unique identification number to each product. Furthermore, each feed additive is allocated to a specific category and functional group as defined in annex 1 of Regulation (EC) No 1831/2003 (European Union Citation2003). The Regulations authorising the feed additives can easily be retrieved via the feed additive register, which can be accessed online (European Commission Citation2023). They include the composition of the feed additive, minimum and/or maximum content of these products in compound feed, if applicable, and the analytical methods to be used for official control laboratories to enforce these levels. The applicant also needs to present analytical methods suitable for this task and their fitness for purpose are evaluated by the European Union Reference Laboratory for feed additives (EURL-FA) established by Regulation (EC) No 1831/2003 (European Union Citation2003). When finalising the evaluation of the analytical methods, the EURL sends a corresponding report to EFSA and the European Commission. These reports are an essential component of the whole authorisation process, thus underpinning the relevance of these methods for official control. Moreover, the applicants need to provide the EURL with samples of the feed additive that are subject of the authorisation. More details about the operation of the EURL-FA within the frame of the authorisation are given in another publication (von Holst et al. Citation2016).
When proposing analytical methods for official control, the applicant needs to consider the criteria of the method cascade required by EU legislation (European Union Citation2017a). These criteria foresee that analytical methods established by European legislation (European Commission 2008) have highest priority. A selection of analytical methods for feed additives included in Regulation (European Union) Citation2024/771 (European Union Citation2024) or published via CEN/ISO standards is given in Table .
Table 1. Analytical methods for feed additives established by EU regulation, ISO, CEN (EN standards) and used by the laboratories participating in the proficiency tests included in this publication. Reversed phase high performance liquid chromatography: RP-HPLC. UV: Ultraviolet. MS: single quadrupole mass spectrometry. MS/MS: tandem mass spectrometry. +: the EN standards are also included in Commission Implementing Regulation (EU) Citation2024/771.
Only if such methods are not available for the specific application, analytical methods specifically developed by the applicant for the product concerned can be presented and are evaluated by the EURL-FA. The methods need to be validated and successfully tested by a second independent laboratory as required by EU legislation (European Union Citation2008). Analytical methods that are favourably evaluated by the EURL-FA are included in the legal act authorising the feed additive and are therefore compulsory to be used for official control purposes.
Member States’ official control laboratories are responsible for executing monitoring programs aimed at enforcing legal limits concerning the composition of feed. Furthermore, it is essential to implement measures at EU level to guarantee the effectiveness of official controls within the EU. To meet these requirements, EU Regulations (Regulation (EU) 2017/625, Regulation (EC) No 882/2004) on official control in the domain of food and feed have established European Union Reference Laboratories (EURLs) with specific scopes such as mycotoxins, animal proteins, dioxins and feed additives. Additionally, EU Member States are required to designate National Reference Laboratories for each EURL. Among the responsibilities assigned to EURLs is the organisation of proficiency tests (PTs) for NRLs and official control laboratories. Notably, these activities also play a crucial role in the control of legal limits linked to the authorisation of feed additives. Therefore, the above-mentioned EU Regulations on official control specify that the EURL-FA, established by Regulation (EC) No 1831/2003, will also cover the responsibilities outlined in the official control Regulations. Considering these expanded responsibilities, the activities according to the Regulation of official food and feed controls are denoted by the term 'EURL-FA Control’.
Since 2012, the EURL-FA Control have been organising PTs for the determination of different feed additives in compound feed. The purpose of the PTs is to assess the performance of NRLs in correctly analysing samples for selected feed additives. The target feed additives for each PT are annually defined through discussions with the European Commission and the NRLs. One of the major challenges of organising PTs in the field of feed additives is the large variation of the physicochemical characteristics of these products, thus requiring tailor-made solutions in respect to the preparation of the test material and the determination of the assigned value. This value is an estimate of the true mass fraction of the target analyte in the test material.
In the present paper, we aim to show interesting case studies derived from this diversity covering coccidiostats, carotenoids, trace elements, and vitamins. A summary of the various feed additives included in this paper along with the corresponding official methods are shown in Table . Specifically, the following four topics will be addressed: (1) The primary objective of proficiency testing (PT) is typically aiming at assessing the performance of individual laboratories. However, in this context, our focus extends beyond individual assessments to evaluate the collective performance of all participating laboratories expressed by the robust mean of the submitted results. This is possible, if the assigned value has been determined by formulation or by analytical measurements on the test material that are independent from the laboratories’ result. The assigned value can be considered as benchmark against which the robust mean of the submitted results is compared. The obtained difference is then used for further assessment; (2) The physicochemical characteristics of feed additives vary significantly because there are stable feed additives such as coccidiostats or substances such as carotenoids that are sensitive towards light, oxygen and heat. Feed additives of the latter group are exclusively available on the market via specific preparations to render them more stable. Therefore, we also used this type of feed additives for the preparation of our test material. In this paper we will show the impact of this characteristic on the selected strategy to prepare homogenous PT test materials of compound feed containing the feed additive at a specific level; (3) Vitamin A is an important nutritional feed additive and has been a standard parameter in Member States’ monitoring programmes for a long time. In recent years, monitoring programs conducted by EU Member State laboratories have revealed a growing proportion of cases in which the measured levels of vitamin A in feed samples fall below the labelled content. Here we show that the comparison of PT results from 2016 and 2022 can contribute to the discussion about possible reasons of the observed phenomenon; (4) Another important group of feed additives are carotenoids representing a group of substances, authorised mainly as colourants for poultry and fish in the category sensory additives. For canthaxanthin there are even maximum residue levels set in food of animal origin (European Union Citation2015). Carotenoids are also very sensitive substances, thus rendering the correct determination of these substances rather challenging. The impact of the organisation of hands-on training courses in 2018 will be discussed by comparing the results from two PTs organised by the EURL-FA in 2015 and 2019.
The operation of the EURL-FA control
The tasks of the EURLs are specified in the article 94 of Regulation (EU) 2017/625 (European Union Citation2017a). One of the main activities is the annual organisation of proficiency tests. Given the relevance of this task, the EURL-FA Control is accredited according to ISO/IEC 17043 (ISO Citation2010) on general requirements for the competence of proficiency testing providers. In addition, the EURL-FA Control is also accredited according to ISO/IEC 17025 on the competence of testing and calibration laboratories.
For the organisation of the PTs the EURL-FA Control is strictly following the provisions of ISO/IEC 17043 and of ISO 13528 on statistical methods for use in proficiency testing by interlaboratory comparison. The latter Standard also contains key information such as the various options to establish the assigned value indicating the true mass fraction of the target feed additive in the test material, the standard deviation for proficiency assessment and criteria for the assessment of sufficient homogeneity and stability of the test samples.
In PTs, the z-score is one of the standardised measurement of the performance of each laboratory (ISO 13528). It is used in this publication and calculated according to the following formula:
(1),
(1),
where xi is the measurement result reported by the laboratory i. xpt is the assigned value specifying the estimate of the true content of the feed additive in the test material and σpt is the standard deviation for proficiency assessment reflecting the acceptable uncertainty of the results of the laboratories. In essence, the difference between each of the laboratories’ results and the assigned value is compared against σpt and the obtained z-scores are classified as satisfactory for absolute values below or equal to 2, questionable for absolute values strictly between 2 and 3, and unsatisfactory for absolute values above or equal to 3 (Thompson et al. Citation2006).
ISO 13528 (ISO Citation2015) and ISO/IEC 17043 foresee various options for the determination of the assigned value, including by formulation, measurements by external expert laboratories or from the results of the laboratories participating in the respective PT. For each PT included in this study, we individually identified the optimal method for determining the assigned values, with variations among the different PTs.
Case studies
Average measurement capability of laboratories
For this study we selected results from PTs organised from 2012 to 2021 on coccidiostats, trace elements and vitamin D3. These PTs have in common that the assigned values were independent of the submitted results and determined either by spiking experiments or by measurements conducted by external expert laboratories. More details on the selected analytes, target levels, analytical methods applied, selected way of determining the assigned values and the number of participating laboratories are given in Table .
Table 2. Details of the proficiency tests (PTs) and corresponding feed additives included in the four case studies. In all cases, the test material was compound feed containing the feed additives. For PTs with several analytes the number of laboratories reporting results differed amongst these analytes. RP-HPLC: Reversed-phase high performance liquid chromatography. NP: Normal phase. UV: Ultraviolet detection. There the following four methods for establishing the assigned values of the PTs. Method A: by formulation based on spiking blank compound feed with solutions containing known amount of the target analytes. Method B: by formulation based on spiking blank compound feed with solid feed additive preparations containing known amount of the target analytes. Method C: by calculating the mean value from measurements conducted by expert laboratories that did not participate in the PTs. Method D: by calculating the robust mean of the results from a Sub-group of laboratories participating in the PTs and applying an official analytical method.
The results of the annual PTs are published in corresponding reports indicated in Table and are available on request from the EURL-FA Control ([email protected]). To evaluate the overall performance, we determined the robust mean by conducting individual statistical analyses on the reported results separately for each analyte. For instance, in the PT conducted in 2012, Material 1 contained narasin and diclazuril. The statistical assessment resulted in two distinct robust means for these two analytes. Subsequently we calculated the relative difference (%) between the robust mean for each analyte and the corresponding assigned value applying the following formula:
(2),
(2),
where xRob is the robust mean of the analytical results submitted by the laboratories. The robust mean was calculated applying the “algorithm A” [Analytical methods committee Citation1989a, Analytical methods committee Citation1989b] described in ISO 13528:2015 (ISO Citation2015) and implemented via an EXCEL Add-in for Robust Statistics (Royal society of chemistry Citation2024). With the same software we also calculated the robust standard deviation of the laboratories’ results used in the interpretation of the obtained relative differences. In total, the assessment is based on the calculation of 28 relative differences from the PTs on coccidiostats, 2 from trace elements and 1 from vitamin D3. Subsequently, these values were grouped according to the way of determining the assigned value and the different types of analytes. Procedure A specifies the spiking of the blank compound feed with organic solutions of most of the coccidiostats and subsequent evaporation of the solvents. Procedure B is also based on spiking experiments, but using solid preparations of the feed additive and was applied to a minor group of coccidiostats and vitamin D3. For the PTs on trace elements, the assigned values were determined by external expert laboratories applying highly sophisticated techniques such as inductively coupled plasma coupled to sector field mass spectrometry and neutron activation analysis.
The results of the assessment are shown in Figure .
Figure 1. Measurement capability of laboratories assessed by proficiency tests (PTs) expressed as relative differences (EquationEq. 2(2),
(2), ): first, the robust means of the analytical results submitted by the laboratories were calculated individually for each analyte. Subsequently, these values were compared with the corresponding assigned values established by formulation (coccidiostats and vitamin D3) or by reference values set by external expert laboratories (trace elements) according to EquationEq. (2)
(2),
(2), . The green line for the two trace elements shows the mean value of the corresponding relative differences calculated for cobalt and selenium, respectively.
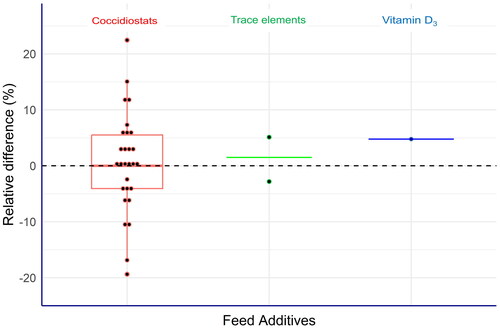
The Box plot of the results from the coccidiostats reveals that the majority of the relative differences are close to zero with a minor number above and below 10%. The relative differences for selenium and cobalt were −2.8% and 5.1% and for vitamin D3 4.8%. Also, these values were very close to 0. Subsequently, we also applied the t-test to identify significant differences (α = 0.05) of the assigned values and the corresponding robust means. For this evaluation, the standard error was calculated from the robust standard deviation and the number of laboratories delivering results for the specific PT. For 24 cases out of the 31 PTs, no significant difference was observed. For 5 cases, the absolute t-values were between 2 and 3 and only for two cases the t-values were between 3 and 4, thus indicating that only for 7 cases the null hypothesis was rejected. These results clearly showed that for the vast majority of all PTs, no significant difference between the assigned values and the robust means could be observed, therefore confirming an overall acceptable performance of the laboratories.
Preparation of homogenous materials: the challenge
The evaluation of an individual laboratory’s performance relies upon the reported analytical results derived from analysing a singular sample prepared and provided by the PT organiser. To ensure accurate assessments of laboratory performance, it is essential that the true content of the target analyte in each PT sample closely aligns with the assigned value. This goal is achieved by selecting an appropriate experimental design to obtain PT test materials with homogenous distribution of the target feed additive in the compound feed at the correct level. Moreover, prior to sending out the PT samples, the organiser of the proficiency test is obliged to demonstrate their sufficient homogeneity by analysing a randomly selected subgroup of the sample batch, applying the procedure specified in annex B of ISO 13528 (ISO Citation2015). The purpose of these experiments is to assess the between sample variation of the mass fraction of the target analyte in the PT samples. Finally, the corresponding between sample standard deviation ss is compared with the σpt, which is the standard deviation for proficiency assessment specified by EquationEq. (1)(1),
(1), . Sufficient homogeneity is only confirmed if ss is equal or below 0.3* σpt.
Most of the PT samples containing coccidiostats have been prepared by adding organic solvents containing the target analyte to blank compound feed and subsequent evaporation of the solvents. This so-called slurry technique ensures a high level of homogeneity demonstrated by the results from the homogeneity study. However, in the PT from 2015 we were confronted with the challenge to prepare homogenous test materials containing carotenoids as indicated in Table . These analytes are very sensitive to heat, oxygen and light and can only be utilised under real world conditions via particle-based products containing these analytes and other substances to ensure sufficient stability. For this reason, the test material could not be prepared applying the slurry technique. In this PT two different test materials were prepared, namely Mat 1 supplemented with a preparation containing about 100 g kg−1 canthaxanthin and Mat 2 supplemented with a natural product containing astaxanthin, adonirubin and canthaxanthin with a mass fraction between 20–23 g kg−1, 7–15 g kg−1 and 1–5 g kg−1, respectively. One main challenge of this specific PT was therefore to prepare homogenous test materials by mixing two types of particles, namely the feed additives and the compound feed. In particular, the final number of particles from the feed additive in the feed per test item was identified as critical factor. In essence, if this number is very low, e.g. 10, the variation of this number between the individual test items follows the Poisson distribution and can be very high regardless of which mixing procedure is used. Therefore, prior to the production of the test samples, some simulations were performed, to estimate achievable homogeneity of the test items, depending on the final number of feed additive particles in an aliquot of the PT test material. For these simulations we identified the following key factors that determine the number of particles: (1) the sample size of 20 g of compound feed subjected to analysis, (2) the density of the feed additive, (3) the mass fraction of the target carotenoid in the feed additive, (4) the target concentration of the carotenoid in the compound feed and (5) the particle size distribution of the feed additives used. The simulations were based on the principle that for each set of these criteria a number of particles of the feed additive in test items containing 20 g of feed was calculated and by applying the Poisson distribution the corresponding relative standard deviation (RSD) was assessed indicating the best homogeneity that can be obtained under the conditions selected. An example is given in Table for the feed additive preparation containing canthaxanthin with the identification number 2a161g.
Table 3. Conditions for mixing canthaxanthin produced by chemical synthesis (identification number 2a161g) into compound feed. Given the known instability of carotenoids, this feed additive is exclusively added via preparations.
The information presented in Table , along with the assumption of spherical particle shape, allowed for the determination of the absolute particle count in each 20 g sample of compound feed. Based on the measured particle size distribution of the feed additive, we performed calculations for three distinct scenarios. In each scenario, we assumed that the respective products consisted of particles with single diameters of 150 μm, 250 μm, and 600 μm, respectively. For each particle size, the absolute number of feed additive particles in 20 g test samples was calculated and the corresponding relative standard deviation of this parameter was assessed according to the following equation from the Poisson distribution.
(3),
(3),
where n is the calculated number of particles in each sample. Figure shows the RSD ranging from about 1.7% to 14% for three different numbers of particles in the compound feed samples calculated from the corresponding particle size.
Figure 2. Relation between the relative standard deviation (RSD) of the number of particles and the corresponding particle size. First, the number of particles were calculated separately for each particle size using the information from Table . Subsequently, the RSD was determined from the poisson distribution for the different particle numbers. Given the acceptable RSD of about 3%, the target particle size should be between 150 and 250 µm.
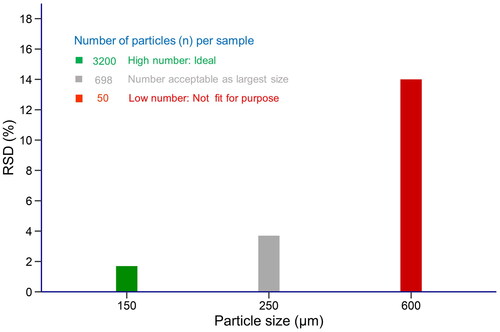
This theoretical value indicates the best homogeneity that can be obtained under the conditions specified in Table . However, the achievable variation in canthaxanthin content among the test samples under real-world conditions is expected to be higher, largely due to practical limitations inherent in the applied mixing procedure. To establish which particle size would still yield an acceptable number of particles per test sample, the corresponding RSD was compared against the previously mentioned criterion of 30% of σpt, which was 10% for the PT of identification number 2a161g. The acceptable criterion for the homogeneity was there 3%. Comparing this criterion with the different RSDs shown in Figure clearly showed that the particle size of the feed additive should be below 250 mm.
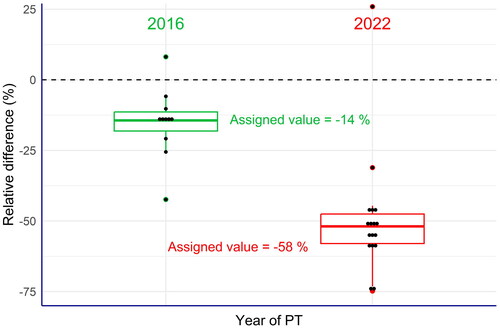
Figure 3. Box plots of the relative differences between the laboratories’ results and the labelled content of vitamin A in the commercial compound feed used as test material (EquationEq. 4(4),
(4), ). All laboratories of the 2022 PT exercise reported values clearly below the labelled values, while these differences were much less in the 2016 PT. This also applied to the assigned values in the PT exercise.
Exceeding this threshold would result in an excessively high RSD due to the presence of larger particles. To address this conclusion in selecting an appropriate production procedure, we undertook the following key steps:
The feed additive preparation was sieved to select the range between 150 to 250 µm, thus ensuring a sufficiently low RSD of the particles in the test material as indicated by the simulations shown in Figure . Given that the assigned value of the PT was derived from the certified canthaxanthin content of the feed additive preparation covering the entire particle size distribution, it was important to ensure that this value also applied to the 150 to 250 µm sieve fraction. The assessment of the production technique further confirmed the homogeneous distribution of canthaxanthin throughout all particles, thus justifying the selected procedure.
Also the blank compound feed was sieved, thus removing particles above 500 µm.
Mixing of the tiny amount of the feed additive preparation into the compound feed was not possible, because the ratio of the feed additive to the compound feed was 4 to 20.000 mg. Instead, the stepwise dilution technique was applied: the feed additive was mixed with a small quantity of blank compound feed, thus ensuring that the mass ratio of the feed additive preparation to the compound feed was not too high. This dilution process was repeated multiple times, with each iteration involving a mixture of the previous step with additional blank compound feed, until the final mass fraction of canthaxanthin in the compound feed had been reached.
Finally, subsamples of 20 g of the prepared test material were filled into aluminium bags, sealed under vacuum and stored at −20 °C until dispatch to the laboratories participating in the PT.
The efficacy of this procedure was demonstrated through an analysis of a subset of the prepared test material, thereby confirming the desired level of homogeneity.
Discrepancies in vitamin A content labelling and analytical results: Conclusions drawn from proficiency tests
Due to its high sensitivity, Vitamin A is added to compound feed via specialised preparations, ensuring its protection against degradation. These preparations are complex mixtures containing other feed additives belonging to the functional group of antioxidants such as ethoxyquin, exclusively for the purpose of the improvement of vitamin A stability. However, the use of ethoxyquin in animal nutrition has been critically discussed in previous years leading to a suspension for certain applications in 2017 (European Union Citation2017b) and to a total ban of this feed additive in 2022 (European Union Citation2022). In consequence, industry initiated the implementation of alternative solutions to the use of ethoxyquin, even prior to the ban of this substance. In parallel, there is an increasing number of reports from official control laboratories about analytical results that are below the label information on the feed sample. This triggered discussions between the EURL-FA, Member States’ official control laboratories and industry to identify possible reasons for these observations, including alterations in preparation compositions or a decline in laboratories’ proficiency of measuring vitamin A in feed samples over time. However, a clear conclusion could not be reached yet.
Due to the relevance of vitamin A in animal nutrition, there exists a high need for regularly monitor the level of this additive in compound feed samples and to check the agreement with the specifications provided on the compound feed label. To further facilitate these efforts, analytical methods for the determination of vitamin A have been standardised for a long time as specified in Table : a single-analyte method for vitamin A is included in the collection of official methods valid within the European Union (European Union Citation2024) and CEN issued a multi-analyte method encompassing vitamins A, E and D (CEN European Committee for Standardisation 2021). Nevertheless, the analysis of vitamin A is not easy and requires extensive laboratory expertise to prevent its degradation. In order to assess the proficiency of Member States’ laboratories to analyse vitamin A in compound feed at relevant levels, the EURL-FA Control has organised two studies, namely in 2016 for the first PT and in 2022 for the second PT. In both PTs, we used commercial compound feed supplemented with vitamin A and accompanied by detailed label information specifying the added dosage level. Moreover, in both exercises the assigned value for the vitamin A content in the test materials was the robust mean calculated from the submitted results provided by the sub-group of laboratories that had applied the official Union method (European Commission Citation2024). Here, we compared the laboratories’ results (xlab) with the content indicated on the label of the compound feed (xlabel) separately for 2016 and 2022 by calculating the relative difference according to the following equation:
(4),
(4),
The label content expressed as international units (IU) in the test materials from the trials in 2016 and 2022 were 12000 IU kg−1 and 10000 IU kg−1, respectively, indicating a comparable level.
Figure presents the box plot of the relative differences (%) calculated for each laboratory participating in both PTs, 2016 and 2022, as well as for their corresponding assigned values. The comparison of the results from both PTs revealed a huge difference, with a very high number of laboratories in 2022 reporting markedly lower values compared to the labelled values, in contrast to the results observed in 2016. This clearly confirmed the findings from recent official control exercises, where a higher portion of samples with significant deviations from the labelled vitamin A content was reported. Moreover, the comparison of both PTs revealed that the variation of the relative differences of the laboratories’ results were comparable in 2016 and 2022, respectively. This means that the laboratories reported consistently too low results in 2022 compared to 2016. Because it is very unlikely that the performance of most of the laboratories deteriorated at the same time, an alternative explanation for these findings is that the vitamin A content of the commercial compound feed in 2022 was indeed below the labelled value, while in 2016 the real vitamin A content was close to the labelled value. This in turn could be caused by the forced modification of the vitamin A preparation in response to the ban of ethoxyquin. Further investigations are therefore required to clarify the problems related to the determination of vitamin A.
Improvement of laboratories’ proficiency by EURL-FA training courses
The details of the analytical methods for the determination of carotenoids that are proposed by the industry show the complexity of the analytical procedures. These methods have been subsequently evaluated by the EURL-FA as exemplified in the determination of synthetic canthaxanthin in compound feed for poultry and fish (EURL-FA Citation2011, Citation2012), highlighting the various critical aspects of the methods. As already pointed out in case study 2, carotenoids are very sensitive substances and therefore exclusively available on the market via specific preparations. These are either natural products such as cells of Paracoccus carotinifaciens or encapsulated preparations when dealing with carotenoids produced by synthesis. In both cases, carotenoids are effectively protected against degradation. Especially for the encapsulated preparations however, an enzymatic digestion step needs to be integrated in the extraction procedure to ensure sufficient extraction of the carotenoids from the matrix. A second challenge is linked to the fact that carotenoids are present as geometrical isomers, namely all-trans and cis forms. While the legal limits of these substances apply to the sum of all geometrical isomers, their quantification by using a photodiode array detector in the visible range requires a full chromatographic separation of the isomers, reflecting their different absorption coefficients. This is not an easy target, because full separation is only achievable by normal-phase high-performance liquid chromatography (HPLC), which is rarely used in routine laboratories Moreover, for most of the cases there are only commercial standards of the all-trans isomers available, thus requiring the use of experimentally determined relative response factors. The correct quantification of carotenoids therefore requires significant experience.
To facilitate the routine analysis of carotenoids in compound feed the EUR-FA Control conducted in cooperation with expert laboratories the development and validation of a multi-analyte method, covering feed additives of synthetic as well as natural origin. One of the main purposes of this method was to cope with the limitations of the previously described method. Key components were (1) the substitution of normal phase by reverse phase HPLC and (2) quantification of the carotenoids at the isosbestic point specifying a specific wavelength at which the absorption coefficients of the various isomers are identical. The latter aspect allows the use of all-trans standards also for the quantification of cis isomers. The development and single-laboratory method have been published in 2017 (Vincent et al. Citation2017) and the interlaboratory validation was published in 2021 (Vincent et al. Citation2021). Based on the successful validation results the method became the CEN standard EN 17550 (CEN European Committee for Standardisation Citation2021).
In 2015, the EURL-FA organised the first PT for the determination of three carotenoids in two different compound feed samples as detailed in Table . The statistical assessment of the results revealed a large variation of the reported mass fractions of the target analytes. In response to the outcome of this PT, the EURL-FA organised in 2018 a hands-on training for the participants in the EURL laboratory. One of the major objectives was to elaborate on critical steps in carotenoid analysis, sharing our experiences of the development of the above-mentioned CEN standard with the participants. Knowledge about these aspects would therefore enable laboratories to improve their capability of analysing carotenoids regardless of which specific protocol is applied. In 2019, the EURL-FA organised a second PT on the same analyte/matrix combination as shown in Table .
Here we intend to demonstrate the impact of a hands-on training course on the performance of laboratories by comparing the results obtained in the PTs of 2015 and 2019. This assessment focused on the results obtained from 7 laboratories that participated in both PTs.
For the comparison we calculated relative differences between laboratories’ results (xlab) and the corresponding assigned value, separately for each analyte/matrix combination according to the following equation.
(5)
(5)
The obtained relative differences were merged separately for the PTs conducted in 2015 and 2019 and the corresponding box plots are shown in Figure .
Figure 4. Box plots of the relative differences between the laboratories’ results and the assigned value of three carotenoids (canthaxanthin, astaxanthin and adonirubin) in the commercial compound feeds used as test materials (EquationEq. 5(5)
(5) ). Large deviations of the results from the assigned values were observed in the proficiency tests (PTs) from 2015. After a training exercise organised by the EURL-FA for the laboratories concerned, the results of a PT from 2019 showed significant less variations, thus confirming overall improvement of the laboratories’ performance.
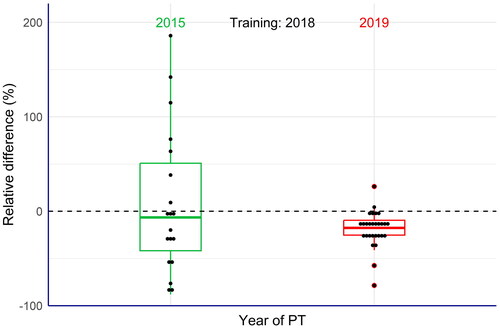
The comparison confirmed the huge improvement of the reported results from the laboratories. For instance, in the 2015 PT the largest relative difference was − 88% of the assigned value, whereas the corresponding result in the 2019 PT was − 60%. When looking at the results that were above the assigned value, the improvement was even more obvious, because the largest relative difference in the 2015 PT was 185% in contrast to 26% in the 2019 PT. Interestingly, the laboratories gained an improvement of their performance, even when applying different analytical methods. This is a strong indication that the training course successfully fulfilled the intended objectives by enhancing general proficiency in carotenoid analysis.
Conclusions
Since 2012, the EURL-FA Control is organising annual proficiency tests for EU Member States laboratories. The main objective of PTs is to evaluate the performance of individual laboratories regarding the analysis of specific feed additives. Here we look at the results of the PTs from a different angle, allowing us to address interesting questions beyond the main purpose of PTs. By focusing on PTs in which the assigned values have not been derived from the data submitted by laboratories we were able to assess the overall measurement capability of EU laboratories by comparing the assigned values with the robust mean of the results of all laboratories. Because we also included in some PTs feed additives that are only available via preparations characterised by specific particles sizes, we elaborated on important challenges of homogenous test material preparation using such preparations. When organising two PTs on the same feed additive but in different years, it is also possible to address the impact of external factors on the results of the laboratories such as the forced modification of the composition of a feed additive or the organisation of a hands-on training course. These examples clearly demonstrated that the results from PTs can serve as important source of information for dealing with general questions on feed additive analysis.
The presentation of the four PTs also demonstrates that the large variety of the different feed additives in terms of analytical methods is rather challenging for the operation of the EURL-FA and is only possible via strong networking with Member States expert laboratories. Furthermore, it demonstrates the capability of Member States’s official laboratories to monitor the correct use of feed additives in animal nutrition.
Ethical approval
Animal Care and Use Committee approval was not obtained for projects presented in this paper, because there were no experiments involving animals.
Acknowledgements
We are grateful to Joerg Stroka and Katrien Bouten for their contributions to the organisation of the PT in 2022 for vitamin A.
Disclosure statement
No potential conflict of interest was reported by the author(s).
Data availability statement
The data presented in this article are freely available from cited published articles.
References
- Analytical Methods Committee. 1989. Robust statistics–how not to reject outliers. Part 1. Basic Concepts. 114:1693–1697.
- Analytical Methods Committee. 1989. Robust statistics–how not to reject outliers. Part 2. Inter-Laboratory Trials. 114:1699–1702.
- CEN European Committee for Standardisation. 2021. EN 17550:2021. Animal feeding stuffs: methods of sampling and analysis - Determination of carotenoids in animal compound feed and premixtures by high performance liquid chromatography - UV detection (HPLC-UV).
- EURL-FA. 2011. Evaluation report on canthaxanthin. [accessed 2024 March 1] Available from: https://joint-research-centre.ec.europa.eu/system/files/2013-02/FinRep-FAD-2008-0048.pdf.
- EURL-FA. 2012. Evaluation report on vitamin D3. [accessed 2024 January 8]. Available from: https://joint-research-centre.ec.europa.eu/system/files/2013-02/FinRep-Vit-D3-Group.pdf.
- European Commission. 2023. European Union Register of feed additives [Internet] [assessed 2024 February 23]. https://ec.europa.eu/food/food-feed-portal/screen/feed-additives/search.
- European Union. 2003. Regulation (EC) No. 1831/2003 of the European Parliament and the Council of 22 September 2003 on additives for use in animal nutrition. Off J Eur Union. L. 268:29–43. as last amended by Commission Regulation (EU) 2015/2294.
- European Union. 2008. Commission Regulation (EC) No. 429/2008 of 25 April 2008 on detailed rules for the implementation of Regulation (EC) No. 1831/2003 of the European Parliament and of the Council as regards the preparation and the presentation of applications and the assessment and the authorisation of feed additives. European Union. 2009. Off J Eur Union. L. 133:1–65.
- European Union. 2015. Commission Implementing Regulation (EU) 2015/1486. concerning the authorisation of canthaxanthin as feed additive for certain categories of poultry, ornamental fish and ornamental birds. Off J Eur Union. L. 229:5–8.
- European Union. 2017a. Regulation (EU) 2017/625 of the European Parliament and of the Council of 15 March 2017 on official controls and other official activities performed to ensure the application of food and feed law, rules on animal health and welfare, plant health and plant protection products. Off J Eur Union. L. 95:1–142.
- European Union. 2017b. Commission Implementing Regulation (EU) 2017/962 of 7 June 2017 suspending the authorisation of ethoxyquin as a feed additive for all animal species and categories. Off J Eur Union L. 1145:13–17.
- European Commission. 2022. Commission implementing Regulation (EU) 2022/1375 of 5 August 2022 concerning the denial of authorisation of ethoxyquin as a feed additive belonging to the functional group of antioxidants and repealing Implementing Regulation (EU) 2017/962. Off J Eur Union L. 206:39–41.
- European Union. 2024. Commission Implementing Regulation (EU) 2024/771 of 29 February 2024 amending Regulation (EC) No 152/2009 laying down the methods of sampling and analysis for the official control of feed. Off J Eur Union L 15.3. 2024:1–129.
- ISO. 2015. ISO 13528 statistical methods for use in proficiency testing by interlaboratory comparisons. Geneva, Switzerland: International Organisation for Standardization.
- ISO. 2010. ISO/IEC 17043 Conformity assessment, General requirements for proficiency testing. Geneva, Switzerland: International Organisation for Standardization.
- Royal society of chemistry. .2024. AMC Software. https://www.rsc.org/membership-and-community/connect-with-others/join-scientific-networks/subject-communities/analytical-science-community/amc/software/. Assessed on 10.
- Thompson M, Ellison LR, Wood R. 2006. The international harmonized protocol for the proficiency testing of analytical chemistry laboratories. Pure Appl Chem. 78(1):145–196. doi: 10.1351/pac200678010145.
- Vincent U, Serano F, von Holst C. 2017. Development and validation of a multi-analyte method for the regulatory control of carotenoids used as feed additives in fish and poultry feed. Food Addit Contam Part A Chem Anal Control Expo Risk Assess. 34(8):1285–1297. doi: 10.1080/19440049.2017.1315651.
- Vincent U, Serano F, von Holst C. 2021. Validation of a multi-analyte HPLC method for the determination of carotenoids used as feed additives in fish and poultry feed: results of an interlaboratory study. Food Addit Contam Part A Chem Anal Control Expo Risk Assess. 38(3):396–408. doi: 10.1080/19440049.2020.1869325.
- von Holst C, Robouch P, Bellorini S, González de la Huebra MJ, Ezerskis Z. 2016. A review of the work of the EU Reference Laboratory supporting the authorisation process of feed additives in the EU. Food Addit Contam Part A Chem Anal Control Expo Risk Assess. 33(1):66–77. doi: 10.1080/19440049.2015.1116127.