ABSTRACT
Small cell lung cancer (SCLC) is distinguished by aggressive growth, early dissemination and a poor prognosis at advanced stage. The remarkably high count of circulating tumor cells (CTCs) of SCLC allowed for the establishment of permanent CTC cultures at our institution for the first time. CTCs are assumed to have characteristics of cancer stem cells (CSCs) and an epithelial-mesenchymal transition (EMT) phenotype, but extravasation of tumors at distal sites is marked by epithelial features. Two SCLC CTC cell lines, namely BHGc7 and BHGc10, as well as SCLC cell lines derived from primary tumors and metastases were analyzed for the expression of pluripotent stem cell markers and growth factors. Expression of E-cadherin and β-Catenin were determined by flow cytometry. Stem cell-associated markers SOX17, α-fetoprotein, OCT-3/4, KDR, Otx2, GATA-4, Nanog, HCG, TP63 and Goosecoid were not expressed in the 2 CTC lines. In contrast, high expression was found for HNF-3β/FOXA2, SOX2, PDX-1/IPF1 and E-cadherin. E-cadherin expression was restricted to the 2 CTCs and 2 cell lines derived from pleural effusion (SCLC26A) and bone metastases (NCI-H526), respectively. Thus, these SCLC CTCs established from extended disease SCLC patients lack expression of stem cell markers which suppress the epithelial phenotype. Instead they express high levels of E-cadherin consistent with a mesenchymal-epithelial transition (MET or EMrT) and form large tumorospheres possibly in response to the selection pressure of first-line chemotherapy. HNF-3β/FOXA2 and PDX-1/IPF1 expression seem to be related to growth factor dependence on insulin/IGF-1 receptors and IGF-binding proteins.
Introduction
Small cell lung cancer (SCLC) constitutes a highly aggressive growing and invasive malignancy affecting a subgroup of approximately 15% of all lung cancer patients.Citation1 The majority of patients present with disseminated disease which responds to platinum-based chemotherapy but recurs within approximately one year as chemoresistant tumor not amenable to effective second-line therapy.Citation2 Furthermore, SCLC is distinguished by extremely high numbers of circulating tumor cells (CTCs) which exceed blood counts of other tumor entities up to several hundertfold.Citation3 Therefore, SCLC represents an excellent model to study tumor dissemination and the role and phenotype of the CTCs involved. In fact, we were able to establish several permanent SCLC CTC cell lines from blood samples of patients with extended disease and to use expanded in vitro cultures for characterization of markers, receptor kinases, proteases, chemosensitivity and interactions with cells of the immune system.Citation4,5
Tumor dissemination occurs in several steps, comprising generation of invasive subpopulations of cancer cells, dissolution of stroma, angiogenesis and intravasation, followed by transport into the peripheral circulation or lymphatic system and extravasation to establish secondary lesions at distal sites.Citation6 Acquisition of the invasive phenotype is thought to involve epithelial-to-mesenchymal transition (EMT) to gain migratory potential and capability to survive in the circulation.Citation6,7 During EMT, cell adhesion molecules, such as E-cadherin are downregulated by specific regulators and mesenchymal markers such as vimentin are increasingly expressed. Thus, CTCs in initial stages are assumed to express an EMT phenotype and show a corresponding reduction in cell proliferation which may eventually result in a dormant state for extended periods of time.Citation6 On the other hand, cells involved in extravasation and formation of metastases are characterized by expression of epithelial markers, most easily explained by so-called mesenchymal-epithelial transition (MET) or epithelial-mesenchymal reversed transition (EMrT).Citation8,9 Furthermore, CTCs may represent a subpopulation of cells with self-renewal, multipotency and tumor initiating capabilities designated circulating cancer stem cells (CSCs) which may hold the highest malignant potential.Citation10 in the present study, we have used 2 SCLC CTC cultures, namely BHGc7 and BHGc10, to analyze the expression of a panel of pluripotent stem cell markers and their epithelial or mesenchymal phenotype.
Results and discussion
Morphology of CTCs in tissue culture
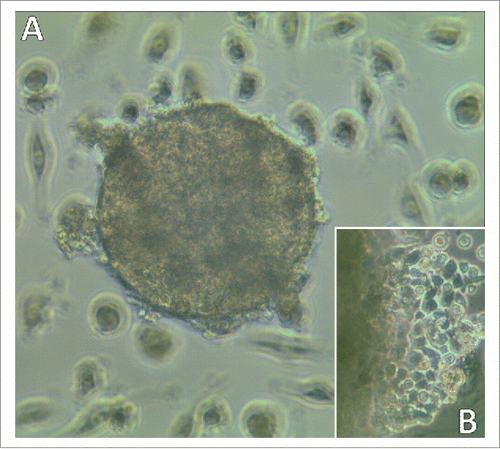
CTC cell lines were established from blood samples of patients with extended SCLC. CTCs grow initially as typical small spheroids which eventually show outgrowth of adherent tumor cells and shedding of some apoptotic cell fragments (). Cell populations could be expanded and show unimpaired continuous growth in regular tissue culture medium. The CTC cell lines used are tumorigenic in immunodeficient NOD Scid Gamma (NSG) mice and exhibit expression of typical markers for SCLC, such as mutated p53, EpCAM, CD56/NCAM, chromogranin and others (data no shown).
Analysis of the expression of pluripotent stem cell markers by CTCs
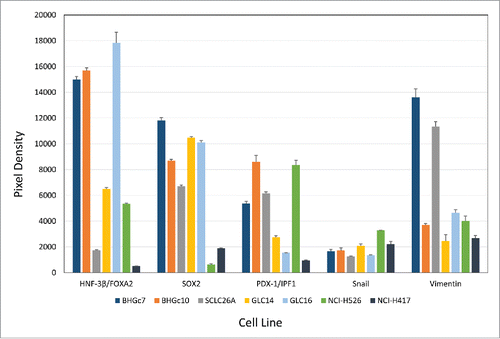
SCLC CTCs lines BHGc7 and BHGc10, as well as SCLC cell lines SCLC26A, GLC14, GLC16, NCI-H526 and NCI-H417, were processed for Western blot arrays according to the manufacturer's instructions. Out of the 15 pluripotent stem cell markers included, SOX17, α-fetoprotein, OCT-3/4, VEGFR2/KDR, Otx2, GATA-4, Nanog, HCG, TP63/TP73L and Goosecoid were not found to be expressed at significant amounts in any of the cell lines (data not shown). In contrast, expression of HNF-3β/FOXA2, SOX2, PDX-1/IPF1, Snail and E-cadherin was detected (). HNF-3β/FOXA2 was present in the 2 CTC cell lines and NCI-H526, whereas low levels were visible in SCLC26A and NCI-H417. Interestingly, expression of this marker increased in GLC16 versus GLC14, derived from a recurrent metastases and the primary tumor of the same patient, respectively. SOX2 was detected in all cell lines, with low expression in NCI-H526 and NCI-H417. PDX-1/IPF1 was highest in the 2 CTC lines, SCLC26A and NCI-H526, with low expression in the other lines. Low expression of Snail was found in all lines. E-cadherin was not included in this figure since it is far off scale (Pixel density of approximately 50,000) and was further analyzed in flow cytometry. Vimentin is expressed in BHGc7 and SCLC26A and at base levels in BHGc10 and the other cell lines. However, the vimentin:E-cadherin ratio in BHGc7 and SCLC26A is low (< 0.26; other cell lines < 0.11).
Figure 2. Expression of pluripotent stem cell markers by SCLC CTCs and cell lines. The figure shows the panel of pluripotent stem cell markers of 2 SCLC CTCs and several SCLC cell lines as determined by Western blot arrays. BHGc7 and BHGc10 together with GLC16 exhibited significantly higher expression of HNF-3β/FOXA2 compared to the other cell lines. Other markers included in this array, SOX17, α-fetoprotein, OCT-3/4, KDR, Otx2, GATA-4, Nanog, HCG, TP63 and Goosecoid showed no significant expression were not included here. Data for Vimentin were supplemented from ARY026 arrays.
Expression of E-cadherin and β-catenin by SCLC CTCs and cell lines
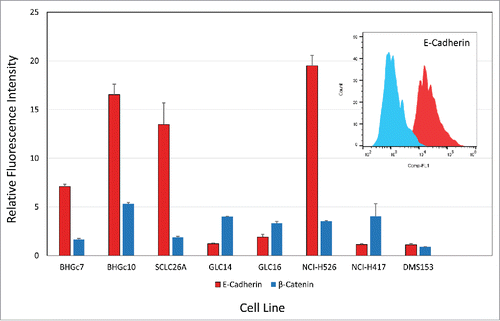
E-cadherin is highly expressed at the cell surface of the 2 CTC lines and metastatic lines SCLC26A and NCI-H526, whereas cell surface expression is low in the other SCLC cell lines tested (). Cytoplasmic β-catenin is detectable in all cell lines except BHGc7, SCLC26A and DMS153.
Figure 3. Flow cytometric analysis of E-cadherin and β-catenin expression. CTCs and cell lines were stained in indirect immunofluorescence for E-cadherin and β-catenin and values are presented as ratios of specific fluorescence signals with antibody to isotype controls (mean values of fluorescence maxima ± SD).
Formation of tumorospheres by SCLC CTC lines
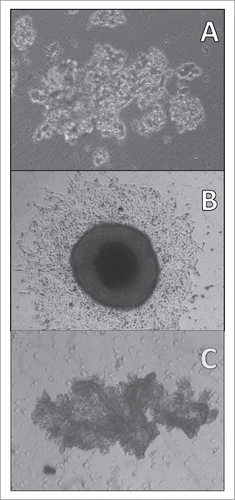
Adherent SCLC CTCs in tissue culture eventually start to form 3-dimensional structures under regular tissue culture conditions (: BHGc10, left side of culture; magnification 100fold) which later grow into large rounded tumorospheres with defined borders (: BHGc7, magnification 40fold). These structures are initiated by a significant fraction of the adherent cells and finally reach diameters exceeding 1000 µm. A large and irregular cluster of NCI-H526 SCLC cells lacking any subpopulation of adherent cells is shown for comparison (Fig.4C; magnification 40fold).
Figure 4. Light microscopy of a SCLC CTC tumorosphere. Adherent SCLC CTCs in tissue culture eventually start to form 3-dimensional structures under regular tissue culture conditions (A: BHGc10, left side of culture; magnification 100fold) which later grow into large tumorospheres (B: BHGc7, diameter of tumorosphere 560 µm; magnification 40fold). A large and irregular agglomeration of NCI-H526 cells in suspension is shown for comparison (C: magnification 40fold).
Expression of insulin- and insulin-like growth factor mediators
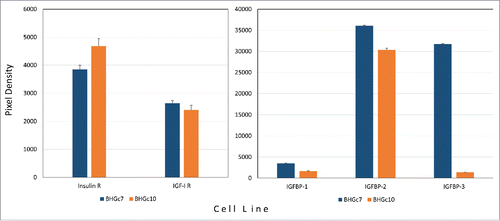
Significant expression of insulin receptor (IR) and insulin-like growth factor-1 receptor (IGF-1R) as well as of insulin-like growth factor binding protein-2 (IGFBP-2) was detected for the 2 CTC cell lines in Western blot arrays (). Expression of IGFBP-3 was restricted to BHGc7.
Figure 5. Expression of insulin/IGF growth circuit components by SCLC CTCs. Expression of insulin- and IGF1-receptors (A) as well as IGF binding proteins (B) by BHGc7 and BHGc10 as determined by Western blot arrays are shown as mean values ± SD. The two CTC cell lines as well as SCLC26A and NCI-H526 showed significantly higher expression of E-cadherin compared to the other cell lines.
Characteristics of tumor dissemination
Two permanent cultures of SCLC CTCs, namely BHGc7 and BHGc10, derived from different patients with extended disease allowed for the detailed study of biological characteristics of such cells in tumor spread. These cell lines show typical markers of SCLC and are tumorigenic in NSG immunocompromised mice. Metastasis occurs through a series of steps: local invasion, intravasation, transport, extravasation, and colonization.Citation6 Intravasation is supposed to depend on a phenotypical switch, EMT, during which epithelial cells display decreased expression of distinct markers (loss of cytokeratins and downregulation of E-cadherin, occludins, claudins and desmoplakin) and acquisition of mesenchymal traits (up-regulation of vimentin, N-cadherin, fibronectin and α-smooth muscle actin).Citation12 Carcinomas expressing normal levels of E-cadherin have an epitheloid phenotype and are non-invasive in vitro, whereas those with reduced expression were fibroblast-like and invasive. Accordingly, invasive pulmonary neuroendocrine tumors, such as SCLC, show reduced expression of the adhesion molecules and increases in transcriptional repressors, in particular, Snail1/2 and Twist.Citation13 Abrogation of E-cadherin has been shown to be associated with the metastatic phenotype.Citation14
Significance of expression of pluripotent stem cell markers by SCLC CTCs
Developing SCLC CTCs appear as small compact spheroids which exhibit outgrowth of adherent cell populations, thus indicating presence of cell adhesion molecules. In the 2 CTC lines, HNF-3β/FOXA2, SOX2, PDX-1/IPF1, low levels of Snail and marked expression of E-cadherin was detectable. The other markers, SOX17, α-fetoprotein, OCT-3/4, VEGFR2/KDR, Otx2, GATA-4, Nanog, HCG, TP63/TP73L and Goosecoid, were not found to be expressed above background levels in any of the cell lines tested. Vimentin was present in BHGc7 and SCLC26A but at a low ratios in relation to the amount of E-cadherin. Additionally, cell surface expression of E-cadherin was found in SCLC26A and NCI-H526, derived from pleural effusion and bone metastases, respectively. E-cadherin was low in primary GLC14 and the recurrent local metastases thereof, namely GLC16, as well as primary NCI-H417 SCLC. All cell lines except BHGc7, SCLC26A and DMS153 were positive for β-catenin at varying degree.
Amplification of the transcription factor SOX2 is detectable in several cancer types including glioblastoma, SCLC and squamous cell carcinoma (SCC).Citation15 SOX2 cooperates with OCT-3/4 and Nanog to maintain pluripotency of pluripotent stem cells (PSCs) and regulates self-renewal and maintenance in cancer stem cell (CSC) populations.Citation16-18 SOX2 knockdown resulted in reduced spheroid formation and increased apoptosis.Citation19 Additionally, c-MYC, whose expression can also be controlled by SOX2, may be a driver in SCLC.Citation20 Increased expression of SOX2 and FGFR1 may constitute poor prognostic indicators in SCLC patients.Citation21 HNF-3β/FOXA2 prevents EMT of breast cancer cells by repressing the transcription factor ZEB2 and stimulates the promoter of E-cadherin.Citation22Accordingly, knockdown of HNF-3β/FOXA2 promoted the mesenchymal phenotype. PDX-1 is a oncogenic transcriptional activator of insulin, somatostatin, glucokinase, islet amyloid polypeptide, and GLUT2, among others.Citation23 It is involved in the embryonic development of the pancreas and expressed in other human neoplasms.Citation24 Adult pancreas harbors a PDX1- and EpCam-positive dormant progenitor cell population that is capable of initiating tumor growth under conditions of oncogenic stimulation via MAPK/ERK and MYC stabilization.Citation25 Interestingly, SCLC CTCs are EpCam-positive, a trait used for immunomagnetic separation.Citation3 As part of the antiapoptotic insulin signal transduction cascade, PDX1 is involved in maintaining adequate expression of antiapoptotic proteins, BCl-2 and Bcl-xL and that loss of PDX1 leads to increased caspase-3 activity.Citation26 Furthermore, HNF3β/FOXA2, as key regulator of endodermal cell lineage development, directs transcription of pdx-1 gene in the pancreas.Citation27
Although SCLC is not considered a receptor tyrosine kinase driven disease, IGF1R and FGFRs are often overexpressed by SCLC.Citation28 The present results indicate significant expression of IGF1R and insulin receptor in both SCLC CTC cell lines. Inhibition of IGF1R was met with little clinical success in lung cancer.Citation29 When the IGF1R alone is inhibited, unhindered signaling through the insulin receptor may maintain cell proliferation.Citation30 Availability of IGF is controlled by 6 members of the IGF binding proteins of which IGF-BP2 are expressed in both CTC lines and IGFBP-3 in BHGc7.Citation31 Blockade of IGFBP-2 appears to be an effective approach to inhibiting tumor growth and metastasis.Citation32 Evidence is emerging that IGFBP-3 also exhibits pro-survival and growth-promoting properties in vitro.Citation33
Conclusion
In conclusion, our results clearly indicate, that the 2 CTC SCLC cell lines have undergone complete (BHGc10) or partial (BHGc7) MET. CTCs display significant heterogeneity in terms of the degree of EMT/MET phenotype that probably reflects differential invasive potential.Citation34 There was little information on EMT processes in SCLC so far. However, in a recent study Krohn et al. demonstrated that several SCLC cell lines comprise a small subpopulation of adherent cells which express high levels of the mesenchymal markers vimentin and fibronectin and very low levels of the epithelial markers E-cadherin and Zona Occludens 1 (ZO-1).Citation35 Although primary tumors and CTCs present EMT features in most tumors, distant metastases are generally epithelial in morphology. In 2002, Jean Paul Thiery, proposed the reversible EMT metastasis model in which tumor cells activate EMT to invade, while, upon arriving at distant sites, they undergo a reversion process, or MET, to form epithelial metastases.Citation8,9 In general, metastatic foci commonly appear more differentiated than the primary tumor, suggesting that cancer cells may undergo a MErT.Citation36 Vimentin-positive CTCs might have undergone MET to form vimentin-negative metastasis by loss of an EMT-inducing signal at the distant site.Citation6,37 E-cadherin re-expression imparted by a partial MET at the secondary site increases survival of the metastatic cancer cell and increase chemoresistance as tumor spheroids.Citation36 The 2 SCLC CTC lines were established as small spheroids which after outgrowth of adherent cells formed large tumorospheres under regular culture conditions in contrast to such structures obtained from other tumor entities which require hindrance of cell adhesion.Citation38 In contrast, all other SCLC cell lines used here show growth in suspension either as single cells, as in the case of SCLC26A, or as medium-sized to large clusters which represent merely loose and irregular agglomerations of the individual cells. We have recently shown that the 2 CTC cell lines are chemosensitive to second-line therapeutics as single cell suspensions.Citation39 First-line chemotherapy in SCLC may spare cancer cells which underwent MET and form large tumorospheres which are known to have increased chemoradioresistance due to the presence of quiescent cells and hypoxic cores. BHGc7 and BHGc10 are established from patients with relapsing and refractory SCLC after first-line chemotherapy, respectively.Citation39 Furthermore, studies in cell culture showed that induction of EMT by Snail1 and Zeb2 directly represses cell division and activation of Twist1 was found to be associated with reduced tumor cell proliferation.Citation6,12 Since colonization demands tumor cells to restart proliferation upon extravasation, reversion of EMT may be required to provide such growth advantage. In summary, the 2 tumorigenic SCLC CTCs established from patients with advanced disease display epithelial markers, most likely due to selection of adhesion-positive and chemoresistant tumorospheres and the requirement of MET to form epithelial metastases.
Materials and methods
Cell lines and culture conditions
SCLC cell lines were obtained from the Department of Radiation Biology, Finsen Center, National University Hospital, Copenhagen, Denmark, except SCLC26A which was established from a pleural effusion in our lab. The SCLC CTC cell lines BHGc7 and BHGc10 were established at our institution from blood samples of patients with extended disease according to the regulations of the ethics committee. All cells were cultivated in RPMI-1640 medium, supplemented with 10% fetal bovine serum and antibiotics. Cells were passaged by aspiration of cells after dispersion/detachment and replacement with fresh medium.
Western blot arrays
Pluripotent stem cell markers were analyzed using the ARY010 Proteome Profiler Array (R&D Systems, Minneapolis, MN, USA) and vimentin as well as growth factor receptors/binding proteins with ARY026 Proteome Profiler Oncology Proteins XL Array (R&D Systems) according to the manufacturer's instructions. For ARY010, cells were rinsed with PBS and solubilized at a cell density of 1 × 10Citation7 cells/mL in lysis buffer supplemented with protease inhibitor cocktail (P8340, Sigma-Aldrich, St.Louis, MO, USA). The extract was centrifuged and processed for the Western blot array. For the ARY026, the lysis was performed as for ARY010. To assess cellular and soluble proteins, supernatants of the cell lines were cleared by centrifugation and mixed with the cell extracts before application to the Western blot membranes. Experiments were done in duplicate and the same number of cells were used for extraction of the different cell lines. Arrays were evaluated using ImageJCitation11 and Origin 9.1 software (OriginLab, Northampton, MA, USA) and the individual Western blot membranes were normalized according to the pixel densities of the 6 reference spots. E-cadherin and β-catenin were determined in flow cytometry (Beckman-Coulter FCS 500 flow cytometer) using antibodies in indirect immunofluorescence (anti-mouse-IgG-FITC; Sigma-Aldrich, St. Louis, MO, USA). The primary antibodies were CD324/E-cadherin clone 67A4 and β-actin clon 2F1-1 (Biolegend, San Diego, CA, USA).
Statistical analysis
Statistical analysis was performed using Origin software and t- tests with p < 0.05 were regarded as statistically significant.
Abbreviations
| CTC | = | circulating tumor cell |
| EMT | = | epithelial-mesenchymal transition |
| EpCam | = | epithelial cell adhesion molecule |
| FGFR1 | = | fibroblast growth factor receptor-1 |
| FOXA2 | = | Forkhead Box A2 |
| HNF-3β | = | hepatocyte nuclear factor 3β |
| IGF-1 | = | insulin-like growth factor-1 |
| PDX-1 | = | pancreatic and duodenal homeobox 1 |
| SCLC | = | small cell lung cancer |
| SOX | = | SRY (sex determining region Y)-box |
Disclosure of potential conflicts of interest
No potential conflicts of interest were disclosed.
Funding
This work was funded to a minor part by the Ludwig Boltzmann Society.
References
- Semenova EA, Nagel R, Berns A. Origins, genetic landscape, and emerging therapies of small cell lung cancer. Genes Dev 2015; 29:1447-62; PMID:26220992; http://dx.doi.org/10.1101/gad.263145.115
- Kalemkerian GP. Advances in pharmacotherapy of small cell lung cancer. Expert Opin Pharmacother 2014; 15:2385-96. PMID:25255939; http://dx.doi.org/10.1517/14656566.2014.957180
- Yu M, Bardia A, Wittner BS, Stott SL, Smas ME, Ting DT, Isakoff SJ, Ciciliano JC, Wells MN, Shah AM, et al. Circulating breast tumor cells exhibit dynamic changes in epithelial and mesenchymal composition. Science 2013; 339:580-4; PMID:23372014; http://dx.doi.org/10.1126/science.1228522
- Hamilton G, Burghuber O, Zeillinger R. Circulating tumor cells in small cell lung cancer: ex vivo expansion. Lung 2015; 193:451-2; PMID:25821178; http://dx.doi.org/10.1007/s00408-015-9725-7
- Hamilton G, Rath B, Klameth L, Hochmair M. Receptor tyrosine kinase expression of circulating tumor cells in small cell lung cancer. Oncoscience 2015; 2:629-34; PMID:26328272.
- Tsai JH, Yang J. Epithelial-mesenchymal plasticity in carcinoma metastasis. Genes Dev 2013; 27:2192-206; PMID:24142872; http://dx.doi.org/10.1101/gad.225334.113
- Mitra A, Mishra L, Li S. EMT, CTCs and CSCs in tumor relapse and drug-resistance. Oncotarget 2015; 6:10697-711; PMID:25986923.
- Thiery JP. Epithelial-mesenchymal transitions in tumour progression. Nat Rev Cancer 2002; 2(6):442-54; PMID:12189386.
- Yao D, Dai C, Peng S. Mechanism of the mesenchymal-epithelial transition and its relationship with metastatic tumor formation. Mol Cancer Res 2011; 9:1608-20; PMID:21840933; http://dx.doi.org/10.1158/1541-7786.MCR-10-0568
- Barriere G, Fici P, Gallerani G, Fabbri F, Zoli W, Rigaud M. Circulating tumor cells and epithelial, mesenchymal and stemness markers: characterization of cell subpopulations. Ann Transl Med 2014; 2:109; PMID:25489583; http://dx.doi.org/10.3978/j.issn.2305-5839.2014.10.04
- Schneider CA, Rasband WS, Eliceiri KW. NIH Image to ImageJ: 25 years of image analysis. Nature Meth 2012; 9:671-5; PMID:22930834.
- Yu N, Zhou J, Cui F, Tang X. Circulating tumor cells in lung cancer: detection methods and clinical applications. Lung 2015; 193:157-71; PMID:25690734; http://dx.doi.org/10.1007/s00408-015-9697-7
- Galván JA, Astudillo A, Vallina A, Crespo G, Folgueras MV, González MV. Prognostic and diagnostic value of epithelial to mesenchymal transition markers in pulmonary neuroendocrine tumors. BMC Cancer 2014; 14:855; PMID:25413006; http://dx.doi.org/10.1186/1471-2407-14-855
- Tokman MG, Porter RA, Williams CL. Regulation of cadherin-mediated adhesion by the small GTP-binding protein Rho in small cell lung carcinoma cells. Cancer Res 1997; 57:1785-93; PMID:9135023.
- Karachaliou N, Rosell R, Viteri S. The role of SOX2 in small cell lung cancer, lung adenocarcinoma and squamous cell carcinoma of the lung. Transl Lung Cancer Res 2013; 2:172-9; PMID:25806230; http://dx.doi.org/10.3978/j.issn.2218-6751.2013.01.01
- Zhang S, Cui W. Sox2, a key factor in the regulation of pluripotency and neural differentiation. World J Stem Cells 2014; 6:305-11; PMID:25126380; http://dx.doi.org/10.4252/wjsc.v6.i3.305
- Weina K, Utikal J. SOX2 and cancer: current research and its implications in the clinic. Clin Transl Med 2014; 3:19; PMID:25114775; http://dx.doi.org/10.1186/2001-1326-3-19
- Vazquez-Martin A, Cufí S, López-Bonet E, Corominas-Faja B, Cuyàs E, Vellon L, Iglesias JM, Leis O, Martín AG, Menendez JA. Reprogramming of non-genomic estrogen signaling by the stemness factor SOX2 enhances the tumor-initiating capacity of breast cancer cells. Cell Cycle 2013; 12:3471-7; PMID:24107627; http://dx.doi.org/10.4161/cc.26692
- Seymour T, Nowak A, Kakulas F. Targeting Aggressive Cancer Stem Cells in Glioblastoma. Front Oncol 2015; 5:159; PMID:26258069; http://dx.doi.org/10.3389/fonc.2015.00159
- Park SB, Seo KW, So AY, Seo MS, Yu KR, Kang SK, Kang KS. SOX2 has a crucial role in the lineage determination and proliferation of mesenchymal stem cells through Dickkopf-1 and c-MYC. Cell Death Differ 2012; 19:534-5; PMID:22015605; http://dx.doi.org/10.1038/cdd.2011.137
- Yang F, Gao Y, Geng J, Qu D, Han Q, Qi J, Chen G. Elevated expression of SOX2 and FGFR1 in correlation with poor prognosis in patients with small cell lung cancer. Int J Clin Exp Pathol 2013; 6:2846-54; PMID:24294370.
- Zhang Z, Yang C, Gao W, Chen T1, Qian T, Hu J, Tan Y. FOXA2 attenuates the epithelial to mesenchymal transition by regulating the transcription of E-cadherin and ZEB2 in human breast cancer. Cancer Lett 2015; 361:240-50; PMID:25779673; http://dx.doi.org/10.1016/j.canlet.2015.03.008
- Fendrich V, Lauth M. The role of pancreatic and duodenal homeobox 1 as a therapeutic target in pancreatic cancer. Expert Opin Ther Targets 2014; 18:1277-83. http://dx.doi.org/10.1517/14728222.2014.945427
- Pedica F, Beccari S, Pedron S, Montagna L, Piccoli P, Doglioni C, Chilosi M. PDX-1 (pancreatic/duodenal homeobox-1 protein 1). Pathologica 2014; 106:315-21; PMID:25845046.
- Ischenko I, Petrenko O, Hayman MJ. Analysis of the tumor-initiating and metastatic capacity of PDX1-positive cells from the adult pancreas. Proc Natl Acad Sci USA 2014; 111:3466-71; PMID:24550494; http://dx.doi.org/10.1073/pnas.1319911111
- Johnson JD, Bernal-Mizrachi E, Alejandro EU, Han Z, Kalynyak TB, Li H, Beith JL, Gross J, Warnock GL, Townsend RR, et al. Insulin protects islets from apoptosis via Pdx1 and specific changes in the human islet proteome. Proc Natl Acad Sci USA 2006; 103(51):19575-80; PMID:17158802.
- Wu KL, Gannon M, Peshavaria M, Offield MF, Henderson E, Ray M, Marks A, Gamer LW, Wright CV, Stein R. Hepatocyte nuclear factor 3beta is involved in pancreatic beta-cell-specific transcription of the pdx-1 gene. Mol Cell Biol 1997; 17:6002-13; PMID:9315659.
- Teicher BA. Targets in small cell lung cancer. Biochem Pharmacol 2014; 87:211-9; PMID:24091017; http://dx.doi.org/10.1016/j.bcp.2013.09.014
- Pillai RN, Ramalingam SS. Inhibition of insulin-like growth factor receptor: end of a targeted therapy? Transl Lung Cancer Res 2013; 2:14-22; PMID:25806201; http://dx.doi.org/10.3978/j.issn.2218-6751.2012.11.05
- Vincent EE, Elder DJ, Curwen J, Kilgour E, Hers I, Tavaré JM. Targeting non-small cell lung cancer cells by dual inhibition of the insulin receptor and the insulin-like growth factor-1 receptor. PLoS One 2013; 8:e66963; PMID:23826179; http://dx.doi.org/10.1371/journal.pone.0066963
- Brahmkhatri VP, Prasanna C, Atreya HS. Insulin-like growth factor system in cancer: novel targeted therapies. Biomed Res Int 2015; 2015:538019; PMID:25866791; http://dx.doi.org/10.1155/2015/538019
- Russo VC, Azar WJ, Yau SW, Sabin MA, Werther GA. IGFBP-2: The dark horse in metabolism and cancer. Cytokine Growth Factor Rev 2015; 26:329-346; PMID:25544066; http://dx.doi.org/10.1016/j.cytogfr.2014.12.001
- Johnson MA, Firth SM. IGFBP-3: a cell fate pivot in cancer and disease. Growth Horm IGF Res2014; 24:164-173; PMID:24953254; http://dx.doi.org/10.1016/j.ghir.2014.04.007
- Polioudaki H, Agelaki S, Chiotaki R, Politaki E, Mavroudis D, Matikas A, Georgoulias, Theodoropoulos PA. Variable expression levels of keratin and vimentin reveal differential EMT status of circulating tumor cells and correlation with clinical characteristics and outcome of patients with metastatic breast cancer. BMC Cancer 2015; 15:399; PMID:25962645; http://dx.doi.org/10.1186/s12885-015-1386-7
- Krohn A, Ahrens T, Yalcin A, Plönes T, Wehrle J, Taromi S, Wollner S, Follo M, Brabletz T, Mani SA, Claus R, Hackanson B, Burger M. Tumor cell heterogeneity in Small Cell Lung Cancer (SCLC): phenotypical and functional differences associated with Epithelial-Mesenchymal Transition (EMT) and DNA methylation changes. PLoSOne 2014; 24;9:e100249; PMID:24959847; http://dx.doi.org/10.1371/journal.pone.0100249
- Chao Y, Wu Q, Shepard C, Wells A. Hepatocyte induced re-expression of E-cadherin in breast and prostate cancer cells increases chemoresistance. Clin Exp Metastasis 2012; 29:39-50; PMID:21964676; http://dx.doi.org/10.1007/s10585-011-9427-3
- Tsuji T, Ibaragi S, Shima K, Hu MG, Katsurano M, Sasaki A, Hu GF. Epithelial-mesenchymal transition induced by growth suppressor p12CDK2-AP1 promotes tumor cell local invasion but suppresses distant colony growth. Cancer Res 2008; 68:10377-86; PMID:19074907; http://dx.doi.org/10.1158/0008-5472.CAN-08-1444
- Weiswald LB, Bellet D, Dangles-Marie V. Spherical cancer models in tumor biology. Neoplasia 2015; 17:1-15; PMID:25622895; http://dx.doi.org/10.1016/j.neo.2014.12.004
- Hamilton G, Rath B, Holzer S, Hochmair M. Second-line therapy for small cell lung cancer: exploring the potential role of circulating tumor cell. Transl Lung Cancer Res 2016; 5:71-77; http://dx.doi.org/10.3978/j.issn.2218-6751.2015.12.12


