
ABSTRACT
Trophoblast invasion is one of the critical steps during embryo implantation. IFNG secreted during pregnancy by uterine NK cells acts as a negative regulator of invasion. IFNG in a dose dependent fashion inhibits invasion of HTR-8/SVneo trophoblastic cells. It phosphorylates STAT1 both at tyr 701 and ser 727 residues. Silencing of STAT1 significantly increases invasion (∼59%) of the cells. Based on NGS data, out of 207 genes, BATF2 expression was significantly increased after IFNG treatment. Silencing of BATF2 significantly increases the invasion of cells with (∼53%) or without (∼44%) treatment with IFNG. Expression of BATF2 and STAT1 is dependent on each other, silencing of one significantly inhibit the expression of other. Interestingly, phosphorylated JUN is also regulated by BATF2 and STAT1. Collectively, these findings showed that decrease in the invasion of HTR-8/SVneo cells after IFNG treatment is controlled by STAT1 and BATF2, which further regulates the expression of JUN.
Introduction
Successful embryo implantation involves intricate biological interactions between the competent embryo and the receptive endometrium. Once a physical contact between the blastocyst and the endometrium epithelium is established, the trophoblast cells breach the endometrial epithelia, to invade the decidua.Citation1 Aberration in the invasion of extravillous trophoblast cells (EVTs) lead to pregnancy associated complications such as preeclampsia (PE) or intrauterine growth restriction (IUGR) (due to shallow invasion) and placenta accreta (due to excessive invasion) etc.Citation2 -Citation4 Various cytokines and growth factors secreted at the fetal-maternal interface during implantation have either pro-invasive properties such as leukemia inhibitory factor (LIF),Citation5 interleukin 6 (IL6),Citation6 epidermal growth factor (EGF)Citation7 and hepatocyte growth factor (HGF),Citation8 or anti-invasive properties like kisspeptin-10,Citation9 interferon gamma (IFNG),Citation10 and transforming growth factor beta (TGFB).Citation11 The delicate balance of the pro- and anti-invasive cytokines and growth factors is critical for the proper invasion of EVTs.
IFNG is a pro-inflammatory cytokine, secreted by uterine natural killer (uNK) cells during early and late pregnancy.Citation12 It is also secreted by 1st trimester trophoblast cells in small quantities and their receptor IFNGR1 and IFNGR2 are present on the trophoblast cells. The maximum numbers of uNK cells have been reported during early pregnancy (20 weeks), which correlates with trophoblast invasion and spiral arteries remodeling and subsequently, the number of uNK cells decreases toward term pregnancy.Citation12,Citation13 Using mouse model, the importance of IFNG during early pregnancy was demonstrated, which showed its indispensable role in the invasion of trophoblast cellsCitation14 and the spiral arteries remodeling.Citation15 Lash et al (2006) demonstrated that addition of IFNG decreases invasion of trophoblast cells by increasing apoptosis and lowering matrix metalloproteinase2 (MMP2) secretion.Citation10 In choriocarcinoma cell line (JEG-3), the anti-invasive effect of IL-12 is mediated through IFNG, which primarily leads to decrease in the level of MMP2, MMP9, and plasminogen activator urokinase (PLAU) and increase the levels of E-cadherin.Citation16 Additionally, IFNG secreted from human first trimester decidual NK cells, reverse the effect of tumor necrosis factor-alpha (TNF-α) and estradiol by lowering the level of MMP1, MMP2, MMP3 and MMP9, and hence protect decidual cells from excessive EVTs invasion and PE.Citation17
IFNG regulates the expression of different genes by activating Janus kinase/signal transducers and activators of transcription (JAK/STAT) pathway. The study performed in STAT1 deficient fibrosarcoma bone cancer cells (U3A cell line) showed that phosphorylation of STAT1 both at tyrosine 701 and serine 727 residues is necessary for full transcriptional activity. Further, phosphorylated STAT1 forms homodimer, leading to entry into the nucleus where it binds to gamma activated sequence (GAS) on the promoter of downstream target genes.Citation18,Citation19 Treatment of trophoblast derived choriocarcinoma cell lines such as JEG-3 and JAR with tyrosine phosphatase inhibitor, pervanadate (PV), lead to enhanced JAK2 and STAT1 phosphorylation and expression of IFNG-inducible genes.Citation20 This suggests that JAK/STAT pathway is important for IFNG inducible gene expression. However, the relevance of STAT1 in IFNG-mediated decrease in invasion of trophoblast cells is not known.
Treatment of vascular smooth muscle cells (VSMCs) with IFNG leads to STAT1 dependent activation of Basic Leucine Zipper ATF-Like Transcription Factor 2 (BATF2).Citation21 BATF2 also known as SARI [suppressor of Activating Protein-1 (AP-1) regulated by IFNG] is a tumor suppressor gene known to inhibit proliferation, invasion and migration of tumor cells.Citation22 Further, BATF2 promotes apoptosis and inhibits invasion and migration of human colorectal cancer cells by inhibiting HGF/MET signaling.Citation22 Similarly, SARI (BATF2) inhibits cysteine-rich angiogenic protein 61 (CCN1) transcription and thus inhibits anchorage-dependent growth and invasion of breast cancer, malignant glioma and metastatic melanoma cells.Citation23 In addition, loss of SARI promotes epithelial-mesenchymal transition by decreasing the levels of E-cadherin and increasing the levels of vimentin in lung adenocarcinoma cells.Citation24 BATF2 has been extensively studied in the different forms of cancer,Citation22-Citation24 but its function in trophoblast cells is not known.
Increase in the invasion of human EVTs and HTR-8/SVneo cells by gonadotropin-releasing hormone (GnRH) is dependent on expression and phosphorylation of AP-1 transcription factor JUN and FOS which in turn upregulates the expression of cadherin-11.Citation25 Further, JUN dependent signaling pathway is important for expression of IFNG response genes.Citation26 BATF2 has been shown to bind JUN and thereby represses AP-1 transcription factor induced genes.Citation27 So it would be interesting to know the role of JUN in the regulation of trophoblast invasion under the influence of IFNG.
Keeping in view of the above, the studies described in the present manuscript have focused to delineate the relevance of STAT1 activation, effector molecules such as BATF2 and JUN during IFNG-mediated decrease in invasion of HTR-8/SVneo cells. Further, if cross-talk between STAT1 and BATF2, regulates the expression of JUN? To address this, HTR-8/SVneo, a transformed cell line derived from human first-trimester placental explants cultures and immortalized by Simian virus 40 (SV40) large T antigens has been used.Citation28
Results
Treatment of HTR-8/SVneo cells with IFNG decreases their invasion
Treatment of HTR-8/SVneo cells with varying concentrations of IFNG resulted in significant decrease in the invasion of the cells at 10 (∼ 0.44 fold; p = 0.01) and 50 (∼ 0.46 fold; p = 0.004) ng/mL as compared to untreated cells (). Since there was no further decrease in the invasion at 50 ng/mL subsequently, IFNG was used at 10 ng/mL concentration. To rule out the possibility that the observed decrease in the number of invading cells is not due to decreased cell viability or proliferation, cell viability by SYTOX staining and proliferation by BrdU incorporation assay were performed. There was no significant decrease in the number of viable cells treated with IFNG (10 ng/mL) as compared to untreated control (Supplementary Fig. 1). Further, no significant changes in their proliferation rates were observed after treatment with IFNG (Supplementary Fig. 2).
Figure 1. Effect of IFNG on the invasion of HTR-8/SVneo cells. The effect of varying concentrations (0, 1, 10, 50 ng/mL) of IFNG on the invasion of HTR-8/SVneo cells was determined by Matrigel matrix invasion assay as described in Materials and Methods. Panel A shows the fold change in invasion after treatment with IFNG for 24 h as compared to untreated HTR-8/SVneo cells. The results are shown as mean ± S.E.M. of three independent experiments. Panel B shows representative images of invaded HTR-8/SVneo cells with and without treatment of IFNG (10 ng/mL) for 24 h. p ≤ 0.05 was considered statistically significant.
Treatment of HTR-8/SVneo cells with IFNG leads to activation of STAT1
HTR-8/SVneo cells (0.1 × 10⁶) were treated with the optimized concentration of IFNG (10 ng/mL) for different time points (0, 10, 30 and 60 min) and cell lysates were used to study the expression profile of phosphorylated forms of STAT1 by Western blot. Treatment with IFNG led to a significant increase in the p-STAT1 (tyr701), normalized with total STAT1, at all the time points studied as compared to 0 min (, ). In addition, a significant (p = 0.03) increase in p-STAT1 (ser727), normalized with total STAT1, at 60 min as compared to 0 min was also observed (, ). There were no significant changes in the expression of total STAT1 when normalized with GAPDH as the loading control (, ).
Figure 2. Effect of IFNG on phosphorylation of STAT1 in HTR-8/SVneo cells. HTR-8/SVneo cells (0.1 × 10⁶) were treated with IFNG (10 ng/mL) for 0, 10, 30, 60 min. After treatment, cell lysates were prepared and proteins resolved by 0.1% SDS-10% PAGE and processed for analysis of phosphorylated forms of STAT1 and total STAT1 by Western blot as described in Materials and Methods. Panels A and B show the densitometric plots of p-STAT1 (tyr701) and p-STAT1 (ser727) normalized with respect to total STAT1. Panel C shows total STAT1 normalized with GAPDH. Representative blots of p-STAT1 (tyr701), p-STAT1 (ser727), total STAT1 and GAPDH are appended as Panel D. The data is expressed as fold change with respect to 0 h control and values are shown mean ± S.E.M. of at least three independent experiments.
Silencing of STAT1 abrogates the IFNG-mediated decrease in invasion of HTR-8/SVneo cells
To understand the importance of JAK-STAT1 signaling pathway in IFNG-mediated decrease in the invasion, HTR-8/SVneo cells were silenced with STAT1 siRNA by transient transfection. Silencing of STAT1, both at the transcript and the protein levels were confirmed by qRT-PCR and Western blot, respectively. At transcript level, there was ∼74% decrease in total STAT1 expression in STAT1 siRNA transfected cells treated with IFNG as compared to control siRNA transfected cells treated with IFNG (p = 0.02) (). Further, a significant decrease in the expression of total STAT1 at the protein level in STAT1 siRNA transfected cells as compared to control siRNA transfected cells was observed after treatment with IFNG (). There was a significant increase (∼1.45 fold; p = 0.01) in the invasion of STAT1 silenced cells as compared to control siRNA transfected cells without IFNG treatment (). Further, a significant (p = 0.001) increase in the invasion of STAT1 siRNA transfected cells treated with IFNG was also observed as compared to control siRNA transfected cells treated with IFNG. Interestingly, a significant (p = 0.01) increase in invasion of STAT1 siRNA transfected HTR-8/SVneo cells was observed after treatment with IFNG as compared to untreated control siRNA transfected cells ().
Figure 3. Role of STAT1 in IFNG-mediated decrease in invasion of HTR-8/SVneo cells. To study the importance of STAT1 in the invasion of HTR-8/SVneo cells after treatment with IFNG, silencing of STAT1 was done using siRNA as described in Materials and Methods. Silencing of STAT1 was confirmed by qRT-PCR and Western blotting. Panels A and B show expression profile of STAT1 at the transcript and protein levels in control siRNA and STAT1 silenced cells, respectively, on treatment with and without IFNG (10 ng/mL) for 24 h. Each bar represents relative expression after normalization with 18S rRNA and GAPDH and values expressed as mean ± S.E.M. of three independent experiments. Representative blots showing expression profile of STAT1 siRNA transfected cells is appended as part of Panel B. Panel C shows fold change in the invasion of control siRNA and STAT1 siRNA transfected cells on treatment with and without IFNG for 24 h. The results are expressed as mean ± S.E.M. of fold change in the invasion with respect to control siRNA transfected cells without IFNG (10 ng/mL) treatment, observed in three independent experiments.
BATF2 may be involved in IFNG-mediated decrease in the invasion of HTR-8/SVneo cells
To decipher the role of effector proteins that may be involved in IFNG-mediated decrease in the invasion of HTR-8/SVneo cells, mRNA expression profile by Next-generation Sequencing (NGS) of HTR-8/SVneo cells treated with IFNG (10 ng/mL) for 24 h was performed. Out of 207 genes that were upregulated (Supp ), BATF2 was selected as it is known to decrease invasion and migration of cancer cells.Citation22-Citation24 However; its role in the invasion of trophoblastic cells is not known. Interestingly, HTR-8/SVneo cells treated for 24 h with IFNG (10 ng/mL) showed ∼35 fold increase in the transcript encoding BATF2 by qRT-PCR as compared to untreated control (). Further, significant (p = 0.001) increase in the expression of BATF2 at protein level was also observed (). To check the relevance of BATF2 in IFNG-mediated decrease in the invasion, HTR-8/SVneo cells were transfected with BATF2 siRNA and control siRNA. Significant reduction (62%, p = 0.05) in BATF2 transcript normalized with 18S rRNA loading control, was observed in BATF2 siRNA transfected cells as compared to control siRNA transfected cells on treatment with IFNG (). In addition, significant reduction (76%, p = 0.00003) in BATF2 expression at protein level was also observed in BATF2 siRNA transfected cells as compared to control siRNA transfected cells on treatment with IFNG (). Further, BATF2 silenced HTR-8/SVneo cells were used for invasion assay. A significant increase in the number of invading cells was observed in BATF2 siRNA transfected cells as compared to control siRNA transfected cells (∼1.56 fold; p = 0.04) without IFNG treatment. Additionally, invasion of BATF2 siRNA transfected cells after treatment with IFNG also showed a significant increase (p = 0.0001) as compared to IFNG treated control siRNA transfected cells (). These observations suggest the importance of BATF2 in IFNG-mediated decrease in the invasion of HTR-8/SVneo cells.
Figure 4. Expression profile of BATF2 in HTR-8/SVneo cells treated with IFNG. HTR-8/SVneo cells (0.1 × 10⁶) were treated with and without IFNG (10 ng/mL) for 24 h. Subsequently, RNA and cell lysates were prepared to determine BATF2 expression by qRT-PCR and Western blotting as described in Materials and Methods. Panel A shows the level of transcript encoding BATF2 using 18S rRNA as normalizing control. Panel B shows the expression profile of BATF2 at the protein level using GAPDH as a loading control in HTR-8/SVneo cells with and without treatment with IFNG. Values are expressed as mean ± S.E.M. of three independent experiments. Representative blots for BATF2 in untreated and treated HTR-8/SVneo cells with IFNG (10 ng/mL) for 24 h is also appended as part of panel B. p ≤ 0.05 was considered statistically significant as compared to untreated control.
Figure 5. Effect of BATF2 silencing on the invasion of HTR-8/SVneo cells treated with IFNG. HTR-8/SVneo cells (0.1 × 10⁶) were transfected with control siRNA and BATF2 siRNA and subsequently used to study their invasion by transwell invasion assay as described in Materials and Methods. Silencing of BATF2 was confirmed by qRT-PCR and Western blotting. Panels A and B show transcript and protein levels of BATF2 in control siRNA and BATF2 silenced cells, respectively, on treatment with and without IFNG (10 ng/mL). Each bar represents relative expression after normalization with 18S rRNA or GAPDH, expressed as mean ± S.E.M. of three independent experiments. Panel C shows the fold change in the invasion of cells transfected with control or BATF2 siRNA respectively, subsequent to treatment with and without IFNG for 24 h. The results are expressed as mean ± S.E.M. of fold change in invasion, as compared to control siRNA transfected cells without treatment with IFNG, observed in three independent experiments.
Cross-communication between STAT1 and BATF2 in HTR-8/SVneo cells treated with IFNG
To understand the effect of BATF2 silencing on STAT1 signaling and vice versa, expression of STAT1, both at the transcript and the protein levels, was analyzed in BATF2 silenced HTR-8/SVneo cells with and without treatment of IFNG (10 ng/mL) after 24 h. Expression levels of STAT1 at transcript level (p = 0.0001) and protein level (p = 0.0001) were significantly increased on treatment with IFNG in control siRNA transfected cells (, ). The levels of transcript encoding STAT1 was significantly (p = 0.006) lower in BATF2 silenced cells as compared to control siRNA transfected cells on treatment with IFNG (). Further, lower level of STAT1 transcript was also observed in IFNG untreated BATF2 silenced cells as compared to IFNG untreated control siRNA transfected cells. Similar expression profile of STAT1 at protein level was also observed in BATF2 silenced cells (). Further, silencing of STAT1 by siRNA, also led to a significant reduction in the levels of BATF2 both at the transcript as well as at the protein levels as compared to control siRNA transfected cells on treatment with IFNG (10 ng/mL) (, ).
Figure 6. Effect of BATF2 silencing on the expression of STAT1 in HTR-8/SVneo cells treated with IFNG. HTR-8/SVneo cells (0.1 × 10⁶) were transfected with control siRNA and BATF2 siRNA and subsequently used to study the expression of total STAT1 in the presence or absence of treatment with IFNG (10 ng/mL) by qRT-PCR and Western blotting as described in Materials and Methods. Panels A and B show the transcript and the protein levels of STAT1 in control siRNA and BATF2 siRNA transfected HTR-8/SVneo cells, with and without IFNG treatment respectively. Each bar represents relative expression after normalization with 18S rRNA at transcript level and GAPDH at the protein level. Results are expressed as mean ± S.E.M. of three independent experiments. Representative blots of STAT1 expression in BATF2 silenced cells is appended in Panel B.
Figure 7. Expression of BATF2 in STAT1 silenced HTR-8/SVneo cells treated with IFNG. HTR-8/SVneo cells (0.1 × 10⁶) were transfected with control siRNA and STAT1 siRNA followed by treatment with or without IFNG (10 ng/mL) for 24 h and subsequently used to analyze expression of BATF2 both at the transcript and protein levels by qRT-PCR and Western blotting. Panel A shows the transcript level of BATF2 in control siRNA and STAT1 siRNA transfected cells with and without IFNG treatment. Panel B represents the densitometric analysis and representative blots of BATF2 expression in control siRNA and STAT1 siRNA transfected cells with and without IFNG treatment. Each bar represents relative expression after normalization with 18S rRNA at the transcript level and GAPDH at the protein level. Values are expressed as mean ± S.E.M. of three independent experiments.
Silencing of BATF2 and STAT1 in HTR-8/SVneo cells upregulates phosphorylation of JUN
It has been known that BATF2 inhibits binding of JUN (a member of AP-1 transcription factor), to the AP-1 promoter region, which further regulates AP-1 dependent gene expression.Citation27 Thus it is interesting, to explore the regulation of JUN by BATF2 in IFNG-mediated decrease in trophoblast invasion. In this direction, we have checked the expression levels of JUN by Western blotting in BATF2 silenced HTR-8/SVneo cells. Expression of phosphorylated JUN (ser 63) [p-JUN (ser 63)] and phosphorylated p-JUN (ser 73) [p-JUN (ser 73)] in control siRNA transfected HTR-8/SVneo cells was significantly reduced after treatment with IFNG as compared to untreated cells (, , ). Expression of p-JUN (ser 63) and p-JUN (ser 73) were significantly increased in BATF2 siRNA transfected HTR-8/SVneo cells as compared to control siRNA transfected HTR-8/SVneo cells with and without IFNG treatment (, , ). However, there was no significant change in the expression of total JUN in BATF2 silenced HTR-8/SVneo cells as compared to control siRNA transfected cells both in IFNG treated and untreated cells (, ). In mouse embryonic fibroblasts cells, JUN is also activated by IFNG, by MAPK pathway.Citation26 So it is interesting to find also the link between STAT1 and JUN in trophoblast cells after IFNG treatment. Here, we have checked the expression of p-JUN (ser 63) and p-JUN (ser 73) in STAT1 silenced HTR-8/SVneo cells. The expression of p-JUN (ser 63) and p-JUN (ser 73) was significantly reduced in control siRNA transfected cells on treatment with IFNG and increased in STAT1 silenced HTR-8/SVneo cells as compared to control siRNA transfected HTR-8/SVneo cells with and without IFNG treatment (, , ). Similarly, there was no change in the expression of total JUN in the STAT1 silenced HTR-8/SVneo cells as compared to control siRNA transfected cells with and without IFNG treatment (, ).
Figure 8. Expression of JUN in BATF2 silenced HTR-8/SVneo cells treated with IFNG. HTR-8/SVneo cells (0.1 × 10⁶) were transfected with control siRNA and BATF2 siRNA and subsequently used to study the expression of phosphorylated JUN ser 63 and JUN ser 73 in the presence or absence of IFNG (10 ng/mL) by Western blotting as described in Materials and Methods. Panel A, B and C show protein expression of p-JUN ser 63, p-JUN ser 73 and total JUN in control siRNA transfected and BATF2 silenced cells, respectively, on treatment with and without IFNG. Each bar represents relative expression after normalization with GAPDH with respect to untreated control siRNA transfected cells. Values are expressed as mean ± S.E.M. of three independent experiments. Panel D shows the representative blots of p-JUN ser 63, p-JUN ser 73, total JUN and GAPDH from one of the three experiments.
Figure 9. Expression of JUN in STAT1 silenced HTR-8/SVneo cells treated with IFNG. HTR-8/SVneo cells (0.1 × 10⁶) were transfected with control siRNA and STAT1 siRNA and subsequently used to study the expression of phosphorylated JUN ser 63 and JUN ser 73 in the presence or absence of IFNG (10 ng/mL) by Western blotting. Panels A, B and C show protein expression of p-JUN ser 63, p-JUN ser 73, and total JUN in control siRNA transfected and STAT1 silenced cells, respectively, on treatment with or without IFNG. Each bar represents relative expression after normalization with total JUN and GAPDH respectively with respect to untreated control siRNA transfected cells. Values are expressed as mean ± S.E.M. of three independent experiments. Panel D shows the representative blots of p-JUN ser 63, p-JUN ser 73, total JUN and GAPDH from one of the three experiments.
Discussion
Trophoblast invasion is a highly regulated process, excessive invasion occur during placenta accreta (associated with lack of decidua)Citation4 and insufficient invasion being well recognized in PE, IUGR etc.Citation2-Citation3 In our study, we have used HTR-8/SVneo as a model to study invasion of trophoblast cells after IFNG treatment. This cell line has been used by various groups to study trophoblast invasion as it closely resembles the physiological phenotype of isolated first trimester EVT cells.Citation7,Citation29-Citation32 HTR-8/SVneo cells expresses several markers such as cytokeratin −7, −8 and −18, secretion of human chorionic gonadotropin (hCG) hormone, hCG receptor, cluster of differentiation 9 (CD9), and 72 kDa type IV collagenases, which are representative of EVT.Citation28,Citation33 In addition, HTR-8/SVneo cells also expresses Caudal Type Homeobox 2 (CDX2) as a trophoblast stem/progenitor cell transcription factor, which is also present on trophoblast cells.Citation34 HTR-8/SVneo cells when grown on matrigel, stimulated the expression of HLA-G, thus showing its resemblance with EVT.Citation33,Citation35 In contrast to the above, these cells do not express C19MC cluster of miRNACitation36 and also shows hypermethyaltion of ELF5 promoter which is contrary to EVT.Citation37 Instead of C19MC cluster, HTR-8/SVneo cells express C14MC cluster of miRNA, which is highly expressed in primary first and third trimester trophoblast cells.Citation36 In view of the above, it may be stated that invasion studies performed using HTR-8/SVneo cells as described in the present study may not truly represent the findings with respect to EVT.
In the present study, treatment of HTR-8/SVneo cells with IFNG decreases invasion of HTR-8/SVneo cells, which is not due to decrease in the cell viability or proliferation (, Supp Fig. 1, Supp Fig. 2). Similar results have been published using human EVTs cells after IFNG treatment.Citation10 IFNG is one of the key cytokine that promotes innate and adaptive immune responses at fetal-maternal interface.Citation38,Citation39 Secretion of IFNG during early pregnancy suggests its active role in the implantation process. Interestingly, as the pregnancy proceeds from 2nd to 3rd trimester, the level of IFNG decreases in order to regulate number of interstitial cytotrophoblast cells and uterine invasion.Citation40 Moreover, mice with genetic deficiency of IFNG or IFNG receptor (IFNGR) show decreased cell outgrowth and increased trophoblast cell invasion.Citation14 Consistently high levels of IFNG have also been reported in cases of PE and miscarriages.Citation12 These studies emphasize that IFNG is required for different processes during implantation and the concentration above or below the threshold is detrimental for the pregnancy.
Studies show that JAK-STAT pathway is activated by addition of interferons, which have the role in the regulation of different cellular process like activating innate and adaptive immune responses, inhibition of cell proliferation and promotion of apoptosis.Citation41,Citation42 It has been already reported that IFNG is primarily involved in phosphorylation of STAT1 at tyrosine 701 and serine 727, leading to its activation.Citation43 The phosphorylation at tyrosine 701 is required for dimerization of STAT1 and gives 20% transcriptional efficiency; however, phosphorylation at serine 727 is necessary for its full activation.Citation19,Citation43,Citation44 STAT1 is also activated by different cytokines and growth factors like IL-11,Citation45 EGF,Citation7 LIF,Citation46 IL6Citation47 etc which play role in trophoblast invasion. One of the recently published study from our lab showed that STAT1 is phosphorylated at ser 727 after EGF treatment and silencing of STAT1 abrogates the effect of EGF and thus inhibit invasion of HTR-8/SVneo cells.Citation7 Subsequently, the addition of oncostatin M (OSM, a member of the IL6 family) in HTR-8/SVneo cells activates STAT1 and increases invasiveness of HTR-8/SVneo cells.Citation48 Further, inhibition of STAT1 by fludarabine treatment and siRNA transfection decreases cell viability and invasiveness of HTR-8/SVneo cells after OSM treatment.Citation48 However, different protein like Eph receptor B4 (EPHB4) subsequent to treatment with IFNG was found to be upregulated and known to play a role in the endothelial activation of HUVEC cells by activating JAK-STAT1 pathway.Citation49 Here, we have shown that addition of IFNG to HTR-8/SVneo cells activates JAK-STAT pathway in which STAT1 was phosphorylated at serine 727 and tyrosine 701 residues (, ). Further, the importance of STAT1 in the regulation of trophoblast invasion after IFNG treatment was validated by siRNA silencing (, ). After STAT1 silencing there was significant (p = 0.01) basal increase in the invasion of STAT1 siRNA transfected HTR-8/SVneo cells as compared to control siRNA transfected cells. Moreover, there was ∼59% increase in the invasion of STAT1 siRNA transfected HTR-8/SVneo cells as compared to control siRNA transfected cells treated with IFNG (, ). These observations showed the relevance of STAT1 in IFNG-mediated decrease in invasion of trophoblast cells. The increase in the invasion of STAT1 silenced cells with/without IFNG treatment suggests that STAT1 may be involved in up-regulating those proteins which decrease the process of invasion. This indicates that activation of STAT1 is regulated by different cytokines or growth factors, which further activate downstream target genes to control the same biological process that is trophoblast invasion, which is either increased or decreased depending upon the ligand used.
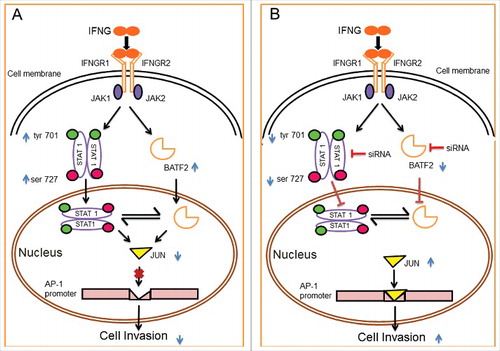
Figure 10. Schematic representation of the role of IFNG in regulation of HTR-8/SVneo cells invasion. Binding of IFNG to its receptors IFNGR1 and IFNGR2 lead to the phosphorylation of STAT1 both at tyr 701 and ser 727 residues followed by STAT1 homodimer, which enter into the nucleus. Treatment of HTR-8/SVneo cells with IFNG also leads to an increase in the expression of BATF2 both at the transcript as well as protein levels. Panel A depicts role of STAT1 and BATF2 in IFNG-mediated decrease in invasion of HTR-8/SVneo cells by regulating expression of JUN and also regulate each-other's expression. Panel B represents the increase in invasion of HTR-8/SVneo cells subsequent to IFNG treatment after silencing of both STAT1 and BATF2, respectively. The increase in invasion, subsequent to silencing of STAT1 and BATF2 may be due to the upregulation in the expression of JUN, which in turn promotes AP-1 transcription factor by binding to its promoter site thereby increases invasion of HTR-8/SVneo cells.
Based on NGS data, out of 207 differentially expressed genes (Supp ), BATF2 was chosen for further study as it is known to be involved in diverse biological processes like invasion, migration, proliferation in the different types of cancers by regulating various signaling pathways (HGF/c-met, Protein kinase B; AKT) and effector proteins (MMPs, E-cadherin, CCN1 etc).Citation22-Citation24 Additionally, BATF2 inhibit MAP kinase and AKT kinase in malignant glioma, breast cancer and metastatic melanoma which further reduces invasion and anchorage-dependent growth induced by CCN1.Citation23 BATF2 also inhibit binding of JUN to AP-1 promoter sequence.Citation27 In this study, treatment of HTR-8/SVneo cells with IFNG led to significant increase in BATF2 expression (, ). The role of BATF2 in the regulation of trophoblast invasion is not known. So we made an attempt to understand the eminent role of BATF2 in IFNG-mediated decrease in invasion of trophoblast cells. In this direction, we have silenced BATF2 with siRNA and checked its role in the invasion of HTR-8/SVneo cells with or without IFNG treatment. Silencing of BATF2 significantly increased invasion of HTR-8/SVneo cells by ∼53% as compared to control siRNA transfected cells subsequent to treatment with IFNG (), suggesting thereby the role of BATF2 in regulating expression of proteins that are further involved in invasion (). Previous studies have shown that BATF2 is a STAT1 dependent gene, induced by IFNG in VSMC cells and function as an antiviral gene.Citation21 However, based on our findings; we can say that BATF2 may have a role in the invasion of trophoblast cells (). To further understand the relationship between STAT1 and BATF2 activation after IFNG treatment and their role in the invasion, expression of STAT1 in BATF2 silenced HTR-8/SVneo cells with or without IFNG treatment and vice-versa were studied. These investigations revealed that silencing of BATF2 in HTR-8/SVneo cells by siRNA significantly decreases the expression of STAT1 and silencing of STAT1 decreases the expression of BATF2. These observations suggest that there may be a feedback loop by which STAT1 and BATF2 both regulate each other's expression in HTR-8/SVneo cells. However, the molecular mechanisms by which both regulate each other's expression need to be delineated.
BATF2 also regulates expression of the AP-1 transcription factor, by binding to its subunit JUN, known as inhibitor of AP-1.Citation27 AP-1 subunit, JUN, plays a paramount role in controlling different processes as it can either form a homodimer or heterodimer with FOS, the complex then bind to the AP-1 transcription site and regulate expression of different invasion-related genes.Citation50-Citation52 Treatment with IL-11 results in the increase of invasion of JEG-3 cells, whereas it inhibits invasion of HTR-8/SVneo cells.Citation45 The increase in invasion of JEG-3 cells by IL-11 is due to an increase in the expression of JUN and FOS, whereas inhibition of invasion in case of HTR-8/SVneo cells treated with IL-11 is due to down-regulation of FOS expression.Citation45 In our study, upregulation of the expression of BATF2 after IFNG treatment suggest that activation of JUN may also play a role in the invasion of HTR-8/SVneo cells. After silencing of BATF2, an increase in expression of p-JUN (ser 73) and p-JUN (ser 63) was observed in HTR-8/SVneo cells as compared to control siRNA transfected cells in presence or absence of IFNG (, ). Recently, study performed in innate immune cells (macrophages and dendritic cells) of Trypanosoma cruzi infected BATF2 −/− knockout mice show effect of IFNG induced BATF2 in reducing Th-17 response due to inhibition of the formation of JUN-ATF2 complex.Citation53 Our data showed that the expression of p-JUN (ser 63) and p-JUN (ser73) also increases significantly in STAT1 silenced HTR-8/SVneo cells with/without IFNG treatment (, ). Further, mouse embryonic fibroblasts cells treated with IFNG showed activation of JUN which was dependent on activation of MAPK pathway rather than activation of STAT1.Citation26 However, in HTR-8/SVneo cells, silencing of STAT1 led to significant increase in the expression of p-JUN (ser 63 and ser 73). It may be prudent to further investigate as to how IFNG leads to inhibition of p-JUN (ser 63 and ser 73) by using different signaling pathways which also depends on the cell type.
Conclusion
To conclude, IFNG decreases invasion of HTR-8/SVneo cells by activation of STAT1 both at ser 727 and tyr 701 residues and an increase in the expression of BATF2, which in turn inhibit JUN. STAT1 and BATF2 may be acting independently or dependent on each other to downregulate the invasion of HTR-8/SVneo cells by regulating the expression of JUN. As the studies presented herein are limited with respect to the invasion of HTR-8/SVneo trophoblast cells, it is imperative to perform key experiments in primary EVT cells or primary tissue sections to support the role of IFNG during trophoblast invasion.
Materials and methods
Cell culture
HTR-8/SVneo cells (kindly provided by Prof. P. K. Lala, Queen's University, Kingston, ON, Canada) were cultured in 1:1 ratio of Dulbecco's modified Eagle medium (DMEM, Sigma-Aldrich Inc., #D1152-10L) and Ham's F-12 medium (Sigma-Aldrich Inc., #N3520-10L) supplemented with 10% heat-inactivated fetal bovine serum (FBS; Gibco®, #10270) along with antibiotic-antimycotic cocktail containing penicillin (100 units/mL), streptomycin (100 µg/mL) and amphotericin B (0.25 µg/mL) (MP Biomedicals, #1674049) at 37°C under humidified atmosphere containing 5% CO2. The cells were treated with Geneticin sulfate (G418) (Himedia, #TC025) at 75 μg/mL after every 3rd passage to avoid the growth of untransfected HTR-8/SVneo cells with SV40 large T antigen.Citation28
Invasion assay
The invasion assay using HTR-8/SVneo cells was performed as described previously.Citation45 Briefly, growth factor reduced matrigel matrix (1 μg/mL; BD Biosciences, #356230) was added to the upper chamber of 8 µm filter pore size transwell insert (Greiner Bio, #662638). Transwell inserts were kept in 24-well cell culture plates and incubated overnight at 37°C under humidified atmosphere. Next day, 1: 1 ratio of DMEM and Ham's F12 medium (300 µL/well) supplemented with 1% FBS in presence or absence of optimized concentration of IFNG (10 ng/mL; Peprotech, #30002) was added to the lower chamber containing transwell inserts. HTR-8/SVneo cells (0.1 × 10⁶ cells/150 µL) suspended in the same medium were seeded in the upper chamber of the transwell insert with and without IFNG. After 24 h of incubation, the excess of cells, medium and matrigel from the upper chamber was aspirated and cleaned with a moist cotton swab. The cells on the lower side of the membrane were fixed in chilled methanol for 10 min at 4°C. After subsequent washing with 50 mM PBS pH 7.4, the membrane was stained with 0.2 μM Hoechst 33342 nuclear dye (Thermo Fisher, #H3570) for 10 min at 37°C and cells on the lower surface of the membrane were mounted with immersion oil and were counted under fluorescent phase contrast microscope (Nikon Instruments Inc., Melville, NY, USA). The fold change in invasion was calculated by dividing the number of cells in the treatment group by the number of cells in the untreated control group.
Cell viability assay
HTR-8/SVneo cells (0.1 × 10⁶/well) were cultured overnight in 6-well culture plates followed by serum starvation for 4 h. Subsequently, cells were treated with and without IFNG (10 ng/mL) for 24 h. These cells were trypsinized and re-suspended in physiological saline (0.9%) with working concentration of 5 μM SYTOX red (Thermo Fisher Scientific, #S34859). Percentage of total stained cells (dead cells) were determined by flow cytometry Facs Verse (BD Bioscience, San Jose, California, USA), which counted stained cells based on SYTOX Red incorporation at 633 or 635 nm excitation.
Cell proliferation assay
Cell proliferation was assessed by 5-bromo-2′-deoxy-uridine (BrdU) incorporation using BrdU cell proliferation Assay Kit (Millipore, #2750) as per manufacturer's instructions. HTR-8/SVneo cells (2 × 10⁵/well) were cultured in 96-well cell culture plates for 24 h and further treated with and without IFNG (10 ng/mL) in presence of 20 μL BrdU labeling solution for 24 h in serum free medium. After 24 h, cells were fixed with the fixing solution and incubated with mouse monoclonal BrdU-detection antibody for 1 h at room temperature (RT) followed by washing with wash buffer (buffered Tris with 0.1% Tween) provided in the kit. Further, cells were incubated with horse radish peroxidase (HRP) conjugated goat anti-mouse IgG (1: 2000) for 30 min at RT followed by three times washing. After washing, cells were incubated with TMB (3, 3′, 5, 5′-Tetramethylbenzidine) peroxidase substrate solution for 30 min in dark. After 30 min, stop solution (2.5 N sulfuric acid) was added to each well and absorbance was determined at 450/550 nm using a microplate reader (Biotek instruments, Winooski, Vermont, USA).
Gene silencing by siRNA
HTR-8/SVneo cells (0.1 × 10⁶/well) were seeded in 6-well cell culture plates in 1:1 ratio of DMEM with Ham's F-12 medium supplemented with 10% FBS. Next day, cells were transfected with optimized concentration of a smart pool of three different siRNAs corresponding to control siRNA (40 pmole), siRNA for STAT1 (40 pmole) and BATF2 (30 pmole) (Santa Cruz Biotechnology Inc., sc-37007, sc-44123 and sc-97016 respectively), using lipofectamine2000 (LifeTechnologies, #11668-019) and Opti-MEM® medium (Gibco®, #31985070). Cells were washed once and 800 µL of fresh Opti-MEM® medium was added to each well. STAT1, BATF2 and control siRNA were mixed with Opti-MEM® medium to make a total volume of 185 µL. In a separate tube, 5 µL of lipofectamine2000 was mixed with 10 µL Opti-MEM® medium and incubated for 5 min at RT. Further, both the solutions were mixed and incubated for 20 min at RT. The mixture was added carefully, drop by drop, in respective wells and after 6 h of incubation at 37°C under the humidified condition of 5% CO2, complete medium was added to the cells. After 48 h of transfection, cells were used for invasion assay, Western blotting and qRT-PCR.
Quantitative reverse transcription-polymerase chain reaction (qRT-PCR)
HTR-8/SVneo cells (0.1 × 10⁶/well), silenced for STAT1 and BATF2 were cultured in 6-well cell culture plates for 24 h and starved for at least 4 h before treatment with IFNG (10 ng/mL) for 24 h in serum free medium and used to study relative genes expression levels. Total RNA was isolated using Ribo-Zol™ reagent (Amresco, #N580) according to manufacturer's protocol. Isolated RNA was analyzed by NanoDrop 3300 spectrophotometer (Thermo Scientific, NanoDrop Products, Wilmington, DE, USA) and was treated with DNase1 (Fermentas International Inc., #EN0525) at 37°C for 30 min as per manufacturer's instructions, followed by heat inactivation at 65°C for 5 min. The isolated RNA (5 µg) was used to prepare complementary DNA (cDNA) using Oligo (dT)18 primer (Fermentas International Inc., #SO132), random hexamer primer (Fermentas International Inc., #SO142), dNTP mix (Fermentas International Inc., #18427088), RiboLock RNase Inhibitor (Fermentas International Inc., #EO0381) and Maxima reverse transcriptase enzyme (Fermentas International Inc., #EP0742) according to manufacturer's instructions. Further, qRT-PCR reactions for STAT1 (Forward primer: 5′GCACACAGTGCTTTCCGTG 3′, Reverse primer:5′ACTGACAGCTAAACCTCAGCA 3′) and BATF2 (Forward primer: 5′CTAAGCCATGCACCTCTGTG 3′, Reverse primer: 5′GGGCGAGGTTGTCTTTTTCC 3′) transcripts were carried out in duplicates in 20 µL reaction mixture containing Maxima™ SYBR green master mix (2X; Takara Bio Inc., #RR820A), synthesized cDNA (diluted 10 times) and gene-specific primers (0.1 µM, Sigma Aldrich Inc.) in Stratagene Mx3005P (Agilent Technologies Inc., Santa Clara, CA, USA). The cycle profile for target gene amplification involved initial denaturation for 10 min at 95°C, followed by 40 cycles of target amplification involving 15 sec at 95°C and 60 sec at primer-specific annealing temperature. Finally, a dissociation curve analysis was carried out at a temperature range of 60 to 95°C for 20 min. A single peak in the dissociation curve analysis confirmed gene-specific amplification. 18S rRNA was run in parallel to normalize average threshold cycle (Ct) values. Ct values were used to calculate relative ΔCt values for each experimental set. These relative ΔCt values were used to determine the fold change in expression between the groups.
Preparation of whole cell extract and Western blot
HTR-8/SVneo cells (0.1 × 10⁶/well) were cultured in 6-well cell culture plate for 24 h and serum starved for at least 4 h before treatment with IFNG (10 ng/mL) for 10, 30, 60 min and 24 h. After each time point, the medium was aspirated and cells were lysed in 100 μL of cell lysis buffer (20 mM Tris-HCl, 10% glycerol, 0.2 mM EDTA, 0.137 M NaCl, 1% NP-40) supplemented with complete protease and phosphatase inhibitor cocktail (Roche Diagnostics, #05892791001 and #4906845001), followed by 3 rapid freeze and thaw cycles to ensure the complete lysis of the cells. Further, cell lysates were centrifuged at 10,000 × g for 10 min at 4˚C and supernatant was collected. Bicinchoninic acid (BCA; Thermo Fisher Scientific, #23225) colorimetric assay was performed to quantitate the amount of protein in each sample using bovine serum albumin (BSA) as standard. Around 40 μg of cell lysate was resolved on 0.1% SDS-10% PAGE and transferred on to the nitrocellulose membrane (mdi, #SCNJ8102XXXX101) as described previously.Citation45 Further, membrane was blocked with 5% BSA in 50 mM PBS pH 7.4 for 1 h at RT and individual blots were incubated at 4˚C overnight with 1: 1000 dilution of rabbit monoclonal antibodies against phospho-STAT1 (p-STAT1)(tyr701), p-STAT1(ser727), total STAT1, total JUN, p-JUN (ser 63 and ser 73), GAPDH (Cell Signaling Technology Inc., #9167S, #9177S, #9172S, #9165P, #2361P, #3270P, #2118 respectively), and BATF2 (Abcam, #ab157466) in TBS-T (0.1% Tween) containing 5% BSA. After subsequent washing with TBS-T (0.1% Tween), the membrane was further incubated with 1:2000 dilution of HRP conjugated goat anti-rabbit IgG antibody (Thermo Scientific Inc., #32460) in TBS-T (0.1% Tween) supplemented with 5% BSA for 1 h at RT. After three washing with 0.1% TBST, blots were developed using immobilon chemiluminescent substrate (Merck Millipore, #WBKLS0500) and photographs were taken by FluorChem E system (ProteinSimple, SJ, California, USA). Intensity of bands were quantitated using ImageJ software (http://rsb.info. nih.gov/ij/).Citation54
Statistical analysis
All experiments were performed at least three times and results were expressed as mean ± standard error of the mean (S.E.M). Statistical analyses were performed using one-way ANOVA, and p ≤ 0.05 was considered statistically significant.
Disclosure of potential conflicts of interest
No potential conflicts of interest were disclosed.
Authors' contributions
SV, RP and SKG were involved in project conception and experimental design. SV carried out the experiments. SV, RP and SKG interpreted the data thus obtained and were involved in writing the manuscript.
Verma_et_al_Supp_Figs_1_.pptx
Download MS Power Point (171.1 KB)Acknowledgment
We would like to acknowledge the financial support by Department of Biotechnology (BT/PR12312/MED/30/1424/2014), Government of India. SKG would like to acknowledge the J. C. Bose National Fellowship (SB/S2/JCB-040/2015) provided by Science and Engineering Research Board (SERB), Department of Science and Technology, Government of India. The funding bodies were not involved in the design of the study, data analysis or writing the manuscript.
Additional information
Funding
References
- Krüssel JS, Bielfeld P, Polan ML, et al. Regulation of embryonic implantation. Eur J Obstet Gynecol Reprod Biol. 2003;110(Suppl):S2–9. doi:10.1016/S0301-2115(03)00167-2
- Goldman-Wohl D, Yagel S. Regulation of trophoblast invasion: from normal implantation to preeclampsia. Mol Cell Endocrinol. 2002;187(1–2):233–8. doi:10.1016/S0303-7207(01)00687-6
- Kaufmann P, Black S, Huppertz B. Endovascular trophoblast invasion: Implications for the pathogenesis of intrauterine growth retardation and preeclampsia. Biol Reprod. 2003;69(1):1–7. doi:10.1095/biolreprod.102.014977
- Wortman AC, Alexander JM. Placenta accreta, increta, and percreta. Obstet Gynecol Clin N Am. 2013;40(1):137–54. doi:10.1016/j.ogc.2012.12.002
- Poehlmann TG, Fitzgerald JS, Meissner A, et al. Trophoblast invasion: tuning through LIF, signalling via Stat3. Placenta. 2005;26(Suppl A):S37–41. doi:10.1016/j.placenta.2005.01.007
- Jovanoic M, Vicovac L. Interleukin-6 stimulates cell migration, invasion and integrin expression in HTR-8/SVneo cell line. Placenta. 2009;30(4):320–28. doi:10.1016/j.placenta.2009.01.013
- Malik A, Pal R, Gupta SK. Interdependence of JAK-STAT and MAPK signaling pathways during EGF-mediated HTR-8/SVneo cell invasion. PLoS One. 2017;12(5):e0178269. doi:10.1371/journal.pone.0178269
- Kauma SW, Bae-Jump V, Walsh SW. Hepatocyte growth factor stimulates trophoblast invasion: a potential mechanism for abnormal placentation in preeclampsia. J Clin Endocrinol Metab. 1999;84(11):4092–96. doi:10.1210/jc.84.11.4092
- Bilban M, Ghaffari-Tabrizi N, Hintermann E, et al. Kisspeptin-10, a KiSS-1/metastin-derived decapeptide, is a physiological invasion inhibitor of primary human trophoblasts. J Cell Sci. 2004;117(Pt8):1319–28. doi:10.1242/jcs.00971
- Lash GE, Otun HA, Innes BA, et al. Interferon-gamma inhibits extravillous trophoblast cell invasion by a mechanism that involves both changes in apoptosis and protease levels. FASEB J. 2006;20(14):2512–18. doi:10.1096/fj.06-6616com
- Graham CH, Connelly I, MacDougall JR, et al. Resistance of malignant trophoblast cells to both the anti-proliferative and anti-invasive effects of transforming growth factor-beta. Exp Cell Res. 1994;214(1):93–9. doi:10.1006/excr.1994.1237
- Murphy SP, Tayade C, Ashkar AA, et al. Interferon gamma in successful pregnancies. Biol Reprod. 2009;80(5):848–59. doi:10.1095/biolreprod.108.073353
- Bulmer JN, Lash GE. Human uterine natural killer cells: a reappraisal. Mol Immunol. 2005;42(4):511–21. doi:10.1016/j.molimm.2004.07.035
- Ain R, Canham LN, Soares MJ. Gestation stage-dependent intrauterine trophoblast cell invasion in the rat and mouse: novel endocrine phenotype and regulation. Dev Biol. 2003;260(1):176–90. doi:10.1016/S0012-1606(03)00210-0
- Ashkar AA, Di Santo JP, Croy BA. Interferon-γ contributes to initiation of uterine vascular modification, decidual integrity, and uterine natural killer cell maturation during normal murine pregnancy. J Exp Med. 2000;192(2):259–70. doi:10.1084/jem.192.2.259
- Karmakar S, Dhar R, Das C. Inhibition of cytotrophoblastic JEG-3 cell invasion by Interleukin 12 involves an Interferon mediated pathway. J Biol Chem. 2004;279(53):55297–307. doi:10.1074/jbc.M407013200
- Lockwood CJ, Basar M, Kayisli UA, et al. Interferon-gamma protects first-trimester decidual cells against aberrant matrix metalloproteinases 1, 3, and 9 expression in preeclampsia. Am J Pathol. 2014;184(9):2549–59. doi:10.1016/j.ajpath.2014.05.025
- Stark GR. How cells respond to interferons revisited. From early history to current complexity. Cytokine Growth Factor Rev. 2007;18(5–6):419–23. doi:10.1016/j.cytogfr.2007.06.013
- Wen Z, Zhong Z, Darnell Jr JE. Maximal activation of transcription by STAT1 and STAT3 requires both tyrosine and serine phosphorylation. Cell. 1995;82(2):241–50. doi:10.1016/0092-8674(95)90311-9
- Choi JC, Holtz R, Petroff MG, et al. Dampening of IFN-inducible gene expression in human choriocarcinoma cells is due to phosphatase-mediated inhibition of the JAK/STAT-1 pathway. J Immunol. 2007;178(3):1598–1607. doi:10.4049/jimmunol.178.3.1598
- Chmielewski S, Olejnik A, Sikorski K, et al. STAT1-dependent signal integration between IFNγ and TLR4 in vascular cells reflect pro-atherogenic responses in human atherosclerosis. PLoS One. 2014;9(12):e113318. doi:10.1371/journal.pone.0113318
- Liu Z, Wei P, Yang Y, et al. BATF2 deficiency promotes progression in human colorectal cancer via activation of HGF/MET signaling: a potential rationale for combining MET inhibitors with IFNs. Clin Cancer Res. 2015;21(7):1752–63. doi:10.1158/1078-0432.CCR-14-1564
- Dash R, Su ZZ, Lee SG, et al. Inhibition of AP-1 by SARI negatively regulates transformation progression mediated by CCN1. Oncogene. 2010;29(31):4412–23. doi:10.1038/onc.2010.194
- Wang C, Su Y, Zhang L, et al. The function of SARI in modulating epithelial-mesenchymal transition and lung adenocarcinoma metastasis. PLoS One. 2012;7(9):e38046. doi:10.1371/journal.pone.0038046
- Peng B, Zhu H, Ma L, et al. AP-1 Transcription factors c-FOS and c-JUN mediate GnRH-induced Cadherin-11 expression and trophoblast cell invasion. Endocrinology. 2005;156(6):2269–77. doi:10.1210/en.2014-1871
- Gough DJ, Sabapathy K, Ko EY, et al. A novel c-Jun-dependent signal transduction pathway necessary for the transcriptional activation of interferon gamma response genes. J Biol Chem. 2007;282(2):938–46. doi:10.1074/jbc.M607674200
- Su ZZ, Lee SG, Emdad L, et al. Cloning and characterization of SARI suppressor of AP-1, regulated by IFN. Proc Natl Acad Sci U S A. 2008;105(52):20906–11. doi:10.1073/pnas.0807975106
- Graham CH, Hawley TS, Hawley RG, et al. Establishment and characterization of first trimester human trophoblast cells with extended lifespan. Exp Cell Res. 1993;206(2):204–11. doi:10.1006/excr.1993.1139
- Jia RZ, Ding GC, Gu CM, et al. CDX2 enhances HTR-8/SVneo trophoblast cell invasion by altering the expression of matrix metalloproteinases. Cell Physiol Biochem. 2014;34(3):628–36. doi:10.1159/000363028
- Jia RZ, Rui C, Li JY, et al. CDX1 restricts the invasion of HTR-8/SVneo trophoblast cells by inhibiting MMP-9 expression. Placenta. 2014;35(7):450–54. doi:10.1016/j.placenta.2014.04.011
- Ospina-Prieto S, Morales-Prieto DM, Chaiwangyen W, et al. miR-134 regulates invasion and proliferation in HTR-8/SVneo cells. Placenta. 2014;35(9):A104–5. doi:10.1016/j.placenta.2014.06.340
- Chen Y, Zhang Y, Deng Q, et al. Wnt5a inhibited human trophoblast cell line HTR8/SVneo invasion: implications for early placentation and preeclampsia. J Matern Fetal Neonatal Med. 2016;29(21):3532–38. doi:10.3109/14767058.2016.1138102
- Hannan NJ, Paiva P, Dimitriadis E, et al. Models for study of human embryo implantation: Choice of cell lines? Biol Reprod. 2010;82:235–45. doi:10.1095/biolreprod.109.077800
- Weber M, Knoefler I, Schleussner E, et al. HTR8/SVneo cells display trophoblast progenitor cell-like characteristics indicative of self-renewal, repopulation activity, and expression of “stemness-” associated transcription factors. Biomed Res Int. 2013;2013:243649. doi:10.1155/2013/243649
- Kilburn BA, Wang J, Duniec-Dmuchowski ZM, et al. Extracellular matrix composition and hypoxia regulate the expression of HLA-G and integrins in a human trophoblast cell line. Biol Reprod. 2000;62(5):1466. No doi found.
- Morales-Prieto DM, Chaiwangyen W, Ospina-Prieto S, et al. MicroRNA expression profiles of trophoblastic cells. Placenta. 2012;33(9):725–34. doi:10.1016/j.placenta.2012.05.009
- Lee CQ, Gardner L, Turco M, et al. What is trophoblast? A combination of criteria define human first-trimester trophoblast. Stem Cell Reports. 2016;6(2):257–72. doi:10.1016/j.stemcr.2016.01.006
- Guleria I, Pollard JW. The trophoblast is a component of the innate immune system during pregnancy. Nat Med. 2000;6(5):589–93. doi:10.1038/75074
- Piccinni MP, Beloni L, Livi C, et al. Defective production of both leukemia inhibitory factor and type 2 T-helper cytokines by decidual T cells in unexplained recurrent abortions. Nat Med. 1998;4(9):1020–24. doi:10.1038/2006
- Banerjee S, Smallwood A, Moorhead J, et al. Placental expression of Interferon-gamma (IFN-gamma) and its receptor (IFN-gamma) R2 fail to switch from early hypoxic to late normotensive development in pre-eclampsia. J Clin Endocrinol Metab. 2005;90(2):944–52. doi:10.1210/jc.2004-1113
- Boehm U, Klamp T, Groot M, et al. Cellular responses to interferon-gamma. Annu Rev Immunol. 1997;15:749–95. doi:10.1146/annurev.immunol.15.1.749
- Darnell JEJ, Kerr IM, Stark GR. Jak-STAT pathways and transcriptional activation in response to IFNs and other extracellular signaling proteins. Science. 1994;264(5164):1415–21. doi:10.1126/science.8197455
- Shuai K, Stark GR, Kerr IM, et al. A single phosphotyrosine residue of Stat91 required for gene activation by interferon-gamma. Science. 1993;261(5129):1744–6. doi:10.1126/science.7690989
- Heim MH. The Jak-STAT pathway cytokine signalling from the receptor to the nucleus. J Recept Signal Transduct Res. 1999;19(1–4):75–120. doi:10.3109/10799899909036638
- Suman P, Godbole G, Thakur R, et al. AP-1 transcription factors, mucin-type molecules and MMPs regulate the IL-11 mediated invasiveness of JEG-3 and HTR-8/SVneo trophoblastic cells. PLoS One. 2012;7(1):e29745. doi:10.1371/journal.pone.0029745
- Suman P, Shembekar N, Gupta SK. Leukemia inhibitory factor increases the invasiveness of trophoblastic cells through integrated increase in the expression of adhesion molecules and pappalysin 1 with a concomitant decrease in the expression of tissue inhibitor of matrix metalloproteinases. Fertil Steril. 2013;99(2):533–42. doi:10.1016/j.fertnstert.2012.10.004
- Marconato HM, Panico VJ, Saragiotto L, et al. Trofoblastic invasion: The role of subunits STAT1 and STAT3. Pregnancy Hypertens. 2012;2(3):306. doi:10.1016/j.preghy.2012.04.235
- Pereira de Sousa FL, Chaiwangyen W, Morales-Prieto DM, et al. Involvement of STAT1 in proliferation and invasiveness of trophoblastic cells. Reprod Biol. 2017;17(3):218–24. doi:10.1016/j.repbio.2017.05.005
- Liu X, Hu Y, Liu X, et al. EPHB4, a downstream target of IFN-γ/STAT1 signal pathway, regulates endothelial activation possibly contributing to the development of preeclampsia. AM J Reprod Immunol. 2016;76:307–317. doi:10.1111/aji.12555
- Peng Y, Zhang P, Huang X, et al. Direct regulation of FOXK1 by C-Jun promotes proliferation, invasion and metastasis in gastric cancer cells. Cell Death Dis. 2016;7(11):e2480. doi:10.1038/cddis.2016.225
- Jiao X, Katiyar S, Willmarth NE, et al. c-Jun Induces Mammary Epithelial Cellular Invasion and Breast Cancer Stem Cell Expansion. J Biol Chem. 2010;285(11):8218–26. doi:10.1074/jbc.M110.100792
- Zhang Y, Pu X, Shi M, et al. Critical role of c-Jun overexpression in liver metastasis of human breast cancer xenograft model. BMC Cancer. 2007;7:145. doi:10.1186/1471-2407-7-145
- Kitada S, Kayama H, Okuzaki D, et al. BATF2 inhibits immunopathological Th17 responses by suppressing Il23a expression during Trypanosoma cruzi infection. J Exp Med. 2017;214(5):1313–31. doi:10.1084/jem.20161076
- Abramoff MD, Magalhaes PJ, Ram SJ. Image processing with ImageJ. Biophot Int. 2004;11(7):36–42.