
ABSTRACT
The purpose of this study was to investigate whether a change in the follicular fluid metabolomics profile due to endometrioma is identifiable. Twelve women with ovarian endometriosis (aged<40 years, with a body mass index [BMI] of <30 kg/m2) and 12 age- and BMI-matched controls (women with infertility purely due to a male factor) underwent ovarian stimulation for intracytoplasmic sperm injection (ICSI). Follicular fluid samples were collected from both of groups at the time of oocyte retrieval for ICSI. Next, nuclear magnetic resonance (NMR) spectroscopy was performed for the collected follicular fluids. The metabolic compositions of the follicular fluids were then compared using univariate and multivariate statistical analyses of NMR data. Univariate and multivariate statistical analyses of NMR data showed that the metabolomic profiles of the follicular fluids obtained from the women with ovarian endometriosis were distinctly different from those obtained from the control group. In comparison with the controls, the follicular fluids of the women with ovarian endometriosis had statistically significant elevated levels of lactate, β-glucose, pyruvate, and valine. We conclude that the levels of lactate, β-glucose, pyruvate, and valine in the follicular fluid of the women with endometrioma were higher than those of the controls.
Abbreviations: ASRM: American Society for Reproductive Medicine; BMI: body mass index; CPMG: Carr-Purcell-Meiboom-Gill; E2: estradiol; ESHRE: European Society of Human Reproduction and Embryology; ERETIC: electronic to access in vivo concentration; FF: follicular fluid; FSH: follicle-stimulating hormone; hCG: human chorionic gonadotropin; HEPES: 2-hydroxyethyl-1-piperazineethanesulfonic acid; ICSI: intracytoplasmic sperm injection; IVF: in vitro fertilization; NMR: nuclear magnetic resonance spectroscopy; PCA: principal component analysis; PCOS: polycystic ovary syndrome; PLS-DA: partial least squares discriminant analysis; ppm: parts per million; PULCON: pulse length-based concentration determination; TSP: 3-(trimethylsilyl)-1-propanesulfonic acid sodium salt; VIP: variable importance in projection
Introduction
Endometriosis is a gynecological disease characterized by ectopic growth of endometrial glandular epithelial and stromal cells outside the uterine cavity (Benagiano and Brosens Citation1991). Endometriosis affects 10–15% of women of reproductive age, and an estimated 30–50% of women with endometriosis are subfertile (Allaire Citation2006). However, the mechanism behind the pathogenesis of endometriosis-associated infertility has not been fully elucidated. Several studies have reported reduced fertility in women with endometriosis (Garrido et al. Citation2002). Ovarian endometriosis has been reported to have a reduced ovarian response to ovarian stimulation as measured using fewer retrieved follicles, fewer aspirated oocytes, and lower peak estradiol levels (Gupta et al. Citation2006). Moreover, women with ovarian endometriosis were undergoing IVF treatment had a significantly lower pregnancy and live birth/ongoing pregnancy rates (Opøien et al. Citation2012).
Follicular fluid (FF) is derived from plasma and secretions, and synthesized in the follicle wall. This fluid contains some metabolites, which can be critical for oocyte growth and development (Edwards Citation1974). FF forms the microenvironment of the developing oocyte and has direct impact on oocyte quality, which plays key roles in fertilization, implantation, and early embryo development (Revelli et al. Citation2009; Bayasula et al. Citation2013).
The collection of low-molecular-weight molecules (<1500 Daltons), which are the end products of cellular processes, are defined as ‘metabolites’ (Wishart Citation2007). Metabolomics are defined as the quantitative measurement of the dynamic chemical reaction of living systems against any pathophysiological insult (e.g., disease and drug exposure) or genetic variation (Nicholson et al. Citation1999). Metabolomics is the latest -omic technology that derives from genomics, transcriptomics, and proteomics (Baskind et al. Citation2011). Nuclear magnetic resonance (NMR) spectroscopy-based metabolomics is one of the strongest technologies in biological fluid studies (Lindon et al. Citation2003).
The aim of the present study was to investigate whether a change in the FF metabolomic profile due to endometrioma is identifiable. For this purpose, by using advanced statistical analysis techniques, the NMR spectroscopy results of FFs collected from women with ovarian endometriosis were compared with the NMR spectroscopy results of FFs collected from women with controls.
Results
The baseline characteristics of the 12 patients with endometrioma and the 12 control participants in the present study are shown in . According to the student t-test and p-values, the baseline characteristics are similar as mentioned in the . No statistically significant difference was found between the groups in terms of total gonadotropin dose, number of retrieved oocytes, success of fertilization, number of high-quality embryos (grades I and II), and success of clinical pregnancy.
Table 1. Clinical characteristics of the study participants.
The NMR spectra of the FF samples from the controls and women with endometriosis are shown in , respectively. In some of the samples, during the examination of the spectra, an unexpected signal set was observed in the 2.55–3.06 ppm region. The NMR chemical tables indicate that these signals arise from 2-hydroxyethyl-1-piperazineethanesulfonic acid (HEPES), which is present in the flush medium ().
Figure 1. 1H CPMG (Carr-Purcell-Meiboom-Gill) NMR spectrums (δ 0 to 8.5 ppm) recorded at 600 MHz and 298 K of follicular fluid samples from the study subjects. A) 1H NMR spectrum of control sample. B) 1H NMR spectrum of patient sample. C) 1H NMR spectrum of follicular fluid contaminated with flushing medium [HEPES [4-(2-Hydroxyethyl)-1-piperazineethanesulfonic acid].
![Figure 1. 1H CPMG (Carr-Purcell-Meiboom-Gill) NMR spectrums (δ 0 to 8.5 ppm) recorded at 600 MHz and 298 K of follicular fluid samples from the study subjects. A) 1H NMR spectrum of control sample. B) 1H NMR spectrum of patient sample. C) 1H NMR spectrum of follicular fluid contaminated with flushing medium [HEPES [4-(2-Hydroxyethyl)-1-piperazineethanesulfonic acid].](/cms/asset/09408c91-5531-424a-82f2-c4be2e3e184e/iaan_a_1478469_f0001_oc.jpg)
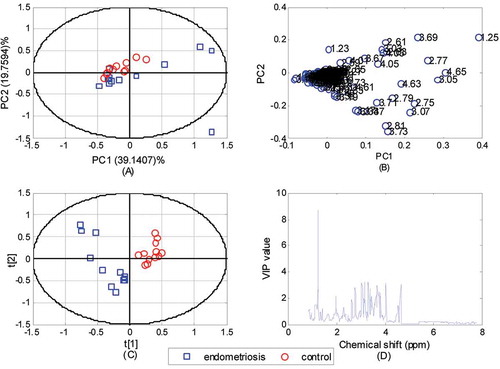
To study the effect of HEPES contamination, a multivariate statistical analysis of the data was performed in two different cases. In the first case, the data were analyzed as a whole (12 endometriosis and 12 control samples), without excluding any HEPES contaminated or clean samples. In this case, the principal component analysis (PCA) model () exhibits a separation between the endometriosis and control samples (R2 value of 0.5890). Moreover, the partial least squares discriminant analysis (PLS-DA) model provides a better separation with a R2X value of 0.5586, R2Y value of 0.8788, and Q2 value of 0.8240 (). In this case, both the PCA loading plot () and the PLS-DA variable importance in projection (VIP) plot () had HEPES peaks in the 2.55–3.06 ppm region as expected.
Figure 2. Multivariate statistical analysis results of the data including both the HEPES contaminated samples and samples without any contamination. Principal component analysis (PCA) scores (A) and loadings (B) plots and partial least squares discriminant analysis (PLS-DA) scores (C) and variable importance in projection (VIP) values (D) for the follicular fluid (FF) spectral data including both the contaminated samples and samples without any contamination.For the PCA, the first component accounts for 39.1407% of overall variability and the second component accounts for 19.7594% of overall variability which corresponds to a cumulative R2 value of 0.5890. The PLS-DA model has R2X value of 0.5586, R2Y value of 0.8788 and Q2 value of 0.8240. PLS-DA model shows a better separation for the endometriosis and control FF spectral data when compared to the PCA model. In the PCA loadings plot (B) and PLS-DA VIP plot (D), lactate (1.25 ppm, 4.03 ppm), β-glucose (4.55 ppm, 3.15–3.84 ppm), valine (0.95 ppm, 0.89 ppm), pyruvate (2.29 ppm) and HEPES peaks (2.55–3.06 ppm) are highlighted as important peaks.
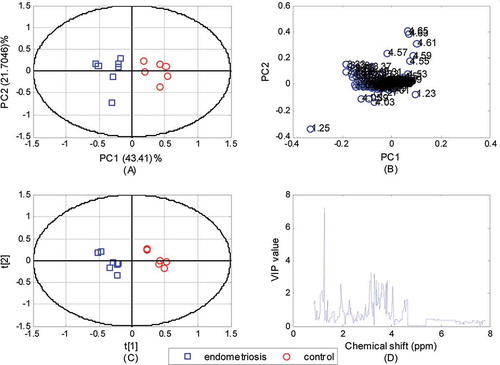
In the second case, the HEPES contaminated samples (5 samples with endometriosis and 6 controls) were excluded from the data set. For this case, the multivariate statistical analysis results are shown in . The PCA score plot presented in shows a better separation of endometriosis samples (R2 = 0.6511) when compared with . The PCA loading plot presented in shows that this separation occurs mainly because of lactate (1.25 ppm, 4.03 ppm), β-glucose (4.55 ppm, 3.15–3.84 ppm), valine (0.95 ppm, 0.89 ppm), and pyruvate peaks (2.29 ppm). Similarly, the PLS-DA score plot presented in shows a good separation between the endometriosis and control samples. The PLS-DA model has a R2X value of 0.5381, R2Y value of 0.9723, and Q2 value of 0.9239. The R2 and Q2 statistics given for PLS-DA express the goodness of fit for the PLS-DA model, and a value of 1 represents a perfect fit between the data and the model. Again, the PLS-DA VIP plot presented in shows that the separation between the endometriosis and control samples occurs mainly because of lactate, β-glucose, valine, and pyruvate peaks.
Figure 3. Multivariate statistical analysis results of the data including only samples without any contamination. Principal component analysis (PCA) scores (A) and loadings (B) plots and partial least squares discriminant analysis (PLS-DA) scores (C) and variable importance in projection (VIP) values (D) for the follicular fluid (FF) spectral data including samples without any contamination.For the PCA, the first component accounts for 43.41% of overall variability and the second component accounts for 21.70% of overall variability which corresponds to a cumulative R2 value of 0.6511. The PLS-DA model has R2X value of 0.5381, R2Y value of 0.9723 and Q2 value of 0.9239. Both models show a good separation for the endometriosis and control FF spectral data. The PCA loadings plot (B) and PLS-DA VIP plot (D) show that this separation occurs mainly because of lactate (1.25 ppm, 4.03 ppm), β-glucose (4.55 ppm, 3.15–3.84 ppm), valine (0.95 ppm, 0.89 ppm) and pyruvate (2.29 ppm) peaks.
For both cases, the resulting two-dimensional spaces are linearly separable, for which the PLS-DA model exhibits 100% sensitivity and 100% specificity classification results in a leave-one-out cross-validation process.
In the HEPES contaminated samples, the lactate and glucose levels were significantly altered. Therefore, they were again excluded from the data set during the univariate statistical analysis. With the univariate statistical analysis, the FF of the women with endometrioma was found to contain higher levels of lactate (2.75 mM vs. 1.6 mM, p = 0.05), β-glucose (1.25 mM vs. 0.83 mM, p = 0.03), pyruvate (0.19 mM vs. 0.14 mM, p = 0.03), and valine (0.17 mM vs. 0.12 mM, p = 0.02) than the controls ().
Table 2. Resonance assignments and concentration ranges of metabolites in ovarian endometrioma and control follicular fluid samples.
Discussion
The results of this study indicate that the metabolic profile of the FF samples from the women with endometrioma was distinctly different from that of the controls. Both the PCA and PLS-DA analyses revealed that the metabolic profile of the FF samples from the women with endometrioma was distinctly different from that of the FF samples from the controls. The FF samples from the women with ovarian endometriosis showed elevated levels of lactate, β-glucose, pyruvate, and valine than those from the controls.
An important limitation of this study was the small sample size. Owing to the strict selection criteria, we could not collect a rich set of samples. In addition, the histopathological confirmation of the diagnosis of the women with endometrioma was missing. In comparison, owing to their characteristic echogenic appearance, endometrioma can usually be simply distinguished from other ovarian masses. The sensitivity and specificity of transvaginal ultrasonography for endometrioma have been reported to be 84–100% and 90–100%, respectively (Savelli Citation2009). One of the strengths of this study was that a metabolomic study is potentially more informative than direct studies of genomics, transcriptomics, and proteomics because metabolomes provide the immediate and punctual functional status of a biological system and its cells (Nicholson et al. Citation1999). Moreover, the analysis with NMR spectroscopy requires little sample preparation, and the material used can be reclaimed unchanged at the end of the experiment (Emwas et al. Citation2013).
This study showed an increased β-glucose level when the FF composition of the women with endometriosis and that of the controls were compared. As glucose is used as an energy source, it is an important metabolite. Boland et al. (Citation1993) showed that follicular development and steroidogenesis relied on glucose concentrations and that follicular growth was significantly retarded at low glucose levels. They proposed that follicles adopt a mainly glycolytic mode of energy production to sustain follicular growth and steroidogenesis. In addition, too low or too high FF glucose levels are detrimental for oocyte and follicle maturations (Sutton-McDowall et al. Citation2010).
This study also showed an increase in lactate level when the FF composition of the women with endometriosis and that of the controls were compared. The lactate concentration in FF was high. This increase is explained with an important anaerobic metabolism in a hyperstimulated cycle (Gull et al. Citation1999). Harlow et al. (Citation2010) hypothesized that lactate production increased because of the increased glycolytic activity of granulosa cells. The increase in granulosa cell glycolysis has been postulated to reflect the increase in energy demands of the growing follicle as oxygen availability diminished (Sutton-McDowall et al. Citation2003). In the present study, an increase in pyruvate level was observed when the FF composition of the women with endometriosis and that of the controls were compared. This can be explained by the conversion of glucose to pyruvate by the cumulus cells. These results suggest that FF may play a role in providing lactate and pyruvate as sources of energy to the follicle for oocyte maturation (Pinero-Sagredo et al. Citation2010).
In this study, no statistically significant difference in FF alanine level was found between the two groups. In contrast to our study, serum alanine levels were found significantly lower in the women with endometriosis than in the controls (Jana et al. Citation2013).In this study, an increase in valine level was observed when the FF composition of the women with endometriosis and that of the controls were compared. Valine is an essential amino acid and was found to be significantly higher in women with repeated failure of in vitro fertilization than in women who achieved pregnancy after the first in vitro fertilization cycle (Xia et al. Citation2014).
In contrast to this study, in their NMR-based metabolic profiling study, Jana et al. (Citation2013) showed that serum glucose levels are significantly lower in women with endometriosis than in controls. Santonastaso et al. (Citation2017) also found similar results in FF samples. However, unlike to the present study, both Jana et al. (Citation2013) and Santonastaso et al. (Citation2017) examined the biological samples of patients with pelvic endometriosis. Ovarian endometriosis and pelvic endometriosis may have different effects on follicular metabolomics.
Previous studies found no statistically significant correlation between FF and serum glucose levels (Anifandis et al. Citation2010; Valckx et al. Citation2012). FF glucose levels are influenced by serum glucose levels and also by other local factors that are responsible for oocyte and follicle development (Anifandis et al. Citation2010). Not only low glucose levels but also high glucose levels in FF was associated with increased reactive oxygen species and had detrimental effects on oocyte nuclear and cytoplasmic maturation (Sutton-McDowall et al. Citation2010). However, in agreement with this study, Jana et al. (Citation2013) found higher serum lactate and pyruvate levels in women with endometriosis than in controls. They suggested that increased glucose metabolism and defects in the mitochondrial respiratory system are possible sources of excessive reactive oxygen species generation in women with endometriosis. They proposed that the serum metabolomics profiles of women with endometriosis are altered and that the PLS-DA model could classify patients with endometriosis with a sensitivity and specificity of 92.8% and 100%, respectively (Jana et al. Citation2013). In agreement with this study, in a gas chromatography/mass spectrometry-based study, Turco et al. (Citation2013) showed that endometriosis leads to differential protein expression profiles in FF.
Although the underlying mechanisms responsible for such biochemical changes are currently unknown, the oocytes of the women with endometriosis may still show lower energy consumption than those of the controls. Studies have reported compromised follicular development in women with endometriosis. These may have resulted in increased levels of lactate and pyruvate in the FF of the endometrioma. These metabolic balance and specific glycolytic activity seem to be important not only from an energetic point of view but also for the protection against oxidative stress. Increased glucose metabolism and defects in the mitochondrial respiratory system are possible sources of excessive oxidative stress in women with endometriosis (Sinclair et al. Citation2008; Sanchez et al. Citation2013).
In this study, no statistically significant difference was found between the groups in terms of total gonadotropin dose, number of retrieved oocytes, success of fertilization, number of high-quality embryos, and success of clinical pregnancy. There is a lack of consensus in the literature on outcomes of assisted reproduction technologies in patients with ovarian endometriosis. Although some studies showed that endometrioma affect the oocyte number (Barnhart et al. Citation2002; Suzuki et al. Citation2005), a study by Opøien et al. (Citation2012) found that the number of retrieved oocytes were not affected statistically significant in patients with endometrioma. A meta-analysis by Gupta et al. (Citation2006) showed that the clinical pregnancy rate were not affected significantly in patients with ovarian endometrioma, but Opøien et al. (Citation2012) showed that women with endometrioma received significantly higher doses FSH and had significantly lower pregnancy and live birth rate compared to controls.
In conclusion, this study revealed that using 1H-NMR and advanced statistical analysis, the metabolites responsible for discrimination between endometrioma and controls, can be successfully identified. The present study reported altered levels of lactate, β-glucose, pyruvate, and valine in the FF of women with endometriosis as compared with controls.
Materials and methods
Study group
Twelve individuals with ovarian endometriosis and 12 individuals with severe male factor infertility (as controls) who were undergoing ICSI treatment at the Division of Reproductive Medicine and Infertility, Department of Obstetrics and Gynecology, School of Medicine, Inonu University, were recruited in this study between May 2015 and June 2016. The Human Research Ethics Committee of Malatya approved the study protocol, and each participant provided written informed consent.
The case subjects consisted of patients with infertility associated with ovarian endometriosis. The diagnosis of the endometrioma was performed using transvaginal ultrasonography, and endometrioma had to be documented on at least two occasions and at least two menstrual cycles apart. Ovarian endometrioid cyst was defined as a round-shaped cystic mass with a minimum diameter of 10 mm, with thick walls, regular margins, and homogeneous low echogenic fluid content with scattered internal echoes, and without papillary proliferations (Savelli Citation2009). The size of endometrioma of the study participants were between 25 and 55 mm at the time of folicular aspiration. The control group consisted of patients with infertility purely due to a male factor (azoospermia or severe oligoasthenoteratozoospermia). The patients with ovarian endometriosis do not have sign of endometriosis in any other areas of the body. Women with infertility due to poor ovarian reserve, ovulatory dysfunction, tubal factor, and endometriosis were excluded from the control group.
Inclusion criteria for both groups included age of 25–39 years and body mass index (BMI) of <30 kg/m2. The selection criteria for controls included an early follicular phase serum follicle-stimulating hormone (FSH) of <10.0 IU/L, normal pelvic anatomy on ultrasonography scan, and patent fallopian tubes demonstrated laparoscopically or on hysterosalpingography. The study participants had normal karyotypes, and good mental and physical health. The exclusions criteria were age of ≥40 years, BMI of ≥30 kg/m2, FSH of ≥10 IU/L on the first third day of the menstrual cycle, chronic anovulation, and presence of hydrosalpinx or chronic systemic diseases (e.g., chronic hypertension, diabetes mellitus, and thyroid disorders). Women with comorbidities (e.g., dysmenorrhea and oligo/amenorrhea) that could suggest PCOS or endometriosis, and women who had a previous endometrioma surgery were also excluded from the control group.
Controlled ovarian stimulation protocol
The patients received a standard gonadotropin-releasing hormone antagonist (Cetrotide, Merck, Germany) regimen starting on day 6 of a spontaneous menstrual cycle. FSH stimulation was initiated from cycle day 2 or 3. Patients received recombinant FSH (Gonal F, Merck Serono, Bari, Italy). Further stimulation doses were determined according to the standard criterion for follicular maturation, assessed using serum estradiol (E2) level and ultrasonographic measurement. To induce ovulation, 10.000 human chorionic gonadotropins (hCG) IU (Pregnyl, Organon, the Netherlands) were applied when at least three follicles had reached a diameter of ≥18 mm. Oocytes were collected using transvaginal ultrasonography-guided needle aspiration of the follicles for 36 h after hCG administration. Embryo transfer was performed 2 or 3 days after oocyte pickup.
The number of cells represented the cleavage rate, and a morphological score was attributed to each embryo prior to embryo transfer based on the degree of fragmentation, granularity, and similarity in the size of blastomeres according to the criteria described by the Istanbul consensus workshop on embryo assessment (ASRM and ESHRE Special Interest Group Embryology Citation2011). Clinical pregnancy was defined as one that was confirmed by demonstrating a gestational sac with a fetal pole and a fetal heart by a transvaginal scan performed at 4–5 weeks (6–7 weeks’ gestation) after the embryo transfer.
Collection and processing of FF samples
FF samples were collected in individual sterile tubes. At the time of oocyte retrieval, the entire content of the FF from one of the follicles between sizes 18 and 21 mm was collected. We collected only FF from affected ovary, and we did not collect any FF from unaffected ovary. Only FF samples free of blood contamination upon both visual and microscopic examination and that contained mature (MII) oocytes were analyzed. Samples were centrifuged at 2900 rpm for 10 min to remove cell debris, and the supernatant were stored at −80°C until NMR analysis.
Metabolomic analysis of FF using NMR spectroscopy
The FF samples were first left to dissolve at room temperature. Next, a small amount of sample was taken and centrifuged for 5 min at 10000 rpm. After this process, 600 µL of FF sample taken from supernatant and 60 µL of deuterium oxide (D2O), which contains approximately 25 mM TSP (3-(trimethylsilyl)-1-propanesulfonic acid sodium salt) standard substance was mixed and placed in 5-mm NMR tubes (Pinero-Sagredo et al. Citation2010). While TSP was used as a chemical shift reference, D2O was used as a solvent for ‘field-frequency-lock’.
1H-NMR spectroscopy
The 1H-NMR spectra of the FF was recorded with a 600 MHz Bruker Ascend NMR spectrometer equipped with a BBFO probe head (5 mm 1H{31P-15N and 19F}) at 298 K. All 1H experiments were conducted with the Carr-Purcell-Meiboom-Gill (CPMG) pulse sequence, 32 K data points, and 128 scans. The spectral width was set at 6009 Hz, the relaxation delay was set at 4s, and line broadening was set at 0.3 Hz. The resulting NMR spectra were phased and baseline corrected using the Bruker TopSpin version 3.2.7 software. The examined metabolites were identified using various resources, published literatures and reference tables (Teresa and Fan Citation1996; Pinero-Sagredo et al. Citation2010). For the quantitative analysis of the chosen metabolites, the ERETIC2 method (electronic to access in vivo concentration) was used. This method was based on a method called PULCON (pulse length-based concentration determination), which correlates the sensitivities of two different spectra (Wider and Dreier Citation2006). ERETIC2 is the commercial name of the new method developed by Bruker in quantitative NMR studies by using the PULCON methodology (Suzuki et al. Citation2016). When compared with the earlier ERETIC software, the most basic advantage of this new methods that it does not require any additional hardware to produce the electrical signal used as a reference. Therefore, this method provides much more practicality for quantification when one-dimensional (1D) NMR experiment is chosen. In addition, it is a good alternative method to the classic internal standard method for metabolite quantification (Bruker Manual Citation2012).
The recorded 1H-NMR spectroscopy data of the FF samples used in this study are available for download at https://cms.inonu.edu.tr/uploads/contentfile/1972/files/Data.zip.
Multivariate statistical analysis
Multivariate statistical analysis of the data was performed with the PCA and the partial least squares discriminant analysis (PLS-DA). However, prior to the multivariate statistical analysis, a number of preprocessing steps were performed. For both the preprocessing steps and the multivariate statistical analysis MATLAB® 7.9.0 was used.
As the first preprocessing step, dimension of the data was reduced by using the so-called binning method. Binning method is widely utilized in metabolomics data analysis. In this method, data are first partitioned into equal length small areas (bins) and then the area under each bin is computed and assigned as the new peak value for that particular bin. The bin size should be carefully chosen. Thus, a particular peak can remain in its own bin and an overlap with the peak of a succeeding compound is prevented. In this study, a bin size of 0.02 ppm was used and the data was divided into bins over the range of 0.84–7.80 ppm. Binning procedure also helps to avoid from the small chemical shifts that are more likely to occur during the NMR spectrum collection process. Next, to suppress the effect of varying water resonance, the chemical shift region 4.58–5.30 ppm was set to zero. The data was then normalized by dividing each spectrum with the mean value of total spectral area of control samples. After these procedures, the data was pareto-scaled. In pareto scaling, square root of the standard deviation is used as the scaling factor. Thus, the dominant effect of intense peaks is reduced and the effect of weaker peaks are emphasized which may have more biological relevance.
The preprocessed spectral data from the endometriosis and controls were then used to perform multivariate statistical analysis. As mentioned before, for this purpose PCA and PLS-DA were utilized. PCA is an unsupervised dimension reduction method in which the multi-dimensional NMR data is transformed into a new space where the variables are linearly uncorrelated. In this new space, NMR data are represented by its principle components (variables) where the first principal component accounts for as much of the variability in the data as possible and each succeeding principal component accounts for as much of the remaining variability in the data as possible. Thus, even if the first two principal components are considered, the data can largely be represented in two-dimensional space without losing much of the information. Thus, by plotting the first two components, the data can be visually interpreted to deduce whether a distinction exists between the endometriosis and control samples. This plot is known as the scores plot. Another informative plot in PCA is known as the loadings plot in which the importance of each variable in the separation of the data into different groups is highlighted.
PLS-DA is also used for the same purpose in literature. However, different from the PCA, PLS-DA is a supervised method and therefore requires a previous definition of class labels for each NMR spectrum. In the PLS-DA method, it is aimed to find a new projection space in which the covariance between the NMR data and the class labels is maximized. PLS-DA also provides a visual interpretation of the data through the two-dimensional scores plot that illustrates the separation between different classes. In addition to the scores plot, PLS-DA provides several other statistics such as variable importance in projection (VIP) that highlights the importance of each variable in projection and R2 and Q2 statistics, which help us to evaluate the predictive ability of the model.
Univariate statistical analysis
A statistical analysis was performed with the Statistics Package for Social Sciences version 11.0 (SPSS Inc., Chicago, IL, USA). Data are reported as mean ± standard deviation. The Pearson χ2 and Fisher exact test were used for categorical data. After the test for normality, the significantly upregulated metabolites that contributed to the discrimination between the ovarian endometriosis and the controls were examined using the Student t test. In the test, a p value of ≤0.05 indicates a statistically significant case.
Acknowledgments
We thank embryologist Nihan Tecellioğlu for the evaluation oocytes and embryos.
Disclosure statement
No potential conflict of interest was reported by the authors.
Additional information
Funding
Notes on contributors
Abdullah Karaer
Conception and design of the study, acquisition of data, drafting of the paper, and critical revision of the paper for important intellectual content: AK, GT; 1H-NMR analysis of the samples, analysis and interpretation of data, drafting of the article, and critical revision of the paper for important intellectual content: AM; Bioinformatics analysis and interpretation of data, drafting of the article, and critical revision of the paper for important intellectual content: BD. All authors gave their final approval of the version to be submitted and any revised version of this paper.
References
- Allaire C. 2006. Endometriosis and infertility: a review. J Reprod Med. 51:164–168.
- Anifandis GM, Dafopoulos K, Messini CI, Chalvatzas N, Liakos N, Pournaras S, Messinis I. 2010. Prognostic value of follicular fluid 25-OH vitamin D and glucose levels in IVF outcome. Reprod Biol Endocrinol. 8:91.
- ASRM and ESHRE Special Interest Group Embryology. 2011. Istanbul consensus workshop on embryo assessment: proceedings of an expert meeting. Reprod Biomed Online. 22:632–646.
- Barnhart K, Dunsmoor-Su R, Coutifaris C. 2002. Effect of endometriosis on in vitro fertilization. Fertil Steril. 77:1148–1155.
- Baskind NE, McRae C, Sharma V, Fisher J. 2011. Understanding subfertility at a molecular level in the female through the application of nuclear magnetic resonance (NMR) spectroscopy. Hum Reprod Update. 17:228–241.
- Bayasula IA, Kobayashi H, Goto M, Nakahara T, Nakamura T, Kondo M, Nagatomo Y, Kotani T, Kikkawa F. 2013. A proteomic analysis of human follicular fluid: comparison between fertilized oocytes and non-fertilized oocyte in the same patient. J Assist Reprod Genet. 30:1231–1238.
- Benagiano G, Brosens I. 1991. The history of endometriosis: identifying the disease. Hum Reprod. 6:963–968.
- Boland NI, Humpherson PG, Leese HJ, Gosden RG. 1993. Pattern of lactate production and steroidogenesis during growth and maturation of mouse ovarian follicles in vitro. Biol Reprod. 48:798–806.
- Bruker Manual. 2012. ERETIC2 user’s guide-preliminary. Billerica (MA).
- Edwards RG. 1974. Follicular fluid. J Reprod Fertil. 37:189–219.
- Emwas AHM, Salek RM, Griffin JL, Merzaban J. 2013. NMR-based metabolomics in human disease diagnosis: applications, limitations, and recommendations. Metabolomics. 9:1048–1072.
- Garrido N, Navarro J, Garcia-Velasco J, Remohi J, Pellicer A, Simon C. 2002. The endometrium versus embryonic quality in endometriosis-related infertility. Hum Reprod Update. 8:95–103.
- Gull I, Geva E, Lerner-Geva L, Lessing JB, Wolman I, Amit A. 1999. Anaerobic glycolysis: the metabolism of the preovulatory human oocyte. Eur J Obstet Gynecol. 85:225–228.
- Gupta S, Agarwal A, Agarwal R, de Mola JRL. 2006. Impact of ovarian endometrioma on assisted reproduction outcomes. Reprod Biomed Online. 13:349–360.
- Harlow CR, Winston RML, Margara RA, Hillier SG. 2010. Gonadotropic control of human granulosa cell-glycolysis. Hum Reprod. 25:949–956.
- Jana SK, Dutta M, Joshi M, Srivastava S, Chakravarty B, Chaudhury K. 2013. 1H NMR based targeted metabolite profiling for understanding the complex relationship connecting oxidative stress with endometriosis. Biomed Res Int. 2013:1–9.
- Lindon JC, Holmes E, Nicholson JK. 2003. So what’s the deal with metabonomics? Anal Chem. 1:385–391.
- Nicholson JK, Lindon JC, Holmes E. 1999. ‘Metabonomics’: understanding the metabolomics responses of living systems to pathophysiological stimuli via multivariate statistical analysis of biological NMR spectroscopic data. Xenobiotica. 29:1181–1189.
- Opøien HK, Fedorcsak P, Omland AK, Åbyholm T, Biercke S, Ertzeid G, Oldereid N, Mellembakken JR, Tanbo T. 2012. In vitro fertilization is a successful treatment in endometriosis-associated infertility. Fertil Steril. 97:912–918.
- Pinero-Sagredo E, Nunes S, de los Santos J, Celda B, Esteve V. 2010. NMR metabolic profile of human follicular fluid. NMR Biomed. 23:485–495.
- Revelli A, DellePiane L, Casano S, Molinari E, Massobrio M, Rinaudo P. 2009. Follicular fluid content and oocyte quality: from single biochemical markers to metabolomics. Reprod Biol Endocrinol. 7:40.
- Sanchez AM, Vigano P, Somigliana E, Panina-Bordignon P, Vercellini P, Candini M. 2013. The distinguishing cellular and molecular features of the endometriotic ovarian cyst: from pathophysiology to the potential endometrioma-mediated damage to the ovary. Hum Reprod Update. 20:217–230.
- Santonastaso M, Pucciarelli A, Costantini S, Caprio F, Sorice A, Capone F, Antonella N, Patrizia I, Nicola C, Emilio C. 2017. Metabolomic profiling and biochemical evaluation of the follicular fluid of endometriosis patients. Mol BioSyst. 13:1213–1222.
- Savelli L. 2009. Transvaginal sonography for the assessment of ovarian and pelvic endometriosis: how deep is our understanding? Ultrasound Obstet Gynecol. 33:497–501.
- Sinclair KD, Lunn LA, Kwong WY, Wonnacott K, Linforth RST, Craigon J. 2008. Amino acid and fatty acid composition of follicular fluid as predictors of in-vitro embryo development. Reprod Biomed Online. 16:859–868.
- Sutton-McDowall ML, Gilchrist RB, Thompson JG. 2003. Effects of in-vivo and in-vitro environments on the metabolism of the cumulus – oocyte complex and its influence on oocyte developmental capacity. Hum Reprod Update. 9:35–48.
- Sutton-McDowall ML, Gilchrist RB, Thompson JG. 2010. The pivotal role of glucose metabolism in determining oocyte developmental competence. Reproduction. 139:685–695.
- Suzuki T, Izumi S, Matsubayashi H, Awaji H, Yoshikata K, Makino T. 2005. Impact of ovarian endometrioma on oocytes and pregnancy outcome in in vitro fertilization. Fertil Steril. 83:908–913.
- Suzuki T, Watanabe R, Chika S, Yamazaki T, Matsushima R, Uchiha H, Takatsu A, Suzuki T. 2016. Quantitative nuclear magnetic resonance spectroscopy based on PULCON methodology: application to quantification of invaluable marine toxin, okadaic acid. Toxins. 8:294.
- Teresa W, Fan M. 1996. Metabolite profiling by one-and two-dimensional NMR analysis of complex mixtures. Prog Nucl Magn Reson Spectrosc. 28:161–219.
- Lo Turco EG, Cordeiro FB, Lopes PH, Gozzo FC, Pilau EJ, Soler TB, da Silva BF, Del Giudice PT, Bertolla RP, Fraietta R, et al. 2013. Proteomic analysis of follicular fluid from women with and without endometriosis: new therapeutic targets and biomarkers. Mol Reprod Dev. 80:441–450.
- Valckx SD, De Pauw I, Neubourg DD, Inion I, Berth M, Fransen E, Bols PE, Leroy JL. 2012. BMI-related metabolic composition of the follicular fluid of women undergoing assisted reproductive treatment and the consequences for oocyte and embryo quality. Hum Reprod. 27:3531–3539.
- Wider G, Dreier L. 2006. Measuring protein concentrations by NMR spectroscopy. J AM Chem Soc. 128:2571–2576.
- Wishart DS. 2007. Proteomics and the human metabolome project. Expert Rev Proteomics. 4:333–335.
- Xia L, Zhao X, Sun Y, Hong Y, Gao Y, Hu S. 2014. Metabolomic profiling of human follicular fluid from patients with repeated failure of in vitro fertilization using gas chromatography/mass spectrometry. Int J Clin Exp Pathol. 10:7220–7229.