
Abstract
Concern has been increasing over the impacts of incidental catches of river herring (Alewife Alosa pseudoharengus and Blueback Herring A. aestivalis) in commercial fisheries for Atlantic Herring Clupea harengus and Atlantic Mackerel Scomber scombrus, but historical information on mixed-species catches and their driving factors is lacking. We examined data from spring and fall bottom trawl surveys (National Oceanic and Atmospheric Administration, Northeast Fisheries Science Center) for temporal trends in overlap and potential ecosystem drivers of overlap trends. Species overlap changed substantially over time, with changes varying by season and region of the northeastern U.S. continental shelf. In the fall, changes in overlap were positively related to abundance in Georges Bank and southern New England. In the spring, most changes in species overlap were positively related to increasing species abundances. Positive relationships between overlap and abundance suggested that as species distributions increased with abundance, distributional overlap with other species increased as well. During the fall, changes in species overlap were positively related to bottom temperature in the Gulf of Maine, whereas in the spring, the relationship with bottom temperature was less consistent. Temperature-related changes in overlap implied that species distributions changed at different rates in response to climatic changes, thus leading to changes in overlap. Our findings suggest that fisheries management should take an adaptive approach to managing incidental catches by using region- and season-specific policies and should incorporate the effects of species abundances and climate change on species interactions.
Received September 28, 2015; accepted October 11, 2016
Mixing of pelagic marine fishes during migrations has been widely observed and has important ecological and management implications. Ecologically, mixed-species schools can alter the feeding and migration behaviors of the component species and can reduce an individual’s predation risk. Mixed schools complicate commercial fisheries management because harvests are limited by the species with the lowest catch limits, resulting in foregone harvest of species with higher catch limits. An understanding of the ecological factors influencing the occurrence of mixed schools can improve broader ecosystem knowledge and can inform fisheries management.
Several hypotheses have been proposed to explain the causes of and tradeoffs associated with mixed-species schools. The school trap hypothesis states that mixed schools are dominated by one species, and differences in swimming speeds, habitats, feeding grounds, or prey preferences can negatively impact the other species within the school (Bakun and Cury Citation1999). Most research supports the hypothesis that decreased predation risk is the primary motivation for a mixed-species school. Individual predation risk decreases as school size increases; therefore, if a population’s (or a species’) abundance is reduced to sufficiently low levels, the benefits of joining a mixed school can outweigh the associated costs (Cushing and Harden Jones Citation1968; Bakun and Cury Citation1999; Maes and Ollevier Citation2002). Hoare et al. (Citation2000) also found that mixed schools often comprise individuals of similar sizes and with similar phenotypes, which is likely related to comparable swimming capabilities. Therefore, the school trap hypothesis proposes that a population’s (or species’) overlap with other species increases as the population’s size decreases (Bakun and Cury Citation1999).
An opposite effect is proposed under the basin hypothesis, which states that overlap is greater at increased abundances. If a species’ habitat niche has a carrying capacity, then the abundance of that species will be correlated with its spatial distribution. MacCall (Citation1990) named this hypothesis “the basin model.” At low abundance, a species’ distribution will be limited to the most productive habitats; as abundance increases and as carrying capacity in the most productive habitats is approached, the spatial distribution of the species will expand into marginal, less-productive habitats. From this perspective, as a species’ abundance increases, the spatial distribution of that species will expand and is therefore more likely to overlap with the distributions of other species.
A third hypothesis, the thermal niche hypothesis, states that changes in ecological conditions such as temperature can cause changes in species overlap. A suite of ecosystem components is related to species distributions, including physiological requirements (e.g., temperature, salinity, and oxygen) and biotic interactions (e.g., prey availability and predation risk). Changes in ecological conditions can either shift distributions along a gradient or alter the extent of preferred habitat and therefore the extent of a species’ distribution. Changes in oceanic temperatures associated with climate variability and change have been shown to correlate with distribution changes for a wide variety of species, especially those that undertake substantial migrations (Murawski Citation1993; Perry et al. Citation2005; Hare et al. Citation2012; Lynch et al. Citation2015). On the northeastern U.S. continental shelf, mean summer sea surface temperatures and annual sea surface temperature variability have exhibited increases that are associated with changes in species distributions (Friedland and Hare Citation2007; Nye et al. Citation2009). Distributional overlap can either increase or decrease with increasing temperatures, depending on the rates at which the species’ distributions change.
The Atlantic Herring Clupea harengus, Atlantic Mackerel Scomber scombrus, Alewife Alosa pseudoharengus, and Blueback Herring A. aestivalis are small, pelagic schooling fishes that undertake seasonal migrations along the northeastern U.S. continental shelf and demonstrate some spatial and temporal overlap in their migrations (Shepherd Citation1986; Bethoney et al. Citation2014). Atlantic Herring and Atlantic Mackerel are commercially harvested throughout most of their ranges. In contrast, most fisheries for Alewives and Blueback Herring (managed collectively as “river herring”) are closed due to substantial declines in abundance throughout their ranges, but commercial fisheries for these species still operate on a limited basis under approved sustainable harvest plans. Alewives and Blueback Herring also are caught incidentally in the commercial fisheries for Atlantic Herring and Atlantic Mackerel, with incidental catches varying in space, time, and magnitude (Cieri et al. Citation2008; Cournane et al. Citation2013; Bethoney et al. Citation2014).
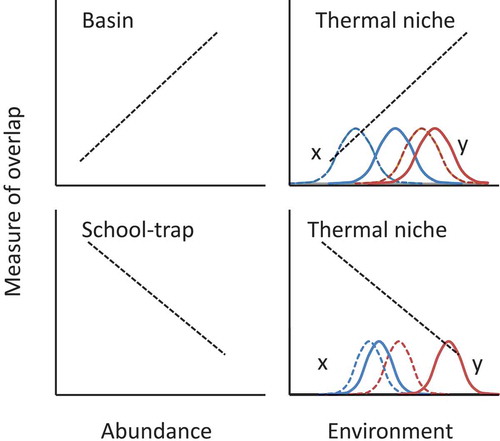
Although consistent fishery-dependent data on mixed catches extend back less than a decade (and large variances are associated with the estimates), fishery-independent data are available from as early as 1963. The Northeast Fisheries Science Center (NEFSC; National Oceanic and Atmospheric Administration [NOAA]) has conducted its annual fall bottom trawl survey since 1963 and its annual spring bottom trawl survey since 1968. All four species are caught regularly in the trawl surveys, and data from the surveys have been used in the stock assessments for Atlantic Herring and Atlantic Mackerel. Thus, we used data from the NEFSC spring and fall bottom trawl surveys to (1) examine distributional overlap among Alewives, Blueback Herring, Atlantic Herring, and Atlantic Mackerel and identify whether overlap has changed over time; and (2) test whether observed changes in the species’ overlap are related to abundance or to bottom temperature (as a proxy for climate effects). These tests were based on the school trap, basin, and thermal niche hypotheses ().
FIGURE 1. Predicted changes in species distributional overlap for three different hypotheses. The upper-left panel represents changes in overlap given that spatial distribution expands as abundance increases (basin model hypothesis). The lower-left panel illustrates how overlap would change as individuals join mixed schools at lower population levels (school trap hypothesis). The righthand panels illustrate how overlap could change as environmental and climatological conditions change (thermal niche hypothesis); curves illustrate the corresponding habitat shifts expected for species x and species y (dashed lines represent original habitats; solid lines indicate habitat shifts resulting from changing environmental conditions). Environmental changes could cause expansion of habitat niches (decreasing overlap) or could lead to a decrease or shift in current niches; overlap would also change if phenological response rates to changing environmental conditions differ between the species.
Here, we define “species overlap” as similar catch numbers and locations for two species within a given region, season, and year; species overlap was quantified by using the Bray–Curtis similarity index (BC index). Overlap refers to two species that were caught during a 30-min tow; thus, mixed schools and species that used proximate habitats could not be distinguished. Although salinity influences the distributions of all four species (Turner et al. Citation2016), it was not evaluated in this study because consistent salinity data (measured with conductivity–temperature–depth probes) have only been collected since the early 1990s (Holzwarth-Davis Citation1993). Early data for other variables that might also relate to climate change are lacking; thus, we used temperature as a proxy. All combinations of species pairs were examined for overlap trends and relationships with abundance and temperature to identify any overarching trends during each season and within each region.
METHODS
Study area
Alewives, Blueback Herring, Atlantic Herring, and Atlantic Mackerel undertake seasonal migrations across the northeastern U.S. continental shelf. Alewives and Blueback Herring are anadromous, and the marine portion of their migration includes coastal estuaries and open-shelf habitats out to depths of 200 m for the majority of the year (Fay et al. Citation1983). Little is known about the specific oceanic migration pathways or population mixing of Alewives or Blueback Herring. Atlantic Herring occur from North Carolina to Greenland and undertake seasonal migrations between (1) fall–early winter spawning grounds on Georges Bank and in the Gulf of Maine, (2) wintering areas in southern New England and the Mid-Atlantic Bight, and (3) summer feeding grounds in the Gulf of Maine (Stevenson and Scott Citation2005). Atlantic Mackerel are found from North Carolina to Newfoundland and Labrador. They overwinter predominantly along the continental shelf between the Mid-Atlantic Bight and Nova Scotia; spawning occurs in spring along the Newfoundland coast into the Gulf of St. Lawrence and in the Mid-Atlantic Bight. Atlantic Mackerel move north to the Gulf of Maine and Newfoundland for the summer (Sette Citation1950).
Data collection
Data used in this study were collected during the NEFSC’s bottom trawl surveys. The trawl surveys have consistently sampled the northeastern U.S. continental shelf from Cape Hatteras, North Carolina, to the U.S.–Canada border since 1963 (fall) and since 1968 (spring; ). In 2008, the NEFSC bottom trawl surveys transitioned to a new vessel with different gear and catchabilities; thus, only data collected prior to 2008 were included in the present study (Politis et al. Citation2014). The surveys use a stratified random sampling design and collect data on tow location and species-specific catch number and weight at each station (Politis et al. Citation2014). Temperature is recorded for every station within 10 m of the bottom, within 5.56 km (3 nautical miles) of the trawl path’s midpoint, and within 3 h of the start of trawling (Politis et al. Citation2014).
FIGURE 2. Map of the northeastern U.S. continental shelf, indicating the regions that were surveyed by the Northeast Fisheries Science Center (GOM = Gulf of Maine; GB = Georges Bank; SNE = southern New England; MAB = Mid-Atlantic Bight).
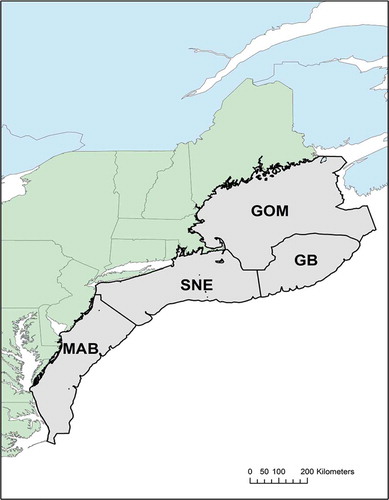
Data were summarized from each of four regions (Gulf of Maine, Georges Bank, southern New England, and Mid-Atlantic Bight; see ), each year, and each season (fall and spring) for analysis. Catch numbers of each species at each survey station were cube-root transformed to limit the influence of rare, very high catches. Here, we functionally define “overlap” as similar transformed catch numbers across stations within a given region and year. Overlap within a region during a given year was quantified by using the Bray–Curtis dissimilarity index (R package vegan, version 2.3-0),
where xsR = the transformed catch of species x at station s in region R; and ysR = the transformed catch of species y at station s in region R. The dissimilarity index was converted to a similarity index (BC index) by subtracting the value from 1 (e.g., an index of 1 indicates that the transformed catches were identical, whereas an index of 0 indicates that transformed catches differed at all stations). Bottom temperature was averaged for each region during a given season and year. The mean regional stratum-weighted abundance,
was used as a proxy for abundance, where = the mean stratum-weighted abundance of species x in region R; s = station; S = stratum; C = catch; n = the number of sampled stations; and ArS = the area of stratum S. The regional stratum-weighted abundances were likely confounded by changes in survey vessel and trawl configuration but were the best available estimates for this time series (NEFSC Citation2012). During each year, 40–200 stations were sampled in a given region and season. Our analysis included a 40-year time series of spring bottom trawl data and a 45-year time series of fall bottom trawl data.
Data analysis
Beta regression (R package betareg, version 3.0-5) was used to test whether the BC indices in each season and region changed significantly throughout the time series and to identify variables that were significantly related to changes in the BC index. Beta regression (a specialized form of maximum likelihood regression analysis) was developed for modeling data, assuming values with ranges of (0, 1) (Cribari-Neto and Zeileis Citation2010). The logit link, which log transforms the response variable and assumes logistically distributed errors, was used for character specification in the mean model (µ), and the identity link was used for character specification in the precision model (φ). The precision parameter reflects the variance of the response, where larger values indicate lower variance. The dependent variable was the BC index for two species within a given region during a given year. For beta regression, the proportions must be within the open unit interval (0, 1), so we transformed the data to remove extreme values (proportion × {[n – 1] + 0.5}/n, where n is the sample size; Smithson and Verkuilen Citation2006; Cribari-Neto and Zeileis Citation2010). To test for significant temporal trends, we used year as the independent variable. For the ecological models, mean stratum-weighted abundance of species x (), mean stratum-weighted abundance of species y (
), and mean bottom temperature (
) were the independent variables tested for model inclusion. Models were evaluated within regions in the given season and year (i = region/season/year),
Akaike’s information criterion corrected for small sample size (AICc) was calculated for all possible models, and the AICc values were compared to determine the best model; this was done for all possible combinations of overlap between species pairs within each region and season. Normality and residual plots were examined to ensure that model assumptions were met.
Overlap in the Mid-Atlantic Bight during the fall was not modeled because the data included very few nonzero observations. Models were not run when few (<5) co-occurrence observations were documented (three species’ combinations in Georges Bank during the fall). The results of models for all species’ combinations, seasons, and regions are included in Supplementary Tables S.1 and S.2 (available separately online with this article). Log-transformed total catches for each species in each region were plotted against the number of stations at which the species was caught to further examine whether range expansion was related to abundance (in accordance with the basin hypothesis).
We expected that if the school trap hypothesis applied to these species, then overlap would decrease as the species’ abundances increased. If the basin hypothesis was applicable, then overlap would increase as species’ abundances increased. If the thermal niche hypothesis was applicable, then overlap would be related to changes in temperature.
RESULTS
Changes in Overlap
The BC indices for species overlap and temporal trends in overlap varied among species combinations, between seasons, and among regions. Overlap increased for 20 of the 42 species combinations, decreased for 2 combinations, and exhibited no significant trend for the remaining combinations. During the fall survey, the study species were rarely observed in the Mid-Atlantic Bight, and no overlap was observed (, S.1–S.5). Overlap for most of the species combinations in Georges Bank and southern New England was also generally low, with only one significant (decreasing) temporal trend in each region (Alewives and Atlantic Herring in Georges Bank: BC index = 0.33–1.00; Alewives and Atlantic Mackerel in southern New England: BC index = 0.55–1.00; ; , S.1). In the Gulf of Maine, overlap increased consistently over time, resulting in significant temporal trends in overlap for all species pairs (minimum BC index = 0.33–0.78; maximum BC index = 1.0; P < 0.02; ; , S.1).
TABLE 1. Summary of beta regression models for changes in Bray–Curtis similarity indices for species overlap observed during the Northeast Fisheries Science Center’s fall bottom trawl survey (AW = Alewife; BB = Blueback Herring; AH = Atlantic Herring; AM = Atlantic Mackerel). Each region (GOM = Gulf of Maine; GB = Georges Bank; SNE = southern New England) was modeled separately (the independent variable was year). Data from the Mid-Atlantic Bight are omitted here (as were select other models) because there were few Alewife and Blueback Herring observations. The phi coefficient reflects the variance of the response, and the direction of significant (P < 0.05) trends is noted.
FIGURE 3. Bar chart showing the number of Bray–Curtis similarity indices of species overlap combinations that significantly increased, significantly decreased, or showed no significant changes throughout the time series for each region (GOM = Gulf of Maine; GB = Georges Bank; SNE = southern New England; MAB = Mid-Atlantic Bight) and each season (fall or spring).
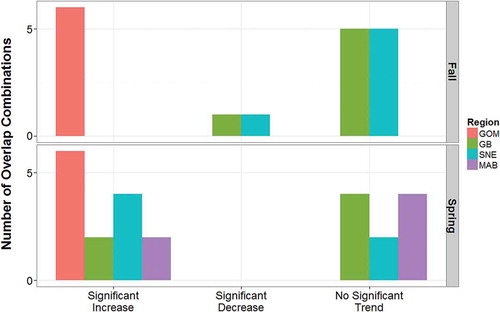
During the spring survey, overlap was observed more frequently and increased with time for many species combinations and regions. Overlap for all species pairs increased significantly in the Gulf of Maine, with minimum BC index values ranging from 0.33 to 0.65 and maximum BC index values ranging from 0.82 to 1.00 (P < 0.02; ; , S.1). In Georges Bank, overlap trends were less consistent: overlap increased for two combinations (BC index = 0.53–1.00 and 0.41–1.00), but the other four combinations exhibited no trend (; , S.1). Overlap in southern New England increased for four species combinations (minimum BC index = 0.39–0.48; maximum BC index = 0.78–1.00), but for the other two combinations, no significant trend was observed (; , S.1). Overlap in the Mid-Atlantic Bight increased significantly for two species combinations (BC index = 0.36–1.00 and 0.43–1.00; P < 0.02), whereas no significant changes in overlap were observed for the other seven combinations (P > 0.10; ; , S.1).
TABLE 2. Summary of beta regression models for changes in Bray–Curtis similarity indices for species overlap observed during the Northeast Fisheries Science Center’s spring bottom trawl survey (AW = Alewife; BB = Blueback Herring; AH = Atlantic Herring; AM = Atlantic Mackerel). Each region (GOM = Gulf of Maine; GB = Georges Bank; SNE = southern New England; MAB = Mid-Atlantic Bight) was modeled separately (independent variable was year; overlap combinations with fewer than five observations were not modeled). The phi coefficient reflects the variance of the response, and the direction of significant (P < 0.05) trends is noted.
Influences on Changes in Overlap
The beta regression models for species overlap differed among species combinations and between seasons, although some general trends were evident. The effect of temperature varied between seasons, among regions, and among species combinations, but it was significant (and was the only variable) in all of the fall models for the Gulf of Maine. The relationship between overlap and abundance was significant for 35 of the 42 regional/seasonal models. Furthermore, the coefficient for species abundance was positive in all of the fall models for Georges Bank and southern New England and in all but two spring models (one was not significant; one had mixed effects of both species’ abundances). The log catch within each region for each species generally increased as the number of stations with observations increased (Figure S.5).
In the fall survey, changes in overlap were related to abundance and temperature, and the associated ecological driver varied among regions. In Georges Bank and southern New England, positive associations with abundance were observed for all species combinations (). In the Gulf of Maine, the temperature model was selected for all overlap combinations, and temperature was positively associated with species overlap (). Temperature was negatively associated with overlap between Alewives and Blueback Herring in Georges Bank; negatively associated with overlap between Atlantic Herring and Atlantic Mackerel in southern New England; and positively associated with overlap between Alewives and Atlantic Mackerel in southern New England ().
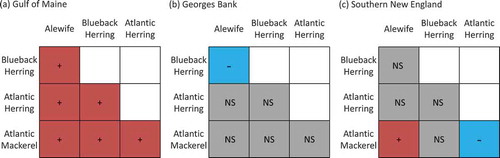
FIGURE 4. Raster diagrams illustrating the effects of species abundances on overlap observed during the Northeast Fisheries Science Center’s fall bottom trawl survey in (a) the Gulf of Maine, (b) Georges Bank, and (c) southern New England (red, + = positive effect; blue, – = negative effect; gray, NS = no significant effect). (No abundance effects were observed in the Gulf of Maine; negligible overlap was observed in the Mid-Atlantic Bight.)
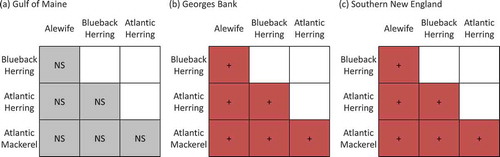
FIGURE 5. Raster diagrams illustrating the effects of bottom temperature on overlap observed during the Northeast Fisheries Science Center’s fall bottom trawl survey in (a) the Gulf of Maine, (b) Georges Bank, and (c) southern New England (red, + = positive effect; blue, – = negative effect; gray, NS = no significant effect). (Negligible overlap was observed in the Mid-Atlantic Bight.)
In the spring, models that included the abundances of one or both species in a pair were selected for all regional overlap combinations except Alewives and Atlantic Mackerel in Georges Bank, and the association was positive for most models (). The exception was overlap between Blueback Herring and Atlantic Herring in southern New England, where the effect of abundance was mixed: a positive effect of Blueback Herring abundance (slope = 0.22; P < 0.001) and a negative effect of Atlantic Herring abundance (slope = –0.003; P = 0.02) were detected. Seven of the 24 regional overlap models included temperature, with positive associations in two models and negative associations in the other five models ().
FIGURE 6. Raster diagrams illustrating the effects of species abundances on overlap observed during the Northeast Fisheries Science Center’s spring bottom trawl survey in (a) the Gulf of Maine, (b) Georges Bank, (c) southern New England, and (d) the Mid-Atlantic Bight (red, + = positive effect; blue, – = negative effect; gray, NS = no significant effect).
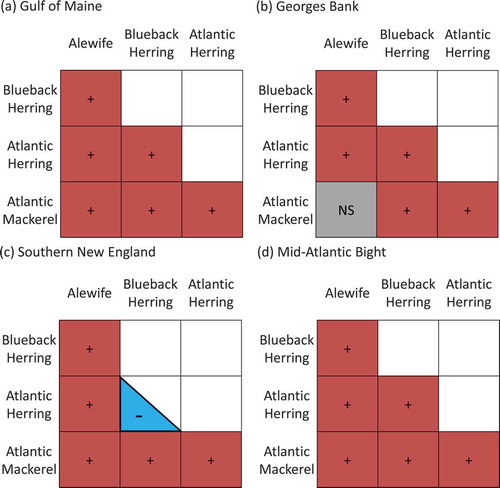
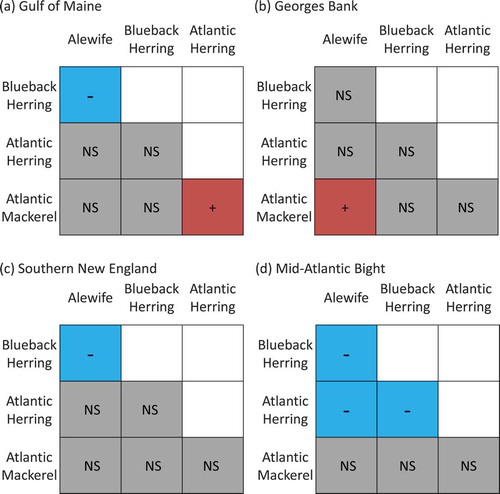
FIGURE 7. Raster diagrams illustrating the effects of bottom temperature on overlap observed during the Northeast Fisheries Science Center’s spring bottom trawl survey in (a) the Gulf of Maine, (b) Georges Bank, (c) southern New England, and (d) the Mid-Atlantic Bight (red, + = positive effect; blue, – = negative effect; gray, NS = no significant effect).
DISCUSSION
Recent attention has focused on the potential population-level effects of incidental Alewife and Blueback Herring catches in the commercial Atlantic Herring and Atlantic Mackerel fisheries, yet little attention has been directed toward identifying the ecological drivers of incidental catches (i.e., overlap in the species’ distributions). All four species make extensive annual migrations for feeding and spawning and exhibit partially overlapping habitat associations, which therefore explains some of the observed regional variations in overlap (Sette Citation1950; Fay et al. Citation1983; Kelly and Moring Citation1986; Turner et al. Citation2016). Overlap for the species combinations we examined generally increased throughout the study period. Changes in overlap have important ecological and management implications. We used existing ecological hypotheses to identify and evaluate variables that were potentially related to changes in overlap. The significant positive effect of co-occurring species’ abundances on overlap suggested that the distributions of these fish expanded as their abundances increased, thereby increasing the degree of species overlap. The effect of abundance on overlap was most substantial during the spring, and the relationship was always positive. The effect of temperature was most substantial in the fall, with a positive relationship for Gulf of Maine overlap models, whereas in spring models, the relationship with temperature (when significant) varied. The significance of temperature suggests that differences in these species’ response rates to climate change, as previously reported by Nye et al. (Citation2009), cause overlap to change as the temperature changes, but the effect varies seasonally. The school trap hypothesis was probably not relevant to the observed changes in species overlap because the effect of abundance on overlap was generally not negative.
Changes in Overlap
Species’ distributional overlap changed substantially over the 40 years of observations, and the changes varied between seasons and among regions. Generally, the most notable changes were observed in the Gulf of Maine during the fall and spring and in southern New England during the spring. Multiple studies have examined recent (2000–2012) patterns in river herring (combined Alewives and Blueback Herring) incidental catches in the fisheries for Atlantic Herring and Atlantic Mackerel (Cieri et al. Citation2008; Cournane et al. Citation2013; Bethoney et al. Citation2014). These fishery-dependent studies found that the highest frequency and volume of incidental catches were obtained in the Gulf of Maine during summer and fall and in southern New England during winter and early spring; their results are consistent with the trends we observed for fishery-independent data.
Nye et al. (Citation2009) found that distributions for 24 of 36 stocks on the northeastern U.S. continental shelf demonstrated significant shifts poleward and to deeper habitats; the poleward shift in Alewives was greater than that observed for Atlantic Herring and Atlantic Mackerel (Blueback Herring were not included in their analysis). The rates of poleward shift could be related to increasing overlap if a species with a higher rate of poleward shift is originally distributed south of a species with a slower rate of poleward shift; if the species with the higher rate of poleward shift is originally distributed north of the other species, then overlap will decrease. Different rates of poleward shift are consistent with our observations of the highly variable and sometimes decreasing (although nonsignificant) trends in overlap occurring in the Mid-Atlantic Bight during spring. Different rates of poleward shift are further supported by the increasing overlap of (1) all species combinations in the Gulf of Maine during both seasons and (2) four of the six species combinations in southern New England during spring. Substantially less overlap was consistently observed for any species combinations during the fall in Georges Bank, southern New England, or the Mid-Atlantic Bight; this is also consistent with analyses of river herring incidental catch and the poleward shift in Alewife marine distributions (Cieri et al. Citation2008; Nye et al. Citation2009; Cournane et al. Citation2013; Bethoney et al. Citation2014; Turner et al. Citation2016).
Increased observer coverage has provided some insight into the seasonality and regions in which incidental catches of Alewives and Blueback Herring are most common (Cieri et al. Citation2008; Cournane et al. Citation2013; Bethoney et al. Citation2014). Unfortunately, consistent observer coverage and reporting of nontarget catches only began in 2008 with Amendment 2 to the Atlantic Herring Fishery Management Plan and Amendment 12 to the Mackerel, Squid, and Butterfish Fishery Management Plan (50 Code of Federal Regulations Part 648). Furthermore, due to time limitations and identification issues, observer data for river herring catches were not historically parsed out by species. Continued monitoring and reporting of when and where incidental catches occur are critical to improving our understanding of how these catches change spatially and temporally over longer time scales. Additionally, these observations can be combined with satellite or modeled oceanographic data, thus allowing the relationship between incidental catches and environmental conditions to be examined.
Influences on Changes in Overlap
The significance of abundance suggests that increasing species overlap is the result of range expansion as population size increases (i.e., consistent with the basin hypothesis) or that the benefits of mixed schools outweigh the costs at higher abundances. Alewives, Blueback Herring, Atlantic Herring, and Atlantic Mackerel do not undergo alternating, large-amplitude fluctuations in abundance, which are generally characteristic of species that are used to illustrate the school trap hypothesis (Bakun and Cury Citation1999; Bakun Citation2001); hence, the school trap hypothesis is unlikely to provide the best explanation of variability in overlap for these species. The significance of abundance for species overlap may suggest that the benefits of reduced predation risk increase as a function of increasing school size (Cushing and Harden Jones Citation1968). The caveat with our study is that “overlap” was defined as the capture of two species in the same 30-min tow; thus, true mixed schools were pooled with species that use proximate—but discrete—habitats. Therefore, the findings reported here are more practically than ecologically applicable. Sampling over smaller spatial scales or the use of different sampling technologies (e.g., video monitoring) might provide better insights into the extent of spatial overlap among these species. Similarly, temporal sampling at a finer resolution could be informative. Some degree of seasonal and spatial overlap is to be expected as a function of similarities in feeding seasons, feeding grounds, or prey; conversely, minimal overlap would be expected between river herrings and Atlantic Herring or Atlantic Mackerel during the spawning season.
Sea surface temperature has been increasing along the northeastern U.S. continental shelf (Friedland and Hare Citation2007), and these increasing temperatures have been linked to distributional shifts in a wide range of species, including Alewives, Blueback Herring, Atlantic Herring, and Atlantic Mackerel (Murawski Citation1993; Nye et al. Citation2009; Overholtz et al. Citation2011; Lynch et al. Citation2015). Similar trends of poleward shifts in species distributions associated with warming waters have been observed in the North Sea (Perry et al. Citation2005) and the Bering Sea (Mueter and Litzow Citation2008). Additionally, for a variety of species found on the northeastern U.S. continental shelf (including Alewives and Blueback Herring), species’ abundance has been linked to their vulnerability to climate change effects (Nye et al. Citation2009; Hare et al. Citation2012; Lynch et al. Citation2015).
Stock assessments have detected changes in species’ catchability in the NEFSC bottom trawl survey, and those changes were attributed to the use of different trawl doors (NEFSC Citation2012). Additionally, changes in the abundance of pelagic species or their predators can affect catchability (McQuinn Citation2009). Although these effects could influence our results, the proportion of stations at which each species was caught in each region changed by less than 2% throughout the time series (Figure S.3). Similarly, any changes in catch numbers related to gear changes may have influenced the independent abundance estimates, but they should not have affected the BC index values, especially after the catches were cube-root transformed. Experiments that are designed to evaluate the potential effects of changes in gear and species interactions on abundance and distribution estimates would be valuable for application to future ecological studies and stock assessments.
Our findings suggest that both climate and species abundance affect the degree of spatial overlap, providing evidence that the basin hypothesis and the thermal niche hypothesis are both relevant. Similarly, Nye et al. (Citation2009) found that although species distributions shifted in response to climate change, distributional area was also related to abundance. Similar relationships were observed for the groundfish community of Georges Bank, with proportional co-occurrence related to temperature–depth overlap and the abundances of individual species (Murawski and Finn Citation1988). Thus, we can expect that species distributions, climate vulnerability, and spatial overlap with other species will all vary with climate and abundance (Murawski and Finn Citation1988; Murawski Citation1993; Nye et al. Citation2009; Hare et al. Citation2012; Lynch et al. Citation2015). Our results, together with those of previous studies, highlight the importance of long-term ecological monitoring. Future fisheries management should include consideration of the synergistic effects of climate change and species abundance to ensure long-term sustainability and minimize ecosystem impacts. Additionally, management policies should consider that fisheries and ecosystems are not static; the development of adaptive management policies that are focused on regional and seasonal scales would be ideal. Furthermore, if river herring abundance increases, incidental catch will increase, making fixed incidental catch rates increasingly restrictive. If river herring abundance decreases, the effects of static catch limits on populations will be increasingly less protective. In the future, these findings could be combined with Alewife and Blueback Herring genetic data and population or regional abundance data so that catch limits can be adjusted annually for each region based on local abundances.
1255683_Supplement.pdf
Download PDF (457.8 KB)ACKNOWLEDGMENTS
Funding for this research was provided by the NOAA Greater Atlantic Regional Fisheries Office. The NEFSC Ecosystems Surveys Branch performed all data collection. Acknowledgement of the above entities does not imply their endorsement of the work; the authors have sole responsibility for the content of this contribution. The views expressed herein are those of the authors and do not necessarily reflect the views of the NOAA or any of its subagencies.
REFERENCES
- Bakun, A. 2001. “School-mix feedback”: a different way to think about low frequency variability in large mobile fish populations. Progress in Oceanography 49:485–511.
- Bakun, A., and P. Cury. 1999. The “school trap”: a mechanism promoting large-amplitude out-of-phase population oscillations of small pelagic fish species. Ecology Letters 2:349–351.
- Bethoney, N. D., K. D. E. Stokesbury, and S. X. Cadrin. 2014. Environmental links to alosine at-sea distribution and bycatch in the Northwest Atlantic midwater trawl fishery. ICES Journal of Marine Science 71:1246–1255.
- Cieri, M., G. Nelson, and M. A. Armstrong. 2008. Estimates of river herring bycatch in the directed Atlantic Herring fishery. Report prepared for the Atlantic States Marine Fisheries Commission, Washington, D.C.
- Cournane, J. M., J. P. Kritzer, and S. J. Correia. 2013. Spatial and temporal patterns of anadromous alosine bycatch in the U.S. Atlantic Herring fishery. Fisheries Research 141:88–94.
- Cribari-Neto, F., and A. Zeileis. 2010. Beta regression in R. Journal of Statistical Software [online serial] 34:Issue 2.
- Cushing, D. H., and F. R. Harden Jones. 1968. Why do fish school? Nature 218:918–920.
- Fay, C. W., R. J. Neves, and G. B. Pardue. 1983. Species profiles: life histories and environmental requirements of coastal fishes and invertebrates (Mid-Atlantic)—Alewife/Blueback Herring. U.S. Fish and Wildlife Service FWS/OBS-82111.9 and U.S. Army Corps of Engineers, Technical Report EL-82-4, Vicksburg, Mississippi.
- Friedland, K. D., and J. A. Hare. 2007. Long-term trends and regime shifts in sea surface temperature on the continental shelf of the northeast United States. Continental Shelf Research 27:2313–2328.
- Hare, J. A., J. P. Manderson, J. A. Nye, M. A. Alexander, P. J. Auster, D. L. Borggaard, A. M. Capotondi, K. B. Damon-Randall, E. Heupel, I. Mateo, L. O’Brien, D. E. Richardson, C. A. Stock, and S. T. Biegel. 2012. Cusk (Brosme brosme) and climate change: assessing the threat to a candidate marine fish species under the U.S. Endangered Species Act. ICES Journal of Marine Science 69:1753–1768.
- Hoare, D. J., G. D. Ruxton, J.-G. J. Godin, and J. Krause. 2000. The social organization of free-ranging fish shoals. Oikos 89:546–554.
- Holzwarth-Davis, T. 1993. Test and evaluation of the SBE 19 Seacat Profiler. National Oceanic and Atmospheric Administration, Northeast Fisheries Science Center, Reference Document 93-10, Woods Hole, Massachusetts.
- Kelly, K. H., and J. R. Moring. 1986. Species profiles: life histories and environmental requirements of coastal fishes and invertebrates (North Atlantic). Atlantic Herring. U.S. Fish and Wildlife Service Biological Report 82(11.38) and U.S. Army Corps of Engineers, TR EL-82-4, Vicksburg, Mississippi.
- Lynch, P. D., J. A. Nye, J. A. Hare, C. A. Stock, M. A. Alexander, J. D. Scott, K. L. Curti, and K. Drew. 2015. Projected ocean warming creates a conservation challenge for river herring populations. ICES Journal of Marine Science 72:374–387.
- MacCall, A. D. 1990. Dynamic geography of marine fish populations. University of Washington Press, Seattle.
- Maes, J., and F. Ollevier. 2002. Size structure and feeding dynamics in estuarine clupeoid fish schools: field evidence for the school trap hypothesis. Aquatic Living Resources 15:211–216.
- McQuinn, I. H. 2009. Pelagic fish outburst or suprabenthic habitat occupation: legacy of the Atlantic Cod (Gadus morhua) collapse in eastern Canada. Canadian Journal of Fisheries and Aquatic Sciences 66:2256–2262.
- Mueter, F. J., and M. A. Litzow. 2008. Sea ice retreat alters the biogeography of the Bering Sea continental shelf. Ecological Applications 18:309–320.
- Murawski, S. A. 1993. Climate change and marine fish distributions: forecasting from historical analogy. Transactions of the American Fisheries Society 122:647–658.
- Murawski, S. A., and J. T. Finn. 1988. Biological bases for mixed-species fisheries: species co-distribution in relation to environmental and biotic variables. Canadian Journal of Fisheries and Aquatic Sciences 45:1720–1735.
- NEFSC (Northeast Fisheries Science Center). 2012. 54th Northeast regional stock assessment workshop (54th SAW) assessment report. National Oceanic and Atmospheric Administration, NEFSC, Reference Document 12-18, Woods Hole, Massachusetts.
- Nye, J. A., J. S. Link, J. A. Hare, and W. J. Overholtz. 2009. Changing spatial distribution of fish stocks in relation to climate and population size on the northeast United States continental shelf. Marine Ecology Progress Series 393:111–129.
- Overholtz, W. J., J. A. Hare, and C. M. Keith. 2011. Impacts of interannual environmental forcing and climate change on the distribution of Atlantic Mackerel on the U.S. Northeast continental shelf. Marine and Coastal Fisheries: Dynamics, Management, and Ecosystem Science [online serial] 3:219–232.
- Perry, A. L., P. J. Low, J. R. Ellis, and J. D. Reynolds. 2005. Climate change and distribution shifts in marine fishes. Science 308:1912–1915
- Politis, P. J., J. K. Galbraith, P. Kostovick, and R. W. Brown. 2014. Northeast Fisheries Science Center bottom trawl survey protocols for the NOAA Ship Henry B. Bigelow. National Oceanic and Atmospheric Administration, Northeast Fisheries Science Center, Reference Document 14-06, Woods Hole, Massachusetts.
- Sette, O. E. 1950. Biology of the Atlantic Mackerel (Scomber scombrus) of North America, part II: migrations and habits. U.S. Fish and Wildlife Service Fishery Bulletin 51:251–358.
- Shepherd, G. 1986. Evaluation of the river herring by-catch in the mackerel fishery. Woods Hole Laboratory, Reference Document 86-10, Woods Hole, Massachusetts.
- Smithson, M., and J. Verkuilen. 2006. A better lemon squeezer? Maximum-likelihood regression with beta-distributed dependent variables. Psychological Methods 11:54–71.
- Stevenson, D. K., and M. L. Scott. 2005. Essential fish habitat source document: Atlantic Herring, Clupea harengus, life history and habitat characteristics, second edition. National Oceanic and Atmospheric Administration Technical Memorandum NMFS-NE-192.
- Turner, S. M., J. P. Manderson, D. E. Richardson, J. J. Hoey, and J. A. Hare. 2016. Using habitat association models to predict Alewife and Blueback Herring marine distributions and overlap with Atlantic Herring and Atlantic Mackerel: can incidental catches be reduced? ICES Journal of Marine Science 73:1912–1924.