
 ?Mathematical formulae have been encoded as MathML and are displayed in this HTML version using MathJax in order to improve their display. Uncheck the box to turn MathJax off. This feature requires Javascript. Click on a formula to zoom.
ABSTRACT
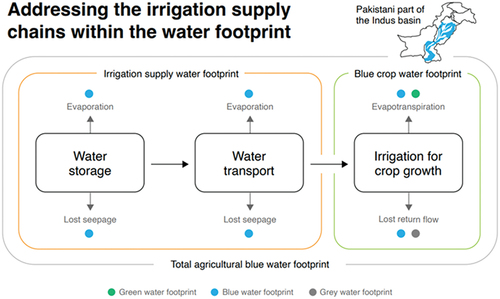
Many environmental studies have shown that a systems approach, including complete supply chains, is relevant for the assessment of the consequences of production and consumption on natural resources. This can also be applied to water. Although water consumption also includes water supply chains, often irrigation supply chains are excluded in water footprint (WF) studies. Using information from water management studies on water losses, we propose an improved WF method that includes blue crop WFs and WFs of irrigation supply chains indicating total agricultural blue WFs. A systems approach considering not only irrigation technology but whole water supply chains, also distinguishing between surface and groundwater, is needed to improve efficient blue water use in agriculture. This method is applied to the Pakistani part of the Indus basin that includes the largest man-made irrigation network in the world. The total agricultural blue WF is 1.6 times the blue crop WF. Surface water losses vary between 45 and 49%, groundwater losses between 18 and 21% and are smaller than results from water management studies. Differences between provinces and canal commands are large. The identification of hotspots provides a tool to improve water management. Earlier WF studies might have underestimated agricultural water consumption if supply chains are neglected. More water efficient agriculture should take supply chain losses into account probably requiring water management adaptations, which is more a policy than an agriculture task. WFs of supply chains are also relevant for other sectors, like industry or municipal water supply.
GRAPHICAL ABSTRACT
1. Introduction
1.1. Water as a scarce resource
Globally, freshwater of good quality is a scarce natural resource in many river basins. The International Panel on Climate Change (IPCC) has shown that climate change with extreme weather events negatively affects the hydrological cycle making water availability more vulnerable (Caretta et al., Citation2022). The Organization for Economic Co-operation and Development (OECD) has indicated that in the future, agriculture will encounter large water shortages, especially in China, the US, and India (OECD Citation2017). This has large impacts on societies, creating huge water scarcity problems affecting around four billion people (Mekonnen and Hoekstra Citation2016). Today, water management strongly influences water flows and consumption in river basins. Water-scarce countries, such as those in the Middle East, import water-intensive agricultural products for their growing populations (Allan Citation1993, Citation2003, Citation2004). In this way, they compensate for water shortages making use of water resources elsewhere.
Agriculture is the most important water consuming sector amounting to about 85% of total consumption (Pfister and Bayer Citation2013). The OECD (Citation2017) has shown that many countries will face water risks for agriculture in the future, including Pakistan in the top 10 countries at risk. When rainwater becomes more scarce, especially in agriculture, the largest water user, often irrigation is needed and applied. An irrigation water supply chain can be complicated and long and is often part of a larger supply network. For example, irrigation supply chains in the Pakistani part of the Indus basin include storage reservoirs, dams, barrages, and canals (Stewart et al. Citation2018). Water is lost from the reservoirs and canals, because it evaporates or seeps to groundwater (Yuguda et al. Citation2020). Habib (Citation2010) has shown that water losses in irrigation supply in Pakistan are 40 to 50% of the total water withdrawal. The efficiency of the irrigation system is affected by the way of water transportation, the condition of the canal system and irrigation technology (Luan et al. Citation2018). Especially poor canal maintenance causes inefficient water supply to the crop fields (Siyal et al. Citation2021).
1.2. Water quantification studies
Environmental sciences focus on complex issues that need an integration of knowledge from several disciplines (Kroeze Citation2009). An important historical development has been the introduction of life cycle thinking and systems approaches taking whole production chains into account, from cradle to grave (Boersema et al. Citation1984). Applied to energy, for example, the terminology of embodied or virtual energy was introduced to account for energy flows through systems (Costanza Citation1979). Life cycle thinking can also be applied to other natural resources (Moll Citation1993), such as water. Adopted from the energy studies, Allan (Citation1993) has introduced the term “embedded water” indicating the importance of water coming along with imported products through trade flows. Allan later renamed it into “virtual water” defined as the water needed to produce agricultural commodities. The introduction of the ecological footprint showed the importance of human consumption on land use (Wackernagel et al. Citation1993). Applied to water, and combining production and consumption, Hoekstra quantified and further elaborated the virtual water concept and introduced the “water footprint” (WF) in 2002, defined as the freshwater resources, used, consumed or polluted, to produce a commodity in the full supply chain (Hoekstra Citation2003) and distinguishing between green WFs (precipitation), blue WFs (irrigation water from ground or surface water) and grey WFs (freshwater volumes to assimilate polluted water to accepted quality standards). When combined with consumption, the WF of a business, consumer or country becomes available. These results can be applied to benchmarking purposes or response formulation to decrease freshwater use (Hoekstra et al. Citation2011). Efforts to decrease natural resource use, such as water, or to decrease emissions, such as greenhouse gas emissions, require a systems approach that takes a complete life cycle or supply chain into account. The first WF studies quantified crop WFs, e.g. Chapagain and Hoekstra (Citation2004) calculated WFs per crop per country at a global scale. The database was updated by Mekonnen and Hoekstra (Citation2010a, Citation2010b) and presently forms a data source for many WF studies. However, to calculate the WF of an agricultural product, the studies only took crop evapotranspiration from the crop which was taken into account, but excluded virtual water related to the irrigation supply chain was excluded.
In the WF manual, Hoekstra et al. (Citation2011) already indicated that not only crop evapotranspiration but also consumption or blue WFs related to water storage, transport, and irrigation should be accounted for. WFs of irrigation were calculated by Schyns et al. (Citation2014) who assessed the WF of Morocco using canal and field irrigation efficiencies in combination with the fraction of evaporative losses from canals. In Morocco, 15% of the blue WF of agriculture is related to losses in irrigation water supply. Schyns et al. (Citation2014) showed that excluding WFs of irrigation would mean that the blue WF of agricultural crops calculated based on crop evapotranspiration underestimates blue WFs, because there are preceding links in a longer chain, so that blue WFs are probably larger than the ones based on evapotranspiration alone. Another example of the importance of taking complete supply chains into account is the study of Lauvaux et al. (Citation2022) showing the huge methane losses in the supply chain of natural gas that so far were excluded in life cycle inventory studies, or the study of Winkler and Winiwarter (Citation2015) who have shown that greenhouse gas emissions from livestock can differ by a factor of 2 depending on the system boundary.
Water management studies address irrigation losses using a terminology of net and gross irrigation water requirements, where net requirements exclude losses occurring during conveyance, distribution, and field application, as opposed to gross irrigation water requirements (FAO Citation2021). Yuguda et al. (Citation2020) quantified the blue WF of water storage and conveyance for irrigation, including seepage losses from a canal system. Their study, however, does not differentiate between seepage to accessible and non-accessible water stocks. Cao et al. (Citation2014), Sun et al. (Citation2016) and Luan et al. (Citation2018) carried out regional level irrigation WF accounting using a water balance approach and information on irrigation efficiencies to estimate irrigation water losses. Feng et al. (Citation2021) emphasized the importance of water losses during the delivery processes, indicating that irrigation supply losses are relatively large and affect the WF values. Singh et al. (Citation2022) showed WF saving potential at the field scale through advanced irrigation methods. The studies mentioned above used a water management approach that deviates from the WF concept, because part of the lost water might remain available for consumption, e.g. in groundwater stocks. If this occurs in the same basin and to an accessible freshwater groundwater stock, the WF concept considers this water as not consumed because it can be used again. If the water seeps to saline groundwater stocks, it is a real loss and should be accounted for. Consumptive water use in one part of a catchment or basin can impact on water users elsewhere in the catchment or basin. To account for this phenomenon, some studies proposed a fractional water accounting analysis which draws attention to the relevance of return flows and differences between water consumptive use (beneficial and non-beneficial) and non-consumptive use (recoverable and non-recoverable flows) in space and time (Perry et al. Citation2009; Gleick et al. Citation2011; Batchelor et al. Citation2017). The fractional water accounting approach draws a better understanding of hydrological behaviour within a river basin compared to the traditional water management approach. Together with the WF concept, it would provide a more complete picture of the freshwater system in a specific catchment or basin.
1.3. Research gap
An integrated assessment of agricultural water consumption, i.e. the quantification of the water volumes not available anymore at a specific location or time, requires a systems approach, combining knowledge from different disciplines, like water management and WF studies. Traditionally, irrigation water losses were addressed in water management and expressed as irrigation efficiency, which is the “ratio of crop water consumption by crops to total water withdrawals” (Israelsen Citation1950). The proportion of irrigation water not reaching the crop is classified as a loss or an “inefficiency” (Pérez-Blanco et al. Citation2020). There are many studies giving information on irrigation efficiencies, e.g. in the Indus basin irrigation system (IBIS) of Pakistan. For example, Hussain et al. (Citation2011) quantified a 35% irrigation efficiency (including canal, watercourse, field channel, and field application efficiency) at the basin level. Qureshi et al. (Citation2010) measured a 30% efficiency and Shakir et al. (Citation2010) a 40% irrigation efficiency from the canal head to the field level. Rohwer et al. (Citation2007) mentioned an efficiency of around 32% and another study showed a beneficial irrigation efficiency of 24% (Jägermeyr et al. Citation2015). These water management studies have assessed the fraction of water withdrawn from the source that arrives at the crop field, excluding the water that seeps away, e.g. to accessible groundwater stocks, but that remains available if pumps are applied. However, hitherto, these virtual water flows of irrigation systems have not always been reflected in the WF studies.
1.4. Contribution to existing knowledge
To improve the overall water use efficiency, indicate where supply chain losses occur and to decrease the overall blue WF, it is relevant to expand the system boundary of WF studies and also include virtual water flows of irrigation water supply. However, a comprehensive overview of specific losses in a whole water supply chain is not available yet. Such an overview would support the assessment of the difference between total agricultural blue WFs and blue crop WFs (m3/province, m3/canal command or m3/ton) and indicate locations where crops have the most favourable water availability conditions and point to pathways to decrease blue WFs.
1.5. Main objectives and research question
The two main objectives of this study are (i) to include virtual water flows (blue WFs) of irrigation supply into water consumption of agriculture and (ii) to propose a method to assess total agricultural blue WFs that include the blue WF of irrigation supply based on the WF concept in addition to information from traditional water management studies and the approach from fractional water accounting analysis.
The study uses the Pakistani part of the Indus basin as a case study area, because Pakistan has one of the most complicated and largest irrigation supply networks in the world, formed by many irrigation supply chains, that includes all kinds of flows and stocks (natural water flows, a human-made irrigation network, fresh surface and groundwater, saline and brackish groundwater) and water constructions, such as reservoirs, dams, canals and irrigation systems. Moreover, Pakistan is a water-scarce country for which information is available. The main research question is “What is the difference between the blue crop WFs and the total agricultural blue WFs in the main agricultural areas in Pakistan, where do the largest losses occur and what are the options for change?” The study provides a detailed spatial overview of the differences between blue crop WFs and total agricultural blue WFs per canal command level in Pakistan. Although the method to include the blue WF of irrigation supply has been used for the Pakistani part of the Indus basin, it can be applied anywhere.
2. System analysis
2.1. Blue water supply in the Indus basin in Pakistan
Pakistan has large agricultural areas, especially in Punjab and Sindh. The major crops are wheat, sugar cane, rice, and cotton (FAO Citation2021). Rainfall is limited, so crops need irrigation water. The main source of freshwater is the Indus River. The intricate canal network of the Indus basin irrigation system (IBIS) brings freshwater to the crop fields. Originally, the network originally was a gravity-fed system originating from ancient times. In the 19th century, when Pakistan was part of an English colony, the network was expanded (Alam et al. Citation2007). Between 1965 and 2019, when agricultural production went up, the network was even further expanded (Sindh Irrigation Department Citation2019). shows a schematic map of the major infrastructure of the irrigation supply chains that form the network in Pakistan (Nasir and Muhammad Citation2011).
Figure 1. Schematic map of the major infrastructures in the Indus river basin irrigation network of Pakistan (Source: Nasir and Muhammad Citation2011).
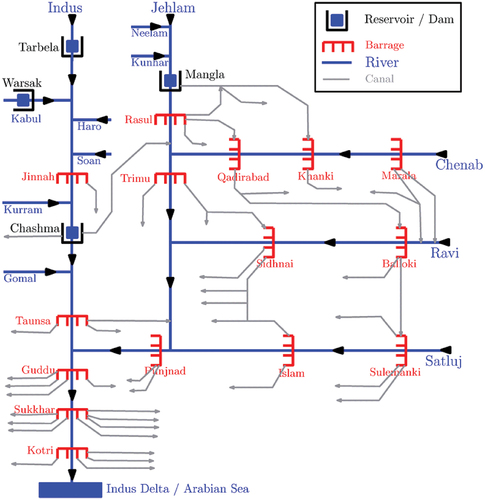
shows the main river, the Indus and its tributary rivers, the reservoirs and barrages, and the main and linking canals between rivers in the Pakistani part of the Indus basin. These linking canals mitigate the water deficit from the Ravi, Beas, and Sutlej rivers attributed to India in the Indus Waters Treaty of 1960. The irrigation network systems are located in the command areas, i.e. in the areas irrigated by the water of a specific canal.
2.2. Surface water infrastructure in the Indus basin in Pakistan
The surface water infrastructure includes the natural and human-made water supply chains forming a complex network, from the source where the inlet of river water occurs at the basin level to the crop field at the field level. shows these two levels of the water supply chain.
Figure 2. Basin- and field-scale level of the irrigation supply chain that includes water inflow from snowmelt and precipitation into the main river Indus and its tributaries, reservoir water storage, water transport to rivers, canals, and field channels, irrigation on the field, and drainage. In every link and between links of the supply chain losses occur.
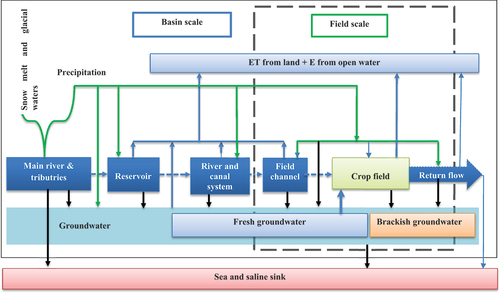
The whole river basin operates as a large canal system where water is controlled by a complex anthropogenic infrastructure including linking canals, barrages, headworks, siphons, and irrigation canals. The natural river flow is completely controlled by human-made structures.
2.3. Basin-scale: reservoir losses
Freshwater entering the human-made irrigation supply chains is first stored in reservoirs from where it is distributed over the network. However, dams creating a reservoir are sometimes not only built for storing irrigation water but also for other services. In Pakistan, the large reservoirs are mainly used for irrigation water storage, some smaller reservoirs are also constructed for flood protection and residential and industrial water supply (Hogeboom et al. Citation2018). Reservoirs increase the surface area of the water body, also increasing evaporation and seepage. This “lost” water is generally considered consumed water because it is removed from the system (Kohli and Frenken Citation2015). For multipurpose reservoirs, consumed water needs to be allocated over the different services. Seepage water is only considered consumed when it cannot be used again, e.g. if it seeps to brackish or saline aquifers, non-recoverable outflows, or evaporates. If it seeps into freshwater aquifers, it recharges groundwater stocks and contributes to water availability.
2.4. Basin-scale: canal losses
Reservoirs with water storage distribute water over smaller rivers and canals. From reservoirs to the fields, the canals become smaller and smaller distributing water in a precise way. Water losses occur during this conveying process due to evaporation and seepage. Evaporation from open canals is not recoverable and can therefore be considered as consumption, while seepage water might contribute to groundwater recharge if it seeps into fresh groundwater stocks.
2.5. Field-scale: water losses from the crop field
After the distribution in the river and canal network, freshwater reaches the crop field. Here, water is lost through evaporation from surface irrigation or pre-sowing wetting during field preparation (Rauni irrigation). Another water loss is evaporation due to high water tables, also causing an increase of waterlogged areas, non-recoverable seepage to groundwater stocks, and non-recoverable return flows. Free surface evaporation loss is an important component of irrigation loss causing large waterlogged areas, mostly located in Sindh, the lower Indus basin, and in the Jhelum-Chenab command of Punjab (Habib Citation2004).
Finally, freshwater reaches the crops where evapotranspiration takes place. This is unavoidable water consumption and often expressed as the blue WF (m3/ton) (Hoekstra et al. Citation2011). Some return flows are applied for irrigation, depending on the water quality. If there are no toxic substances in the return flow, it is suitable for irrigation. This possibility most often occurs when pumping groundwater by vertical drainage. Evaporation and seepage losses are also common for return flows (Luan et al. Citation2018).
3. Method and data
The study defined the total agricultural blue WF as the sum of the blue crop WF (i.e. blue water supply to cover CWRs) and irrigation supply WFs that include losses. This section first presents the theoretical framework of the blue WF. Second, it identifies losses in human-made irrigation supply chains and calculates total irrigation water requirements. Third, we assess the ratio of irrigation supply WFs and blue crop WFs per province and canal command in the IBIS area in Pakistan showing the spatial differences.
3.1. Theoretical framework: blue water footprints
Water footprints (WFs) differentiate between water withdrawal and water consumption. For example, groundwater withdrawn for irrigation might partly return to where it came from, resulting in a difference between withdrawn and consumed water, i.e. blue WFs. The water footprint manual (Hoekstra et al. Citation2011) proposes to calculate the blue WF in a process step, , as:
Herein is the evaporated blue water,
the water incorporated in the product and the
refers to the part of the return flow that is not available for reuse within the same catchment within the same period of withdrawal, either because it returns to another catchment (or discharges into the sea) or because it returns in another period of time. Adding the blue WF of irrigation to the blue crop WF of a crop gives information on the water consumption of a specific crop in its whole supply chain, generating information on what we term as the total agricultural blue WF, a tool to optimize water management. We calculated the total agricultural blue WF as:
Herein BlueWaterNonBeneficialEvaporation is the water that is not purposefully converted to water vapour, such as through transpiration by weeds, evaporation from wet soil, and evaporation losses from reservoirs, canals, or high groundwater table areas. The LostReturnflow, or non-recoverable return flow, refers to the part of the return flow that is not available for reuse within the same catchment within the same period of withdrawal.
3.2. Water losses in the surface and groundwater irrigation supply chain
To calculate the blue crop WF and the total agricultural blue WF for the IBIS in Pakistan, we included surface water evaporation and seepage losses from (i) reservoirs; (ii) canals (link canals, main and secondary canals, watercourses and field channels); and (iii) field application including Rauni (pre-sowing irrigation for land preparation). We calculated the surface water supply chain efficiency, Eff, at the basin level, including the efficiencies per link of the supply chain, as:
where Wi is the surface water withdrawal in the first link of the supply chain and L (i-iii) are the losses per supply chain link. We did not consider seepage to fresh groundwater stocks as a loss, because the water remains available. We defined losses as non-recoverable seepage to saline or fossil groundwater stocks and drainage outflow including non-beneficial evapotranspiration. We calculated groundwater efficiency in the same way as surface water efficiency.
Reservoirs form the first link in the human-made irrigation supply chain. To quantify irrigation water withdrawal from the rivers to the reservoirs, we subtracted average annual river losses and sea outflow from the river inflows at the measuring stations. Data on average surface water inflows for the period 1922–2016 of 164 to 182 km3/year were taken from Young et al. (Citation2019). We adopted average annual river losses of 10% from Habib (Citation2004), Ahmed et al. (Citation2007), and Hussain et al. (Citation2011). The average sea outflow from 1975 to 2016 of 29 to 32 km3/year was adopted from Young et al. (Citation2019). We assumed that water withdrawal from the rivers into the reservoirs is between 119.2 and 132.3 km3/year (see also Table A1 in the Supporting Information (SI)).
3.2.1. Reservoir storage efficiency
The three main reservoirs, Tarbela, Mangla, and Chashma, store irrigation water. To calculate reservoir storage efficiency, we assumed that water from reservoir seepage flows to fresh groundwater stocks where it remains available for human use and therefore we did not consider this seepage as a loss. We only included the evaporation losses from the reservoirs, Li (km3/year), calculated as:
Herein Eto(a) is the reference evapotranspiration (mm/year) for reservoir a, A(a) is the surface area of reservoir a (km2) and the factor 106 is applied to convert mm/year to km3/year. Data on the reference evapotranspiration of the Tarbela reservoir of 2,362 mm/year and of the Mangla reservoir of 1,727 mm/year were taken from Ahmad et al. (Citation1963). For the Chashma reservoir, reference evapotranspiration of 1,466 mm/year was taken from Ullah et al. (Citation2001). We took data on reservoir capacity and surface areas from Karimi et al. (Citation2013). See also Table A2 in the SI.
3.2.2. Conveyance efficiency
The second link of the irrigation supply chain includes the canals, i.e. the link canals, main and secondary canals, watercourses, and field channels. To calculate the efficiency of the canals, we estimated the total canal evaporation and seepage loss, Lii (km3/year), as:
Herein Wi(p) is withdrawn water per component p (m3/year), Li(p) is the water loss per component p (m3/year) and Ep and Es are the fractions of evaporation and seepage losses per component. Data on evaporation and seepage of the link canals of 3% were taken from Lieftinck et al. (Citation1968) and Habib (Citation2004). Of the 3%, 33% evaporates and 67% seeps. In general, 25% of the seepage seeps to fresh groundwater stocks, while the remaining 75% is non-recoverable (Habib Citation2004).
For the main and secondary canals, Lieftinck et al. (Citation1968), Habib (Citation2004), Ahmad and Rashida (Citation2001) and Hussain et al. (Citation2011) reported 25% conveyance losses. We adopted evaporation losses of the main and secondary canals of 5% of water withdrawals from Frederiksen (Citation1992) and Jazira (Citation2006). The rest is seepage. Sixty-eight per cent seeps to fresh groundwater stocks; the other 32% is non-recoverable (Habib Citation2004).
Ahmad and Rashida (Citation2001) and Hussain et al. (Citation2011) reported conveyance losses in watercourses from head to farmgate of 30%. Sahasrabudhe (Citation2011) and Liu et al. (Citation2016) reported evaporation losses from watercourses of 1% of water withdrawals. For seepage, we also assumed that 68% seeps to fresh groundwater and 32% is non-recoverable (Habib Citation2004).
For the field channels, Lieftinck et al. (Citation1968), Ahmad and Rashida (Citation2001) and Hussain et al. (Citation2011) reported 10% conveyance losses. For evaporation losses, we took an average of 0.63% based on ranges of 0.25 to 1% from Sahasrabudhe (Citation2011) and assumed again that 68% seeps to fresh groundwater and 32% is non-recoverable. Table A3 in the SI gives an overview of river and conveyance losses (evaporation and seepage) per irrigation supply chain link for irrigation in the Indus basin in Pakistan.
3.2.3. Field application efficiency
The third link of the irrigation supply chain includes field application and Rauni. We calculated the evaporation and seepage losses, Liii (km3/year), as:
Herein is the annual irrigation water withdrawal (m3/year) from the field channels to the crop fields through surface irrigation, including Rauni. Efield and Sfield are the evaporative and seepage losses (%). We adopted data on field application losses of 25% (evaporation and seepage) from Habib (Citation2004), Ahmad and Rashida (Citation2001), and Hussain et al. (Citation2011). We assumed that 8% of withdrawn water evaporates, while 92% seeps to groundwater. We assumed again that 68% seeps to a fresh groundwater stock and 32% is non-recoverable.
3.2.4. Groundwater efficiency
To calculate seepage and evaporation water losses of withdrawn groundwater, we distinguished between groundwater seepage from field channels and field application. We calculated these losses in the same way as surface water losses. We adopted information on groundwater seepage to fresh groundwater stocks of 70% and non-recoverable seepage of 30% from Habib (Citation2004).
3.3. Total agricultural and blue crop water footprints in the Indus basin in Pakistan
Next, we assessed the total agricultural blue WF for the Indus basin, BlueWFTotal (km3/year). When expressed per unit of yield (m3/kg), it is the average agricultural blue WF. It is the sum of the total agricultural blue surface WF, BlueWFTotal, surface, and the total agricultural blue groundwater WF, BlueWFTotal, groundwater:
The total agricultural blue surface WF, Blue WFsurface (km3/year), was calculated as:
Herein Wi is the total blue surface water withdrawal in the first link of the supply chain and SFA is the groundwater recharge from the surface water infrastructure to a fresh groundwater stock. We calculated SFA using the fraction of seepage losses per surface water supply link from EquationEquation 10(10)
(10) and 7. The BlueWFTotal, groundwater (m3/year) was calculated in the same way.
To express the ratio of the blue WF of the irrigation supply chain and the blue crop WF, we first calculated the blue crop WF, BlueCropWF (m3/year), as:
The ratio of the blue WFs of the irrigation supply chain and the blue crop WF was expressed using a factor K adopted from Schyns et al. (Citation2014) as:
We also assessed the total agricultural blue WF per province and canal command area. To assess provincial surface water withdrawal, we used the allocated water withdrawals as agreed in clause 2 of the IRSA accord (Anwar and Bhatti Citation2018). For the canal command areas, we took withdrawal data from Cheema et al. (Citation2016). For provincial groundwater withdrawal, we assumed that all recharge to groundwater remains available. We derived data on pumped groundwater per province, as a percentage of total pumped groundwater, from Lytton et al. (Citation2021). Pumped groundwater per canal command was taken from Cheema et al. (Citation2016). See also the SI Table A4-A7.
4. Results
shows the average blue WF of irrigation, water losses and efficiency according to traditional water management approaches and the efficiency of surface and groundwater supply per chain link in the Indus basin in Pakistan from 1992 to 2016 based on the WF and traditional water management approach.
Table 1. Average blue WF of irrigation in the Indus basin in Pakistan from 1992 to 2016.
shows that the consumption-based WF and the withdrawal-based traditional water management approach generate different results. The WF approach generates far smaller losses and higher efficiency than the traditional water management approach. Surface water use efficiency is 71% for the WF and 34% for traditional water management. The difference is due to the large recoverable recharge of surface water that seeps to groundwater. Also for groundwater, the difference is large. The WF approach generates an efficiency of 85%, the traditional approach only 68%, mainly due to groundwater recharge that is not considered a loss in the WF approach. Using the WF method, the largest surface water losses occur in the canals, especially in the main and secondary canals through evaporation and seepage. Efficiency at the field scale is larger than at the canal scale, and losses caused by storage in the reservoirs are negligible. also shows that surface water irrigation has a smaller efficiency than groundwater irrigation caused by the relatively long irrigation supply chain in Pakistan.
shows the average total agricultural blue WF and the blue crop WFs (including surface and groundwater) (km3/year) per province (Punjab, Sindh, Balochistan, and Khyber Pakhtunkhwa (KPK)), for the country as a whole and the percentage of losses for the period 1992–2016.
Figure 3. Average total agricultural and blue crop water footprints (including both surface and groundwater) (km3/year) per province (Punjab, Sindh, Balochistan, and Khyber Pakhtunkhwa (KPK), for Pakistan from 1992 to 2016.
Punjab has the largest total agricultural and blue crop WF but relatively small irrigation losses (35%). Sindh has the second-largest blue WFs with losses of 43%. The difference between losses is caused by the type of blue water applied. In Punjab, the fraction of surface water with long supply chains and relatively large irrigation supply WFs is smaller than in Sindh, because groundwater of good quality is available. In Sindh, the groundwater is saline or brackish, and more surface water is used. Blue WFs in KPK and Balochistan are relatively small. At the country level, 38% of blue surface and groundwater is lost in the irrigation supply chain.
shows total agricultural and blue crop surface and groundwater WFs (km3/year) per province in Pakistan. gives the total agricultural blue WFsurface (km3/year), the total agricultural blue WFground water (km3/year), the blue crop WFsurface + ground water (km3/year) and the K value.
Figure 4. Total agricultural and blue crop surface and groundwater water footprints (WFs) (km3/year) per province in Pakistan. Figure 4a gives the total agricultural blue surface WFs (km3/year), Figure 4b the total agricultural groundwater WFs (km3/year), Figure 4c the blue crop WFs of surface and groundwater (km3/year) and figure 4d the K value. (KPK is Khyber Pakhtunkhwa). The K factor refers to the ratio of the blue WFs of the irrigation supply chain and the blue crop WF (dimensionless).
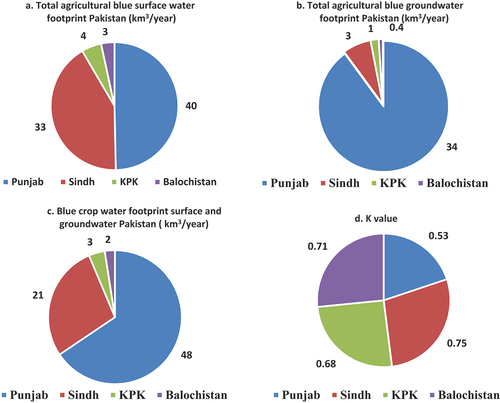
shows that the national total agricultural blue WF from surface water is dominated by Punjab and Sindh, the two main agricultural provinces. shows that the national total agricultural blue WF from groundwater is largest in Punjab, while in the other provinces groundwater consumption is relatively small. shows the dominant blue WF of Punjab, followed by Sindh, and the small contributions of KPK and Balochistan. show that the losses compared to the blue crop WF in Punjab are smaller than in the other provinces. The K value of 0.53 indicates that 35% of the water is lost. In the other provinces, the situation is worse than in Punjab, with K values between 0.68 and 0.75. These results show that the WF of irrigation water supply is relevant compared to blue crop WFs.
shows a map of the K values per canal command area of the Indus basin in Pakistan. Table A8 in the SI gives the total agricultural and blue crop WFs (km3/year) and the K values per canal command.
Figure 5. Map of K values per canal command area in the Indus basin of Pakistan. The K factor refers to the ratio of the blue WFs of the irrigation supply chain and the blue crop WF (dimensionless).
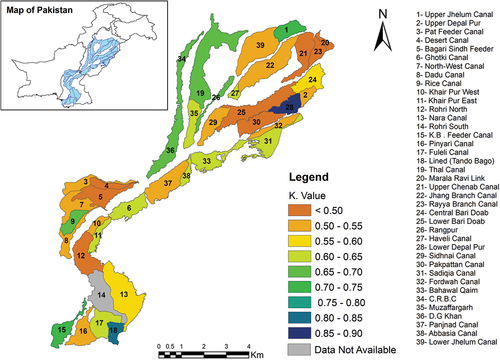
The average K value of the IBIS canal command areas is 0.59, with K values ranging between 0.5 and 0.9. The smallest water losses occur in the East of Sindh and North of Punjab, whereas large losses occur in the South and in one canal command in Punjab. Table A8 in the SI shows total agricultural and blue crop WFs (km3/year) and the K value per canal command area in the Indus basin.
5. Discussion
This study estimated blue WFs of irrigation supply chains in large networks (storage, transport and irrigation application), revealing the importance to include irrigation supply chains in agricultural WF assessments. While earlier studies focused on crop blue WFs for irrigated agriculture in the Indus basin in Pakistan (e.g. Mekonnen and Hoekstra Citation2010a), our approach not only identified the importance to include water supply chains for total agricultural blue WF assessments but also the main hotspots where relatively high blue WFs exist, providing information for improved water consumption.
5.1. Uncertainties and assumptions
Our results give an indication of total agricultural blue WFs for the Pakistani part of the Indus basin. However, data on losses in separate links of the irrigation supply chains are limited. For instance, the assessment of evaporation and seepage losses in each link of the irrigation supply chain required the integration of data from several sources. Therefore, we used general assumptions at the macro level and integrated data from several separate studies to give the overall picture. We encountered uncertainties in terms of spatial and temporal variation of data choice, keeping in view the complexity of the size, length and extent of the canal network, which stretches within an area of 16 106 ha with different underlying surfaces of farmland and canals, and falls in different agro-climatic zones. These uncertainties may influence the results. However, if more precise information becomes available, probably better estimates can be made.
5.2. Comparison with other studies
This study included the blue WF of a human-made irrigation water supply network in the assessment of total agricultural WFs. The relevancy of the WF of water supply has already been proposed by Hoekstra et al. (Citation2011) in the WF concept. Using blue WFs in the Indus basin in Pakistan as an example, we identified a large gap between blue crop WFs, as calculated in existing WF studies (e.g. Mekonnen and Hoekstra Citation2010a), and total agricultural blue WFs. Mekonnen and Hoekstra (Citation2010a) calculated a blue WF for the province Punjab, using a bottom-up approach, of 50 km3/year, which is similar to our blue crop WF for Punjab of 48 km3/year using a top-down approach. Ullah et al. (Citation2001), Laghari et al. (Citation2012) and Cheema et al. (Citation2016) estimated the blue WF of the Indus basin in Pakistan using a bottom-up approach within a range of 69 to 99 km3/year, which is similar to our calculation of 74 km3/year. This means that water scarcity assessments based on blue crop WFs might underestimate water scarcity, because water consumption is larger when irrigation supply chains are taken into account.
The WF conceptual framework (Hoekstra et al. Citation2011) differs from traditional water management studies so that blue water seeping to fresh groundwater stocks is not considered a loss, because it remains available for use. If the WF concept is applied to the Indus basin, it generates larger efficiencies than traditional water management approaches. Based on withdrawal-based traditional water management studies, the water use efficiency for both surface and groundwater in Pakistan is around 43%, whereas this study showed an efficiency of 74% if water seepage to fresh groundwater stocks is not considered a loss. Our results are also in line with the results of various studies which used satellite data and water accounting modelling approaches to quantify basin-scale efficiencies. For example, Van Steenbergen and Gohar (Citation2005) estimated that 79% of pumped groundwater originated from surface water irrigation and non-consumed return flows. Karimi et al. (Citation2013) reported a full basin-scale efficiency of 84% and Simons et al. (Citation2020) found a 71% efficiency for the Pakistani part of the Indus basin.
Our estimates of reservoir evaporation losses are in line with results from Karimi et al. (Citation2013) who quantified losses in reservoirs in India and Pakistan of about 1.91 km3. Evaporation losses of the Pakistani reservoirs quantified by Hogeboom et al. (Citation2018) based on the Simly and Rawal reservoirs of 0.004 km3 underestimate evaporation. These small reservoirs are not designated for irrigation purposes and used to supply drinking water to Islamabad and Rawalpindi.
5.3. Blue water hotspots uncovered by the irrigation supply chain analysis
The analysis also gives information about hotspots where most losses occur. Especially the canals generate the largest water losses so that priority needs to be given to decrease those losses rather than to instal more efficient irrigation technology. Several studies also emphasize this perspective (e.g. Simons et al. Citation2020; Pérez-Blanco et al. Citation2020). This might be a policy task, while farmers can better address more efficient irrigation technology.
We distinguished between surface and groundwater, not only because the irrigation supply blue WFs are more favourable for groundwater than for surface water with long supply chains but also because there is a trade-off between efficient water use and energy use. Groundwater supply requires energy for pumping, and this is far larger than energy for the construction and maintenance of surface water supply (Siyal et al. Citation2021).
Recent scientific literature indicates existing flaws in the traditional efficient water use approach in agriculture, making it difficult to solve the water scarcity issues (e.g. Jensen Citation2007; Perry Citation2011; Lankford Citation2012; Perry et al. Citation2017; Simons et al. Citation2020). The conceptual WF framework, including irrigation supply chains, contributes to better insight and shows the most vulnerable links in water supply chains and networks indicating options to decrease blue WFs. Also, for other basins with other characteristics than the Indus basin in Pakistan that suffer from water stress.
The focus of this research was on the blue WFs of irrigation supply chains in agriculture. This approach can also be applied to other sectors, e.g. industry or municipal water supply that also might have a water supply chain where losses could occur. Next, including water supply chains can also be relevant for green and grey WFs in cases when there are green WFs of weeds or pollution in the water supply chain.
6. Conclusions
The innovation of the study is that it extends the commonly applied WF conceptual framework and explicitly includes water supply chains in the assessment of total blue water consumption (footprints). It proposes to include the supply chain WF within the already existing methodology (i.e. WF irrigation supply network and non-beneficial evapotranspiration). When applied to blue water in Pakistan, we show the importance of supply chain WFs in relation to crop blue WFs. We also indicate the hotspots where water losses are relatively large. This insight might support management options to save water in specific locations or decisions to grow crops in other areas with smaller water losses.
The study considers the whole river basin operating as a large canal system where water is controlled by a complex anthropogenic infrastructure, including link canals, barrages, headworks, siphons, and irrigation canals where the natural river flow is completely controlled by human-made structures. The study does not consider seepage to a fresh groundwater stock as a loss, while seepage to saltwater stocks, heavily polluted groundwater, non-recoverable drainage outflows, and open surface evaporation from waterlogged areas are considered non-recoverable losses. This study included irrigation supply chains adopted from the WF conceptual framework to assess total agricultural blue WFs. When applied to the blue water irrigation supply chains in the Pakistani part of the Indus basin, we showed that the total agricultural blue WFs are much larger than blue crop WFs. Losses in the water supply chains can be large and depend on specific efficiencies in separate chain links. For Pakistan, the largest surface water losses occur in the irrigation canals through evaporation and seepage. Efficiency at the field scale is larger than at the canal scale, while losses caused by storage in the reservoirs are negligible. In general, surface water application is less efficient than groundwater use. Surface water losses vary between 45 and 49%, while groundwater losses range between 18 and 21%, dependent on local conditions. There are large efficiency differences among provinces. Withdrawal-based traditional water management studies indicated a water use efficiency for Pakistan of around 43% where this study showed an efficiency of 74% if water flows to fresh groundwater stocks were not considered a loss.
The distinction between surface and groundwater in blue WF calculations is relevant, because the irrigation supply WFs depend on local circumstances and differ between the two water types. Moreover, a tradeoff between water and energy might occur, because groundwater pumping requires more energy than surface water supply.
Presently, much attention is paid to more efficient irrigation at the field level. However, a systems approach, integrating knowledge from several environmental disciplines that takes whole supply chains into account and focuses not only on crop production but also includes the whole irrigation supply network, might save more water. For Pakistan, the total agricultural blue WF is 1.6 times the blue crop WF leading to a K value (ratio of supply chain losses and blue crop WF) of 0.6. Earlier WF studies probably underestimated water scarcity if irrigation supply networks were excluded. The systems approach applied to Pakistan is also relevant for other countries and basins when efforts are made to use water more efficiently. More water-efficient agriculture should also take these irrigation supply chain losses into account, which probably requires water management adaptations, which is more a policy than an agriculture task. Also industry or municipal water supply, encountering losses in their water supply chain, might profit of this approach. Water supply chains can also be relevant for the assessment of green and grey WFs. Collective action, as a process of cooperation amongst various stakeholders, including businesses, governments and civil society, is a learning process and can sustain decision-making and prioritize actions to manage the global scarce water resources in our river basins.
Highlights
The water footprint (WF) of an irrigation supply chain can be as large as the blue crop WF.
Agricultural water use efficiency needs to include water supply chains.
Hitherto, WF studies might have underestimated blue water consumption.
Some river basins, like the Indus basin, operate like canal systems with huge blue water losses.
Policy might decrease blue WFs using water management adaptations.
Supplemental Material
Download MS Word (30.6 KB)Disclosure statement
No potential conflict of interest was reported by the authors.
Supplemental data
Supplemental data for this article can be accessed online at https://doi.org/10.1080/1943815X.2023.2208644
References
- Ahmad S, Rashida S. 2001. Indus basin irrigation system water budget and associated problems. J Eng Appl Sci (Faisalabad, Pakistan). 20(1):69–22.
- Ahmad N, Sarfraz M, Akram M. 1963. An estimation of evaporation from free water surface. Paper No. 368 Pakistan Engineering Congress.
- Ahmed A, Iftikhar H, Chaudhry GM. 2007. Water resources and conservation strategy of Pakistan. The Pakistan development review, 997–1009.
- Alam U, Sahota P, Jeffrey P. 2007. Irrigation in the Indus basin: a history of unsustainability? Water Supply. 7(1):211–218. doi:10.2166/ws.2007.024.
- Allan JA. 1993. Fortunately there are substitutes for water otherwise our hydro-political futures would be impossible. Priorities for water resources allocation and management, ODA, London, United Kingdom, 13–26.
- Allan JA. 2003. Virtual water - the water, food, and trade nexus. Useful Concept or Misleading Metaphor? Water Int. 28(1):106–113. doi:10.1080/02508060.2003.9724812.
- Allan T. 2004. Why no Middle East water wars: global solutions to local deficits? In: Zereini F Jaeschke W, editors. Water in the Middle East and in North Africa. Berlin, Heidelberg, Germany: Springer. doi:10.1007/978-3-662-10866-6_11.
- Anwar AA, Bhatti MT. 2018. Pakistan’s water apportionment Accord of 1991: 25 years and beyond. J Water Resour Plann Manage. 144(1):05017015. doi:10.1061/(ASCE)WR.1943-5452.0000831.
- Batchelor C, Hoogeveen J, Faurès JM, Peiser L. 2017. Water accounting and auditing - a sourcebook, FAO water reports 43. Food and Agriculture Organization of the United Nations, Rome, Italy. http://www.fao.org/3/a-i5923e.pdf
- Boersema JJ, Copius Peereboom JW, De Groot WT, eds. 1984. Basisboek Milieukunde. Boom, Meppel, The Netherlands: Boom.
- Cao X, Wu P, Wang Y, Zhao X. 2014. Water footprint of grain product in irrigated farmland of China. Water Resour Manage. 28(8):2213–2227. doi:10.1007/s11269-014-0607-1.
- Caretta AMMA, Arfanuzzaman RBM, Morgan SMR, Kumar M. 2022. Water. Climate Change 2022: Impacts, Adaptation, and Vulnerability. Contribution of Working Group II to the Sixth Assessment Report of the Intergovernmental Panel on Climate Change.
- Chapagain AK, Hoekstra AY. 2004. Water footprints of nations, value of water research Report Series No.16, UNESCO-IHE, Delft, The Netherlands.
- Cheema MJM, Bakhsh A, Mahmood T, Liaqat MU. 2016. Assessment of water allocations using remote sensing and GIS modeling for Indus Basin, Pakistan, PSSP Working paper 36, IFPRI., Washington, D.C., USA. http://ebrary.ifpri.org/cdm/ref/collection/p15738coll2/id/130168.FAO: FAOSTAT On-line Database, 2020. Retrieved December 17, 2020 from http://www.fao.org/faostat/en/#home.
- Costanza R. 1979. Embodied energy basis for economic-ecological systems. USA: Dissertation university of Florida.
- FAO. 2021. FAO term portal. Retrieved June 1, 2021 from http://www.fao.org/faoterm/en/?defaultCollId=7.
- Feng B, Zhuo L, Xie D, Mao Y, Gao J, Xie P, Wu P. 2021. A quantitative review of water footprint accounting and simulation for crop production based on publications during 2002–2018. Ecol Indic. 120:106962. doi:10.1016/j.ecolind.2020.106962.
- Frederiksen HD. 1992. Water resources institutions: some principles and practices, World Bank technical paper No. 191, The World Bank, Washington D.C., USA.
- Gleick PH, Christian-Smith J, Cooley H. 2011. Water use efficiency and productivity rethinking the basin approach. Water Int. 36:784–798. doi:10.1080/02508060.2011.631873.
- Habib Z. 2004. Scope for reallocation of river waters for agriculture in the Indus Basin. Doctoral dissertation, Spécialité Sciences de l’eau, ENGREF, Paris, France.
- Habib Z. 2010. Policy and strategic lessons from the evolution of water management in the Indus basin in Pakistan. https://www.researchgate.net/publication/258688640_Policy_and_Strategic_Lessons_from_the_evolution_of_Indus_Basin/citation/download. Accessed 11 January 2020.
- Hoekstra AY. 2003. Virtual water trade: proceedings of the international expert meeting on virtual water trade, Delft, the Netherlands, 12-13 December 2002, value of water research report series no. 12. UNESCO-IHE, Delft, The Netherlands.
- Hoekstra AY, Chapagain AK, Mekonnen MM, Aldaya MM. 2011. The water footprint assessment manual: setting the global standard. London, UK, Washington DC, USA: Earthscan.
- Hogeboom RJ, Knook L, Hoekstra AY. 2018. The blue water footprint of the world’s artificial reservoirs for hydroelectricity, irrigation, residential and industrial water supply, flood protection, fishing and recreation. Adv Water Resour. 113:285–294. doi:10.1016/j.advwatres.2018.01.028.
- Hussain I, Hussain Z, Sial MH, Akram W, Farhan MF. 2011. Water balance, supply and demand and irrigation efficiency of Indus Basin. Pak Econ Soc Rev. 49(1):13–38.
- Israelsen OW. 1950. Irrigation principles and practices. New York, USA: John Wiley & Sons Inc.
- Jägermeyr J, Gerten D, Heinke J, Schaphoff S, Kummu M, Lucht W, Syst E, Attribution CC. 2015. Water savings potentials of irrigation systems: global simulation of processes and linkages. Hydrol Earth Syst Sci. 19:3073–3091. doi:10.5194/hess-19-3073-2015.
- Jazira A. 2006. Study on water balance model of irrigation area in the middle reaches of heihe basin. Nanjing, China: Hohai University.
- Jensen ME. 2007. Beyond irrigation efficiency. Irrig Sci. 25(3):233–245. doi:10.1007/s00271-007-0060-5.
- Karimi P, Bastiaanssen WG, Molden D, Cheema MJM. 2013. Basin-wide water accounting based on remote sensing data: an application for the Indus Basin. Hydrol Earth Syst Sci. 17(7):2473–2486. doi:10.5194/hess-17-2473-2013.
- Kohli A, Frenken K. 2015. Evaporation from artificial lakes and reservoirs, FAO-AQUASTAT reports, FAO, Rome, Italy.
- Kroeze C. 2009. Principles of environmental sciences. J Integr Environ Sci. 6(4):317–318. doi:10.1080/19438150903269087.
- Laghari AN, Vanham D, Rauch W. 2012. The Indus basin in the framework of current and future water resources management. Hydrol Earth Syst Sci. 16(4):1063–1083. doi:10.5194/hess-16-1063-2012.
- Lankford B. 2012. Fictions, fractions, factorials and fractures; on the framing of irrigation efficiency. Agric Water Manage. 108:27–38. doi:10.1016/j.agwat.2011.08.010.
- Lauvaux T, Giron C, Mazzolinia M, Dáspremont D, Durend R, Ciais D, Shindell P, Ciais P. 2022. Global assessment of oil and gas methane ultra-emitters. Science. 375(6580):557–561. doi:10.1126/science.abj4351.
- Lieftinck P, Sadove AR, Creyke TC. 1968. Water and power resources of West Pakistan; a study in sector planning I, II, III. World Bank Group, Washington DC, USA. http://documents.worldbank.org/curated/en/113111468774919823/Water-and-power-resources-of-West-Pakistan-a-study-in-sector-planning.
- Liu S, Wang W, Mori M, Kobayashi T. 2016. Estimating the evaporation from irrigation canals in northwestern China using the double-deck surface air layer model. Adv Meteorol. 2016:3670257. doi:10.1155/2016/3670257.
- Luan XB, Ya-Li Y, Wu PT, Shi-Kun S, Yu-Bao W, Gao XR, Liu J. 2018. An improved method for calculating the regional crop water footprint based on a hydrological process analysis. Hydrol Earth Syst Sci. 22(10):5111–5123. doi:10.5194/hess-22-5111-2018.
- Lytton L, Ali A, Garthwaite B, Punthakey JF, Saeed B. 2021. Groundwater in Pakistan’s Indus Basin: present and future prospects. Washington, DC., USA: World Bank. https://openknowledge.worldbank.org/handle/10986/35065License:CCBY3.0IGO
- Mekonnen MM, Hoekstra AY. 2010a. The green, blue and grey water footprint of crops and derived crop products. Value of Water Research Report Series No. 47. UNESCO-IHE, Delft, The Netherlands. http://www.waterfootprint.org/Reports/Report47-WaterFootprintCrops-Vol1.pdf.
- Mekonnen MM, Hoekstra AY. 2010b. The green, blue and grey water footprint of farm animals and animal products. Value of Water Research Report Series No. 48. UNESCO-IHE, Delft, the Netherlands. https://waterfootprint.org/media/downloads/Report-48-WaterFootprint-AnimalProducts-Vol1_1.pdf.
- Mekonnen MM, Hoekstra AY. 2016. Four billion people facing severe water scarcity. Sci Adv. 2(2). doi:10.1126/sciadv.1500323.
- Moll HC. 1993. Energy counts and materials matter in models for sustainable development: dynamic lifecycle modelling as a tool for design and evaluation of long-term environmental strategies. PhD-thesis Groningen.
- Nasir HA, Muhammad A. 2011. Control of very-large scale irrigation networks: a CPS approach in a developing-world setting. IFAC Proc. 44(1):10739–10745. doi:10.3182/20110828-6-IT-1002.03352.
- OECD. 2017. Water risk hotspots for agriculture, OECD studies on water. Paris, France: OECD Publishing. doi:10.1787/9789264279551-en.
- Pérez-Blanco CD, Hrast-Essenfelder A, Perry C. 2020. Irrigation technology and water conservation: a review of the theory and evidence. Environ Econ Policy Stud. 14(2):216–239. doi:10.1093/reep/reaa004.
- Perry C. 2011. Accounting for water use: terminology and implications for saving water and increasing production. Agric Water Manage. 98:1840–1846. doi:10.1016/j.agwat.2010.10.002.
- Perry C, Steduto P, Allen RG, Burt CM. 2009. Increasing productivity in irrigated agriculture: agronomic constraints and hydrological realities. Agric Water Manage. 96(11):1517–1524. doi:10.1016/j.agwat.2009.05.005.
- Perry C, Steduto P, Karajeh F. 2017. Does improved irrigation technology save water? A review of the evidence. Cairo, Egypt: FAO. doi:10.13140/RG.2.2.35540.81280.
- Pfister S, Bayer P. 2013. Monthly water stress: spatially and temporally explicit consumptive water footprint of global crop production. J Clean Prod. 30:1–11. doi:10.1016/j.jclepro.2013.11.031.
- Qureshi AS, McCornick PG, Sarwar A, Sharma BR. 2010. Challenges and prospects of sustainable groundwater management in the Indus Basin. Water Resour Manage. 24:1551–1569. doi:10.1007/s11269-009-9513-3.
- Rohwer J, Gerten D, Lucht W. 2007. Development of functional irrigation types for improved global crop modelling, Report 104 PIK (Potsdam-Institut für Klimafolgenforschung). PIK, Potsdam, Germany.
- Sahasrabudhe SR. 2011. Irrigation engineering & hydraulic structures. New delhi, India: S.K. Katariya & Sons. Engineering & Compute Books.
- Schyns JF, Hoekstra AY, Magar V. 2014. The added value of water footprint assessment for national water policy: a case study for Morocco. PLoS One. 9(6):e99705. doi:10.1371/journal.pone.0099705.
- Shakir AS, Khan NM, Qureshi MM. 2010. Canal water management: case study of Upper Chenab canal in Pakistan. Irrig Drain. 59(1):76–91. doi:10.1002/ird.556.
- Simons GWH, Bastiaanssen WGM, Cheema MJM, Ahmad B, Immerzeel WW. 2020. A novel method to quantify consumed fractions and non-consumptive use of irrigation water: application to the Indus basin irrigation system of Pakistan. Agric. Water Manag. 236, 106174. doi:10.1016/j.agwat.2020.106174.
- Sindh Irrigation Department. 2019. Program for the desilting of channels for the year 2018-19 in Sukkur, Gudu & Kotri Barrage. Region offices of the Sindh irrigation department, Karachi, Pakistan. https://irrigation.sindh.gov.pk.
- Singh K, Mishra SK, Singh M, Singh K, Brar AS. 2022. Water footprint assessment of surface and subsurface drip fertigated cotton-wheat cropping system–a case study under semi-arid environments of Indian Punjab. J Clean Prod. 365:132735. doi:10.1016/j.jclepro.2022.132735.
- Siyal AW, Gerbens-Leenes PW, Nonhebel S. 2021. Energy and carbon footprints for irrigation water in the lower Indus basin in Pakistan, comparing water supply by gravity fed canal networks and groundwater pumping, J. Clean. Prod. 286 125489. doi:10.1016/j.jclepro.2020.125489.
- Stewart JP, Podger GM, Ahmad MD, Shah MA, Bodla H, Khero Z, Rana MKI. 2018. Indus River System Model (Irsm)–a planning tool to explore water management options in Pakistan: model conceptualisation, configuration and calibration. August 2018. Technical report South Asia Sustainable Development Investment Portfolio (SDIP) Project. CSIRO, Australia, 155 pp.
- Sun S, Liu J, Wu P, Wang Y, Zhao X, Zhang X. 2016. Comprehensive evaluation of water use in agricultural production: a case study in Hetao Irrigation District, China. J Clean Prod. 112(5):4569–4575. doi:10.1016/j.jclepro.2015.06.123.
- Ullah MK, Habib Z, Muhammad S. 2001. Spatial distribution of reference and potential evapotranspiration across the Indus Basin Irrigation Systems, IWMI working paper 24, Pakistan country series no.8. Lahore, Pakistan. IWMI.
- Van Steenbergen F, Gohar S. 2005. Ground water development and management in Pakistan. Pakistan’s water economy. World Bank, Background paper 11, Oxford university press, Karachi, Pakistan.
- Wackernagel M, McIntosh J, Rees WE, Woollard R. 1993. How big is our ecological footprint? A handbook for estimating a community’s appropriated carrying capacity. Discussion draft of the Task Force on Planning Healthy and Sustainable Communities, University of British Columbia, Vancouver, BC.
- Winkler T, Winiwarter W. 2015. Scenarios of livestock – related greenhouse gas emissions in Austria. J Integr Environ Sci. 12(1):107–119. doi:10.1080/1943815X.2015.1110186.
- Young WJ, Anwar A, Bhatti T, Borgomeo E, Davies S, Garthwaite WR III, Saeed B. 2019. Pakistan: getting more from water. Washington, DC, USA: World Bank. https://openknowledge.worldbank.org/handle/10986/31160License:CCBY3.0IGO
- Yuguda TK, Li Y, Zhang W, Ye Q. 2020. Incorporating water loss from water storage and conveyance into blue water footprint of irrigated sugarcane: a case study of Savannah Sugar Irrigation District, Nigeria. Sci Total Environ. 715:136886. doi:10.1016/j.scitotenv.2020.136886.