
 ?Mathematical formulae have been encoded as MathML and are displayed in this HTML version using MathJax in order to improve their display. Uncheck the box to turn MathJax off. This feature requires Javascript. Click on a formula to zoom.
Abstract
Visual examination of visually recognisable substances, including microscopy, focus on targets or contaminants such as particles of animal origin, plant seeds, spore bodies of moulds, sclerotia, packaging material, microplastic and ‘Besatz’ (everything that differs from the norm). The two principal results are counts (numbers) and weights for macroscopic methods, or presence/absence for microscopic methods. The level of detection equals at least the size of one unit, usually with a weight exceeding 1 mg, which is in the range of parts per million (ppm). These parameters do not follow a normal distribution but Poisson (counts), lognormal (weights) or binomial (Booleans) distributions, with effect on the interpretation of validation parameters. As for other domains, examination methods for visual monitoring need to be properly validated and quality control during actual application is needed. In most cases procedures for validation of visual methods are based on principles adopted from other domains, such as chemical analysis. A series of examples from publications show inconsistent or not correct implementations of these validation procedures, which stress the need for dedicated validation procedures. Identification of legal ingredients and composition analysis in the domain of visual examination relies on the expertise of the laboratory staff, therefore validation of a method usually includes the validation of the expert. In the view of these specific circumstances, a Guidance for quality assurance and control of visual methods has been developed, which are being presented and discussed in this paper. The general framework of the Guidance is adopted from ISO standards (17023, 17043, 13528). Part 1 of the Guidance includes the general background, theory and principles. Part 2 presents the actual validation procedures with experimental designs and equations for calculating the relevant parameters, and can be used as blueprint for a SOP in a quality management system. An EURL and NRL network for physical hazards is strongly recommended.
Graphical Abstract
Introduction
In certain cases, the visual examination of plant parts, seeds, and of hyphal bodies of moulds is needed for guarding feed and food safety. A historical but still relevant example is the presence in cereals of ergot sclerotia, hyphen bodies of the mould Claviceps, with well documented health consequences. Some of the first documented cases of food poisoning caused by infested plant particles are the consumption of bread from cereals infested by ergot sclerotia. Historically documented cases originate from north Norway (Alm Citation2003) and from New England (the Salem witchcraft trials; Woolf Citation2000) from the 17th century. After an outbreak in France (Pont St. Esprit; Scott Citation2009; Lorenz and Hoseney Citation1979) in 1951, increased attention was given to the visual examination of ergot sclerotia. A survey of the monitoring efforts for plant seeds and ergot sclerotia was carried out in 2007. A total of twelve laboratories in eight member states of the European Union reported to have detected ergot sclerotia in samples of cereals, making it the most frequently found undesirable substance of botanic origin. The frequency of occurrence ranged from a few samples to a share of 25–50% positive samples (van Raamsdonk Citation2007; van Raamsdonk et al. Citation2009). An increase in occurrence was reported for Germany (Krska and Crews Citation2008).
Cases of feed and food adulteration other than mould bodies relate to visual examination as well. Leaves of groundsel (Senecio vulgaris), containing pyrrolizidine alkaloids, were found in rucola lettuce from Germany at several occasions.Footnote1 The presence of weed seeds identified as charmac (Heliotropium popovii) in wheat in Afghanistan caused liver damage with approximately 7800 people affected and about 1600 casualties in the years 1974–1976. This was one incidence in a series of comparable cases (Kakar et al. Citation2010). Such cases can be prevented by applying visual inspection of the raw materials before processing. A specific case is the monitoring of Ambrosia seeds, which is an item in Directive 2002/32/EC. The presence of these seeds needs to be controlled since the full grown plants cause serious symptoms of hay fever, due to the extensive production of pollen. Legal limits are included in the mentioned Directive for the option to monitor Ambrosia seeds in combination with the monitoring of other weed seeds. These monitoring activities appeared to be successful (Frick et al. Citation2011). Another well documented example of visual examination is the continuing inspection of compound feeds for the presence of processed animal by-products (Liu et al. Citation2011), for the eradication of bovine spongiform encephalopathy and some other zoonotic diseases.
Particles causing physical hazards were detected by visual examination in several types of food stuff, for example in instant coffee in Canada (2010), United Kingdom (2020), and in Germany (2021),Footnote2 and in chocolate bars (2016) in 55 countries.Footnote3 In general, physical particles causing a hazard principally different from chemical and microbiological hazards in feed and food are typically subjected to visual examination. This applies especially to former food products intended as feed ingredients, which in a series of cases have to be unpacked before further processing in the context of circular bioeconomy (Regulation (EC) 767/2009; van Raamsdonk, Rijk, et al. Citation2011; Amato et al. Citation2017). Another issue is the detection and identification of unintentional contamination with microplastic. The necessary method development for detection of microplastic in feed and food products and procedures for quality control appear to be complicated (van Raamsdonk et al. Citation2020).
Besides the presence of undesired substances, the composition of feed and food materials and of products can be established by means of visual examination. A range of different feed and food ingredients, herbs, and spices have been described for visual identification, including specific constituents such as starch and pollen grains (Hahn and Michaelsen Citation1996; Seidemann Citation1966; Sawyer Citation1981, Citation1988; Gassner and Hohmann En Deutschmann Citation1989; Hohmann Citation2006; Rahfeld Citation2009). Besides transparency and information for consumers by providing correct label declarations, the control of composition serves several aims. A known and verified composition supports traceability (Regulation (EC) 178/2002). A most important aspect is the option to identify the presence of a prohibited chemical substance in one of the ingredients or fractions, which enhances the probability to find the source upstream in the feed or food production chain.
Visual inspection for monitoring potential hazards for food and feed safety is part of a cocktail of domains including chemical, microbiological, and molecular biology analyses (FAO and WHO Citation2019). Yet, in contrast to the examination methods in these other domains, the validation of methods for visual examination is currently not supported by the presence of a Standard or Guidance. This situation resulted in a range of peculiar situations in validation studies or proficiency testing, which stresses the essential and urgent need to install a set of validation procedures for examination of visually recognisable substances. This paper is intended to evaluate the current situation, will discuss the specific situation and background of visual examination methods, and will present solutions for validation. This paper will introduce the first version of a Guidance document including the dedicated theory for validation of methods to detect and identify visually recognisable substances accompanied with a set of validation procedures and strategies.
Legal framework
There is a range of different aims and requirements for visual monitoring in European legislation. The most prominent one is the set of restrictions on the use of animal by-products in feed (Regulation (EC) 999/2001). There is an extensive structure of prohibitions and relaxations which makes monitoring complicated (van Raamsdonk et al. Citation2019). Microscopy detection acts as part of a monitoring strategy together with PCR (Regulation (EC) 152/2009, Annex VI). Current targets are terrestrial vertebrate animals and fish; insects will be added as third target from 2022.
Undesirable substances subjected to visual monitoring are listed in Directive 2002/32/EC. These include ergot sclerotia, a set of named weed seeds and any seed containing alkaloids. This last category might well represent 20% of all existing seed plants (Frohne and Pfänder Citation2005; EFSA Citation2012). A specific category of undesirable substances are the remnants of packaging materials in products from the agri-food industry (Regulation (EC) 767/2009, Annex III). These products include a range of industrial by-products from the oil and starch production, such as soya expellers, rape seed expellers, and brans and middlings from a range of cereals. These traditional ingredients of compound feed are usually not packed. In contrast, former food products from retail such as bakery by-products need unpacking. The share of these products in the range of feed ingredients will increase in the framework of circular agronomy. Other situations include the contamination of products with plant parts. Fodder can contain plants producing pyrrolizidine alkaloids, e.g. ragworts (EFSA Citation2007, Citation2011). A range of plant parts can be detected visually, which is an option for monitoring early in the production chain (FAO and WHO Citation2019). The detection of adulteration of saffron (ISO 3632-2:2010) and of honey (Directive 2001/110/EC) are examples in the area of fraud prevention.
Declaration of composition of a compound feed is required as part of the label information (Regulation (EC) 767/2009, preamble 17). The composition should mention the feed materials in order of decreasing share, and if requested additional information on composition should be made available with uncertainty limits of +/- 15% (Regulation (EC) 767/2009, Article 17). Monitoring of the identity or composition of lots or batches for trade purposes serves fraud enforcement (Regulation (EU) 2017/625) and customs for the organisation of common markets for agricultural products (Regulation (EU) 1308/2013).
Evaluation of examples of validation and implementation of visual methods for examination of undesirable substances
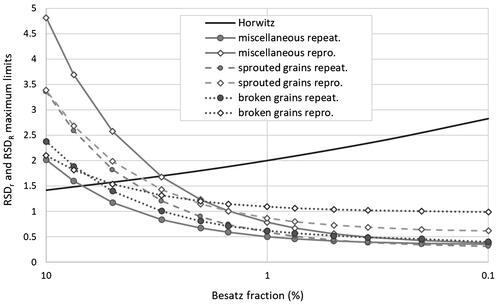
During the past years several notable situations have been encountered in the process of method validation and implementation of visual methods, which need further evaluation. In general, the scope of a series of standards for method validation does not provide a very strict description of the included and excluded types of methods for which the validation is intended. This situation results in the use of the performance parameters included in those standards for the validation of visual methods without verification of their applicability. An example is a publication on validation of five undesirable substances in whole kernel matrices, each at two levels of contamination (Marchis et al. Citation2021). Nine out of 10 validation experiments resulted in exact identical values (two decimal precision) for repeatability and reproducibility. The usual limits for chemical analysis, 80–110%, have been applied as criteria for recovery (Marchis et al. Citation2021). The deviation for recovery has been shown to be larger for visual examination of large particles, targeting a low number of units per sample, in the ppm range. This deviation was also noted in CEN Standard 15587:2018 (CEN Citation2018) on inspection of whole kernel cereal material by presenting equations for acceptable limits, comparable to the Horwitz equation (Horwitz Citation1995; Horwitz and Albert Citation2006). A graphical representation of these equations for three types of undesirable substances for two parameters each is presented in . The Horwitz equation is also included for comparison. The peculiar situation is that the acceptable deviation according to CEN 15587:2018 decreases towards lower contamination levels, whereas the Horwitz equation, generally accepted in the chemical domain, shows the logical situation of an increasing deviation towards these lower levels.
Figure 1. Relation between relative standard deviations for repeatability (RSDr) and for reproducibility (RSDR) and the fraction of damaged grains in whole kernel cereals for three types: broken grains, sprouted grains and miscellaneous damage. Based on equations from CEN 15587:2018. The relationship between the Besatz fraction and RSDR calculated from the Horwitz equation is given for comparison.
Conformity and proper application are part of a correct implementation of analytical methods. This was exemplified by the 2014 version of the proficiency test for animal proteins organised under the auspices of the International Association of Feedingstuff Analysis section Feedingstuff Microscopy (indicated by the originally German acronym IAG); van Raamsdonk et al. Citation2014). This PT included a sample of 30 g of matrix material (compound feed) with exactly 30 bone fragments with the same size as the average particles of that compound feed. The usual procedure is to take 10 g of matrix material, extract the heavy fraction, and examine a variable part of the resulting sediment (Regulation (EC) 152/2009 (EC Citation2009) and amendments). The part of the sediment examined by the participants represents several (but a variable number) of grams of the original sample material. Based on all information collected from the participants and depending on the results of an applicable Poisson distribution, low numbers of bone fragments were to be expected as results. The situation occurred that several reported counts were in excess of the reasonable limits, up to a count exceeding 30 particles. An additional survey among the participants revealed the application of extra grinding for homogenization by some participants (van Raamsdonk et al. Citation2014). Grinding is by principle intended to fragment particles with the logical result of a higher number (Berk Citation2018). For methods using a numerical threshold to decide between absence or presence of an undesirable substance, such as the detection of animal by-products, pre-treatments resulting in a higher number of particles would increase the probability of a positive finding. It has to be concluded that methods should be precise in describing the steps for sample pre-treatment, and a method should be implemented without additional steps which are excluded from the method description.
Validation of methods for visual examination is a matter of concern for specific situations. The method for detection of processed animal proteins (Regulation (EC) 152/2009 (EC Citation2009) and amendments) is based on a wide scope and includes specific detection methods, which can optionally be applied. The detection of substances such as milk powder, blood products and lactose crystals have never been validated and proficiency tests revealed that the performance for detection of these specific materials is challenging (Veys et al. Citation2016; Fumière et al., Citation2017; Veys et al., Citation2022; van der Borg, Smits, Hedemann, et al. Citation2022). The mentioned specific detection methods, such as Alizarin Red staining for bone fragments, and tetramethylbenzidine staining for the detection of blood plasma are intended to support a better identification of these fragments and particles. However, both specific detection methods show issues with specificity and sensitivity (van Raamsdonk, Scholtens, et al. Citation2011; van Raamsdonk et al. Citation2017). At the same time, these additional methods are optional, and the annual proficiency test of the obligatory method for detection of the legally defined processed animal proteins (PAPs), organised by the European Union Reference Laboratory (EURL) for animal proteins, unequivocally reveals good performance for the primary substances, such as detection of bone fragments or muscle fibres (latest version: Veys et al. Citation2022). The same picture is also shown in the annual proficiency tests of IAG section Feedingstuff Microscopy (latest version with historical overview: van der Borg, Smits, Hedemann, et al. Citation2022). This situation of good performance of visual examination applies to other undesirable substances as well. For example, a proficiency test co-organised by the EURL for mycotoxins and plant toxins and IAG section Feedingstuff Microscopy revealed a good performance for the detection of ergot sclerotia (Peereboom et al. Citation2021).
The overall conclusion is that visual examination will have a good performance for well-established methods, provided that procedures for validation are properly implemented. The main issue is that visual examination methods cannot be validated and evaluated based on standards common for analytical chemistry.
Specific characteristics of visual examination methods
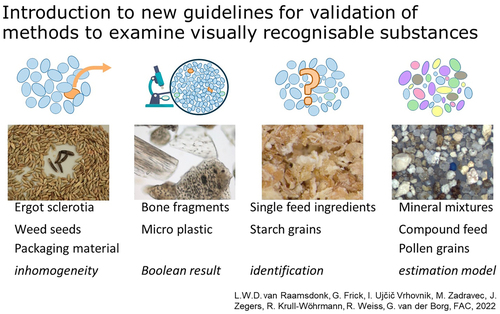
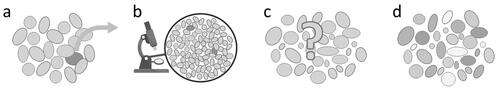
The principle of visual examination methods is the detection and identification of a low number of large units of a visually recognisable substance, either undesirable or naturally part of the sample matrix. Macroscopic detection, targeting at units larger than approximately 1 mm, allows physical extraction of the units from the sample material, followed by counting and weighing. Examples are weed seeds and ergot sclerotia. In contrast, microscopic detection at magnifications between 100× and 400x allow only counting of the targeted particles. Usually, as for processed animal proteins, these counts are translated to absence or presence of the targeted substance (Boolean result).
Another set of methods focus on the identification of a single material, either macroscopic or microscopic, based on sets of characteristics. Different feed ingredients such as soya expeller or rape seed expeller can easily be distinguished, whereas wheat bran and wheat middlings are more difficult to classify. Mixtures, such as compound feeds, can be evaluated for their contributing ingredients, including relative shares based on an estimation model developed by IAG section Feedingstuff Microscopy ().
Figure 2. (a) Macroscopic analysis (result: count, weight), (b): microscopic analysis (result: Boolean presence/absence), (c) identification (result: identity), (d): composition (result: identities and share of the ingredients).
In all cases the identification of an undesirable substance or of a legally applied ingredient relies heavily on the expertise of the laboratory staff. There is, up to now, no artificial intelligence-based application which can detect and identify these materials. Therefore, the circumstances for the actual examination such as the preparation of slides and the settings of the microscope, apart from the treatment procedures as exemplified in the previous section, should not be harmonised but should match the expertise of each individual member of the laboratory staff. Validation of a method for visual examination usually includes the validation of the expert as well.
In the important category of methods for detecting undesirable substances larger than approximately 1 mm, visual examination is aiming at the detection of a small number of large units. With lower numbers of units, frequently in the range of ten or less, the inhomogeneity will increase substantially. Therefore, homogenous batches intended as basis for validation experiments cannot be achieved for macroscopic analysis with particles exceeding approximately 1 mm (for example whole grain cereals), and duplicate sample analysis is therefore impossible. Laboratory samples for macroscopic examination have usually the size of 250–500 g, which are fully investigated. The level of detection equals at least the size of one unit, usually with a weight exceeding 1 mg, which is in the range of parts per million (ppm) when recalculated to the contamination level per kg. In the size range smaller than approximately 1 mm (microscopic analysis in strict sense) options for producing homogeneous batches do exist. Step-wise dilution is a procedure frequently applied in proficiency testing for producing comparable samples. This procedure starts with a 50/50% mixture of matrix and undesirable substance and matrix material is added and thoroughly mixed in each subsequent step to achieve homogeneous material at contamination levels of 25%, 12.5%, 6.25% etc. The two principal results are counts (numbers) and weights for macroscopic methods, or presence/absence for microscopic methods. These results do not follow a normal distribution but Poisson (counts), lognormal (weights) or binomial (Booleans) distributions apply.
Let us assume the examination of a sample of 2 kg of a granular matrix contaminated with a weed seed as undesirable substance. This situation mimics the necessary amount as indicated in Regulation (EU) 691/2013, amending Regulation (EC) 152/2009. A total amount of 2 kg will take a considerable time for examination. Therefore, the sample will be divided in four portions of 500 g each and the monitoring will start with the examination of one portion. An evaluation of the probability to find one or more seeds in that one portion at low contamination levels will show the effect of unavoidable inhomogeneity. Probabilities have been calculated using a binomial distribution, and are shown in . If only one seed is present in the total sample the probability to choose the particular portion containing the seed is 25%, and a probability to examine one of the three clean portions is 75%. The probability to choose a clean portion when 6 seeds are present drops to 17.8%. In the case of Ambrosia seeds, 6 seeds in 2 kg of material represent approximately 25% of the legal limit and at that level there is still a considerable probability to report this sample as negative, in the meaning of absence of this undesirable substance. Alternative calculations for testing even distributions show that the probability of one seed in each of the four portions is only 0.4%, which appears to be equal to the probability of all four seeds in one portion (). This inhomogeneity, which is an intrinsic characteristic of a situation with low numbers of large units, will contribute largely to the issue of measurement uncertainty.
Table 1. Probability to find zero, one or more than one seeds in one out of four portions of a sample containing N seeds calculated from a binomial distribution.
Measurement uncertainty is a major parameter for method performance (ISO 17025:2017). Typical upper confidence limits are dependent of the level of contamination and have been derived from sets of chemical analyses. Several Standards provide documentation on measurement uncertainty or are fully dedicated to this parameter (Pocklington Citation1990 (IUPAC); Thompson et al. Citation2002 (IUPAC); AOAC. Citation2002; Codex Alimentarius Citation2004; Ellison and Williams Citation2012 (Eurachem QUAM:2012); Bettencourt da Silva and Williams Citation2015 (Eurachem STMU:2015)). The most comprehensive guidance is Eurachem QUAM:2012. A parameter comparable to measurement uncertainty would only apply to macroscopic visual examination (). However, in the view of unavoidable inhomogeneity of units, measurement uncertainty as principal parameter cannot be transferred to visual examination with the same confidence limits and interpretation. Moreover, the macroscopic detection of undesirable substances results in two descriptors of the sample, either derived from the number of units and from the distribution in weight of these units. Weed seeds usually have a biologically determined diversity in their individual weight, which is reasonably limited to a factor 2 between the lightest and heaviest seeds for a given species. Sclerotia of the species belonging to the genus Claviceps have no size and weight limit and differences of a factor 50 in weight between sclerotia in the same sample have been found (van Raamsdonk and van der Voet Citation2022). This situation imposes two parameters for describing uncertainty and these two parameters are indicated as count dispersal and weight uncertainty for avoiding confusion with the traditional, analytical chemistry, interpretation. In a wider context, options for homogenisation depend also on other factors than the unit sizes of the undesirable substance and of the ingredients of the matrix. Semi-fluid samples could provide a better probability for homogenization. Preliminary results of a Wageningen Food Safety Research (WFSR) validation study of a method to detect packaging material in candy syrup, a molasses replacer, show a much smaller inhomogeneity (van Raamsdonk, Smits, van der Borg Citation2022). Candy syrups combine a large range of unit sizes, up to single fibres of paper and carton, a relatively large number of particles, even at low contamination levels, and easy mixing due to the semi-fluid nature. The matrix can be diluted to dissolve the sugars and subsequent sieving will concentrate the remnants of packaging materials. This example reveals that the currently known level of inhomogeneity for weed seeds and ergot sclerotia cannot be extrapolated to other situations.
To summarise, the effect of a target present in few large units is a level of inhomogeneity, exceeding considerably the situation found in analytical chemistry. These units can be individually handled for weighing and identification. There is a wide range of homogeneity situations between the myriad of molecules at one side and those few large units at the other side of the spectrum. Particles smaller than approximately 1 mm cannot be handled physically, and the only options are counting and microscopic identification. Particles in the nano range, for instance nano plastic, have a size beyond the limits of optical detection with visual light.
Strategies for the application of quality parameters
Implementation of examination methods for feed and food quality and safety should follow intralaboratory guidelines including validation (ISO 17025:2017) and interlaboratory proficiency testing (ISO 17043:2010). This fully applies to visual examination methods as well. The translation to specific situations will not follow the path as common for chemical detection methods. Examples of some of these differences will be derived for visual methods in the next section.
Macroscopic analysis: particles larger than 1 mm
Due to the discussed inhomogeneity, batch material cannot be reliably produced in a range of situations. Grinding for homogenisation, as mentioned in Regulation (EC) 152/2009 (Annex II), is not applicable to any granular matrix for visual examination. The alternative option for validation studies and for proficiency testing is to spike the samples individually, each with their unique number and weight of the particles. The usual intention is to produce samples with comparable numbers and weights of spiked material per experiment or per sample type. This means that exclusively in a numerical sense, an average spike level can be calculated per experiment. However, the results of the examinations cannot be compared to that average level, since each individual spike amount
from a set of i comparable but non-identical samples might show a small, but known and relevant deviation from that average.
The analysis of the entire sample is one option for sample examination to achieve a reliable and representative result in terms of the number and weights of the units found. Remaining factors in weight uncertainty would be air moisture and wearing of the particles, since inhomogeneity is avoided by examining the entire amount of spiked sample material. Subsampling, which might be a common procedure in practice in analytical chemistry, would introduce the already discussed inhomogeneity.
Recovery/trueness
For methods in the domain of analytical chemistry, the recovery of a contaminant from a set of samples i, each representing a homogeneous batch of material can be calculated as:
(1)
(1)
which can be rewritten as:
(2)
(2)
with
=
as average of the recovered amounts y over n samples. Instead of comparing this value with the level of the original batch
every result
will be compared to the spike level
of the same sample i:
(3)
(3)
which is numerically equal to EquationEquation (2)
(2)
(2) . This alternative calculation provides a measure for deviation from the hypothetical true value
specified for the situation of visual examination methods.
Repeatability and reproducibility
Subsampling for producing duplicate samples is a necessary action for collecting data to calculate repeatability and reproducibility. As demonstrated, this will result in differences among these samples due to inhomogeneity, and an alternative strategy has been developed. A sample as described for recovery will be analysed. Subsequently, the selected units of the undesirable substance will be reintroduced in the matrix material, stored for a couple of days, up to a week, and examined again. The two examinations can be expected to produce identical results, since they both apply to the same material. Examinations with a time interval are typically indicated as results obtained under reproducibility circumstances and in the absence of true duplicates a value for repeatability cannot be calculated.
Repeatability standard deviation for methods detecting chemical compounds is usually calculated from two duplicate results as:
(4)
(4)
Repeatability can be considered part of reproducibility (Currie Citation1995; AOAC Citation2002) and can thus be included as factor in the calculation of the reproducibility standard deviation:
(5)
(5)
with
as the result of the third examination under reproducibility circumstances and
as average value of sample i for the first two examinations.
In the situation of only two results for sample i the reproducibility standard deviation for visual examination can be calculated as:
(6)
(6)
The background of this calculation differs from that in EquationEquation (5)(5)
(5) by the absence of the term representing a part of the repeatability standard deviation.
WFSR has examined for the years 2016–2020 the full material of regular monitoring samples of bird feed for weed seeds (Ambrosia, Datura) and cereals for ergot sclerotia by dividing the samples in four subsamples of approximately 500 g. The results showed relative standard deviations up to 173% in the case of one seed in four subsamples. The results have been used to calculate analytical thresholds for assuring that a result below that threshold is a true indication of the contamination level of the total sample below the related legal limit with 95% probability. These analytical thresholds appear to be dependent of three factors: the diversity in weight of the units, the level of the legal limit, and the number of subsamples initially examined out of four subsamples. Thresholds are fixed at higher contamination levels after examination of two subsamples instead of only one (van Raamsdonk and van der Voet Citation2022).
Microscopic analysis: particles smaller than 1 mm
Homogeneous batch material can be produced for matrices with particles smaller than approximately 1 mm. Still, samples need to be homogenised by stirring prior for taken the test aliquots, which are typically of the size of 2 or 10 g, and several microscopic slides are to be examined. The current implementation of microscopic detection of an undesirable substance is based on the transformation of a count to a Boolean (presence/absence), which applies in particular to the detection of animal by-products. After a workshop in Denmark in 1998 gathering microscopic experts (Anonymous Citation1998) with the intention to provide supporting documentation for the newly released Directive 98/88 (EC Citation2008), a set of three proficiency tests was organised. The results were reported as estimated contamination levels (Engling et al. Citation2000). Parameters for presenting the frequencies of correct results (accuracy), and of sensitivity and specificity were proposed by Langton et al. (Citation2002), which are modified versions of the class of similarity coefficients (Sneath and Sokal Citation1973). These parameters were used soon after their publication in interlaboratory studies (van Raamsdonk et al. Citation2003; Gizzi et al. Citation2004). The relationship between a count and a contamination level has proven to be weak (Veys et al. Citation2007).
Accuracy (correctness)
The basic results of the examination of a set of identical samples are numbers of true or false results, either positive or negative. The following equations are designed to calculate the statistics sensitivity and specificity:
(7)
(7)
and
(8)
(8)
with TP = number of true positives, FN = false negatives, TN = true negatives and FP = false positives. These parameters show values of 1 or 100% for sets of results without errors. The frequency of correct positives (correct indication of presence of the target; TP) is an indication of the sensitivity of the method. When measured at different contamination levels, the lowest level with a value at or higher than an a priori fixed threshold is an indication of the sensitivity in terms of numbers/kg or mg/kg. Thresholds can be fixed at 0.9 (90%) or 0.95 (95%) for indicating a probability of 0.9 or 0.95 to obtain correct positives at that contamination level. Specificity will be based on the results of the examination of blanks. It is an indication of the probability of correct negative results (TN), which cannot directly be translated to a limit of detection. Different types of samples will result in different values for sensitivity. For example, a sensitivity value can be calculated for terrestrial animal material in compound feed in the absence of fish meal using data obtained from samples exclusively containing a known level of terrestrial animal material. Additionally, a performance parameter can be calculated for the correct detection of terrestrial animal material in the presence of fish meal, based on a second set of samples, containing material of both terrestrial animals and fish.
The total frequency of correct results at any level, blank and one or more contamination levels, can be calculated by combining the obtained results:
(9)
(9)
with fractions as defined for EquationEquations (7)
(7)
(7) and Equation(8)
(8)
(8) and the sum TP + FP + FN + TN equalling the total number of examined samples. This quality parameter is the general indicator for the performance in a validation study or of a participant in a proficiency test. It is usually indicated as accuracy and has been used in all relevant proficiency tests in the past since the introduction in 2003.
Note that the usually applied term accuracy is replaced by ‘correctness’ (CS) for avoiding confusion. Accuracy is, besides precision, one of the two major categories of quality parameters according to some guidelines (Thompson et al. Citation2002; AOAC Citation2016, Annex B, Figure A1). The group of accuracy parameters indicates a relation of the test result with the true value and could include trueness or bias, decision limit, detection limit, selectivity among others. Another option for terminology is trueness and precision as parameters for accuracy as container term (ISO 3534-1:2006; Regulation (EU) Citation2021/808). AOAC (Citation2002) recommends avoiding the term accuracy for the existence of multiple definitions.
Precision
Repeatability and reproducibility as common parameters for indicating the precision of a method are based on the numerical difference among results of duplicate analyses. In the situation of Booleans the frequency of different results between duplicates can still be used as basis for an indication of precision. The analogue parameters accordance and concordance have been developed to calculate repeatability and reproducibility, respectively, for Boolean results (Langton et al. Citation2002; van der Voet and van Raamsdonk Citation2004).
Identification
The procedures for establishing a composition of a mixture (e.g. compound feed) or an identity of a feed or food ingredient are primarily based on the expertise of the laboratory staff or his/her capability to explore relevant sources of information. Basically, the detection of undesired substances, either microscopically or macroscopically, is also based on the knowledge of how to distinguish these substances from mimicking materials. It is essential to define a priori the diversity which should positively be identified as the intended target (inclusivity list) or which should be identified as not belonging to the intended target (exclusivity list). Most decision support systems aiding in the process of identification and developed by WFSR are based on libraries consisting of both types of materials.
The validity of a combination of a procedure and the expertise of laboratory staff can be established by examining samples with known identity, but examined as blind samples by the staff. This approach will produce pairs of results, one correct a-priori identity and one confirming or deviating a-posteriori result. All cases where the a-posteriori results equal the (a-priori) identity confirm the correct application of the procedure. This approach can only be applied in a situation where documented samples are readily available. Alternatively, sets of undocumented samples can be examined twice. This alternative approach will only produce information on correct replication of identities regardless of the trueness of the identity itself. Information can be collected in a situation of two examiners for both sets of samples, or one examiner with a (large) time interval between the two examinations of each sample. In both cases pairs of result are available. Accordance is no option for evaluating these pairs, since the results are not established under repeatability circumstances. Concordance can be applied for evaluation or another type of parameter such as the Kappa coefficient (Stehman Citation1997; McHugh Citation2012).
Guidance documents
The principles as summarised in this paper are laid down in a Guidance document consisting of two parts. Part 1 presents and discusses the general principles of visual examination and part 2 presents the actual experimental designs of validation studies and the evaluation of the results. The general principles include the relationship of the intended quality assurance parameters with ISO 17025:2017, the different types of methods and the relevant parameters for each type, guidance for method development, structuring quality control in practice and principles for the evaluation of proficiency tests related to ISO 17043:2010. The second part can be used as Standard Operational Procedure in quality assurance systems. The total of the two parts is currently available as a WFSR report (van Raamsdonk, Frick, et al. Citation2022).
Outreach
Basically, analytical methods are being adopted from four domains for monitoring safety hazards in food and feed: analytical chemistry, microbiology, biology and physics. The Guidance document explains the position of visual inspection, which covers parts of biology and is the predominant approach for physical hazards.
The general knowledge of biological structures necessary for interpreting the identity of biological units can be made available by microscopists for laboratory staff in other domains. For example, under a suspicion of one ingredient in a compound feed carrying a chemical contamination, visual examination can provide separate portions of all or of selected ingredients for individual chemical analysis. This would result in effective traceability of contaminants and of ingredients. The domain of physical hazards needs increasing attention in the scope of further development of circular agronomy. It is desirable to revalue former food products by using them as feed ingredients. A lot of former food products need unpacking, and bakery by-products and candy syrup are examples of residual streams already utilised. Other residual streams will follow. Another perspective is the increasing issue of microplastics in environment and cosmetics, which will result in increasing levels of microparticles in feed and food. Recent results show the presence of microplastic in blood (Leslie et al. Citation2022). At the same time, results of toxicological studies of microparticles are very limited, and examination methods for detection of physical particles in plant and animal products intended as feed and food ingredient are urgently needed (van Raamsdonk et al. Citation2020). A network of an EURL accompanied with National Reference Laboratories (NRLs) for physical hazards in the European Union is strongly recommended. The establishment of procedures for quality assurance and control would facilitate these and other initiatives.
The process of developing the Guidance for validation of visual examination methods had several side effects. A range of factors has been found and discussed for the development of new visual examination methods. The inventory of the areas of applicability revealed that visual monitoring will provide a major contribution to the current aims of a circular production of feed and food. Examples are the reuse of animal by-products and of former food products in the feed production chain.
Acknowledgements
We thank H. van der Voet, Biometris, WUR, Wageningen, the Netherlands and C. von Holst, JRC, Geel, Belgium for statistic support.
Disclosure statement
No potential conflict of interest was reported by the author(s).
Additional information
Funding
Notes
1 Germany, 2009. http://www.dlr-rheinpfalz.rlp.de/Internet/global/themen.nsf/0/057DC13B95E94737C1257611004D04FF/$FILE/Kreuzkraut_in_Rucola.pdf; http://www.spiegel.de/wirtschaft/service/giftpflanze-im-rucola-gestruepp-des-grauens-a-643634.html. Germany, 2016 http://www.cvuas.de/pub/beitrag.asp?subid=1&Thema_ID=5&ID=2354.
2 Canada, 2010. https://www.foodsafetynews.com/2010/05/nescafe-espresso-recalled-for-glass-fragments/. Ireland, 2010: https://www.independent.ie/irish-news/nestle-recalls-products-after-glass-found-in-jars-26657257.html. Germany, 2021: https://www.foodsafetynews.com/2021/11/warning-after-counterfeit-nestle-coffee-found-in-germany/.
References
- Alm T. 2003. The witch trials of Finnmark, northern Norway, during the 17th century: evidence for ergotism as a contributing factor. Econ Bot. 57(3):403–416. doi:10.1663/0013-0001(2003)057[0403:TWTOFN2.0.CO;2]
- Amato G, Desiato R, Giovannini T, Pinotti L, Tretola M, Gili M, Marchis D. 2017. Gravimetric quantitative determination of packaging residues in feed from former food. Food Addit Contam Part A Chem Anal Control Expo Risk Assess. 34(8):1446–1450. doi:10.1080/19440049.2017.1337277
- Anonymous. 1998. Workshop on identification of animal ingredients in compound feed focusing on the microscopical method for identification. Copenhagen: Ministry of Food, Agriculture and Fisheries, The Danish Plant Directorate (J.S. Jorgenson, M.Sc.Agric.), CEMA-DG VI-SMT Program.
- AOAC. 2002. Appendix D: guidelines for collaborative study procedures to validate characteristics of a method of analysis. Available from: http://www.eoma.aoac.org/appendices.asp.
- AOAC. 2016. Appendix F: guidelines for standard method performance requirements. Available from: http://www.eoma.aoac.org/appendices.asp.
- Berk Z. 2018. Food process engineering and technology. 3rd ed. London, San Diego: Academic Press, Chapter 6: Size reduction.
- Bettencourt da Silva R, Williams A, editors. 2015. Eurachem/CITAC guide: setting and using target uncertainty in chemical measurement. 1st ed. Available from: https://www.eurachem.org/index.php/publications/guides/gd-stmu.
- CEN. 2018. EN 15587 - cereals and cereal products - determination of Besatz in wheat (Triticum aestivum L.), durum wheat (Triticum durum Desf.), rye (Secale cereale L.) and feed barley (Hordeum vulgare L.). Pilsen: European Standards.
- Codex Alimentarius. 2004. Guidelines on measurement uncertainty. CAC/GL 54-2004. Geneva: WHO.
- Currie LA. 1995. Nomenclature in evaluation of analytical methods including detection and quantification capabilities (IUPAC Recommendations 1995). Pure Appl. Chem. 67(10):1699–1723. doi:10.1351/pac199567101699
- Ellison SLR, Williams A, editors. 2012. Eurachem/CITAC guide number 4: quantifying uncertainty in analytical measurement. 3rd ed. Available from https://www.eurachem.org/index.php/publications/guides/quam.
- Engling FP, Jørgenson JS, Paradies-Severin I, Hahn H. 2000. Evidence of animal meal in feeds. FeedMagazine/Kraftfutter. 1:14–17.
- European Commission. 2008. Commission Directive 98/88/EC of 13 November 1998 establishing guidelines for the microscopic identification and estimation of constituents of animal origin for the official control of feedingstuffs. OJ L. 318:45–50.
- European Commission. 2009. Commission Regulation (EC) No 152/2009 of 27 January 2009 laying down the methods of sampling and analysis for the official control of feed. OJ L. 54:1–130.
- European Food Safety Authority (EFSA). 2007. Opinion of the scientific panel on contaminants in the food chain on a request from the European Commission related to Pyrrolizidine alkaloids as undesirable substances in animal feed. EFSA J. 447:1–51.
- European Food Safety Authority (EFSA). 2011. Panel on Contaminants in the Food Chain (CONTAM) Scientific Opinion on Pyrrolizidine alkaloids in food and feed. EFSA J. 9:2406–2539.
- European Food Safety Authority (EFSA). 2012. Compendium of botanicals reported to contain naturally occurring substances of possible concern for human health when used in food and food supplements. EFSA J. 10:2663–2722. doi:10.2903/j.efsa.2012.2663
- European Union. 2002. Directive 2002/32/EC of the European parliament and of the council of 7 May 2002 on undesirable substances in animal feed. OJ L. 140:10–22.
- European Union. 2021. Commission Implementing Regulation (EU) 2021/808 of 22 march 2021 on the performance of analytical methods for residues of pharmacologically active substances used in food-producing animals and on the interpretation of results as well as on the methods to be used for sampling and repealing decisions 2002/657/EC and 98/179/EC. OJ L. 180:84–114.
- FAO and WHO. 2019. Hazards associated with animal feed. Report of the Joint FAO/WHO expert meeting – 12–15 May 2015, FAO headquarters, Rome, Italy. FAO animal production and health report no. 13.
- Frick G, Boschung H, Schulz-Schroeder G, Russ G, Ujčič-Vrhovnik I, Jakovac-Strajn B, Angetter D, John I, Jørgensen JS. 2011. Ragweed (Ambrosia sp.) seeds in bird feed. Biotechnol Agron Soc Environ. 15(S1):39–44.
- Frohne D, Pfänder HJ. 2005. Poisonous plants. A handbook for doctors, pharmacists, toxicologists, biologists and veterinarians. 2nd ed. London: Manson Publ. Ltd.
- Fumière O, Veys P, Marien A, Baeten V, Berben G. 2017. Combined microscopy-PCR EURL-AP Proficiency Test 2016. Final version. European Union Reference Laboratory for Animal Proteins in feedingstuffs, Walloon Agricultural Research Centre, Gembloux, Belgium.
- Gassner G, Hohmann B, Deutschmann F. 1989. Mikroskopische Untersuchungen pflanzlicher Lebensmittel, 5. Auflage. Stuttgart: Gustav Fischer Verlag.
- Gizzi G, von Holst C, Baeten V, Berben G, van Raamsdonk LWD. 2004. Determination of Processed Animal Proteins, Including Meat and Bone Meal, in Animal Feed. J AOAC. 87(6):1334–1341. doi:10.3390/ijms17040445
- Hahn H, Michaelsen I. 1996. Mikroskopische Diagnostik pflanzlicher Nahrungs-, Genuss- und Futtermittel, einschliesslich Gewuerze. Berlin: Springer Verlag.
- Hohmann B. 2006. Mikroskopische Untersuchung Pflanzlicher Lebensmittel Und Futtermittel. Hamburg: Behr’s Verlag.
- Horwitz W. 1995. Protocol for the design, conduct and interpretation of method-performance studies (IUPAC technical report). Pure Appl Chem. 67(2):331–343. doi:10.1351/pac199567020331
- Horwitz W, Albert R. 2006. The Horwitz Ratio (HorRat): a useful index of method performance with respect to precision. J AOAC Int. 89(4):1095–1109. doi:10.1093/jaoac/89.4.1095
- ISO. 2010. Conformity assessment - general requirements for proficiency testing. ISO/IEC 17043:2010(E). Brussels: CEN/CENELEC.
- ISO. 2010. Spices – saffron (Crocus sativus L.) – part 2: test methods. Geneva: NEN-ISO 3632-2:2010.
- ISO. 2017. General requirements for the competence of testing and calibration laboratories. Geneva: ISO/ICE 17025:2017(E).
- Kakar F, Akbarian Z, Leslie T, Mustafa ML, Watson J, Egmond H. v, Omar MF, Mofleh J. 2010. An Outbreak of hepatic veno-occlusive disease in western Afghanistan associated with exposure to wheat flour contaminated with pyrrolizidine alkaloids. J Tox. 2010:1–7. doi:10.1155/2010/313280
- Krska R, Crews C. 2008. Significance, chemistry and determination of ergot alkaloids: a review. Food Addit Contam A Chem Anal Control Expo Risk Assess. 25(6):722–731. doi:10.1080/02652030701765756
- Langton SD, Chevennement R, Nagelkerke N, Lombard B. 2002. Analysing collaborative trials for qualitative microbiological methods: accordance and concordance. Int J Food Microbiol. 79(3):175–181. doi:10.1016/S0168-1605(02)00107-1
- Leslie HA, van Velzen MJM, Brandsma SH, Vethaak D, Garcia-Vallejo JJ, Lamoree MH. 2022. Discovery and quantification of plastic particle pollution in human blood. Environ Int. 163:107199. doi:10.1016/j.envint.2022.107199
- Liu X, Han LJ, Veys P, Baeten V, Jiang XP, Dardenne P. 2011. An overview of the legislation and light microscopy for detection of processed animal proteins in feeds. Microsc Res Tech. 74(8):735–743. doi:10.1002/jemt.20951
- Lorenz K, Hoseney RC. 1979. Ergot on cereal grains. CRC Crit Rev Food Sci Nutr. 11(4):311–354. doi:10.1080/10408397909527267
- Marchis D, Amato G, Giovannini T, Khadjavi A, Morello S, Gili M, Pinotti L, Ujčič Vrhovnik I. 2021. Gravimetric quantitative validation of botanic impurities in feed. J Sci Food Agric. 101(3):1047–1052. doi:10.1002/jsfa.10713
- McHugh ML. 2012. Interrater reliability: the kappa statistic. Biochem Med. 22(3):276–282. doi:10.11613/BM.2012.031
- Peereboom DPKH, Hedemann JBGM, Smits CPAF, de Nijs M, van Raamsdonk LWD. 2021. Proficiency test for ergot sclerotia in cereals; EURLPT-MP05 (2020). Report 2021.002. Wageningen: Wageningen Food Safety Research.
- Pocklington WD. 1990. Harmonized protocols for the adoption of standardized analytical methods and for the presentation of their performance characteristics. Pure Appl Chem. 62(1):149–162. doi:10.1351/pac199062010149
- Rahfeld B. 2009. Mikroskopischer Farbatlas pflanzlicher Drogen. Heidelberg: Spektrum.
- Sawyer R. 1981. Pollen identification for beekeepers. Cardiff: University College Cardiff Press.
- Sawyer R. 1988. Honey identification. Cardiff: Cardiff Academic Press.
- Scott PM. 2009. Ergot alkaloids: extent of human and animal exposure. World Mycotoxin J. 2(2):141–149. doi:10.3920/WMJ2008.1109
- Seidemann J. 1966. Stärke-Atlas. Berlin: Parey.
- Sneath PHA, Sokal RR. 1973. Numerical taxonomy. The principles and practice of numerical classification. San Francisco: W.H. Freeman and Company.
- Stehman SV. 1997. Selecting and interpreting measures of thematic classification accuracy. Remote Sens Environm. 62(1):77–89. doi:10.1016/S0034-4257(97)00083-7
- Thompson M, Ellison SLR, Wood R. 2002. Harmonized guidelines for single laboratory validation of methods of analysis (IUPAC technical report). Pure Appl Chem. 74(5):835–855. doi:10.1351/pac200274050835
- van der Voet H, van Raamsdonk LWD. 2004. Estimation of accordance and concordance in inter-laboratory trials of analytical methods with qualitative results. Intl J Food Microbiol. 95:231–234. doi:10.1016/j.ijfoodmicro.2004.03.013
- van Raamsdonk LWD, Prins TW, Meijer N, Scholtens I, Bremer M, de Jong J. 2019. Bridging legal requirements and analytical methods of animal proteins in feed for eradication of prion diseases. Food Add Cont A. 36(1):46–73. doi:10.1080/19440049.2018.1543956
- van Raamsdonk LWD, Frick G, Ujčič Vrhovnik I, Zadravec M, Zegers J, Krull-Wöhrmann R, Weiss R, van der Borg G. 2022. Quality assurance and control of visual methods for feed and food inspection. Part 1: theory and principles, part 2: validation. Report 2022.006. Wageningen: Wageningen Food Safety Research.
- van Raamsdonk LWD, Pinckaers VGZ, Scholtens IMJ, Prins TW, van der Voet H, Vliege JJM. 2014. IAG ring test animal proteins 2014. Report 2014.011. Wageningen: RIKILT. http://edepot.wur.nl/323884
- van Raamsdonk LWD, Prins TW, van de Rhee N, Vliege JJM, Pinckaers VGZ. 2017. Microscopic recognition and identification of fish meal in compound feeds. Food Addit Contam A Chem Anal Control Expo Risk Assess. 34(8):1364–1376. doi:10.1080/19440049.2017.1283711
- van Raamsdonk LWD, Rijk R, Schouten GPJ, Mennes W, Meijer GAL, van der Poel A, de Jong J. 2011. A risk evaluation of traces of packaging materials in former food products intended as feed materials. Report 2011.002. Wageningen: RIKILT. http://edepot.wur.nl/171617.
- van Raamsdonk LWD, Smits CPAF, van der Borg G. 2022. A validated method for detection and quantification of packaging materials in candy syrup. Report 2022.008. Wageningen: Wageningen Food Safety Research.
- van der Borg G, Smits CPAF, Hedemann B, Prins TW, van Raamsdonk LWD. 2022. IAG proficiency test animal proteins 2022. Report 2022.010. Wageningen: Wageningen Food Safety Research.
- van Raamsdonk LWD, van der Voet H. 2003. A ring trial for the detection of animal tissues in feeds in the presence of fish meal. Report 2003.012. Wageningen: Wageningen Food Safety Research. https://edepot.wur.nl/34989
- van Raamsdonk LWD, van der Voet H. 2022. Measurement uncertainty for detection of visual impurities in granular feed and food materials in relation to the investigated amount of material. Food Add Contam. 39:1265–1283. doi:10.1080/19440049.2022.2066193
- van Raamsdonk LWD, van der Zande M, Koelmans AA, Hoogenboom RLAP, Peters RJB, Groot MJ, Peijnenburg AACM, Weesepoel YJA. 2020. Current insights into monitoring, bioaccumulation, and potential health effects of microplastics present in the food chain. Foods. 9(1):72–99. doi:10.3390/foods9010072
- van Raamsdonk LWD, van Scholtens IMJ, Ossenkoppele J, van Egmond H, Groot M. 2011. Investigation into blood plasma in milk formula. Report 2011.003. Wageningen: RIKILT. http://edepot.wur.nl/184869
- van Raamsdonk LWD, van Vancutsem J, Jorgensen JS. 2009. A survey on the presence of undesirable botanical substances in feed in the European Union. Biotechnol Agron Soc Environ. 13(S):33–38.
- van Raamsdonk LWD. 2007. A survey for the presence of botanic undesirable substances in feed. Report 2007.004. Wageningen: Wageningen Food Safety Research. http://edepot.wur.nl/39987.
- Veys P, Berben G, Baeten V. 2007. CRL-AP Proficiency Test 2007. Final report. Gembloux: Community Reference Laboratory for Animal Proteins in feedingstuffs, Walloon Agricultural Research Centre.
- Veys P, Fumière O, Marien A, Baeten V, Berben G. 2016. Combined microscopy-PCR EURL-AP Proficiency Test 2015. Final version. European Union Reference Laboratory for Animal Proteins in feedingstuffs, Walloon Agricultural Research Centre, Gembloux, Belgium.
- Veys P, Fumière O, Marien A. 2022. Combined microscopy-P CR EURL-AP Proficiency Test 2021. Final version. European Union Reference Laboratory for Animal Proteins in feedingstuffs, Walloon Agricultural Research Centre, Gembloux, Belgium.
- Woolf A. 2000. Witchcraft or mycotoxin? The Salem witch trials. J Toxicol Clin Toxicol. 38(4):457–460. doi:10.1081/clt-100100958