
 ?Mathematical formulae have been encoded as MathML and are displayed in this HTML version using MathJax in order to improve their display. Uncheck the box to turn MathJax off. This feature requires Javascript. Click on a formula to zoom.
Abstract
Previous studies were mostly conducted based on two-dimensional feature space to monitor salinization, while studies on dense long-term salinization monitoring based on three-dimensional feature space have not been reported. Based on Landsat TM/ETM+/OLI images and three-dimensional feature space method, this study introduced six typical salinization surface parameters, including NDVI, salinity index, MSAVI, surface albedo, iron oxide index, wetness index to construct eight different feature space monitoring index. The optimal soil salinization monitoring index model was proposed base on field observed data and then the evolution process of salinization in Yellow River Delta (YRD) were analyzed and revealed during 1984–2022. The salinization monitoring index model of MSAVI-Albedo-IFe2O3 feature space had the highest accuracy with R2 = 0.93 and RMSE = 0.678g/kg. The spatial distribution of salinization in YRD showed an increasing trend from inland southwest to coastal northeast and the salinization intensity showed an increasing trend during 1984–2022 due to the implements of agricultural measures such as planting salt-tolerant crops, microbial remediation and fertility improvement. The rate of salinization deterioration in the northeast part was greater than others. Zones of salinization improvement were mainly located in cultivated land of the southwest parts.
1. Introduction
Soil salinization, one of the typical land degradation types, can be attributed to the comprehensive actions of natural factors and human activities (Chang et al. Citation2015 Luo Citation2015,; Wang et al. Citation2018; Abdennour et al. Citation2021). It seriously affects the stability and sustainable development of the ecological environment. Saline soil can be divided into inland saline soil and coastal saline soil according to the geo-graphical location. Coastal saline soil is the main type of saline soil in Shandong, which is mostly distributed in YRD and the southern coast of Laizhou Bay (Liu Citation2016). The modern YRD with only 160 years has the youngest land in China since the Yellow River diverted into the Bohai Sea in 1855, which was bred by the sediment accumulation of the Yellow River (Liu Citation2016; Wang et al. Citation2018). The problem of salinization in YRD is particularly prominent, which greatly restricts the local economic development (Li et al. Citation2020; Wang et al. Citation2020; Duan et al. Citation2021), seriously threatening the stability of wetland ecosystem and the layout of regional ecological protection red line (Yao et al. Citation2006). Therefore, accurate monitoring of soil salinization, and then grasping its spatial and temporal evolution patterns can provide approach and decision supports for the accurate remediation and treatment for the salinization in YRD.
With the launch of more satellites, remote sensing has become one of the important approaches to realize large-scale salinization monitoring (Wang et al. Citation2018; Guo et al. Citation2022a). Cao et al. (Citation2014) explored the feasibility of extracting salinization information by remote sensing in YRD based on Landsat satellites. In recent years, many scholars have utilized typical parameters that inversed from remote sensing images to construct two-dimensional feature space for monitoring salinization information and achieved good results with the overall accuracy of 80–90% (Jia et al. Citation2020; He et al. Citation2021). Ha et al. (Citation2009) selected the salinity index and surface reflectance to construct feature space model, and then obtained the spatial distribution of soil salinization in Keriya oasis. Wang et al. (Citation2010) utilized the NDVI and salt index to propose the NDVI-SI feature space model, and then quantitatively analyzed the salinization of Yutian Oasis in Xinjiang. Ding et al. (Citation2013) proposed the MSAVI-WI feature space model to monitor soil salinization in arid areas. Ding et al. (Citation2013) analyzed and explored the effects of three different land use types on the physical and chemical properties of saline-alkali soils in the YRD using a combination of field investigation and indoor analysis. Wang et al. (Citation2016) analyzed the spatial variability of soil water and salinity in Kenli District of the YRD and the micro-domain characteristics of soil salinity in the study area were explored in summer. Zou et al. (Citation2017) investigated the temporal and spatial evolution characteristics of soil salinity in the YRD under reclamation and natural conditions, and found that artificial reclamation could reduce the degree of soil salinization to a certain extent. Guo et al. (Citation2019a) developed a novel feature space monitoring index model of salinization based on vegetation index and salt index in YRD. However, soil degradation caused by salinization is often affected by both man-made and natural factors, known as primary or secondary salinization (Abdennour et al. Citation2019). The above studies are mostly based on the two-dimensional feature space model to monitor soil salinization information, and cannot consider the influence of the interaction of multiple types of factors on the inversion of salinization information. In mathematics, the number of variables in three-dimensional space is more than that in two-dimensional space, and three-dimensional space can consider the influence of more interaction factors on salinization. In addition, the salinization process is always influences by many natural-artificial factors. Therefore, three-dimensional space is more conductive to improve the inversion accuracy of salinization than two-dimensional space. In addition, previous studies are mostly conducted to analyze the evolution process and pattern of salinization from the perspective of sparse time series. Li and Gao (Citation2018) utilized the spatial overlay analysis and geostatistical simulation methods to analyze the spatial and temporal evolution of soil salinization from 2013 to 2016 based on ArcGIS 10.2. Li et al. (Citation2020) adopted the long-term sequence Landsat images from 1976 to 2018 to investigate the relationship between the evolution of coastal erosion and deposition in the YRD since 1976. Although it can reveal the temporal and spatial variation characteristics of regional salinization to a certain extent, it is difficult to monitor and capture the mutation process of salinization and its critical threshold information.
In this study, a three-dimensional feature space salinization monitoring model has been constructed and proposed by introducing multiple types of surface parameters, and then the long time series data sets of salinization from 1984 to 2022 have been retrieved. Finally, the evolution mode and characteristics of salinization in the modern YRD have been analyzed from the perspectives of gradual change and mutation.
2. Materials and methods
2.1. Study area
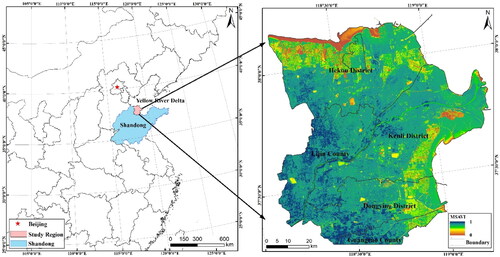
The Yellow River Delta(YRD) (), located in northern Shandong Province of China (118cha′–119located in northern Shandong Province of China (118c0 km2. The YRD is a warm temperate semi-humid continental monsoon climate with clear four seasons and flat terrain (Li et al. Citation2011; Guo et al. Citation2019a). The temperature is higher in summer, while that of winter climate is cold, with a large temperature difference. The average annual precipitation in YRD is 594 mm, and its spatial distribution is very uneven (Liu et al. Citation2015; Chen et al. Citation2017; Guo et al. Citation2019b). The maximum evaporation is in summer, followed by that in spring and autumn. The study region is prone to drought with great evaporations and relative less precipitation. The terrain is high in southwest and low in northeast. Due to its unique geographical location, the YRD has high groundwater level and high groundwater mineralization (Guo et al. Citation2022b; Guo et al. Citation2023). At the same time, frequent storm surges and seawater recharge further exacerbated the salinization condition. The YRD is located in the transition zone of atmosphere, ocean, river and land. It has typical multiple ecological interfaces and fragmented surface landscape patterns (especially wetlands), which leads to severe environmental gradients and rapid salinization succession.
Figure 1. Overview of the study area.
2.2. Data collection and preprocessing
The datasets of Landsat5 TM, Landsat7 ETM + and Landsat8 OLI images (Path/Row, 121/34, Leavel-1) during 1984–2022 were obtained from the geographic spatial data cloud (http://www.gscloud.cn/). The spatial resolution of the images was 30 m, and the data acquisition time was mainly concentrated in March, April and May (). The cloud coverage of most images was less than 5%. Geometric correction module of ENVI5.3 was applied to calibrate the geometric deformation and error of the images and Fast Line-of-sight Atmospheric Analysis of Spectral Hypercube (FLAASH) module of ENVI5.3 was utilized to eliminate the influence of atmospheric scattering and absorption (Hu et al. Citation2014;Liu et al. Citation2022). In addition, the Landsat Gapfill tool was applied to repair the bands of Landsat7 image to eliminate the periodic scanning bands (Tang et al. Citation2005).
Table 1. List of Landsat images and its detail information.
2.3. Methods
2.3.1. Principle of feature space
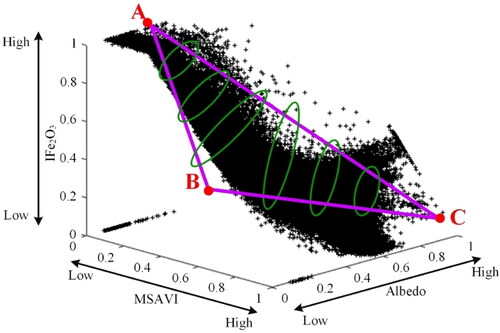
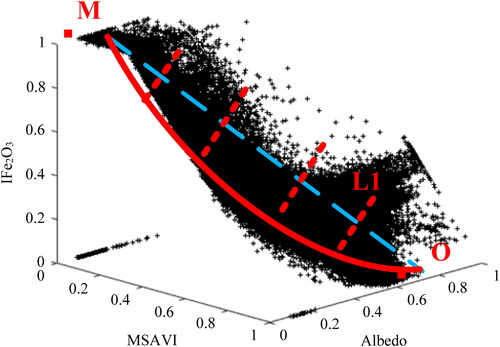
Feature space refers to the plane space constructed by typical parameters as horizontal and vertical axes in the coordinate system (Ding et al. Citation2013; Guo et al. Citation2019b). This model has been widely used in monitoring the process of land degradation, including desertification, rocky desertification and salinization (Ha et al. Citation2009; Guo et al. Citation2020; Guo et al. Citation2023). Based on the feature space, this study selected the optimal parameter combination to establish the feature space index model for salinization monitoring. Studies of salinization on field observed data can obtain accurate results, which are not suitable for large-scale salinization monitoring (Li et al. Citation2017; Wu et al. Citation2018). With the development of earth observation technology in recent years, remote sensing monitoring technology has been widely used in salinization monitoring (Li et al. Citation2012). Many studies are conducted based on fuzzy analytic hierarchy process, comprehensive index method and image classification method, which would amplify the effects of some factors on salinization (Wu et al. Citation2018; Wang et al. Citation2020). Moreover, these methods cannot explain the interaction between surface parameters and ignore the spatial characteristics of each parameter (Gu et al. Citation2021). In recent years, many scholars have introduced some surface parameters to construct feature space models for salinization monitoring, and have achieved good results with the overall accuracy of 80–90% (Ding et al. Citation2013; Wang et al. 2013; Yao et al. Citation2021). The feature space model can better consider the interactions of typical surface parameters on the process of salinization. Therefore, the feature space model has been applied to monitor the salinization in this paper. With the aggravation of salinization, the surface soil salt accumulation is not conducive to the growth of vegetation, and the vegetation coverage shows a decreasing trend () (Meng et al. Citation2016;Yao et al. Citation2021). With the accumulation of saline in surface soil, Albedo and IFe2O3 both show an increasing trend. In this study, MSAVI-Albedo-IFe2O3 feature space has been taken as an example, A represents the severe salinization zone (Low MSAVI, high Albedo, and high IFe2O3), C represents the non-salinization zone (High MSAVI, low Albedo, and low IFe2O3). The greater the distance from any point M to point C (M, N, P), the more severe soil salinization. On the contrary, the soil salinization degree is slighter.
Figure 2. Principle of Feature space.
2.3.2. Calculation of typical parameters
Considering the special natural ecological landscape and soil-forming background of saline soil in YRD, six typical surface parameters of salinization were selected in this study: normalized differences vegetation index (NDVI), modified soil adjusted vegetation index(MSAVI), salinity index (SI), surface albedo (Albedo), iron oxide index (IFe2O3), wetness index (WI). NDVI and MSAVI can accurately reflect the grown condition and changes of vegetation (Sun et al. Citation2018; Ma et al. Citation2018). MSAVI can eliminate the influence of bare soil in vegetation index. SI is an important indicator to characterize and indicate the salinization information, and salt in seawater is one of the important sources for salinization in YRD (Lu et al. Citation2020; Guo et al. Citation2022c). Surface albedo refers to the ratio of solar shortwave radiation to the total solar radiation in all directions, which is an important parameter for numerical climate model and surface energy balance (Betts et al. Citation1997; Xiao et al. Citation2011). With the exacerbation of soil salinization, the vegetation coverage of non-salt-tolerant plants showed a decreasing trend. The salt accumulation process in the surface soil would increase the surface albedo (Stroeve et al. Citation2005; Alejandro et al. Citation2007; Wang et al. Citation2010; Wang et al. Citation2017). There are significant differences in humidity between coastal and inland areas due to the special location of YRD. When drought occurs, the soil dryness increases (decreasing wetness index), and the underground mineralized water molecules move upwards, and a large amount of salt accumulates in the surface soil, resulting in occurrence of salinization. Therefore, the WI can better reflect the soil salinization information (Zhang et al. Citation2008; Hu et al. Citation2019). Soil salinization can not only influence the growth and types of vegetation in salinization areas, but also affects the composition and changes of chemical substances in the soil. Thus, IFe2O3 is one of the important indicators of soil salinization in YRD (Guo et al. Citation2020; Peng et al. Citation2013). The calculation formulas for the above six typical parameters are shown in :
Table 2. Formula of surface parameters.
2.3.3. Index standardization
Since the dimensions of surface parameters are different, the indices should be standardized to enhance the inversion accuracy of salinization in this study (EquationEq. (1)(1)
(1) ):
(1)
(1)
where
refers to the standardized indicator of i;
is the original index of i;
is the minimum value of the original index of i;
is the maximum value of the original index of i.
2.3.4. Trend analysis method
The average salinization monitoring index during certain periods is obtained by the Raster Calculator of ArcGIS 10.7 (Hong et al. Citation2016; EquationEq. (2)(2)
(2) ).
(2)
(2)
where
is the average value of a pixel in n years, SMIi is the salinization monitoring index value for the first year of a pixel.
The linear regression analysis method can eliminate the influence of salinization mutation in specific years to some extent. The equation is as follows (EquationEq. (3)(3)
(3) ).
(3)
(3)
where C represents the gradient of the trend line, n is the total number of the years (n = 39). If C > 0, it indicates that SMI shows an increasing trend, vice versa.
2.3.5. Gravity center model
The gravity center can reflect the non-uniformity and bias of spatial and temporal distribution of geographical elements, which has been widely used in the fields of land use, economy, population and ecology (Liang et al. Citation2021; Wang et al. Citation2022; Guo et al. Citation2023). In this paper, the gravity center can indicate the bias of the salinization. In addition, the migration trajectory of gravity center can reflect the change trend of salinization in spatial distribution (Yang et al. Citation2014). The gravity center of a region is defined as (x, y), and is set as the attribute value of the ith plane space unit (grid). Its Cartesian coordinates are set as
(EquationEqs. (4)-(5)). The gravity center of n plane space units (grid) is defined as a point
(4)
(4)
(5)
(5)
3. Results
3.1. Construction of feature space
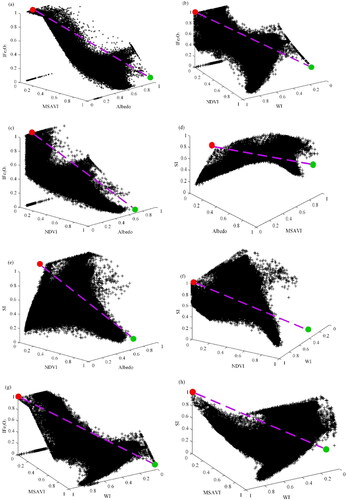
Based on the standardized surface parameters (NDVI, MSAVI, SI, Albedo, IFe2O3, WI) that derived from Landsat images in April 2020, the three-dimensional feature spaces that composed of different surface parameters were constructed by Matlab2022. In order to eliminate the interference of urban impervious surface and artificial building area on salinization monitoring, these zones were eliminated combined with the national land use data. Eight 3-D feature spaces were shown in .
Figure 3. Three-dimensional feature spaces that composed of different surface parameters (a) MSAVI-Albedo-IFe2O3; (b) NDVI-WI- IFe2O3; (c) NDVI-Albedo- IFe2O3; (d) MSAVI-Albedo-SI; (e) NDVI-Albedo-SI; (f) NDVI-WI-SI; (g) MSAVI-WI-IFe2O3; (h) MSAVI-WI-SI.
3.2. Establishment of salinization monitoring index model (MSAVI-Albedo-IFe2O3 feature space as an example)
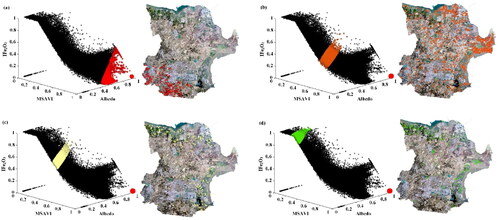
Taking MSAVI-Albedo-IFe2O3 feature space as an example, the distribution laws of different degrees of salinization soil in feature space were significantly different. Based on the distance from any point to point (M, N, P), this study set four point groups that distributed in different regions of the feature space. Through the 19 field observed samples in each point sets, the corresponding relations between different soil salinization degrees and four point sets were determined. As shown in , red point sets were mainly distributed in non-salinization zones, while orange point sets were mainly concentrated in slight salinization zones. The yellow and green point sets were mainly located in mild and severe salinization areas, respectively. Therefore, different point sets for levels of soil salinization were better identified and distinguished in MSAVI-Albedo-IFe2O3 feature space, which was consistent with the results of field observed data.
Figure 4. Spatial distribution of levels of soil salinization in three-dimensional feature space. (a) Non salinization; (b) Slight salinization; (c) Mild salinization; (d) Severe salinization.
As shown in , MSAVI, Albedo and IFe2O3 had obvious nonlinear relationships in 3-D feature space. With the decrease of MSAVI, Albedo and IFe2O3 both increased, and the salinization showed an exacerbating trend. The larger the distance from any point M to point O (M, N, P) in the feature space, the more serious the corresponding salinization. The distance L1 could be utilized to distinguish different levels of salinization (Guo et al. Citation2019b; Guo et al. Citation2022c), so MSAVI-Albedo-IFe2O3 feature space monitoring index (MAI) was constructed as follows (EquationEq. (6)(6)
(6) ):
(6)
(6)
Figure 5. Establishment of 3-D feature space monitoring index model of salinization.
3.3 Accuracy verification and comparisons
showed that different salinization monitoring index were obtained based on the raster calculator of ArcGIS 10.7 and the established monitoring models were shown in .
Figure 6. Spatial distribution of different salinization models (a) MSAVI-Albedo-IFe2O3; (b) NDVI-WI- IFe2O3; (c) NDVI-Albedo- IFe2O3; (d) MSAVI-Albedo-SI; (e) NDVI-Albedo-SI; (f) NDVI-WI-SI; (g) MSAVI-WI- IFe2O3; (h) MSAVI-WI-SI.
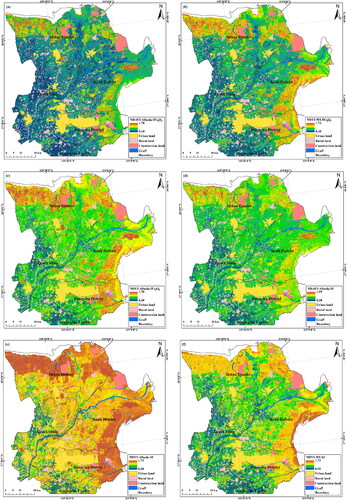
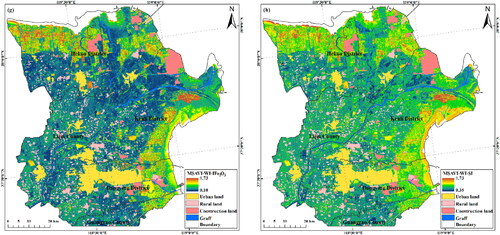
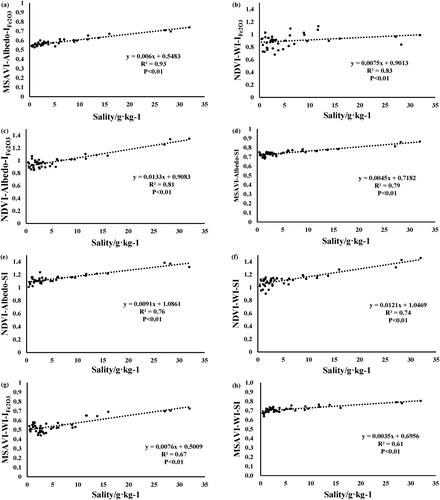
Table 3. Accuracy comparison of different salinization monitoring index models.
In order to verify the inversion accuracy of the proposed models, in this study, the univariate linear regression analysis (correlation coefficient and root mean square error) was performed based on the 64 field observations (soil salinity of 0–20 cm) and the monitoring index (p < 0.01). The results showed that () there were significant differences in the inversion accuracy of different three-dimensional feature space monitoring index models. The salinization monitoring index model based on MSAVI-Albedo-IFe2O3 feature space had the best applicability in YRD with R2 = 0.93 and RMSE space hg/kg, which was higher than previous studies with the R2 ranging from 0.8–0.9 (Wang et al. Citation2010; Ding et al. Citation2013; Guo et al. Citation2019a; Guo et al. Citation2020; Yao et al. Citation2021). Taking the MSAVI-Albedo-IFe2O3 feature space model as an example, the accuracy verifications based on univariate linear regression analysis model was shown in .
Figure 7. Accuracy verification of the feature space model.
3.4. Temporal variation of salinization during 1984–2022
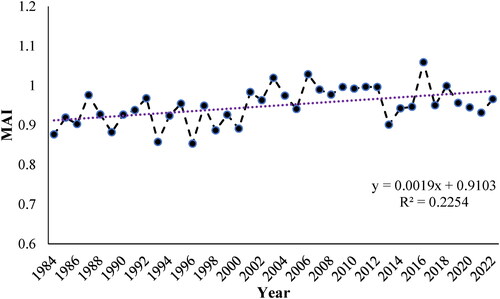
The salinization remote sensing monitoring indexes (SMI) during 1984–2022 were obtained by the optimal model of MSAVI-Albedo-IFe2O3 feature space and ArcGIS 10.7. The average SMI in the YRD during 1984–2022 showed obvious temporal change laws (). The average remote sensing monitoring index of salinization in recent 39 years was 0.97. During 1984–2022, the SMI showed an overall increasing trend. The maximum SMI in 2016 was 1.06, while that of 1996 was the smallest of 0.85. The average SMI in 2006–2012 was larger than the average value of 1984–2022. The average SMI values in 1984–1986, 1988–2000, 2013–2015 and 2019–2022 were lower than that in recent 39 years.
Figure 8. Interannual variation of average salinization monitoring index.
3.5. Spatial distribution pattern of salinization during 1984–2022
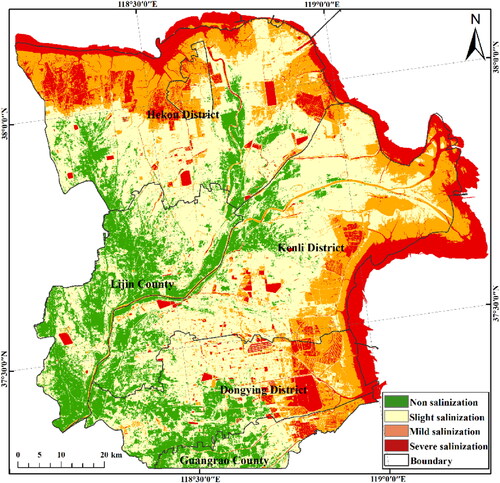
In order to explore the spatial differentiation patterns of salinization in YRD, the salinization monitoring index(SMI) was divided into four grades by using the Natural Breaks method of ArcGis10.7 combined with the field observed data, 《Outline of Planning for Improvement and Utilization of Saline-alkali Land》, and the vegetation coverage: SMI < 0.8 as non salinization, 0.8 < SMI < 1.0 as slight salinization; 1.0 < SMI < 11.2 as mild salinization; SMI > 1.2 as severe salinization (Wang et al. Citation2020).
There were significant differences in spatial distribution for levels of salinization during 1984–2022 (). The slight salinization zone had the largest area of 3448.75 km2, accounting for 49.02%, mainly concentrated in the central inland areas. The area of mild salinization was 1504.63 km2, accounting for 21.39%. The area of non-salinization was 1368.32 km2, accounting for 19.45%, which was mainly distributed in the central and southwestern inland areas. Zone of severe salinization had the smallest area of 709.57 km2, accounting for 10.14%. Mild and severe salinization zones were mostly located in the northeast and coastal areas. Because in these regions, the terrain was lower, prone to seawater recharge and other phenomena. In addition, the depth of groundwater was shallow.
Figure 9. Spatial distribution of salinization in Yellow River Delta.
3.6. Change intensity of salinization during 1984–2022
In order to further analyze the spatial and temporal changes of salinization in YRD in recent 39 years, the change trend coefficient was calculated by ArcGIS 10.7 and EquationEq.3(3)
(3) (). The trend coefficient (−0.04 to 0.04) were divided into five different levels, including severely reduced (−0.04 to 0.02), slightly reduced (−0.02 to 0.005), stable (−0.005 to 0.005), slightly increased (0.005–0.02), and severely increased (0.02–0.04).
Figure 10. Change trend and intensity of salinization during 1984-2022.
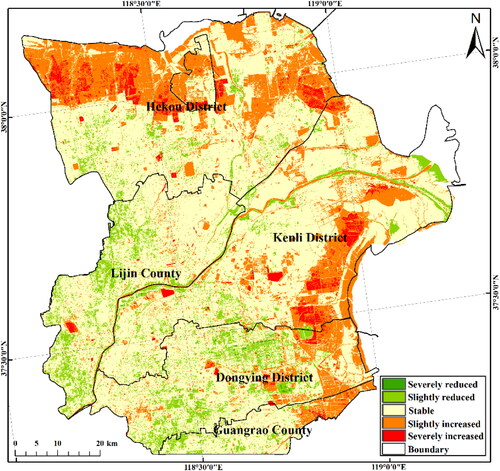
The area of salinization improvement (severely reduced and slightly reduced) was 698.76 km2, accounting for 10.16%, which was mainly located in the southwestern YRD, mainly distributed in Lijin County, the west and middle of Dongying District, and the west of Guangrao County. The area of stable zones was 4407.30 km2, accounting for 64.09%, mainly distributed in the middle of Kenli District and the south of Hekou District. The area of salinization deterioration(slightly increased and severely increased) was 1770.26 km2, accounting for 25.75%, mainly concentrated in the northern and eastern coastal parts of the YRD, mainly distributed in the north of Hekou District, the east of Kenli District, the east of Dongying District and the east of Guangrao County.
3.7. Migration trajectory of salinization gravity center during 1984–2022
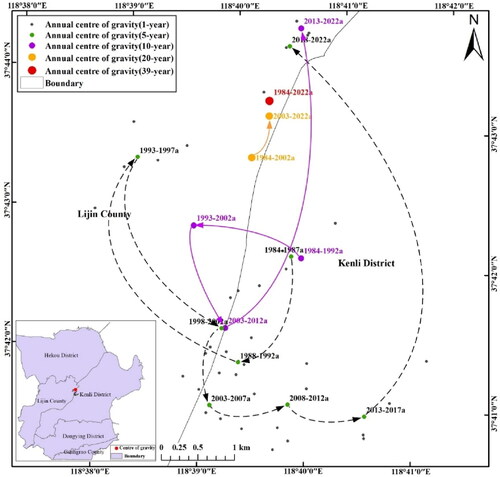
In order to better reveal the uneven and bias of temporal and spatial changes of salinization, the gravity center was utilized to analyze the migration trajectory of soil salinization gravity center during 1984–2022.The gravity center is generally expressed in longitude and latitude of the map (Lv et al. Citation2020;Wei et al. Citation2022). In this study, the gravity centers of salinization in the YRD during 1984–2022 were calculated with the tool of Spatial Analyst of ArcGIS 10.7 (). The results showed that the gravity centers of salinization were mainly concentrated in the junction of Kenli District and Lijin County, indicating that the gravity center of soil salinization shifts from southwest to northeast, and the condition of soil salinization in the northeast was more significant than that of the southwest parts. The migration trajectories of salinization gravity center at different time scales (5-year, 10-year, 20-year and 40-year) were consistent with slighter differences. During 1984–2022, the gravity center of salinization in the YRD moved northeastward on the whole. At 5-year and 10-year scales, the gravity center of salinization shifted slightly in the southwest of the area where the gravity center occurred (before 2013), and then quickly moved northward (after 2013), but the gravity center of salinization at different time scales was located in the northern junction of Kenli District and Lijin County. This indicated that the degree of salinization in the northeast of the YRD was more intensive than that in the southwest from 1984 to 2013, while the salinization in the north was significantly aggravated from 2013 to 2022, and the deviation of salinization center was larger than that before 2013. Because after 2013, a large area of reservoir ponds was built in Hekou District and Kenli District for aquaculture. Although the degree of salinization increased, the rational development and utilization of salinized land, and the establishment of farmland industry demonstration areas in the southwest region contributed greatly to the improvements of the soil salinization. Therefore, the gravity center of salinization moved northeast after 2013, which indicated that the quality of eco-environment of the northeast parts was greatly enhanced due to the rational development and utilization of saline soil, such as screening salt-tolerant plant, irrigation and drainage engineering measures improvement, and chemical and biological measures improvement (Yu et al. Citation2022).
Figure 11. Migration trajectory of salinization gravity center during 1984-2022.
4. Discussion
4.1. Advantages of the proposed three-dimensional feature space model
Current researches were mostly conducted based on two-dimensional feature space, while the influence of the interaction between multiple types of factors on the salinization process was ignored. The salinization process in the YRD was comprehensively affected by the interaction of natural and artificial factors. Based on the construction of three-dimensional feature space, this study could take into account the influence of interactive actions among different types of factors on the salinization process. Previous studies utilized the two-dimensional feature space models to monitor the salinization process, which obtained better results. Ding et al. (Citation2013) proposed a concept of MSAVI-WI feature space and established the soil salinity monitoring index (MWI) model and the results indicated that there was significant correlation between the MWI and surface soil salinity with R2 = 0.844. Guo et al. (Citation2019a) proposed a rapid monitoring of soil salinization in the YRD based on VI-SI feature space and found that the MSAVI-SI1 feature space model index had the highest inversion accuracy with R2 = 0.912. Guo et al. (Citation2020) utilized five typical surface parameters to construct ten different feature spaces and found that the inversion accuracy of the IFe2O3 feature space detection index based on the point to point model was the highest with R2 = 0.86. The formation and evolution of salinization were always comprehensively influenced by natural factors and human activity, such as precipitation, vegetation, evaporations, topography, and underground water (Guo et al. Citation2019b). The two-dimensional feature space model could only consider two surface parameters, which would reflect the influences of some factors (Guo et al. Citation2019a). The three-dimensional feature space model would take more influencing factors into considerations to comprehensively reflect the salinization evolutions (Guo et al. Citation2020). In this paper, The salinization monitoring index model of MSAVI-Albedo-IFe2O3 feature space had the highest accuracy with R2 = 0.93 and RMSE = 0.678g/kg. The reason was that the MSAVI could better reflect the vegetation condition in zones with sparse vegetation region. In addition, with the aggravation of salinization, more salt would accumulate in the surface layer of the soil, the surface was more sensitive to this change process (Wang et al. Citation2010). Soil solute transport process was the direct cause of salinization, so that the Fe+3 was a better indicator to reflect and monitor the salinization evolution (Ha et al. Citation2009; He et al. Citation2021; Wu et al. Citation2021).
4.2. Causes of spatial and temporal distribution of salinization in the YRD
The salinization of the YRD showed a decreasing trend from northeast to southwest and from coastal to inland in spatial distribution (Zhang et al. Citation2008; Zhang et al. Citation2011). The annual gravity centers of salinization were mainly concentrated in the junction of Kenli District and Lijin County. Moreover, the gravity center of salinization moved to northeast of the study area during 1982–2022. The salinization intensity in the coastal area of the northeast of the YRD was higher than that in the inland area of the northwest (Wang et al. Citation2020; Li et al. Citation2011). Affected by land-sea interaction, the coast area of the YRD had dramatically dynamic changes. The salt of saline soil in YRD that developed from saline silt in the coastal regions mainly came from sea water (Duan et al. Citation2021). The reclamation of coastal areas before 2000 was mostly unreasonable, which led to severe salinization. In addition, irrational irrigation and extensive management led to extremely serious secondary salinization in the region (Li et al. Citation2011; Chen et al. Citation2021). In addition, the tidal flat was one of the typical land use types in the YRD. The tidal flat referred to the zonal that distributed parallel to the coastline. Due to the influence of seawater, the groundwater level was high and the soil contains more salt (An et al. Citation2017). Salinization improvement zones were mainly located in cultivated land of the southwest parts, while stable zones were distributed in the central inland area. During the past decades, on the basis of perfecting irrigation and drainage water conservancy facilities, comprehensive improvement technical measures are integrated with agricultural measures such as rational farming, planting salt-tolerant crops, microbial remediation and fertility improvement (Zhang et al. Citation2015; Cheng et al. Citation2022).
5. Conclusion
Fully considering the causes and environmental background of formation and evolution of salinization in the YRD, six typical surface indexes were selected and extracted from Landsat images, and eight three-dimensional feature space monitoring index models of salinization were construed. Based on filed observed data, the optimal monitoring index model was determined, and then the temporal and spatial variation characteristics of salinization in the YRD were explored. The main conclusions were as follows: (1) The salinization monitoring index model of MSAVI-Albedo-IFe2O3 feature space had the highest accuracy with R2 = 0.93 and RMSE = 0.678g/kg, which indicated that the new proposed model had better applicability in the salinization monitoring for the YRD;(2) The salinization in the northeast parts in the YRD was more serious than that of southwest parts. In addition, there was an improvement trend of salinization during 1984–2022;(3) The aggravation degree of salinization in the northeastern parts was higher than that in other parts; (4) Salinization improvement zones were mainly located in cultivated land of the southwest parts, while the severe salinization zones mainly occurred in the wetland in the northeast regions.
In recent years, more surface parameters can be utilized to indicate and analyze the process of salinization, the optimization of feature variables subset has become an urgent problem to be solved in this research field. It is necessary to use the random forest algorithm to select the optimal surface parameters to construct the feature space model in future studies. Meanwhile, more surface parameters should be utilized to construct the n-dimensional (n > 3) feature space model index to improve the inversion accuracy of salinization, which could consider the interactions between multi-type factors.
Acknowledgements
This work was supported by Natural Science Foundation of Shandong Province (grant no. ZR2021MD047); National Natural Science Foundation of China (grant no.42101306); Open fund of Key Laboratory of National Geographic Census and Monitoring, MNR (grant no.2020NGCM02); the Open Fund of Key Laboratory of Urban Land Resources Monitoring and Simulation, Ministry of Natural Resources (grant no. KF-2020-05-001), and Agricultural Science and Technology Innovation Program (grant no. CAAS-ZDRW202201).
Data availability statement
The data that support the findings of this study are available from the corresponding author, Guo B, upon reasonable request.
Disclosure statement
No potential conflict of interest was reported by the authors.
References
- Abdennour MA, Douaoui A, Bradai A, Bennacer A, Pulido Fernández M. 2019. Application of Kriging techniques for assessing the salinity of irrigated soils: the case of El Ghrous perimeter, Biskra, Algeria. Span J Soil Sci. 9:105–124.
- Abdennour MA, Douaoui A, Piccini C, Pulido M, Bennacer A, Bradaï A, Barrena J, Yahiaoui I. 2020. Predictive mapping of soil electrical conductivity as a Proxy of soil salinity in south-east of Algeria. Environ Sustain Indicat. 8:100087.
- Abdennour MA, Douaoui A, Barrena J, Pulido M, Bradaï A, Bennacer A, Piccini C, Alberto Alfonso-Torreño A. 2021. Geochemical characterization of the salinity of irrigated soils in arid regions (Biskra, SE Algeria). Acta Geochim. 40(2):234–250.
- Alejandro MA, Kenji O. 2007. Estimation of vegetation parameter for modeling soil erosion using linear Spectral Mixture Analysis of Landsat ETM data. ISPRS J Photogramm. 62(4):309–324.
- An LS, Zhou BH, Zhao QS, Wang L. 2017. Spatial distribution of vegetation and environmental interpretation in the Yellow River Delta. Acta Ecol Sin. 37(20):6809–6817.
- Betts AK, Ball JH. 1997. Albedo over the boreal forest. J Geophys Res. 10(D24)28:901–928. 909.
- Cao JR, Liu WQ, Huang C, Liu P. 2014. Analysis on dynamic variation of salinized soil in Yellow River Delta based on Landsat TM/ETM image. Bull Soil Water Conserv. 34(06):179–183.
- Chang CY, Zhao GX, Li J, Wang L, Wang ZR. 2015. Remote sensing inversion of soil degradation in typical vulnerable ecological region of Yellow River Delta. Trans Chin Soc Agric Eng. 31(9):127–132.
- Chen L, Ren CY, Wang C, Yao YC, Song KS. 2017. Dynamic of coastal wetlands of the Yellow River Delta for 6 periods. Wetland Sci. 15(02):179–186. wetlandsci.2017.02.003
- Chen ST, Guo B, Zhang R, Zang WQ, Wei CX, Wu HW, Yang X, Zhen XY, Li X, Zhang DF, et al. 2021. Quantitatively determine the dominant driving factors of the spatial–temporal changes of vegetation NPP in the Hengduan Mountain area during 2000-2015. J Mt Sci. 18(2):427–445.
- Cheng TT, Zhang JH, Zhang S, Bai Y, Wang JW, Li SS, Javid T, Meng XL, Sharma TPP. 2022. Monitoring soil salinization and its spatiotemporal variation at different depths across the Yellow River Delta based on remote sensing data with multi-parameter optimization. Environ Sci Pollut Res Int. 29(16):24269–24285.
- Ding CX, Li YQ, Dong Z, Yin RB, Wang YM, Shen YK. 2013. Effects of different land use modes on the physical and chemical properties of saline-alkali soil in Yellow River Delta. Sci Soil Water Conserv. 11(02):84–89.
- Ding JL, Qu J, Sun YM, Zhang YF. 2013. The retrieval model of soil salinization information in arid region based on MSAVI-WI feature space: a case study of the delta oasis in Weigan-Kuqa watershed. Geograph Res. 32(02):223–232.
- Duan MQ, Zhang XG, Wang B. 2021. Prediction method of spatial distribution for soil salinity in typical areas of the Yellow River Delta. Chin J Agric Resour Region Plan. 42(08):243–250.
- Ha XP, Ding JL, Tashpolat T, Gao TT, Zhang F. 2009. SI-Albedo space-based extraction of salinization information in arid area. Acta Pedol Sin. 46(4):69–703.
- He FK, Pu SY, Hx X, Liu SB. 2021. Review of remote sensing application in soil degradation. J Agric Resour Environ. 38(01):10–19.
- Hu J, Peng J, Zhou Y, Xu D, Zhao R, Jiang Q, Fu T, Wang F, Shi Z. 2019. Quantitative estimation of soil salinity using UAV-borne hyperspectral and satellite multispectral images. Remote Sens. 11(7):736.
- Gu ZF, Bai G, Liu ZK. 2021. Prediction and evaluation of the rocky desertification evolution trend in southwest Guizhou Province based on the method of fuzzy analytic hierarchy process. J Zhengzhou Inst Aeronaut Ind Manag. 39:95–102.
- Guo B, Wei CX, Yu Y, Liu YF, Li JL, Meng C, Cai YM. 2022a. The dominant influencing factors of desertification changes in the source region of Yellow River: climate change or human activity? Sci Total Environ. 813:152512. 2021.152512
- Guo B, Yang F, Fan JF, Lu YF. 2022b. The changes of spatiotemporal pattern of rocky desertification and its dominant driving factors in typical karst mountainous areas under the background of global change. Remote Sens. 14:2351.
- Guo B, Yang F, Fan YW, Zang WQ. 2023. The dominant driving factors of rocky desertification and their variations in typical mountainous karst areas of Southwest China in the context of global change. Catena. 220:106674. 2023
- Guo B, Yang F, Li JL, Lu YF. 2022c. A novel-optimal monitoring index of rocky desertification based on feature space model and red edge indices that derived from sentinel-2 MSI image. Geomat Nat Hazards Risk. 13(1):1571–1592. 2022.2092038
- Guo B, Yang F, Han BM, Fan YW, Chen ST, Yang WN, Jiang L. 2019a. A model for the rapid monitoring of soil salinization in the Yellow River Delta using Landsat8 OLI imagery based on VI-SI feature space. Remote Sens Lett. 10(8):796–805. 1610981
- Guo B, Yang F, Fan YW, Han BM, Chen ST, Yang WN. 2019b. Dynamic monitoring of soil salinization in Yellow River Delta utilizing MSAVI–SI feature space models with Landsat images. Environ Earth Sci. 78(10):308. 8319-
- Guo B, Zang WQ, Luo W, Wen Y, Yang F, Han BM, Fan YW, Chen X, Qi Z, Wang Z, et al. 2020. Detection model of soil salinization information in the Yellow River Delta based on feature space models with typical surface parameters derived from Landsat8 OLI image. Geomat Nat Hazards Risk. 11(1):288–300.
- Hong J, Xn L, Wang LL. 2016. Quantitative analysis of the factors driving evolution in the Yellow River Delta Wetland in the past 40 years. Acta Ecol Sin. 36(04):924–935.
- Hu CM, Zhang W, Feng Z, Tang P. 2014. Landsat TM/ETM + and HJ-1A/B CCD data automatic relative radiometric normalization and accuracy verification. Natl Remote Sens Bull. 18(02):267–286.
- Jia PP, Zhang JH, Sun Y, Jia KL, Mao HX. 2020. Inversion of soil salinity and pH degree based on measured hyperspectral and Landsat 8 OLI image. Chin J Soil Sci. 51(03):511–520.
- Liang LW, Chen MX, Luo XY, Xian Y. 2021. Changes pattern in the population and economic gravity centers since the Reform and Opening up in China: the widening gaps between the South and North. J Cleaner Prod. 310:127379. 2021.127379.
- Li DR, Tong QX, Li RX, Gong JY, Zhang LP. 2012. Current issues in high-resolution Earth observation technology. Sci Sin. 42(06):805–813.
- Li H, Huang C, Zhang CC, Liu QS, Liu GH. 2020. Coastal erosion and sediment dynamics of the Yellow River Delta and their responses to the runoff-sediment flux since 1976. Resour Sci. 42(03):486–498.
- Li JH, Gao MX. 2018. Temporal and spatial characteristics of salinization of coastal soils in the Yellow River Delta. Chin J Soil Sci. 49(06):1458–1465.
- Li XQ, Gao YF, Dong GC, Liu F, Ke H. 2011. Soil properties and reeds (Phragmites Australis) wetland restoration in coastal salinity area in the Yellow River Delta based on canonical correspondence analysis. Wetland Sci Manag. 7(4):39–43.
- Li YL, Zhao GX, Chang CY, Wang ZR, Wang L, Zheng JR. 2017. Soil salinity retrieval model based on OLI and HSI image fusion. Trans Chin Soc Agric Eng. 33(21):173–180.
- Liu K, Jg Y, Zou YX, Song GX, Zheng JJ, Cui BS. 2015. Dynamics of spatial and temporal distribution of Suaeda salsa salt marshes in the Yellow River Delta. Wetland Sci. 13(06):696–701.
- Liu JX. 2016. Study on remote sensing model of soil salinization in the Yellow River delta. China University of Petroleum (East China).
- Liu LJ, Li XY. 2019. Progress in the study of soil salt accumulation in arid region. Chin J Ecol. 38(3):891–898.
- Liu XY, Shen C, Cui WX, Yang Q, Yu DF, Gao H, Yang L, Zhou Y, Zhao XX. 2022. Evaluation of various atmospheric correction methods in the processing of Landsat8/OLI data in Jiaozhou Bay. Spectrosc Spectr Anal. 42(08):2513–2521. 0593(2022)08-2513-09
- Lu J, Zhang XJ, Ye PS, Wu H, Wang T. 2020. Remote sensing monitoring of salinization in Hetao irrigation district based on SI-MSAVI feature space. Remote Sens Nat Resour. 32(01):169–175.
- Luo S. 2015. Distribution and causes of soil salinization in wetlands of the Yellow River Delta. Cult Geogr. 16:38–38.
- Lv B, Wang Y, Li WY, Li PZ, Shen DS, Gao J. 2020. Relationship between land use transformation and social-economic development in Shenyang economic. Bull Soil Water Conserv. 40(04):252–258.
- Ma SC, Bao GY, Guo G, Yang L, Dai QC, Zheng L. 2018. Change trend of vegetation and its responses to climate change in the source region of the Yellow River. J Arid Meteorol. 36(2):226–233.
- Meng L, Zhou SW, Zhang H, Bi XL. 2016. Estimating soil salinity in different landscapes of the Yellow River Delta through Landsat OLI/TIRS and ETM plus data. J Coast Conserv. 20(4):271–279.
- Peng J, Xiang HY, Zhou Q, Zhang YZ, Wang, JQ, Peng XA. 2013. Hyperspectral response of soil iron oxide. Spectrosc Spect Anal. 33(02):502–506.
- Stroeve J, Box JE, Gao F, Liang SL, Nolin A, Schaaf C. 2005. Accuracy assessment of MODIS 16-day albedo product for snow: comparisons with Greenland in suit measurements. Remote Sens Environ. 94(1):46–60.
- Sun ZY, Wang JB. 2018. The 30m-NDVI-based alpine grassland changes and climate impacts in the three-river headwaters region on the Qinghai-Tibet plateau from 1990 to 2018. J Resour Ecol. 13(02):186–195.
- Tang HR, Wu YR, Xiang MS, Zhu MH. 2005. Study on fast geometric correction of Landsat 7 imagery. J Remote Sens. 9 (01):57–63.
- Wang DW, Bai JH, Zhao QQ, Lu QQ, Zhang SY. 2020. Profile differentiation of soil salinity for natural and anthropogenic disturbance wetlands in the Yellow River Delta. J Natl Resour. 35(2):438–448. 20200215
- Wang DY, Chen HY, Wang ZR, Ma Y. 2022. Inversion of soil salinity according to different salinization grades using multi-source remote sensing. Geocarto Int. 37(5):1274–1293.
- Wang F, Ding JL, Wu MC. 2010. Remote sensing monitoring models of soil salinization based on NDVI-SI feature space. Trans Chin Soc Agric Eng. 26(08):168–173. 029
- Wang F, Ding JL, Wei Y, Zhou QQ, Yang, XD, Wang Qf. 2017. Sensitivity analysis of soil salinity and vegetation indices to detect soil salinity variation by using Landsat series images: applications in different oases in Xinjiang, China. Acta Ecol Sin. 37(15):5007–5022.
- Wang G. 2010. The distribution of surface Albedo in China during 1982-2000. Plateau Meteorol. 29(01):146–151.
- Wang JB, You KR, Qi LL, Ren H. 2022. Gravity center change of carbon emissions in Chinese residential building sector: differences between urban and rural area. Energy Rep. 8:10644–10656.
- Wang KF, Ji GS. 2020. Land subsidence situation and characteristics in the North Yellow River Delta (Estuary Region). Yellow River. 42(05):121–125. 2020.05.024
- Wang XM, Zhou XH. 2018. Estimation and inversion modeling of salinity of cotton field soil using remote sensing in the Delta Oasis of Weigan and Kuqa Rivers. Agric Res Arid Areas. 26(06):250–254.
- Wang YG, Deng CY, Liu Y, Niu ZR, Li Y. 2018. Identifying change in spatial accumulation of soil salinity in an inland river watershed, China. Sci Total Environ. 621:177–185.
- Wang ZR, Zhao GX, Gao MX, Chang CY, Jiang SQ, Jia JC, Li J. 2016. Spatial variation of soil water and salt and microscopic variation of soil salinity in summer in typical area of the Yellow River Delta in Kenli County. Acta Ecol Sin. 36(04):1040–1049.
- Wei J, Liu LL, Wang HY, Zhang YX, Wang CL, Liu JT, Fu TG, Gao H, Liang, HZ, Liu YC. 2022. Spatiotemporal patterns of land-use change in the Taihang mountain (1990-2020). Chin J Eco-Agric. 30(07):1123–1133.
- Wu HW, Guo B, Fan JF, Yang F, Han BM, Wei CX, Lu YF, Zang WQ, Zhen XY, Meng C. 2021. A novel remote sensing ecological vulnerability index on large scale: a case study of the China-Pakistan Economic Corridor region. Ecol Indic. 129:107955.
- Wu YK, Liu GM, Su LT, Yang JS. 2018. Accurate evaluation of regional soil salinization using multi-source data. Spectrosc Spectr Anal. 38(11):3528–3533.
- Xiao DP, Tao FL, Moiwo JP. 2011. Research progress on surface Albedo under global change. Adv Earth Sci. 26(11):1217–1224. 1001-8166.2011.11.1217
- Yang HF, Mu SJ, Li JL. 2014. Effects of ecological restoration projects on land use and land cover change and its influences on territorial NPP in Xinjiang, China. Catena. 115:85–95.
- Yao RJ, Yang JS, Liu GM, Zhou P. 2006. Spatial variability of soil salinity in characteristic field of the Yellow River Delta. Trans Chin Soc Agric Eng. 6:61–66. 012
- Yao Y, Ding JL, Wang S. 2021. Soil salinization monitoring in the Werigan-Kuqa Oasis, China, based on a three-dimensional feature space model with machine learning algorithm. Remote Sens Lett. 12(3):269–277.
- Yu SB, Li GL, Guan CC, Fan YS. 2022. Research on ecological protection and restoration institutions of the Yellow River Delta. Yellow River. 44(03):80–84. +90.
- Zhang F, Xu YT. 2015. Dynamic development of soil salinization in recent 40 years in the Yellow River Delta. Chem Eng Trans (CET J) 46:1081–1086.
- Zhang TT, Zeng SL, Gao Y, Ouyang ZT, Li B, Fang CM, Zhao B. 2011. Assessing impact of land uses on land salinization in the Yellow River Delta. China using an integrated and spatial statistical model. Land Use Policy. 28(4):857–866.
- Zhang XL, Li PY. 2008. Coastal erosion and its environmental effect in the Modern Yellow River Delta. Mar Environ Sci. 27(5):475–479. 2008.05.017
- Zou XX, Wang WH, Wang JL, Jiang DF. 2017. Time-spatial revolution characteristics of soil salinity in the Yellow River Delta under different land cultivation and natural conditions. J Soil Water Conserv. 31(02):309–316.