
 ?Mathematical formulae have been encoded as MathML and are displayed in this HTML version using MathJax in order to improve their display. Uncheck the box to turn MathJax off. This feature requires Javascript. Click on a formula to zoom.
Abstract
This work studies and evaluates the mechanical properties of frozen soil, FS, from Yulong mine in Tibet, under different freezing temperatures ranging from −12 °C to −1 °C, using experimental tests. In addition, the effects of temperature and time on the freezing depth of FS were investigated. Based on the cantilever beam theory, the mechanical model of FS breaking under blasting stress wave was established, and the theoretical formula for the fracture length (FL) of FS was deduced. Moreover, the major influences on FL were analyzed. The results showed that the frozen depth curves at different temperatures were approximately linear in single or double segments, and the lower the temperature, the greater the early freezing rate. Additionally, the uniaxial compression strength, elastic modulus, and tensile strength of FS were found to decrease with the increase in temperature. The findings highlight that the shear strength, cohesion, and internal friction angle decreased first and then increased with the increase in temperature. It was shown that the thickness, friction coefficient, weight density, and tensile strength of FS are positively correlated with the FL, while there is an inverse proportionality with respect to the pressure of the detonation wave.
1. Introduction
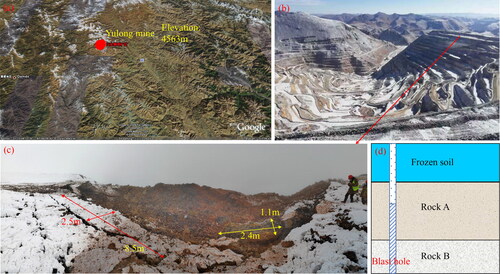
In the process of open-pit mining in the plateau area, the frozen soil (FS) problem is the main factor affecting the blasting effect. After the blasting of the FS layer, the surface will produce strip and blocky large blocks, which will pose major difficulties in the subsequent excavation and transportation. The Yulong mining in Tibet, shown in , is located between the Lancang River and the Jinsha River in the southeast of the Qinghai-Tibet Plateau, at an altitude of 4563 m. During the blast mining process, large blocks of frozen layer are easily generated during the blasting operation, as shown in . The main reason for the generation of the large blocks is the fracture of the FS layer under the explosive stress wave (). Therefore, it is necessary to analyze the mechanical properties and the breaking mechanism of FS under the action of blasting.
Figure 1. Engineering background; (a) location of Yulong mine, (b) overview of open pit mine, (c) large blocks of bench after blasting, and (d) diagram of the vertical distribution of frozen soil.
In general, the biggest difference between the frozen soil and the conventional soil is that the water in the frozen soil is frozen (Chou and Wang Citation2021). In addition, the freezing temperature has a direct impact on all aspects of the mechanical behaviour of the frozen layer (Li et al. Citation2015). Except for the temperature, the thickness and the moisture content of soil also affect the microstructure of the soil layer (Hu et al. Citation2020). Under the action of the freeze-thaw, the thicker the soil layer, the lower the surface water content, the smaller the crack development, and the lower the strength (Yue et al. Citation2022). The microscopic pore structure images of frozen soil layers before and after freezing and thawing were obtained by synchrotron x-ray micro-computed tomography and scanning electron microscopy experiments (Zhang and Cui Citation2017). The results showed that the multiple cycles of seasonal freeze-thaw periods promote the development of pores and pore grids in the microstructure of the soil, and the stability and strength decrease accordingly (Ma et al. Citation2021).
At present, the basic mechanical properties (Shams et al. Citation2020) of frozen soil are studied by uniaxial compression tests (Li et al. Citation2022), triaxial compression tests (Zhang and Cui Citation2018), Brazilian splitting tests (Wang et al. Citation2019), and direct shear tests (Li et al. Citation2021). The frozen samples involve soil-rock mixture, consolidated silty clay, siliceous clay, etc. Additionally, the influence of the environmental factors such as temperature (Ma et al. Citation2022), initial water content (Li et al. Citation2020), loading speed, confining pressure, and other conditions on the compressive strength (Shastri et al. Citation2021), Young’s modulus, tensile strength, and shear strength was also considered in the literature. Moreover, the failure mode, stress–strain properties, and evolution mechanism of the mechanical properties of frozen soil were also explored (Fan et al. Citation2022). In addition, some studies in the literature have established the theoretical model of unfrozen water (Wang et al. Citation2020) and analyzed the influence of the surface effect of clay on the production of unfrozen water in frozen soil (Jin et al. Citation2020). Based on a one-dimensional coupled thermal (Li et al. Citation2021) and hydraulic numerical model (Weismuller et al. Citation2011), the water content, temperature, and thawing duration and depth of the frozen soil were evaluated. Moreover, a systematic analysis method of the soil frost heave and the freezing characteristics in the permanent frozen soil region was proposed (Fu et al. Citation2014) for expansion and bonding structures (Sun et al. Citation2020). It was found that the formation of frozen soil weakened the structural interaction effect and made it nonlinear (Xing et al. Citation2022).
To further analyze the effect of blasting on the dynamic fracture of frozen soil, based on the thermal activation theory and the modified Ottoson model, the dynamic mechanical response and the failure mechanism of frozen soil with different temperatures and water content were analyzed by SHPB tests (Fu et al. Citation2021; Zhu et al. Citation2021; Zhang et al. Citation2021; Li et al. Citation2022). As a result, the rate damage model was derived (Zhang et al. Citation2020). Based on the influence of soil temperature on the explosion intensity of buried explosives in frozen soil (Asaf et al. Citation2017), the dynamic characteristics of thin sandy frozen soil, including tension-compression transformation, stress variation, surface fracture development and fracture process, and the expansion speed and range of directional blasting of frozen soil, were explored (Zhang and Xie Citation2011).
Nevertheless, very few studies have investigated the effects of the freezing temperature and the freezing time on the state and mechanical properties of frozen soil (FS) layers. Thus, very few researchers studied the fracture laws of FS layers under the action of mining blasting loads. In this work, the soil samples from the Yulong open-pit mine in Tibet were selected to conduct freezing and basic mechanical tests. Six freezing temperatures (T) (-12 °C, −10 °C, −7 °C, −5 °C, −3 °C, and −1 °C) were designed according to the field measured temperature for the freezing test. The variation in freezing depth with time at different T was analyzed. In addition, the variation in the uniaxial compression strength (UCS, σc), elastic modulus (E), tensile strength (σt), shear strength (τf), and shear strength parameters (c, φ) of FS with the freezing temperature were also analyzed. Furthermore, the mechanical model of the FS fracture under the blasting load was established. The theoretical formula of the fracture length (FL) of the FS was deduced and the influencing factors were analyzed.
2. Experimental testing
2.1. Soil samples
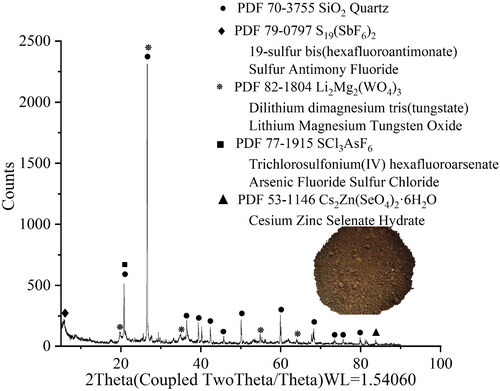
The soil sample was taken from the open-pit bench in Yulong mine, Tibet, of a clay nature. Multiple soil samples were collected and weighed at the sampling site. The quality of soil samples in each sealed bag was marked and transported to the laboratory. The field soil samples were dried and weighed to calculate the moisture content of soil samples in each bag, and the average moisture content was about 16%. A part of the soil was used to process X-ray diffraction analysis, and the results are shown in . Overall, the soil mainly contains SiO2, S19(SbF6)2, Li2Mg2(WO4)3.The undisturbed soil collected at the site was crushed and placed in a drying oven at 110 °C for 12 h (Chen et al. Citation2021). Because, at this temperature, the organic matter will not be decomposed (ASTM Citation2019). Additionally, a certain volume of distilled water was added according to the water content and stirred evenly to make the composition of frozen soil samples closer to the actual situation. During the sample preparation, according to the type of test, the samples were put into different moulds for three layers of compaction (Ma et al. Citation2021). Furthermore, to increase the integrity of the sample, the contact surfaces of each layer were subjected to a shaving treatment.
Figure 2. X-ray diffraction analysis results of soil from Yulong mine.
2.2. Experimental design
lists the information for the experimental design of FS, where shows the FS mechanical test process. Four kinds of tests were carried out, in which the standard cylinder with a diameter of 50 mm and a height of 100 mm was used for freezing and uniaxial compression tests. The sample sizes of Brazilian splitting and direct shear tests were a cylinder with a diameter of 50 mm and a thickness of 25 mm and a flat cylinder with a diameter of 60 mm and a thickness of 20 mm. A total of 96 freezing tests were conducted, and the T was determined according to the measurement temperature curve () in the field. In the early field survey of Yulong mine, the temperatures of rock mass in January and July at a certain depth of open-pit bench have been measured. In general, the temperature was found to fluctuate between −12 °C and 10 °C in the depth range of 0–5 m for the FS layer. Thus, the T of the freezing test was set as −12 °C, −10 °C, −7 °C, −5 °C, −3 °C, −1 °C.
Figure 3. Flow chart of soil sample preparation, freezing, and basic mechanical tests.
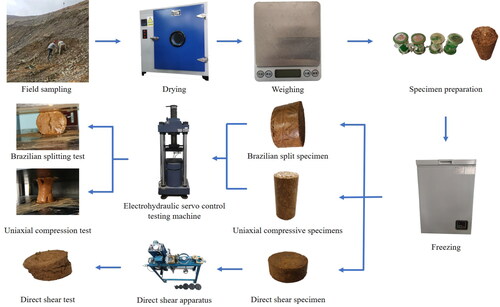
Figure 4. The measurement temperature curve of borehole in Yulong mine.
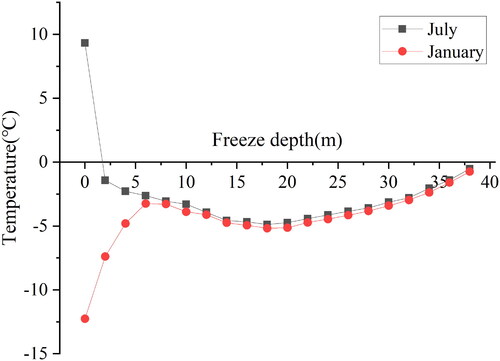
Table 1. Experimental design of mechanical properties of frozen soil.
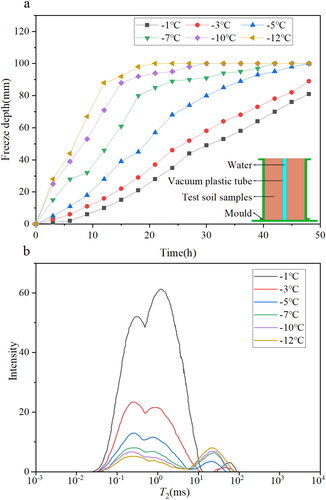
In the freezing test sample preparation process, a transparent vacuum tube (Φ 8 mm × 100 mm) filled with distilled water and sealed at both ends was placed at the axis of the sample mould, as shown in . After preparing the samples, they were placed in a DW-type low-temperature test system for freezing for 48 h. The freezing depth of the water in the vacuum tube can be used to evaluate the freezing depth of the FS every 3 h, and the average value was taken as the freezing depth of the soil samples.
Figure 5. (a) Variation curves of freezing depth with time and (b) the T2 spectrum of FS with different T.
A YAW microcomputer controlled electro-hydraulic servo test machine was used to conduct the uniaxial compression and the Brazilian splitting tests. Before the test, a load of 100 N was applied to the specimen to ensure close contact, and the axial loading rate was set as 100 N/s. For the direct shear test, a strain-controlled direct shear instrument was used. In this regard, the shear loading rate was set to 0.8 mm/min, and the normal stresses were set as 100 kPa, 200 kPa, 300 kPa, and 400 kPa, respectively. Additionally, the diameter of the ring knife is 61.8 mm, the height is 20 mm, and the surface area of the ring knife is 30 cm2.
3. Experimental results and discussion
3.1. Freezing characteristics of frozen soil
shows the variation curves of the time-freezing depth for the FS samples at different T. When the T is between −1 °C and −3 °C, the freezing depth of the FS increases approximately linearly with the increase in time. It is also noted that it is still not completely frozen after 48 h. The observation of the sample after demoulding shows that the water in the FS sample is in the state of ice-water mixture. When the T drops from −5 °C to −12 °C, the freezing rate increases rapidly at first and then slows. In addition, the freezing depth and freezing time have an approximate linear relationship (double stages). The lower the temperature, the greater the freezing rate in the early stages of the freezing. After that phase, the change tends to be smoothed-out with time. When the T is set to −12 °C, it is shown that the FS sample has reached a complete freezing state at a time interval of 20 h. shows the T2 spectrum curve of FS samples under different T. The area of T2 spectrum represents the content of unfrozen water in soil samples. Overall, the higher the T is, the higher the content of unfrozen water is. When the T reaches −7 °C, the decrease in T has little effect on the content of unfrozen water, indicating that the soil samples are completely frozen.
3.2. Mechanical properties of the frozen soil
3.2.1. Uniaxial compression properties
shows the typical stress–strain curves of the FS with different T, in addition to the failure pictures. During the test, small vertical cracks were found to appear first near the end of the FS specimen. With the elevation of the lower cylinder, the cracks gradually extend, where some oblique cracks extend to the middle and top of the specimen. Additionally, during the crack extension process, it was noted that particles were falling off at the position of cracks, and there were water droplets precipitating at the upper and bottom ends of the specimen. This phenomenon is consistent with the expected failure process. Due to the compression of the soil skeleton, if the load was applied, the structure tends to be tight, and a relatively high-density area appears at the upper and lower ends, resulting in local expansion of the sample and cracks on the surface. As the loading continues, the soil particles slip from the high-density area to the low-density area, and the cracks are connected, eventually leading to failure. At −7 °C, frozen soil samples are completely frozen. With the increase in the strain, the sample has a compaction process, and the compressive strength of the sample will be improved. This is because the test soil sample is clay soil. In the test, cracks first appear in the lower part of the sample, and extend to the side of the sample, which leads to a decrease in the contact area between the lower part of the sample and the loading platform. Therefore, the platform section of the stress–strain curve appears. At −5 °C, the freezing time reaches 24 h, and the soil sample can be completely frozen. At this time, the consolidation effect of ice in frozen soil is low, and the compressive strength of the sample is not high. With the increase in ε, the contact area between the upper and lower ends of the sample and the loading platform increases, resulting in the sample becoming denser, so the compressive strength increases exponentially. Additionally, the expansion position of the sample at −1 °C is not all concentrated at the upper and lower ends of the sample, but in the middle, which is related to the sample state (not completely frozen). Moreover, the internal structure of the artificially prepared sample cannot be completely uniform, which is the reason the soil sample was compacted into three layers in the early stage and the contact surface of each layer is roughened.
Figure 6. (a) Uniaxial compression stress–strain curves of FS under different T, and (b) variation in UCS, E with T.
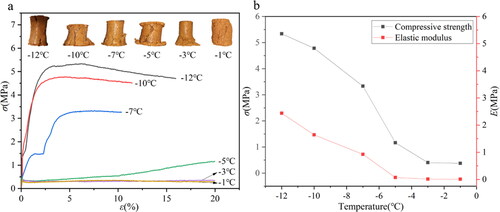
From the overall trend of the stress–strain curves, as shown in , the failure mode of the FS is of a plastic failure nature. This conclusion was also confirmed by most scholars in the studies reported in the literature (Chen et al. Citation2011; Girgis et al. Citation2020; Liu et al. Citation2020). The stress–strain curves at −12 °C and −10 °C went through the elastic, yielding, and stable deformation stages in that order. It was shown that the specimens still have a relatively high residual strength after reaching their peak strength. When the T is −7 °C, the specimen yield is at a low stress level and then enter the stable deformation stage after strain strengthening. At −5 °C, the stress shows a linear growth trend. When FS is freezing at −3 °C and −1 °C, the stress–strain curve is basically flat (strength is small) because the specimen is not completely frozen. shows the variation in σc and E (specific values are listed in ) of FS with the change in T. Based on the results, it is shown that both σc and E decrease with the increase in T. When the T is less than −5 °C, the T change has obvious effect on σc and E. From the overall trend, σc and E of the FS specimens gradually increase with the decrease in temperature, which is consistent with the existed research (Yang et al. Citation2015).
Table 2. Parameter information of test results.
3.2.2. Tensile properties
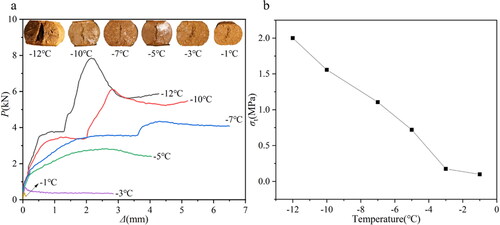
shows the load-displacement curves of the Brazilian splitting tests of FS at different T. In addition, the typical failure photographs of FS under tensile stress are also presented in . Overall, the lower the T, the more obvious the brittleness of the FS. Furthermore, the curves for T at −12 °C, −10 °C, −7 °C, and −5 °C all showed elastic deformation during the early loading stage, and there were yield platforms after reaching a certain stress level. Following that, the FS entered the stage of strain strengthening (the lower the T, the more obvious the strengthening). Moreover, after the peak stress, the FS has a relatively high residual strength. This conclusion is also verified and confirmed by multiple researchers in the literature (Ming et al. Citation2017; Zhou et al. Citation2015). The cross-section of the samples increases after failure. When the temperature is below −7 °C, the freezing degree of frozen soil is high, and the consolidation effect of ice is large, which is close to the characteristics of the rock. It has experienced the elastic stage, the compaction deformation stage, and the post-compaction deformation stage, and then, the specimen is destroyed, and the obvious peak stress appears. At −7 °C, Due to the sample freezing degree is not high and the test time being relatively long, part of the ice dissolved, resulting in plastic deformation, at this time, the overall reduction in the post-peak strength after sample failure is larger, which is of little significance for the analysis of the temperature effect during the whole test process, so the curve is partially intercepted. When the temperature is higher than −7 °C, the consolidation of ice decreases, resulting in reduced strength of frozen soil. The cohesive force of cohesive soil itself plays a role after failure, and the decreased degree of post-peak stress is small. The load-displacement curves of FS lack a yield platform because the specimen was not completely frozen. The variation in σt (see ) with T is shown in , and the σt is found to be negatively correlated with T.
Figure 7. (a) The load-displacement curves of Brazilian splitting tests, and (b) variation in σt with T.
3.2.3. Direct shear properties
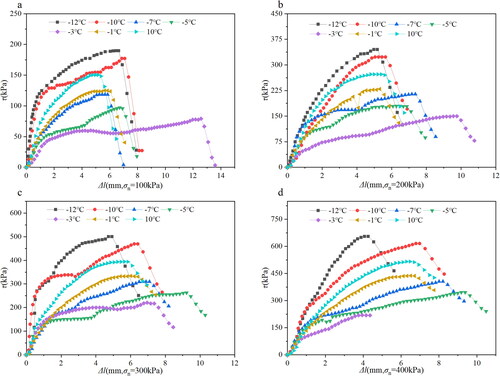
The shear stress-displacement curves (SSDC) of FS at different T and under different normal stresses are shown in . As shown in , the overall variation in SSDC under different T is basically the same, experiencing an elastic deformation (a sharp increase in tangential load), a middle shear sliding (a slower growth of tangential stress), and a later stress drop process. The SSDC curves of unfrozen samples and FS with lower T are smoother, and the characteristics of the shear stress increasing sharply are not obvious. With a decrease in T, the shear sliding characteristics of FS gradually become more obvious and clearer. When T is less than −10 °C, the linear elastic properties of FS in the early stages of loading are especially visible. In addition, when the normal stress is large (400 kPa), the SSDC of FS in the early stage of tangential load is basically the same. However, with an increase in the tangential load, the difference between SSDC of FS with different T is narrowed, that is, the larger normal load (400 kPa) weakens the difference of shear characteristics of FS caused by T.
Figure 8. The shear displacement-stress curves of FS with different T, (a–d) for the normal stresses are 100 kPa, 200 kPa, 300 kPa, 400 kPa, respectively.
shows the relationship between the shear strength of FS and T under different normal stresses. Overall, when the T is less than −3 °C, the FS shear strength decreases with the increase in T. On the other hand, when the T is higher than −3 °C, the FS shear strength increases with the increase in T. In contrast, when the FS is not frozen or the freezing degree is low (-1 °C), the shear strength difference is small. With the increase in the freezing degree, the FS shear strength decreases first and then increases. shows the relationship curve between the shear strength parameters (c and φ) of FS and the T. Moreover, highlights that the variation laws of c and φ with the T are basically the same, where both decrease first and then increase with the increase in T. This indicates that when the freezing degree of FS is low, the c and φ are smaller than those before freezing. Because when the temperature increases, the freezing effect of ice on soil particles decreases, resulting in a decrease in shear strength. When the degree of freezing is low or in the mixed state of water and ice, the specimen is compacted under normal stress, which increases the shear strength (-1 °C, 10 °C). Additionally, from the meso-view observation of the freezing process of the specimen, the water in the soil experienced the process of the water, water–ice mixture, and ice. And the volume of water during this process will increase, leading to the expansion of the soil sample (Li et al. Citation2021; Xie et al. Citation2015). With the deepening of freezing degrees, the increase in the shear load resistance of FS is more obvious. The water filled the pores at −1 °C, and the cementation of water increased the shear strength of the soil samples. At −3 °C and −5 °C, the water transformed into ice, the cementation of water was reduced, and the consolidation of ice began to play a key role, but the strength was still lower than that of unfrozen soil samples.
Figure 9. (a) Relationship curve between shear strength and T of FS, and (b) variation in shear strength parameters with T.
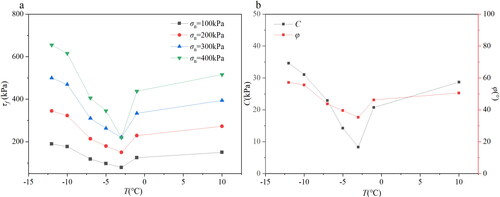
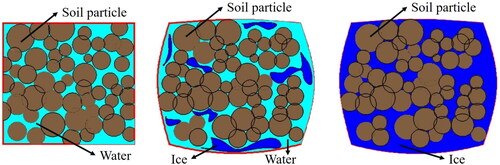
Furthermore, the reason for the phenomenon presented above is related to the state of the FS at different T. shows the diagram of the microstructure variation in the FS freezing process. The water in the soil goes through the process of water to ice-water mixture and then to ice. The water-ice phase transition results in the increase of pores and the expansion of soil. This was confirmed by the freezing test, as shown in , where the unsealed end of the FS was bulging upward. Hence, a certain degree of freezing will destroy the original structure of the soil sample. Existing research (Xie et al. Citation2015) has found that the shear strength of soil mainly depends on the interaction between particles. Therefore, when the T is relatively low (-1 °C and −3 °C), the freezing degree of soil is low. In addition, the water in the soil is in the state of an ice-water mixture, and the shear strength, c and φ of soil are lower than those without freezing.
Figure 10. Diagram of soil microstructure; (a) normal state, (b) ice-water mixed state, and (c) frozen state.
4. Mechanical model and influence factors on frozen soil breaking
4.1. Mechanical model
In open-pit blasting, there is a certain thickness of FS on the surface layer of the open-pit bench. According to practical experience, the thickness (1.5–3 m) is generally smaller than the length of the blasthole filling section (larger than 4 m). The breaking process of FS is essentially the result of the combined action of the explosion stress wave and the FS gravity, as shown in . The explosion effect of the cylindrical charge in the deep hole on the surface of the FS can be simplified as the superposition of the multiple spherical charges. Among them, the spherical charge closest to the FS has the largest effect. In order to simplify the calculations, the superposition effect of the stress wave was not considered in this mechanical model development in this work. In mine blasting, in the stress wave superposition area between boreholes, the stress component in the direction of the connecting line between two boreholes is mainly compressive, while the stress component perpendicular to the direction of the connecting line is mainly tensile. The superposition of blasting stress waves between boreholes strengthens the two stress components, but the strengthening effect on the stress component perpendicular to the direction of the connecting line (mainly tension) is significantly smaller than that of the stress component in the direction of the connecting line (mainly compression). In addition, these stress enhancements are not sufficient to induce cracks in the stress wave superposition region between boreholes (Ding et al. Citation2021). The initial stress wave has a breaking effect on the frozen layer, and the subsequent stress wave will reduce the fracture length, but it is smaller than the early stress wave. The initial stress wave has a breaking effect on the frozen layer, and the subsequent stress wave will reduce the fracture length, but the effect is smaller than the early stress wave. Therefore, the influence of stress wave superposition is not considered in this paper. The advantage of this approach is to reduce the complexity of the calculation and reduces the calculation time. Of course, there is also a deficiency is to increase the selection range of correction coefficient k. Therefore, the breaking of FS between adjacent blastholes will be simplified as a cantilever beam model (). Under the pressure component of the detonation wave into the FS and gravity, the breaking occurs along the fixed end, which is the middle part of the FS between two adjacent blastholes.
Figure 11. Mechanical model of frozen layer fracture under blasting stress wave; (a) for the natural frozen soil layer, and (b) for the artificial composite frozen layer.
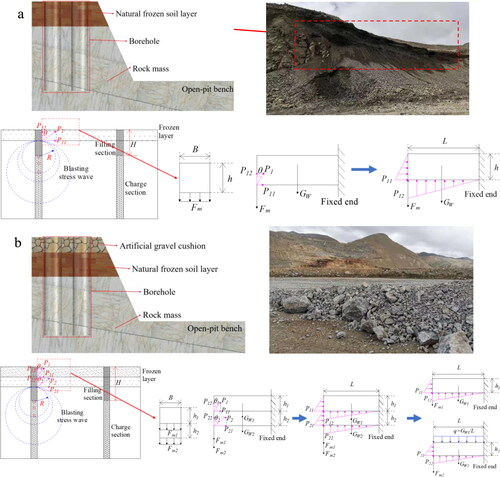
In addition to the common single-layer natural FS layer, there are also double-layer artificial FS layers in the mine site (). In order to ensure the smoothness of the bench transport pavement, it is often necessary to lay a layer of gravel cushion on the surface layer, and spray water to reduce dust. The thickness of the cushion is generally between 500 mm and 800 mm. When the environmental air temperature is lower than 0 °C, an artificial composition frozen layer with the upper part of gravel and the lower part of FS is formed. The breaking process under blasting load is similar to that of the single FS layer, and the breaking mechanical model is shown in . Moreover, the mechanical model of the FS of the single- and double-layer is made up of the components below.
In the mechanical model of the single-layer FS under blasting load, the forces parallel and perpendicular to the cantilever beam are given as follows:
(1)
(1)
(2)
(2)
(3)
(3)
In the equations above, P1 is the maximum initial pressure of the stress wave, that is, the impact pressure acting on the borehole wall, P11 and P12 are the horizontal and vertical components, respectively, θ is the angle between the impact pressure acting on the blasthole wall and the axial direction of the blasthole, Fm is the friction between the FS and the filling section, and Gw is the gravity of FS between the two adjacent blasting holes. These parameters can be calculated by the following equations:
(4)
(4)
(5)
(5)
(6)
(6)
where dc is the diameter of the cartridge, dh is the drilling depth, h is the thickness FS, f is the friction coefficient between the FS and the filling section, γ is the weight density of FS, B is the unit width, and L is the FL of FS.
When the uncoupled charge is adopted, the impact pressure of the blasting load on the FS is given by EquationEq. 7(7)
(7) . (Zhang et al. Citation2003)
(7)
(7)
where Pm is the average detonation pressure of the initial expansion of detonation products, Vc is the volume of the strip cartridge explosive, and Vb is the volume of the strip drug compartment. When the detonation products exert an impact on the FS, the pressure will increase significantly, and the increase multiple (n) ranges from 8 to 11. The parameters highlighted above are calculated using the following equations:
(8)
(8)
(9)
(9)
(10)
(10)
where ρ0 is the explosive density, D1 is the detonation velocity, and db is the borehole diameter.
When the coupling charge is adopted, the impact pressure on the FS is as follows:
(11)
(11)
where ρm is the density of FS, Cp is the rock longitudinal wave velocity, ρ0D1 is the explosive impact resistance, and ρ0Cp is the impact resistance of FS. In this case, Pm is given by:
(12)
(12)
In the simplified cantilever beam model, as a whole, the bending moment is as follows:
(13)
(13)
where σt is the tensile strength of the FS.
When the interaction between the FS and the filling is considered, the bending moment is highlighted in EquationEq. 14(14)
(14) .
(14)
(14)
In addition, L of the natural FS (single layer) is given by
(15)
(15)
Similar to the derivation process of the critical FL of the single-layer FS, the calculation formula of the critical FL of the artificial composite frozen layer can be summarized by
(16)
(16)
where f1 and f2 are the friction coefficients of between the upper and lower frozen layers and the filling section, P1 and P2 are the maximum initial pressures of stress wave acting on the bottom of the upper and lower frozen layers. In addition, θ1 and θ2 are the angles between P1, P2 and the axial direction of the blasthole. h1 and h2 are the thickness of the upper and lower frozen layers, while γ1 and γ2 are the weight density of the upper and lower frozen layers, and σt is the tensile strength of the artificial composite frozen layer.
For the FS layer, the pressure (P1, P2) of detonation wave generated by the explosive detonation into the FS layer is not vertically incident, and the angles θ1 and θ2 can be expressed as follows:
(17)
(17)
(18)
(18)
4.2. Analysis of influence factors
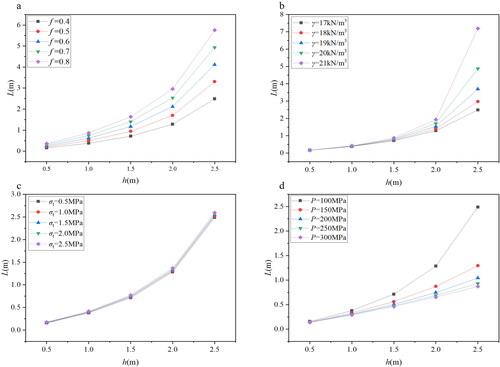
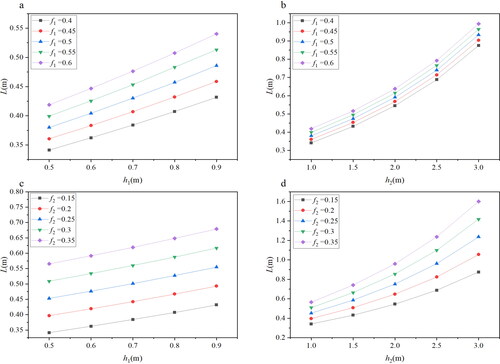
In order to explore the influence of various factors on the L of the frozen layer under dynamic load, the data within a certain range are brought into formula. shows the resulting relationship curve between the natural frozen layer L and h. Overall, L increases with the increase in h, but the sensitivity to other factors is very different. As shown in , when h is small, the change of f has limited effect on L. As h increases, the effect of f gradually becomes more obvious, and the greater the value of f, the larger the slope of the curve. In addition, the influence of γ () is basically consistent with f. In this regard, when h is greater than 2 m, the influence of different γ is gradually reflected. The greater the γ, the more obvious h’s influence on L. Compared with f and γ, the change in the tensile strength of the FS () has a limited effect on the relationship curve of L-h. As shown in , the slope of L-h curve increases gradually when the P value is low (100 MPa). On the other hand, when the P value exceeds a certain threshold (150 MPa), the effect of h on L is basically linear, and less dependent on P.
Figure 12. Relationships between FL and thickness of natural frozen soil; (a–d), respectively, for the different f, γ, σt, and P.
Furthermore, shows the variation curve of L-h1 and L-h2 under the influence of f1 and f2 coefficients. Overall, the correlation of the effects of various factors on L for the single-layer and double-layer FS is consistent. In addition, the growth rate (slope of L-h2) of L for the double-layer FS under the influence of h2 is higher than that of h1, while the influence of f2 is still stronger than f1. Similarly, the overall trend of the curves of L-h1 and L-h2 under different influencing factors (σt, γ, and P) is basically consistent. Moreover, the effect of the second layer is higher than that of the surface layer.
Figure 13. Relationships between FL and thickness of artificial frozen soil layer; (a) h1-L-f1, (b) h2-L-f1, (c) h1-L-f2, and (d) h2-L-f2.
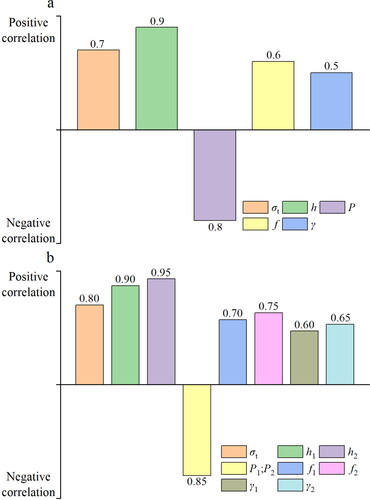
shows the influence of different factors on L for the natural and artificial FS layers. Only the pressure of the detonation wave is negatively correlated with L, where all the other factors exhibit a positive correlation with L. In terms of the degree of influence, the influence of h and P on L is equivalent, which is greater than the other factors. Then, in the order of influence, the tensile strength of the FS comes third, while the influence of f and γ on L is the smallest and relatively close. The artificial cushion has a certain influence on L, but the influence is less than the natural FS.
Figure 14. Influence factors of L of FS, (a) and (b), respectively, for the natural and artificial frozen soil layers.
4.3. Correction of the mechanical model
Since the L of the FS deduced in the previous section does not consider the superposition effect of the stress wave, there is an obvious deviation between the theoretical calculations and the actual measured results. In order to address this issue and reduce the deviation, the correction coefficient (k) was introduced (EquationEq. 19(19)
(19) ) to correct the FL. The range of k was set according to the error between the field blasting test and the theoretical calculation value. Because when blasting operations are carried out in open-pit mines in cold regions of the plateau, the actual fracture length of frozen soil will have a certain error with the theoretical calculation length due to the influence of the environment and artificial management. Additionally, if the stress superposition effect is considered, the theoretical effective length still needs to be modified. This is due to the complexity of field conditions, such as the differences in physical properties of different parts of the frozen soil layer, which cannot reach the ideal state of theoretical calculation. However, there is no doubt that the more factors considered (such as the stress wave superposition effect), the more accurate the calculation.
(19)
(19)
The breaking of the FS layer obtained by a field small-scale blasting test is shown in . In addition, lists the parameters used for calculating the FL of the FS. Through the field tests, the actual FL (Lk) and corresponding values of k were obtained. For the verification and correction of the theoretical formula of fracture length, the field blasting tests were not conducted in many areas. However, the analysis process of the mechanical parameters was the same, only the selection of the range of k needs to be further adjusted. Because k is related to the actual engineering geological and environmental conditions, the empirical value given by this study maybe not be applicable to all cases. For the blasting design, the parameters can be dynamically adjusted according to the actual blasting results to achieve fragment control of large blocks.
Figure 15. Photographs of field blasting tests, (a) and (b), respectively, for the natural and artificial frozen soil layers.
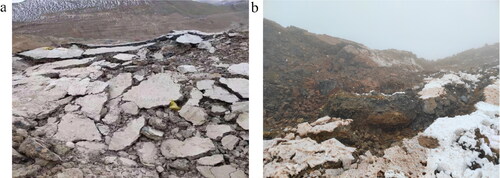
Table 3. Field blasting test parameters.
In general, the breaking mechanical model is effective for evaluating the blasting fragmentation of plateau bench FS in plateau alpine region mines, which can be used to guide the blasting design.
5. Conclusion
In order to understand the basic mechanical characteristics of the FS layer in Yulong open-pit mine in Tibet, six temperatures (designed based on the field tests) were set to conduct freezing tests. Additionally, the compression, tensile, and direct shear tests were carried out for the FS, and the breaking mechanical model of the FS under a dynamic load was established. The theoretical formula of L was deduced, and its influencing factors were analyzed. The specific conclusions of this work are as follows:
The freezing rate of the FS freezing depth affected by T is approximately linear or two-segment linear with time. The lower the T, the greater the early freezing rate, which later in the process will slow down drastically.
The compressive strength, elastic modulus, and tensile strength of the FS gradually decrease with the increase in T, while the shear strength, c and φ are higher in the state of no freezing and complete freezing, and lower in the state of ice-water mixture.
The f, γ, and σt are all positively correlated with respect to L of the FS, while P of the detonation wave is found to be negatively correlated with L. In addition, among the influencing factors of the double-layer FS, the effect of the second layer is higher than that of the surface layer. Moreover, the theoretical formula of L was modified according to field tests.
| Nomenclature | ||
| B | = | the unit width |
| Cp | = | the rock longitudinal wave velocity |
| D1 | = | the detonation velocity |
| db | = | the borehole diameter |
| dc | = | the diameter of the cartridge |
| dh | = | the drilling depth |
| Fm | = | the friction between the FS and the filling section |
| f | = | the friction coefficient between the FS and the filling section |
| f1 & f2 | = | the friction coefficients of between the upper and lower frozen layers and the filling section |
| Gw | = | the gravity of FS between the two adjacent blasting holes |
| h | = | the thickness FS |
| h1 & h2 | = | the thickness of the upper and lower frozen layers |
| L | = | the fracture length of FS |
| n | = | the increase multiple |
| P1 & P2 | = | the maximum initial pressures of stress wave acting on the upper and lower frozen layers |
| P11 | = | the horizontal component |
| P12 | = | the vertical component |
| Pm | = | the average detonation pressure of the initial expansion of detonation products |
| Vb | = | the volume of the strip drug compartment |
| Vc | = | the volume of the strip cartridge explosive |
| γ | = | the weight density of FS |
| γ1 & γ2 | = | the weight density of the upper and lower frozen layers of composite frozen layer |
| θ | = | the angle between the impact pressure acting on the blasthole wall and the axial direction of the borehole |
| θ1 & θ2 | = | the angle between P1, P2 and the axial direction of the blasthole |
| ρ0 | = | the explosive density |
| ρ0Cp | = | the impact resistance of FS |
| ρ0D1 | = | the explosive impact resistance |
| ρm | = | the density of FS |
| σt | = | the tensile strength of the FS |
Date availability
All data used during the study are available from the corresponding author by request.
Disclosure statement
The authors declared that there is no conflict of interest to this work.
Additional information
Funding
References
- Asaf Z, Drori O, Naroditsky D, Solomon U, Ravid M, Shapira N. 2017. The influence of soil temperature on blast intensity of buried explosive charges, 30th International Symposium on Ballistics, BALLISTICS 2017, September 11, 2017–September 15, 2017. Proceedings – 30th International Symposium on Ballistics, BALLISTICS 2017. DEStech Publications Inc., Long Beach, CA, United states. 1. p. 1096–1109.
- ASTM. 2019. Standard test methods for laboratory determination of water (moisture) content of soil and rock by mass, D2216–19. West Conshohocken, PA, USA: ASTM International.
- Chen Y, Zhou Z, Wang J, Zhao Y, Dou Z. 2021. Quantification and division of unfrozen water content during the freezing process and the influence of soil properties by low-field nuclear magnetic resonance. J Hydrol. 602:126719.
- Chen YL, Azzam R, Wang M, Xu S, Chang LQ. 2011. The uniaxial compressive and tensile tests of frozen saturated clay in Shanghai area. Environ Earth Sci. 64(1):29–36.
- Chou YL, Wang LJ. 2021. Seasonal freezing-thawing process and hydrothermal characteristics of soil on the Loess Plateau, China. J Mt Sci. 18(11):3082–3098.
- Ding C, Yang R, Feng C. 2021. Stress wave superposition effect and crack initiation mechanism between two adjacent boreholes. Int J Rock Mech Min Sci. 138:104622.
- Fan GW, Luo T, Liu SX, Zhang DS, Liu B, Chen MW. 2022. Triaxial test on the response of mechanical property of frozen body in unconsolidated aquifer to mining-induced stress. Bull Eng Geol Environ. 81(1):5.
- Fu T, Zhu Z, Ma W, Zhang FL. 2021. Damage model of unsaturated frozen soil while considering the influence of temperature rise under impact loading. Mech Mater. 163:104073.
- Fu ZG, Yu B, Zhao Y, Kawaguchi Y. 2014. Numerical simulation of frost heave in soils around the buried oil pipeline in island Talik permafrost region. Adv Mech Eng. 6:714818.
- Girgis N, Li B, Akhtar S, Courcelles B. 2020. Experimental study of rate-dependent uniaxial compressive behaviors of two artificial frozen sandy clay soils. Cold Reg Sci Tech. 180:103166.
- Hu G, Zhao L, Zhu X, Wu XD, Wu TH, Li R, Xie CW, Hao JM. 2020. Review of algorithms and parameterizations to determine unfrozen water content in frozen soil. Geoderma. 368:114277.
- Jin X, Yang W, Gao XQ, Zhao JQ, Li ZC, Jiang JX. 2020. Modeling the unfrozen water content of frozen soil based on the absorption effects of clay surfaces. Water Resour Res. 56(12): e2020WR027482.
- Li B, Zhu Z, Ning J, Li T, Zhou ZW. 2022. Viscoelastic–plastic constitutive model with damage of frozen soil under impact loading and freeze–thaw loading. Int J Mech Sci. 214:106890.
- Li SY, Lai YM, Zhang MY, Yu WB. 2015. Seasonal differences in seismic responses of embankment on a sloping ground in permafrost regions. Soil Dyn Earthq Eng. 76:122–135.
- Li X, Yan Y, Ji SY. 2022. Mechanical properties of frozen ballast aggregates with different ice contents and temperatures. Constr Build Mater. 317:125893.
- Li YL, Wang ZL, Luo Y. 2021. Physical and mechanical characteristics of shallow expansive soil due to freeze-thaw effect with water supplement. Adv Civ Eng. 2021:1–11.
- Li Z, Chen J, Tang A, Sugimoto M. 2021. A novel model of heat-water-air-stress coupling in unsaturated frozen soil. Int J Heat Mass Transf. 175:121375.
- Li ZQ, Hu F, Qi SW, Hu RL. 2020. Strain-softening failure mode after the post-peak as a unique mechanism of ruptures in a frozen soil-rock mixture. Eng Geol. 274:105725.
- Liu YZ, Cai YT, Huang SB, Guo YL, Liu GF. 2020. Effect of water saturation on uniaxial compressive strength and damage degree of clay-bearing sandstone under freeze-thaw. Bull Eng Geol Environ. 79(4):2021–2036.
- Ma F, Liu E, Song B, Wang P, Wang D, Kang J. 2022. A poromechanics-based constitutive model for warm frozen soil. Cold Reg Sci Tech. 199:103555.
- Ma Q, Huang K, Ma D. 2021. Energy absorption characteristics and theoretical analysis of frozen clay with pre-existing cracks under uniaxial compressive impact load. Cold Reg Sci Tech. 182:103206.
- Ma RM, Jiang Y, Liu B, Fan HM. 2021. Effects of pore structure characterized by synchrotron-based micro-computed tomography on aggregate stability of black soil under freeze-thaw cycles. Soil Tillage Res. 207:104855.
- Ming F, Li D, Zhang M, Zhang Y. 2017. A novel method for estimating the elastic modulus of frozen soil. Cold Reg Sci Tech. 141:1–7.
- Shams B, Ardakani A, Roustaei M. 2020. Laboratory investigation of geotextile position on CBR of clayey sand soil under freeze-thaw cycle. Sci Iran. 27(6):2808–2816.
- Shastri A, Sánchez M, Gai X, Lee M, Dewers T. 2021. Mechanical behavior of frozen soils, Experimental investigation and numerical modeling. Comput Geotech. 138:104361.
- Sun K, Tang L, Zhou A, Ling XZ. 2020. An elastoplastic damage constitutive model for frozen soil based on the super/subloading yield surfaces. Comput Geotech. 128:103842.
- Wang C, Li SY, Zhang TW, You ZM. 2019. Experimental study on mechanical characteristics and fracture patterns of unfrozen/freezing saturated coal and sandstone. Mater. 12(6):992.
- Wang P, Liu E, Zhi B, Song BT. 2020. A macro–micro viscoelastic-plastic constitutive model for saturated frozen soil. Mech Mater. 147:103411.
- Weismuller J, Wollschlager U, Boike J, Pan X, Yu Q, Roth K. 2011. Modeling the thermal dynamics of the active layer at two contrasting permafrost sites on Svalbard and on the Tibetan Plateau. Cryosphere. 5(3):741–757.
- Xie SB, Qu JJ, Lai YM, Zhou ZW, Xu XT. 2015. Effects of freeze-thaw cycles on soil mechanical and physical properties in the Qinghai-Tibet Plateau. J Mt Sci. 12(4):999–1009.
- Xing S, Wu T, Li Y, Miyamoto Y. 2022. Shaking table test and numerical simulation of shallow foundation structures in seasonal frozen soil regions. Soil Dyn Earthq Eng. 159:107339.
- Yang ZH, Still B, Ge XX. 2015. Mechanical properties of seasonally frozen and permafrost soils at high strain rate. Cold Reg Sci Tech. 113:12–19.
- Yue JW, Huang XJ, Zhao LM, Wang ZF. 2022. Study on the factors affecting cracking of earthen soil under dry shrinkage and freeze-thaw conditions. Sci Rep. 12(1):1816.
- Zhang F, Zhu Z, Fu T, Jia JX. 2020. Damage mechanism and dynamic constitutive model of frozen soil under uniaxial impact loading. Mech Mater. 140:103217.
- Zhang F, Zhu Z, Ma W, Zhou ZW, Fu TT. 2021. A unified viscoplastic model and strain rate–temperature equivalence of frozen soil under impact loading. J Mech and Phys Solids. 152:104413.
- Zhang Q, Miao CQ, Lin DC, Bai CH. 2003. Relation of fragment with air shock wave intensity for explosion in a shell. Int J Impact Eng. 28(10):1129–1141.
- Zhang Y, Xie F. 2011. Theoretical and test study on dynamic characteristics of thin-layered sandy frozen soil in blasting. J Comput. 6(6):1131–1138.
- Zhang ZL, Cui ZD. 2017. Analysis of microscopic pore structures of the silty clay before and after freezing-thawing under the subway vibration loading. Environ Earth Sci. 76(15):528.
- Zhang ZL, Cui ZD. 2018. Effect of freezing-thawing on dynamic characteristics of the silty clay under K0-consolidated condition. Cold Reg Sci Tech. 146:32–42.
- Zhou G, Hu K, Zhao X, Wang JZ, Liang HC, Lu GL. 2015. Laboratory investigation on tensile strength characteristics of warm frozen soils. Cold Reg Sci Tech. 113:81–90.
- Zhu ZW, Fu TT, Zhou ZW, Cao CX. 2021. Research on Ottosen constitutive model of frozen soil under impact load. Int J Rock Mech Min Sci. 137:104544.