
 ?Mathematical formulae have been encoded as MathML and are displayed in this HTML version using MathJax in order to improve their display. Uncheck the box to turn MathJax off. This feature requires Javascript. Click on a formula to zoom.
Abstract
Previous studies on carbon storage simulation had ignored the difference of carbon intensity among various vegetation types inner the same land use. In this paper, The PLUS model was used to predict the land use change under multi-scenarios from 2030 to 2060, and the vegetation type data were supplemented by CA model to obtain the land cover-vegetation datasets from 2030-2060. Combined with the carbon density table of vegetation type, the future land use carbon storage during 2030-2060 under multi-scenarios in Beijing-Tianjin-Hebei region were analyzed. The main conclusions were as follows: (1) The spatial distribution of carbon storage in Beijing-Tianjin-Hebei region showed a pattern of ‘high in northeast-southwest and low in southeast-northwest’; (2) The carbon storage in Beijing-Tianjin-Hebei region during 1990-2020 showed a decreasing trend; (3) During 2030-2060, the carbon storage in Beijing-Tianjin-Hebei region showed a continuous decreasing trend in the absence of policy intervention, while that under the ecological protection and farmland protection scenarios showed an increasing trend; (4) Under different development scenarios, there were obvious significances of carbon storage in spatial distribution.
1. Introduction
China announces that carbon emission should reach a peak by 2030 and carbon neutrality would be realized by 2060 at the 75th United Nations, which can provide strong supports for China’s high-quality development and ecological civilization (Canadell and Raupach Citation2008; Noble et al. Citation2000). Relevant studies have shown that carbon emissions from traditional energy consumption (such as coal) and greenhouse effect caused by large-scale land use change are all caused by human activities. Global climate change is closely related to human activities (Eberl et al. Citation2021). In the 1930s, the annual carbon emissions from land use change far exceed those from traditional fossil fuels, which have little impacts on the global carbon cycle but cause persistent disruption (Friedlingstein et al. Citation2019; Lin et al. Citation2022). The intervention of human activities has led to dramatic changes in land use, which further has great impacts on carbon dioxide emissions of terrestrial ecosystems, and the study of carbon cycle of the ecosystem has been a hotspot in recent years (Olofsson and Hickler Citation2008; Verburg et al. Citation2002; Zhang et al. Citation2020).
In recent years, lots of researches on predicting the spatial distributions of future land use were conducted to explore the change laws of land use with lots of models (such as CA-Markov model, CLUE-S model, and FLUS model) and then assess the impacts of land use changes on the environment. Verburg et al. (Citation1999) used CLUE model to predict the land use change in Ecuador for multiple scenarios. Sun et al. (Citation2009) applied the CA-Markov model to explore the impact of land use on wetland landscape pattern in Naoli River Basin in different periods. Hamad et al. (Citation2018) analyzed and predicted the spatial and temporal distribution of land use/land cover types in the core area of national parks (HSCZ) in the Kurdistan Region of Iraq using the CA-Markov model. Cong et al. (Citation2021) utilized the CLUE-S model to simulate the land use changes of Nansi Lake basin in 2050 under multi-scenarios with the Kappa coefficient of 0.78. Liu et al. (Citation2022) simulated and analyzed the land use changes in Xiangyun County in 2025 based on FLUS model. Tang et al. (Citation2022) utilized the FLUS model to predict the spatial distribution of land use in Miluo River Basin in 2035 from multiple scenarios.
During the past decades, researches on the correlations between land use and carbon storage have been conducted to calculate the carbon storage (Zhao et al. Citation2016). In recent years, many scholars applied the InVEST model and vegetation carbon sequestration model to estimate the carbon storage (Ramankutty et al. Citation2007). Houghton et al. (Citation1983) established a Bookkeeping model to investigate the net carbon flux in major global ecosystems. Wang and Gu (Citation2012) used the vegetation carbon sequestration model to investigate the impacts of land use on vegetation carbon storage in Wuhu City from 2000 to 2009, and found that vegetation carbon storage in Wuhu City generally showed a downward trend. Han (Citation2013) found that the carbon storage of terrestrial ecosystems decreased due to the significant change in land cover types caused by urban expansion in central and southern Liaoning Province. Kong et al. (Citation2018) found that the change of cultivated land was the dominant reason for the increase of total carbon storage caused by land cover change in Linze oasis with Bookkeeping model. Imran and Din (Citation2021) used InVEST model to analyze the temporal and spatial distribution of forest carbon storage. Most previous researches were conducted to estimate and predict the future carbon storage in large scale based on the land use data set. However, there were great differences in the carbon density of various vegetation types in the same land use (sun as forest) (Guo et al. Citation2022). Therefore, combing the vegetation types datasets to obtain the spatial distribution of carbon storage in large scale could enhance the simulation accuracy of carbon storage. However, the time series data sets of vegetation types were difficult to obtain. Therefore, how to combine the datasets of land use and vegetation types to improve the simulation accuracy of carbon storage in large scale has become a hot and urgent issue to be solved.
Beijing-Tianjin-Hebei is located in the hinterland of the Bohai Economic Circle. The development strategy of Beijing-Tianjin-Hebei integration and the construction of Xiongan New District in Hebei Province have caused dramatic changes of land use (Guo and Yang Citation2022; Li et al. Citation2022). In this paper, the PLUS model was used to predict the land use change under multi-scenarios from 2030 to 2060, and the vegetation type data were supplemented by CA model to obtain the land cover-vegetation datasets from 2030-2060. Combined with the carbon density table of vegetation type, the future carbon storage during 2030-2060 under multi-scenarios in Beijing-Tianjin-Hebei region were calculated and analyzed.
2. Materials and method
2.1. Study area
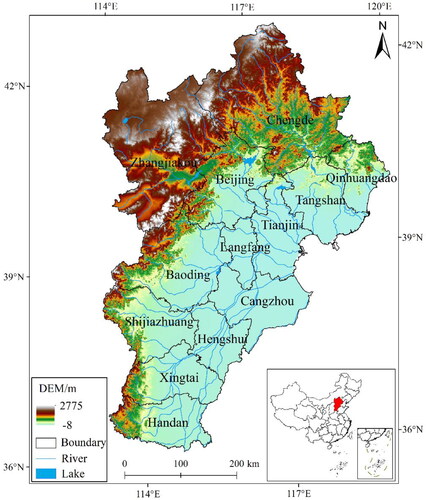
The Beijing-Tianjin-Hebei region (113°27′∼119°50′ E, 36°05′∼42°40′ N) is located in the northern part of the North China Plain (). The overall terrain shows a spatial pattern of ‘high in the northwest and low in the southeast’, which is mainly composed of plains, mountains and hills (Zeng et al. Citation2015). The climate in this region is dominated by warm temperate and semi-humid continental monsoon climate. The annual average temperature ranges from 0 °C to 14 °C, with higher temperatures in the south and lower temperatures in the north. Precipitation mainly occurs from June to August. The vegetation presents obvious zoning and vertical distribution patterns.
Figure 1. Location and topography of the study area.
2.2. Research method
2.2.1. Plus model
The PLUS model is established on the basis of the cellular automata. During the simulation process, LEAS and CARS modules are combined to generate the development probability and simulate the generation of land patches under the constraint of development probability (Wu et al. Citation2021).
LEAS model
Where is the development probability of the k land class in the unit i; The other land use types could convert to land use types k with d = 1, while other conversion types with d = 0; x is a vector composed of multiple driving factors; i is the indicator function of decision tree; hn(x) is the prediction type of the nth decision tree of vector x; M is the total number of decision trees.
CARS model
Where represents the impact of future k, which are an adaptive driving factor depending on the gap between the current number of land at iteration t and the target demand k for land use.
The prediction process of land use in Beijing-Tianjin-Hebei region by PLUS model could be divided into three steps: (1) according to the eco-environmental situation of Beijing-Tianjin-Hebei region, 10 driving factors such as elevation were selected and converted into raster data. To ensure the consistency of spatial distribution, it was necessary to adopt the same projection coordinate system and spatial resolution as land use data (Lin et al. Citation2022); (2) the development probability of each land type in the study area was determined; (3) the future land use changes in the study area was simulated and predicted by combining the target pixel number, transfer cost matrix, random patch seed probability and neighborhood factor.
2.2.2. Ca model
Cellular Automata (CA) is a discrete mathematical model. Its principle is to define the transformation rules of the adjacent areas of grid cells to simulate the interaction between grid cells (Wu et al. Citation2002).
The expression is:
(3)
(3)
Where is the state of cell i at time t + 1;
is the state of cell i at time t;
is the neighborhood state of cell i at time t;f refers to conversion rule.
The basis for CA model is the geographic cellular automata model. Due to the integration of vegetation data and land use data, only a large number of parcels of land can be determined. This model can be utilized to fill parcels, where the vegetation type cannot be determined.
2.2.3. Carbon storage calculation
Carbon density of different vegetation types is shown in (Lai et al. Citation2016). Vegetation carbon storage is calculated as follows:
(4)
(4)
Table 1. Carbon density of different vegetation types.
Where Bi is carbon stocks for type i land use (vegetation); Di is the carbon density of type i land use (vegetation); Ai is the area of type i land use (vegetation).
(5)
(5)
Where △C is changes of biomass carbon storage after conversion to another land type; is carbon storage after conversion;
is carbon storage before conversion;
is conversion area.
2.2.4. Land use transfer matrix
At present, many scholars have applied the land use transfer matrix to analyze the temporal changes of land use (Lambin et al. Citation2000).
The formula of land use transfer matrix is:
(6)
(6)
Where S represents area; n is number of land use types before and after transfer; i and j (i, j = 1, 2, …, n) represents land use types before and after transfer, respectively; Sij represents the area of the i-class converted to j-class before the transfer.
2.2.5. Dynamic degree of land use
The dynamic degree of land use can reflect the dynamic changes of land use in the study area and the spatial differences between different regions. The greater the dynamic degree of land use, the more severe the dynamic change of land use. (Jiang et al. Citation2022).
The formula of single dynamic degree (W) is as follows:
(7)
(7)
The formula of comprehensive dynamic degree (S) is as follows:
(8)
(8)
Where Ua and Si represent the area of initial single land use type; Ub represents the area of a single land use type at the end of the year; Si-j represents the total area of a certain type of land use converted into other types in the time period;T represents the time period.
2.3. Data source and preprocessing
2.3.1. Land use data
The land-use datasets of 1990, 2000, 2010 and 2020 were available from the Resource and Environmental Science and Data Centre (www.resdc.cn/) with a spatial resolution of 1 km (accessed on 15 April 2022). The vegetation type with the scale of 1:10,000,000 was obtained from the National Tibetan Plateau Science Data Center (accessed on 12 April 2022). The driving factor data for land use prediction were divided into three parts: terrain data, socio-economic data and national basic geographic data. Terrain data was derived from Geospatial Data Cloud (http://www.gscloud.cn/, accessed on 13 April 2022), mainly composed of elevation and slope. Socio-economic data and national basic geographic data were downloaded from the Resource and Environmental Science Data Centre (http://www.resdc.cn/, accessed on 17 April 2022), mainly including the national population intensity, GDP intensity, administrative division vector, road, railway, national road, provincial road data ().
Table 2. Data introduction.
2.4. Multi-scenario settings
According to the eco-environmental condition and development planning of population and economic of Beijing-Tianjin-Hebei region, this paper set different parameters and constraints in the PLUS model, and then constructed the following three scenarios to simulate the land use pattern in the study area from 2030 to 2060.
Scenario 1(Inertial development scenario): It indicates that the land use change is not subject to large policy intervention and there is no restriction on the conversion between various land use types. According to the current land use change trend and development model from 1990 to 2020, the population and economic growth rate continues the current trend.
Scenario 2 (Ecological protection scenario): According to the relevant planning requirements of ‘Hebei Province Land Space Planning (2021–2035)', ‘Tianjin Land Space Master Plan ‘and’ Beijing Land Space Recent Planning’, it is proposed to adhere to the three control lines and ecological protection system. In this scenario, the planning requirements are the main constraints to ensure the integrity of the ecological barrier in the study area.
Scenario 3(Farmland protection scenario):Under this scenario, it is strictly implemented in accordance with the requirements for the protection of cultivated land and basic farmland proposed by the ‘Beijing-Tianjin-Hebei Coordinated Development Land Use Overall Plan (2015-2020)’. The cultivated land is used as a restricted development area to prevent occupation by other land types in the study area.
3. Results
3.1. Accuracy validation of plus model for land use prediction in Beijing-Tianjin-Hebei region
In this paper, the Kappa coefficient and FOM parameters of the actual land use and predicted land use in 2020 were calculated to validate the accuracy of the PLUS model. The overall accuracy was 91.2% and the Kappa coefficient was 0.89, which indicated that the PLUS model had better applicability in the Beijing-Tianjin-Hebei region. In addition, the FOM coefficient was 0.31, which also indicated that simulation results were consistent with the actual land use in 2020.
3.2. Spatial-temporal characteristics of predicted land use change in Beijing-Tianjin-Hebei region under multi-scenario constraints
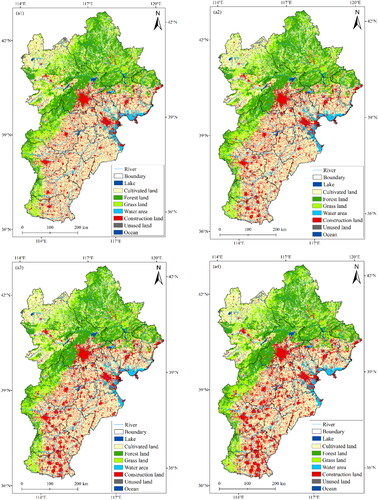
In this study, the land use data of 2030, 2040, 2050 and 2060 were simulated and predicted under three scenarios: inertial development scenario, ecological protection scenario and farmland protection scenario. The linear interpolation model was used to predict the demand of land use types in the future. Based on the existing land use type in the study area, the parameters were repeatedly debugged to determine the transfer cost matrix of land use. The probability of random patch seeds was set to 0.01, while that of the cultivated land, forest land, grassland, water area, construction land, unused land and ocean was 0.95, 0.4, 0.214, 0.95, 0.001, 0.2 and 0.9, respectively. The spatial distribution of land use prediction data under different scenarios from 2030 to 2060 were shown in .
Figure 2. Land use evolution map from 2030 to 2060 under different scenarios. (a1) Land use simulation map in 2030 under inertial development scenario; (a2) Land use simulation map in 2040 under inertial development scenario; (a3) Land use simulation map in 2050 under inertial development scenario; (a4) Land use simulation map in 2060 under inertial development scenario; (b1) Land use simulation map in 2030 under ecological protection scenario; (b2) Land use simulation map in 2040 under ecological protection scenario; (b3) Land use simulation map in 2050 under ecological protection scenario; (b4) Land use simulation map in 2060 under ecological protection scenario; (c1) Land use simulation map in 2030 under farmland protection scenario; (c2) Land use simulation map in 2040 under farmland protection scenario; (c3) Land use simulation map in 2050 under farmland protection scenario; (c4) Land use simulation map in 2060 under farmland protection scenario.
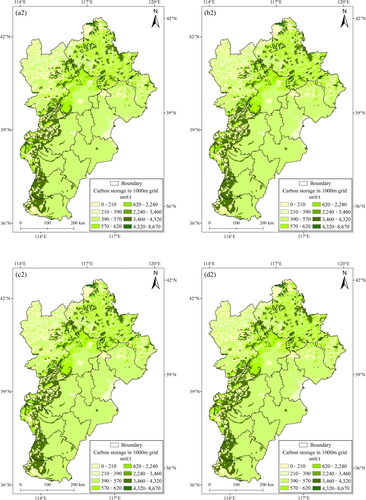
3.3. Spatial distribution of carbon storage in Beijing-Tianjin-Hebei region from 1990 to 2020
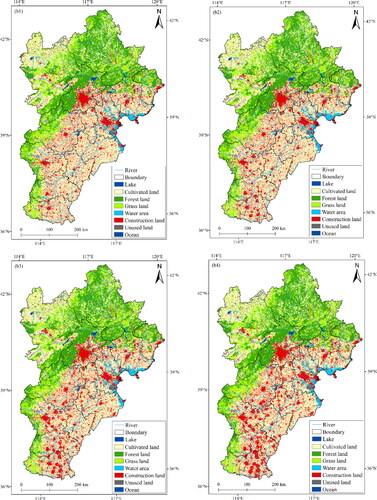
This paper utilized the CA models to combine land use data with vegetation type data to obtain the carbon storage from 1990 to 2020.There were obvious spatial distribution differences of carbon storage in the Beijing-Tianjin-Hebei region. showed that the carbon storage in plateau on the dam, the mountains of northern Hebei and Taihang Mountains were higher. The carbon storage in the central and southeast was lower, while that of the northeastern parts was higher.
Figure 3. Spatial distribution of carbon storage from 1990 to 2020. (a) 1990; (b) 2000; (c) 2010; (d) 2020.
3.4. Spatial and temporal changes of carbon storage at city scale
showed that the carbon storage in the Beijing-Tianjin-Hebei region had changed greatly. During 2010-2020, the carbon storage showed a decreasing trend, except for Qinhuangdao city. The carbon storage decreased significantly in Shijiazhuang city, Baoding city and Tangshan city. There was a strong demand for urban land expansion in these areas. A large amount of cultivated land and woodland had been converted to construction land. The smaller the radius was, the less the carbon storage was. From 2010 to 2020, Shijiazhuang city, Qinhuangdao city, Zhangjiakou city and Chengde city were the main areas, where the carbon storage decreased significantly by 610240 tons to 1467320 tons.
Figure 4. Change of carbon storage in different regions. (a) 2000–2010; (b) 2010–2020.
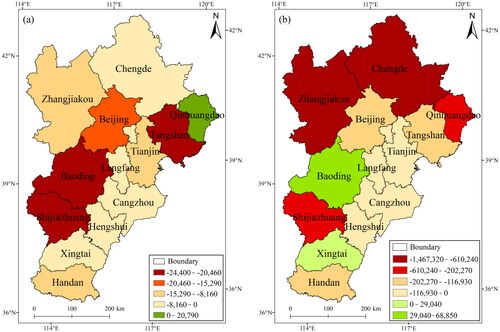
The reduction in carbon storage in 2010-2020 was more significant than that in 2000-2010. After 2010, the expansion capacity of construction land had been relatively enhanced, so that the change intensity among different land use type was higher. The regional carbon storage showed a significant decreasing trend. In addition, the decreasing trend of carbon storage reversed during 2000-2010. In 2003, the policy of returning cultivated land to forest and grassland had been implemented, which led to the restoration of vegetation ecosystem during this period.
3.5. Future carbon storage distribution and its variation characteristics under multiple scenarios
3.5.1. Change patterns of carbon storage from 2030 to 2060
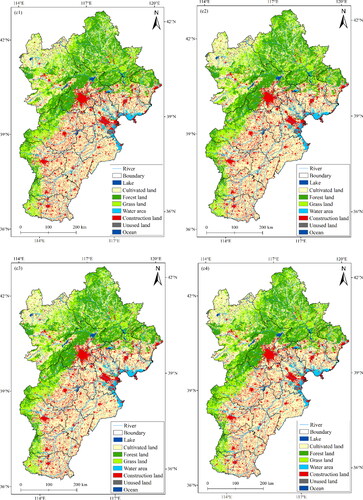
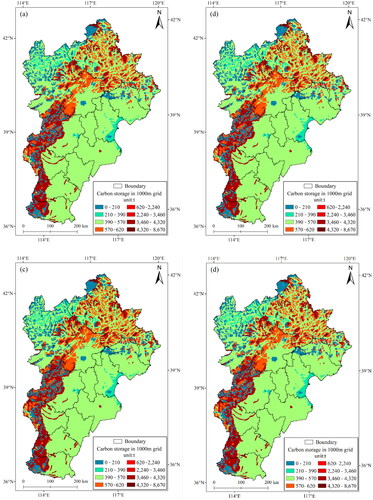
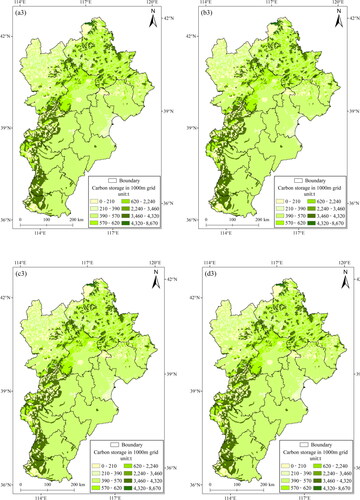
As shown in , the spatial distributions of future carbon storage under different multiple scenarios were mainly consistent, with the characteristics of ‘high in northeast-southwest and low in northwest-southeast’. The carbon storages of Yanshan Mountains and Taihang Mountains were larger, while that of North China Plain was smaller.
Figure 5. Spatial distribution of carbon storage during 2030-2060. (a1) in 2030 under inertial development scenario; (b1) in 2040 under inertial development scenario; (c1) in 2050 under inertial development scenario; (d1) in 2060 under inertial development scenario; (a2) in 2030 under ecological protection scenario; (b2) in 2040 under ecological protection scenario; (c2) in 2050 under ecological protection scenario; (d2) in 2060 under ecological protection scenario; (a3) in 2030 under farmland protection scenario; (b3) in 2040 under farmland protection scenario; (c3) in 2050 under farmland protection scenario; (d3) in 2060 under farmland protection scenario.

The change trend of future carbon storage in Beijing-Tianjin-Hebei region under different scenarios was shown in . Under the inertial development scenario and ecological protection scenario, the carbon storage in Beijing-Tianjin-Hebei region showed a decreasing trend. In 2030, 2040, 2050 and 2060, the total carbon storage under inertial development scenario and ecological protection scenarios were 2.28 × 10^8 tons, 2.28 × 10^8 tons, 2.279 × 10^8 tons, 2.278 × 10^8 tons and 2.28 × 10^8 tons, 2.28 × 10^8 tons, 2.28 × 10^8 tons, 2.279 × 10^8 tons, respectively. Under the farmland protection scenario, the changes of carbon storage in Beijing-Tianjin-Hebei region showed an increasing trend. The total carbon storage in 2030, 2040, 2050 and 2060 were 2.281 × 10^8 tons, 2.281 × 10^8 tons, 2.281 × 10^8 tons and 2.282 × 10^8 tons, respectively.
Figure 6. Change of carbon storage in 2030-2060 under multiple scenarios.
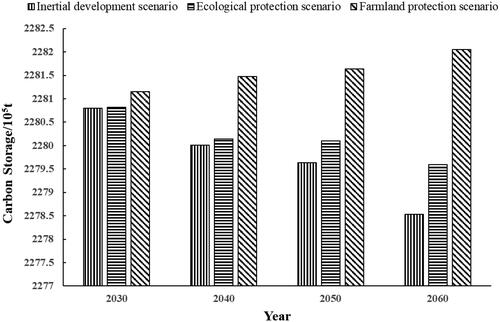
The results showed that the carbon storage of Beijing-Tianjin-Hebei region from 2030 to 2060 was ranked as inertial development scenario > ecological protection scenario > farmland protection scenario. The reason was that the constraints under the ecological protection scenario and farmland protection scenario greatly restricted the urbanization process, which resulted in an increase in carbon storage. This was consistent with the research results of Wu et al. (Citation2016).
3.5.2. Spatial-temporal evolution characteristics of carbon storage in different regions from 2020 to 2060
In order to better investigate the spatial and temporal evolution characteristics of carbon storage under the three scenarios, the change of carbon storage was divided into five levels: significant decrease (<−2 × 10^4 tons), decrease (−2 × 10^4 tons ∼−0.5 × 10^4 tons), unchanged (−0.5 × 10^4 tons ∼0.5 × 10^4 tons), increase (0.5 × 10^4 tons ∼2 × 10^4 tons) and significant increase (>2 × 10^4 tons).
Inertial development scenario
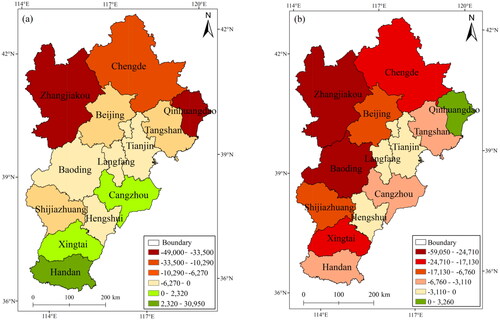
As shown in , the area proportions of significant decrease, decrease, unchanged, increase and significant increase in carbon storage during the two periods (2020-2040 and 2040-2060) were 0.17%, 0.48%, 0.07%, 0.23%, 0.06% and 0.46%, 0.43%, 0.07%, 0.04% and 0%, respectively. It showed that the overall carbon storage in Beijing-Tianjin-Hebei region changed greatly from 2020 to 2060. Compared with the two periods of 2040-2060 and 2020-2040, the change trend of carbon storage in Zhangjiakou city, Xingtai city, Handan city and Qinhuangdao city was the opposite. Zhangjiakou city, Xingtai city and Handan city changed from land carbon absorption zone to land carbon emission zone, and the change trend of carbon storage in other regions was the same. During 2020-2040, the areas with a decreasing trend in carbon storage were mainly concentrated in the central and northeastern regions. During 2040-2060, there was an upward trend in the northeast parts of in Qinhuangdao city.
Figure 7. Change of carbon storage under the inertial development scenario. (a) 2020–2040; (b) 2040–2060.
Ecological protection scenario
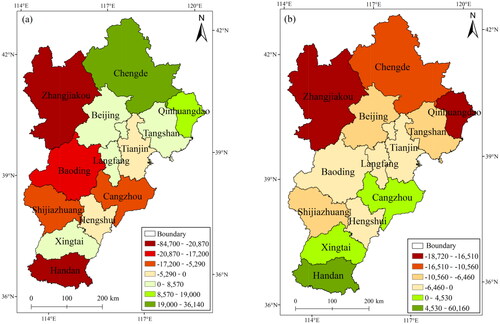
showed that the area proportions of significant decrease, decrease, unchanged, increase and significant increase in carbon storage in the two periods(2020-2040 and 2040-2060) were 0.23%, 0.29%, 0.04%, 0.26%, 0.18% and 0, 0.75%, 0.07%, 0.12%, 0.05%, respectively. It indicated that there was an overall decreasing trend of carbon storage in Beijing-Tianjin-Hebei region from 2020 to 2060. During 2020-2040, zones of decrease and significant decrease were mainly distributed in Zhangjiakou city, Baoding city, Shijiazhuang city, Cangzhou city, Handan city and Tianjin city. Zones of unchanged were mainly located in Hengshui city. During 2040-2060, there was a decreasing trend of carbon storage in most regions, except for Cangzhou city, Handan city and Xingtai city. During 2020-2040 and 2040-2060, Cangzhou city and Handan city had shifted from land carbon emission areas to land carbon absorption areas, while Beijing city and Langfang city had shifted from land carbon absorption areas to land carbon emission areas. Compared with the inertial development scenario, the zones of carbon storage under the ecological protection scenario during 2020-2060 were mainly located in Tangshan city, Langfang city and Chengde city.
Figure 8. Change of carbon storage under the ecological protection scenario. (a) 2020–2040; (b) 2040–2060.
Farmland protection scenario
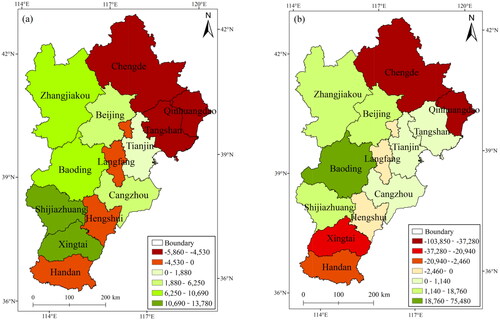
showed that the area proportions of significant decrease, decrease, unchanged, increase and significant increase in carbon storage in the two periods (2020-2040 and 2040-2060) were 0, 0.33%, 0.07%, 0.59%, 0.27%, 0.05%, 0.07%, 0.49% and 0.10%, respectively, which indicated that there was an overall increasing trend of carbon storage in the Beijing-Tianjin-Hebei region during 2020-2060. During 2020-2040 and 2040-2060, the change trend of carbon storage was consistent basically. During 2020-2040, the zones of carbon absorption were concentrated in Zhangjiakou city, Tianjin, Beijing city, Baoding city, Shijiazhuang city and Cangzhou city. During 2040-2060, these above areas still tended to store more carbon, which was conductive for carbon neutralization in 2060.
Figure 9. Change of carbon storage under the farmland protection scenario. (a) 2020–2040; (b) 2040–2060.
4. Discussion
4.1. Advantages of vegetation-land use based on CA-plus model
The PLUS model was established on the basis of the cellular automata. During the simulation, LEAS and CARS modules were combined to generate the development probability and simulate the generation of land patches under the constraint of development probability, so that the simulation results would be more accurate than other models (Ran Citation2021). In addition, the PLUS model adopted a new method to analyze the expansion part of land use and utilized a new multi-species seed growth mechanism (Sun et al. Citation2009). These advantages were not available in the commonly used land use simulation models such as CLUE-S, CA-Markov and FLUS (Wu et al. Citation2022; Guo et al. Citation2023a). This study set multiple scenarios based on PLUS model to obtain the simulation and prediction of future land use changes under different policy priorities (Liu et al. Citation2017; Guo et al. Citation2023b).
Most previous researches were conducted to estimate and predict the future carbon storage in large scale based on the land use data set. However, there were great differences in the carbon density of various vegetation types in the same land use (sun as forest). This study introduced the CA model to construct the land cover- vegetation datasets and then carried out the estimation of carbon storage in large-scale long-term series based on the vegetation type carbon density table (Liang et al. Citation2021). This method was simple to operate and easy to obtain the final result. The vegetation type carbon density table could better reflect the carbon density data of different vegetation types than land use (Zhu and Guo Citation2020).
4.2. Causes of spatial and temporal distribution pattern of carbon storage
The results showed that from 1990 to 2020, the overall carbon storage in the Beijing-Tianjin-Hebei region showed a decreasing trend. This change trend of carbon storage was significantly related to the change characteristics of cultivated land. Moreover, the overall change trend was consistent with the change of cultivated land area (Wei and Zan Citation2020). The cultivated land type with high carbon density and large carbon storage accounted for 35% of the total area in Beijing-Tianjin-Hebei region. After 2010, the demand for construction land showed a rapid increase with the fast urbanization process in Beijing city and Tianjin city. The construction area of Beijing-Tianjin-Hebei region continued to expand to the surrounding areas that mainly composed of cultivated land, so that the land use carbon emissions showed an increasing trend during 2010-2020 (Lai et al. Citation2016).
From the perspective of spatial distribution of carbon storage, there were obvious spatial differences in the spatial distribution of carbon storage in the Beijing-Tianjin-Hebei region. During 1990-2020, the carbon storage was higher in the Bashang Plateau, the Northern Hebei Mountains and the Taihang Mountains. The reason was that the forest and grassland were widely distributed in these regions with high vegetation coverage and carbon density. The carbon storage was relative lower in the central and southeast of Beijing-Tianjin-Hebei due to the fact that the cultivated land and construction area were widely distributed with lower carbon intensity.
4.3. Reasons and regulation of future carbon storage changes under multiple scenarios
The change trend of carbon storage in Beijing-Tianjin-Hebei region under different scenarios differed greatly. Under inertial development scenario and ecological protection scenario, the carbon storage both showed a decreasing trend, while that under farmland protection scenario showed an increasing trend.
During 2020-2060, the cultivated land was the largest contributor to carbon storage, followed by forest land, grassland, construction land, water area and unused land. Under different scenarios, the increase and decrease of carbon storage in Beijing-Tianjin-Hebei region were closely related to the mutual conversions among different land types. Cultivated land and forest land contributed about 35% and 30% to the carbon storage in the Beijing-Tianjin-Hebei region. The increase or decrease of cultivated land and forest land was the main reason for the change of carbon storage. Cultivated land was the most widely distributed land use type in the Beijing-Tianjin-Hebei region, accounting for about 50%, while the forest land accounted for about 20%. Therefore, the increase or decrease of cultivated land and forest land was the main reason for the change of carbon storage (Chen et al. Citation2021).
Under inertial development scenario, cultivated land was constantly converted to other land types, among which the construction land accounted for the largest area percentage. The conversion of cultivated land to construction land played an important role in leading to the reduction of carbon storage (Guo and Wang Citation2022). By comparing the carbon storage under three scenarios, it was found that the carbon density of vegetation types (cultivated land, forest land and grass land) was larger and the area increase of these above land use type was conducive to improve the carbon storage. With the expansion of construction land, the carbon density became lower, which would lead to a reduction in the carbon storage capacity of the ecosystem (Chen et al. Citation2022).
Under the two scenarios of ecological protection and cultivated land protection, the carbon emissions of land use carbon storage increased, which played a certain role in stabilizing the regional carbon balance. Therefore, it was necessary to effectively control the speed and scale of urbanization and prevent the extensive land use caused by random expansion (Fu et al. Citation2021). With the implementation of control measures for soil erosion, desertification and rocky desertification, the surface vegetation ecosystem had been greatly restored, which could ensure stable carbon storage in the region and maintain the balance between carbon emission and carbon absorption in the region.
In view of the actual condition of carbon emissions in Beijing-Tianjin-Hebei region and the predicted development trend of carbon emissions, some suggestions for promoting the carbon emission reduction in the Beijing-Tianjin-Hebei region were as follows: (1) Optimize the land use development to reduce carbon sources. Since construction land was the main source of urban carbon emissions, and its impact should be fully considered and carbon emission control goals should be incorporated into urban space planning; (2) Control the encroachment of construction land on farmland for development and strictly abide by the red line of farmland protection; (3) Increase carbon sinks to achieve carbon neutralization. The rational design of low-carbon industries through appropriate policies could promote the optimization of land use in the quantitative structure and spatial distribution. (4) Pay attention to the impact and protection of ecological environment. To make full use of the carbon storage capacity of forest land, grassland and other land types and increase forest carbon storage could increase the storage capacity of land use.
5. Conclusion
In this paper, the spatial and temporal changes of carbon storage during 2030-2060 under multi-scenarios in Beijing-Tianjin-Hebei region were calculated and analyzed based on CA-PLUS model. The main conclusions were as follows:
During 1990-2020, the spatial distribution of carbon storage in Beijing-Tianjin-Hebei region shows a pattern of 'high in northeast-southwest region and low in southeast-northwest region '. The carbon storage in Beijing-Tianjin-Hebei region during 1990-2020 showed a decreasing trend.
During 2030-2060, in the absence of policy intervention, the carbon storage of land use in Beijing-Tianjin-Hebei region showed a continuous decreasing trend, while that under the ecological protection and farmland protection scenarios showed an increasing trend.
Under the inertial development scenario, the carbon storage showed a decreasing trend during 2040-2060. Under the ecological protection scenario, the carbon absorption area was concentrated in the northeast parts during 2020-2040, while the increase trend of carbon storage in the northeast parts during 2040-2060 might reverse and became the carbon emission area. Under the farmland protection scenario, the central and northwestern regions were the carbon absorption areas during 2020-2060.
Data availability statement
The data that support the findings of this study are available from the corresponding author, Guo B, upon reasonable request.
Additional information
Funding
References
- Canadell JG, Raupach MR. 2008. Managing forests for climate change mitigation. Science. 320(5882):1456–1457.
- Chen LT, Cai HS, Zhang T, Zhang XL, Zeng H. 2022. Land use multi-scenario simulation analysis of Rao River Basin based on Markov-FLUS model. Acta Ecol Sin. 42(10):3947–3958.
- Chen ST, Guo B, Zhang R, Zang WQ, Wei CX, Wu HW, Yang X, Zhen XY, Li X, Zhang DF, et al. 2021. Quantitatively determine the dominant driving factors of the spatial–temporal changes of vegetation NPP in the Hengduan Mountain area during 2000–2015. J Mt Sci. 18(2):427–445.
- Cong WC, Sun XY, Luan XL. 2021. Simulation of land use change in Nansihu Lake Basin based on the CLUE-S model. J Qufu Normal Univ (Nat Sci). 47(02):106–112.
- Eberl J, Gordeeva E, Weber N. 2021. The policy coherence framework approach in a multi-level analysis of European, German and Thuringian climate policy with a special focus on land use, land-use change and forestry (LULUCF). World. 2(3):415–424.
- Friedlingstein P, Jones MW, O'Sullivan M, Andrew RM, Hauck J, Peters GP, Peters W, Pongratz J, Sitch S, Le Quéré C, et al. 2019. Global carbon budget 2019. Earth Syst Sci Data. 11(4):1783–1838.
- Fu WJ, Huang JC, Wang S. 2021. Multi-scenario simulation of land use change and ecosystem service value evaluation in area along the Yellow River in Henan Province. Henan Sci. 39(12):1994–2006.
- Guo B, Lu M, Fan YW, Wu HW, Yang Y, Wang CL. 2023a. A novel remote sensing monitoring index of salinization based on three dimensional feature space model and its application in the Yellow River Delta. Geomatics Nat Hazards Risk. 14(1):95–116.
- Guo B, Yang F, Fan YW, Zang WQ. 2023b. The dominant driving factors of rocky desertification and their variations in typical mountainous karst areas of Southwest China in the context of global change. Catena. 220:106674.
- Guo B, Yang F, Fan JF, Lu YF. 2022. The changes of spatiotemporal pattern of rocky desertification and its dominant driving factors in typical Karst Mountainous areas under the background of global change. Remote Sens. 14(10):2351.
- Guo B, Yang F. 2022. A novel feature space monitoring index of salinization in the Yellow River Delta based on Sentinel-2B MSI image and feature space model. Land Degrad Dev. 33(13):2303–2316.
- Guo T, Wang ZY. 2022. Prediction and multi-scenario simulation analysis of the temporal and spatial evolution of ecosystem carbon storage in Nanjing based on LUCC. Hubei Agric Sci. 61(06):33–40 +47.
- Hamad R, Balzter H, Kolo K. 2018. Predicting land use/land cover changes using a CA-Markov model under two different scenarios. Sustainability. 10(10):3421.
- Han JR. 2013. The impact of urban sprawl on carbon stocks based on the InVEST model. Changchun: Northeast Normal University.
- Houghton RA, Hobbie JE, Melillo JM, Moore B, Peterson BJ, Shaver GR, Woodwell GM. 1983. Changes in the carbon content of terrestrial biota and soils between 1860 and 1980: a net release of CO2 to the atmosphere. Ecol Monogr. 53(3):235–262.
- Imran M, Din Nu 2021. Geospatially mapping carbon stock for mountainous forest classes using InVEST model and Sentinel-2 data: a case of Bagrote valley in the Karakoram range. Arab J Geosci. 14(9):1–12.
- Jiang XF, Duan HC, Liao J, Song X, Xue X. 2022. Land use in the Gan-lin-gao region of middle reaches of Heihe River Basin based on a PLUS-SD coupling model. Arid Zone Res. 8(4):1246–1258.
- Kong JQ, Yang R, Su YZ. 2018. Effect of land use and cover change on carbon stock dynamics in a typical desert oasis. Acta Ecol Sin. 38(21):7801–7812.
- Lai L, Huang X, Yang H, Chuai X, Zhang M, Zhong T, Chen Z, Chen Y, Wang X, Thompson JR, et al. 2016. Carbon emissions from land-use change and management in China between 1990 and 2010. Sci Adv. 2(11):e1601063.
- Lambin EF, Rounsevell MDA, Geist HJ. 2000. Are agricultural land-use models able to predict changes in land-use intensity? Agric, Ecosyst Environ. 82(1–3):321–331.
- Lin T, Yang MZ, Wu DF, Liu F, Yang JH, Wang YJ. 2022. Spatial correlation and prediction of land use carbon storage in Guangdong Province based on in- VEST-PLUS model. China Environ Sci. 8:1–17.
- Li SF, Hong ZL, Xue XP, Zhang FJ, Shi W. 2022. Multi-scenario simulation of LUCC in Binzhou City based on Logistic-CA Markov coupling model. Res Soil Water Conserv. 29(04):292–299.
- Liang X, Guan Q, Clarke KC, Liu S, Wang B, Yao Y. 2021. Understanding the drivers of sustainable land expansion using a patch-generating land use simulation (PLUS) model: a case study in Wuhan, China. Comput Environ Urban Syst. 85:101569.
- Liu JF, Lin YL, Zhao JS. 2022. Countyland use change simulation and expansion analysis based on FLUS model. Urban Geotech Investig Surv. (02):16–21.
- Liu X, Liang X, Li X, Xu X, Ou J, Chen Y, Li S, Wang S, Pei F. 2017. A future land use simulation model (FLUS) for simulating multiple land use scenarios by coupling human and natural effects. Landscape Urban Plann. 168:94–116.
- Noble I, Bolin B, Ravindranath N, et al. 2000. Land use, land use change, and forestry. Environ Conserv. 28(3):284–293.
- Olofsson J, Hickler T. 2008. Effects of human land-use on the global carbon cycle during the last 6,000 years. Veget Hist Archaeobot. 17(5):605–615.
- Ramankutty N, Gibbs HK, Achard F, Defries RUTH, Foley JA, Houghton RA. 2007. Challenges to estimating carbon emissions from tropical deforestation. Global Change Biol. 13(1):51–66.
- Ran ZJ. 2021. Research on Simulation and Prediction of Land Use Change in Banan District Based on CA-Markov Model. Anhui Agric Sci Bull. 27(11):125–130.
- Sun XB, Liu HY, Li FY. 2009. CA-Markov model-based identification of impacts of land use on landscape pattern. J Ecol Rural Environ. 25(01):1–7. +31.
- Tang J, Hu XJ, Wei BJ, et al. 2022. Land use change prediction and hydrological response assessment of watershed based on FLUS model. J Yangtze River Sci Res Inst. 39(04):63–69.
- Verburg PH, de Koning GHJ, Kok K, Veldkamp A, Bouma J. 1999. A spatial explicit allocation procedure for modelling the pattern of land use change based upon actual land use. Ecol Modell. 116(1):45–61.
- Verburg PH, Soepboer W, Veldkamp A, Limpiada R, Espaldon V, Mastura SSA. 2002. Modeling the spatial dynamics of regional land use: the CLUE-S model. Environ Manage. 30(3):391–405.
- Wang RX, Gu JC. 2012. Impact of LUCC on vegetation carbon storage in Wuhu during 2000–2009. Environ Sci Manage. 37(06):153–157.
- Wei PP, Zan M. 2020. Changes of land coverage and the impact on vegetation carbon storage in Yili Region. J Northwest For Univ. 35(04):158–166.
- Wu D, Zhu KW, Zhang S, Huang CQ, Li J. 2022. Evolution analysis of carbon storage in Chengdu-Chongqing economic zone based on PLUS model and in VEST model. Ecol Environ Monit Three Gorges. 6(8):85–96.
- Wu HW, Guo B, Fan JF, Yang F, Han BM, Wei CX, Lu YF, Zang WQ, Zhen XY, Meng C. 2021. A novel remote sensing ecological vulnerability index on large scale: a case study of the China-Pakistan Economic Corridor region. Ecol Indic. 2021:107955.
- Wu PJ, Liu XP, Li X, et al. 2016. Impact of urban expansion on carbon storage in terrestrial ecosystems based on InVEST model and CA: a case study of Guangdong Province, China. Geogr Geo-Inf Sci. 32(05):22–28.
- Wu XB, Zhao J, Wei CJ, et al. 2002. The urban expanding simulation with the cellular automata model in Hai Kou. City Plan Rev. 08:69–73.
- Zeng XM, Liu H, Liu WD. 2015. Spatial pattern and club convergence analysis of urban expansion in Beijing-Tianjin-Hebei urban agglomeration. J Nat Res. 30(12):2045–2056.
- Zhang JD, Mei ZX, Lv JH, et al. 2020. Simulating multiple land use scenarios based on the FLUS model considering spatial autocorrelation. J Geo-Inf Sci. 22(03):531–542.
- Zhao DL, Du M, Yang JY, et al. 2016. Simulation and forecast study of land use change based on CA-Markov model. Trans Chin Soc Agric Mach. 47(03):278–285. 1000-1298. 2016. 03. 039
- Zhu XL, Guo QX. 2020. Scenario simulation of land use spatial pattern based on CLUE-S model-a case study of Xinfu District, Xinzhou City. Jiangsu Agric Sci. 48(04):254–259.