
 ?Mathematical formulae have been encoded as MathML and are displayed in this HTML version using MathJax in order to improve their display. Uncheck the box to turn MathJax off. This feature requires Javascript. Click on a formula to zoom.
Abstract
Water is a very vital needed substance in order to maintain the important activities of humans. However, contaminated water can transmit diseases such as typhoid, dysentery, diarrhea, cholera and polio. Pakistan is a highly affected country due to the scarcity of safe and healthy water sources. The current study mainly focuses to determine water quality in the selected area. For this purpose, an integrated surface water quality index (SWQI) based on 18 hydrochemical parameters is employed. SWQI substantially correlates with pH, EC, SO4, HCO3 and heavy metals. Therefore, these parameters are utilized in the calculation of SWQI. The results of SWQI show that about 69.23% of samples are ‘very good quality’. Moreover, 30.77% of the total samples are of poor quality and are identified as unsuitable for drinking. Further, Ordinary kriging (OK) and Universal kriging (UK) are used to predict the SWQI at unobserved locations and map the SWQI in the study area to explore the spatial distribution. The prediction performance of the two kriging methods is assessed through cross-validation in terms of root mean square prediction error (RMSPE). It is concluded that the prediction performance of the UK is better than OK in terms of RMSPE.
1. Introduction
Freshwater resources have come under the spotlight due to quantity and quality reasons. However, surface water resources are extremely sensitive to changing natural processes such as rainfall, temperature, forest cover and climate change (Yang, Linyu, and Shun Citation2009; Usman, et al. Citation2014). The changes in natural environmental processes are greatly influenced by anthropogenic activities, including growth in urban areas and agricultural pursuits (Khatri and Tyagi Citation2015; Bouguerne et al. Citation2017; Verma et al. Citation2019). Anthropogenic activities can potentially cause the degradation of surface water resources. The pollutants from urban areas, industries, and agricultural lands make surface water resources vulnerable (Satterthwaite, McGranahan, and Tacoli Citation2010; Huang et al. Citation2018; Salerno, Gaetano, and Gianni Citation2018). In recent years, potentially toxic trace elements (PTEs) have affected aquatic ecosystems around the world (Nazeer, Hashmi, and Malik Citation2014; Paudyal, et al. Citation2016). Excessive concentrations of the PTEs can be hazardous to the ecosystem’s health (Iqbal and Shah Citation2013). These elements can enter into the water bodies (e.g. rivers and lakes) through runoffs from agriculture, atmospheric deposition, bedrock, and water drainage (Paudyal, et al. Citation2016; Iqbal and Shah Citation2013) and thus risk human health and the aquatic ecosystem (Wu et al. Citation2009).
Therefore, it is crucial to quantify and assess the trace metals in the marine environment to investigate risks to humans and aquatic ecosystems. Lithogenesis, erosion, weathering and other geological phenomena are the natural sources of pollution (Stafilov et al. Citation2010). Traffic emissions, and agricultural, mining, and industrial activities are among the anthropogenic sources (Anju and Banerjee Citation2012; Gu et al. Citation2014). Cadmium (Cd) is the most-probable carcinogen causing lung cancer (Żukowska and Biziuk Citation2008). Lead (Pb) adversely affects the child’s brain and central nervous system (CNS) (Kaufmann, Staes, and Matte Citation2003). It causes abdominal pain, restlessness, irritability, headache, and sleeplessness. It further, causes behavioral abnormalities and learning issues for the under five years aged children. Zinc (Zn) may result in infertility, and kidney and CNS disorders. Copper (Cu) induces depression and lung cancer (Sani et al. Citation2017). Cr is known to cause cancer and tumor of respiratory organs (Langård, Andersen, and Gylseth Citation1980). Mo triggers molybdenosis in livestock (Alloway and Ayres Citation1997). Continuously expanding industrialization and mining exercises have resulted in the excessive enrichment of toxic heavy metals in all kinds of soils, surface water and living organisms (Iqbal, Saleem, and Shah Citation2016).
Water is serving humans’ activities in numerous way whether directly or indirectly. It is used for agriculture, domestic, recreational, and industrial purposes. However, water is deteriorating globally due to heavy metal pollution. Geometric increase in human population coupled with rapid urbanization, industrialization, technological advancement, and agricultural development has deteriorated the pristine nature of inland water bodies, viz. lakes, wetlands, rivers, and so on (Ibrahim and Nafi’u Citation2017). Water contamination is a common worldwide problem in mountain recreation areas (Kuniyal, Jain, and Shannigrahi Citation1998; Pickering and Buckley Citation2003; Stephenson Citation1993). The pristine water is the primary attraction of Swat and Dir, however uncontrolled tourism has caused detrimental changes to the water. People reside near two river basins, Swat and Panjkora, use rivers for drinking water and household purposes, and eat fish from the rivers.
Various methods such as water quality index and multivariate statistical tools are used to provide a better understanding of water quality (Wali et al. Citation2022; Khan et al. Citation2022). The geostatistical methods are useful for analyzing spatial variability structure, interpolating between point observations, and creating a map of interpolated values with an associated error map (Zhou, et al. Citation2011; Arslan Citation2012). Kriging is one of the geostatistical interpolation approaches consisting of several methods, including Indicator kriging, Simple kriging, Ordinary kriging and Co-kriging, commonly applied in estimating the spatial distribution of characteristics of interest (Lee et al. Citation2007; Babiker, Mohamed, and Hiyama Citation2007; Dindaroğlu Citation2014; Gyamfi et al. Citation2016). Ahmadi and Sedghamiz (Citation2007) analyzed groundwater level spatial and temporal variations using Ordinary kriging and Co-kriging methods. Delbari and Pour Miremadisar (Citation2010) estimated groundwater’s salinity and depth using Ordinary kriging, Co-kriging, and the inverse fourth power of distance methods. Also, Hooshm, et al. (Citation2011) applied kriging and Co-kriging methods to evaluate the groundwater’s chloride content and sodium adsorption ratio. Hence, several methods and multivariate statistical tools have been used to provide a better understaning of water quality. To extend researchers work to the various Glacial Alpine Lakes and Glacier fed Rivers such as River Swat and River Panjkora, Khyber Pakhtunkhwa, Pakistan. The current study mainly focuses on water quality through an integrated surface water quality index (SWQI) based on 18 hydrochemical parameters. SWQI significantly correlates with pH, EC, SO4, HCO3 and heavy metals. Therefore, these parameters are employed in the calculation of SWQI. Ordinary kriging (OK) and Universal kriging (UK) are utilized to predict the SWQI at unobserved locations and map the SWQI to explore the spatial distribution.
2. Materials and methods
2.1. Study area description
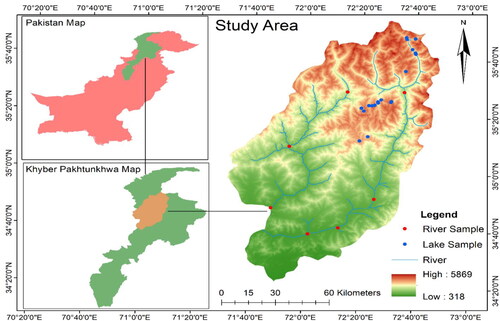
The current research area covers a wide portion of Pakistan’s Khyber-Pakhtunkhwa province and includes the three districts of Swat, Lower Dir, and Upper Dir. The northern mountain ranges have a temperate zone where Swat is located (). Its altitude ranges from 500 to 6500 m above sea level (Qasim, et al. Citation2011). The Swat River originates in Kalam at the confluence of the Ushu and Utror rivers, then runs down the valley for 160 km to Chakdara. The river runs over 250 km from Kalam to a location not far from Charsada. Numerous big and small tributaries join the river during its course. River Panjkora is a 220 km long river that runs through the Dir Upper and Dir Lower districts and join River Swat at Bosaq (where the rivers Dir Lower, Malakand, and Bajaur Agency converge). From there, River Swat flows onwards. River Panjkora ultimately merges with River Kabul at District Charsadda. The current research work thoroughly for the water quality along the various Glacial Alpine Lakes, and Glacier fed Rivers such as River Swat and River Panjkora, Khyber Pakhtunkhwa, Pakistan
Figure 1. The geographical locations selected for the current analysis.
2.2. Glacial alpine lakes
Ageta et al. claim that there are three distinct categories of glacial lakes (Ageta, et al. Citation2000): (1) Unconnected glacial lakes are lakes that are not directly connected to glaciers but may have a glacier within their basin (2) supraglacial lakes (melting ponds), which form on the glacier’s surface downstream; or (3) proglacial lake, which are moraine-dammed lakes that are in contact with the glacier front. Some of these lakes have substantial water storage capacities and are vulnerable to GLOFs. (Floods from glacial lake outbursts) (Salerno, et al. Citation2012). The geomorphological, climatic, and hydrological characteristics typical of the latitude and altitude at which their hydrographic basins are located; are strongly linked to the lakes’ large chemical and biological variety (Lami, et al. Citation1998; Kamenik et al. Citation2000; Sommaruga and Psenner Citation2001; Laurion, Lami, and Sommaruga Citation2002). The ecosystems are extremely delicate and vulnerable (Karlsson, Jonsson, and Jansson Citation2005; Brown, Hannah, and Milner Citation2007), where climate change greatly impacts their functioning and structure (Stenseth et al. Citation2002; Wrona et al. Citation2006; Battarbee et al. Citation2005; Baudo, Tartari, and Vuillermoz Citation2007). The glacial lakes are a good indicator for assessing the effects of climate change at high elevations (Richardson and Reynolds Citation2000; Benn, Wiseman, and Hands Citation2001).
2.3. Hydrochemical parameters analyzed
Due to the cumbersome sampling process due to high altitude hike, sampling was conducted on different days, 23, 24, 27, 28, and 29th June 2021. A total of 26 samples were collected from lakes and rivers. All the samples were taken in triplicates, kept on ice for a short period, and then subjected to physiochemical parameters analysis within six hours of being transferred to the PCRWR laboratory in Peshawar. Samples were sent to the centralized resource laboratory University of Peshawar to analyze water for heavy metals and stored at 4 °C. The geographic location of each lake and river was determined using GPS. With the aid of a geologist, the mineralogy and lithology of the neighboring mountains and lakes were determined. All the samples were collected in various bottles for different analyses, for heavy metals 250 mL pre-cleaned polythene bottles that had been being soaked and washed with 10% HNO3 were used, and for chemical oxygen demands (COD), dissolved oxygen (DO), turbidity, hardness, 1 L of water was collected. The COD, nitrate, sulphate, and DO levels were assessed using standard Methods. All samples were filtered using a 0.47 m Watman® glass microfiber filter GF/F. One part of each sample was acidified with 5% HNO3 (3–5 drops) to analyze heavy metals quantitatively. While the remaining portion of the sample was not acidified, it was nonetheless analyzed for chloride, sulfate, nitrate, and other elements. Physical parameters such as pH, electrical conductivity (EC), and total dissolved solids (TDS) were measured in situ during sample collection using the portable handheld meter and were caliberated before use (Model 8361). The USA-based Perkin Elmer AAS 700 atomic absorption spectrophotometer was used to measure the quantities of heavy metals, duplicate samples, certified reference materials (CRM 700), batches of water samples, and reagent blanks were used to evaluate quality assurance and control. Mohr’s method was used for calculations of Cl− concentrations and bicarbnate using titrimetric method (Rashid et al. Citation2019). Nitrate and Sulphate were measured using a UV visible spectrophotometer (HACH DR 5000) utilizing a standard turbid metric method, at wavelengths of 420 and 410 nm, respectively (Apha Citation2007). A study area map and a geological map were designed to interpret data sets via ARC.GIS 10.3. The water quality at sampled locations was assessed by using WQI.
2.4. Calculation of water quality index
Horton was the first to propose the water quality index (WQI), which is the most appropriate way to assess water quality(El Baba et al. Citation2020; Boudibi, Sakaa, and Zapata-Sierra Citation2019; Peterside, Hart, and Nwankwoala Citation2022). Many researchers used this index to analyze water quality (Sani et al. Citation2017; Wali et al. Citation2022; Hooshm, et al. Citation2011; Qasim, et al. Citation2011; Raza et al. Citation2021; Wali, Alias, and Bin Harun Citation2020a; Wali, Alias, and Harun Citation2021; Wali, Alias, and Bin Harun Citation2020b). The first step in this procedure is to assign weights to each physicochemical parameter. Then, the assignment of weights to different parameters is determined according to their relative importance in potable water. WQI can be calculated by using the following formula
(1)
(1)
where in EquationEquation (1)
(1)
(1) SIi is the sub-index calculated by multiplying a parameter’s quality rating to its corresponding relative weights, that is,
(2)
(2)
In EquationEquation (2)(2)
(2)
is the relative weight of ith parameter, and qi is the quality rating of ith parameter of water (see, EquationEquation (3)
(3)
(3) ).
(3)
(3)
Ci is the concentration of each parameter in the water sample; Si is the standard value of the ith parameter.
2.5. Geostatistical techniques
Ordinary Kriging and Universal kriging techniques were used to obtain the prediction maps of the water quality index (WQI). Kriging is a geostatistical approach that estimates a variable’s value over a continuous spatial field using a limited number of sampled data points. In kriging, the Variogram model has important for controlling kriging weights. In sample data, the gamma-values or semivariances for each pair of points are plotted against the distance between them. Mathematically variogram is defined as in EquationEquation (4)(4)
(4) :
(4)
(4)
where γ(h) is the semi-variance; N(h) the number of pairs separated by distance or lag h; Z(
) the measured sample at a point
and Z(
+ h) the measured sample at point (
+ h). The experimental variogram is the plot of observed values used to explore the spatial structure of the data. In contrast, the model that best fits the data is known as a theoretical or model variogram. In this study, Circular and Powered Exponential variograms were fitted to the experimental variogram.
2.5.1. Ordinary kriging
Ordinary kriging is the most frequently used method for predicting the study variable at unsampled locations. In Ordinary kriging, it is assumed that the study variable Z at the location is a stationary random function, which means that the mean of Z(
) is constant but unknown. However, it is a straightforward and extensively used approach for predicting the study variable, as it gives both prediction values and prediction errors.
In model-based Ordinary kriging, the distribution of response variable Z is assumed to be Gaussian as described in EquationEquation (5)(5)
(5)
(5)
(5)
µ is the mean, and is the covariance matrix which can be written as (see EquationEquation 6
(6)
(6) )
(6)
(6)
where R is a correlation matrix, and it depends on vector-valued parameter
that is,
= (
). Most of the kriging methods require normally distributed data. If the data is not normally distributed, then in order to normalize the response variable, we use the transformation technique (i.e. Box–Cox Transformation). The equation for Ordinary kriging can be written as;
(7)
(7)
In EquationEquation (7)(7)
(7) where
(j = 1, 2,…, n) are the weights, and the sum of weights should be equal to one, (i.e. EquationEquation 8
(8)
(8) )
(8)
(8)
The weights are derived using the Lagrange multipliers method
2.5.2. Universal kriging
Ordinary kriging assumes a constant mean for a real-valued random function Z(si), but the mean value varies across the entire region, and the variable is said to be non-stationary. The non-stationary regionalized variable will have two components; the mean value of a regionalized variable and the residual. Universal kriging (UK) is one of the most frequently used methods for spatial mapping data when there is a trend in the data and the dependent variable does not fulfill the criterion of weak stationary. Weak stationery can be described as the mean of the response variable is constant over the region, and the spatial dependence of any two data points in space is a function of the distance between them. In Universal kriging, the mean is a function of coordinates in linear, quadratic, or higher form. The model of Universal kriging can be written as;
(9)
(9)
where in EquationEquation (9)
(9)
(9) μ(s) is the mean, and
is the covariance matrix. In Universal kriging, the trend component μ(s) can be modeled as;
(10)
(10)
where in EquationEquation (10)
(10)
(10)
is the
coefficient,
is th function that describes the trend, and
represents the number of functions that are used to model the trend. The weights in Universal kriging is estimated in the same way as in Ordinary kriging.
is the covariance matrix that can be written as (see EquationEquation (11)
(11)
(11) );
(11)
(11)
where R is a correlation matrix, and it depends on vector-valued parameter
that is,
= (
). The values of the parameter are estimated using different methods of estimation, that is, Maximum likelihood Estimation (MLE), Restricted Maximum likelihood Estimation (REML), Ordinary Least Square (OLS) or Weighted Least Square (WLS).
3. Results and discussions
Water has significant importance for humans lives directly and indirectly. Water is plays a key role in agriculture, domestic, recreational, and industrial purposes. However, water gets several contaminants from agriculture and other anthropogenic activities and is a real warning to water quality. Currently water management strategies are not adequate to treat the contaminated water and water quality is still a severe issue in several countries of the world. Pakistan is a highly affected country due to the shortage of safe and healthy water sources. The current study examines the Lake and River water quality for agriculture and drinking. The current research mainly focused to the water quality, so, carried out through an integrated surface water quality index (SWQI) based on 18 hydrochemical parameters. SWQI considerably correlates with pH, EC, SO4, HCO3, and heavy metals. The descriptive statistics of physicochemical & heavy metals of water samples are provided in . Where all the parameters were measured in mg/L except for turbidity in NTU, PH in numbers and Ec in μS/cm.
Table 1. Descriptive statistics of Physicochemical & Heavy metals of observed samples.
3.1. Water quality index
In this study, WQI was calculated using physicochemical parameters and heavy metals, and the results of the WQI of the samples are presented in . The WQI values ranged from 0 to 150. The results revealed that the calculated values of WQI are categorized into five different categories: excellent water (WQI < 50), good water(WQI = 50–100), poor water (WQI = 101–150), very poor water (WQI = 151–200) and water unsuitable for drinking (WQI > 200). It can be observed that most water samples indicate good quality, as about 69.23% of samples lies in the “very good quality” category. Moreover, 30.77% of the total samples are of poor quality and are identified as unsuitable for drinking. The prediction maps revealed that in most areas, the water quality has not deteriorated to a higher level. However, in some areas, the WQI crossed the permissible limit, which indicates that in such regions, the water is not fit for drinking purposes, agricultural activities, fish farms, and so on.
Table 2. Categorization of water on the basis of WQI.
3.2. Prediction of WQI at unsampled locations
For Ordinary kriging, the study variable Z at location si is assumed to be a stationary random function, which means that the mean and variance of Z(si) are independent of locations. In contrast, in Universal kriging, there is a trend in the data, and the dependent variable Z(si) does not fulfill the criterion of weak stationary. In Universal kriging, the mean of Z(si) is a function of coordinates in linear, quadratic, or higher form. In both procedures, first, the empirical variograms are calculated from the observed data to check the spatial dependence in the data, and then the theoretical variograms are fitted to obtain the estimates of variogram’s parameters.
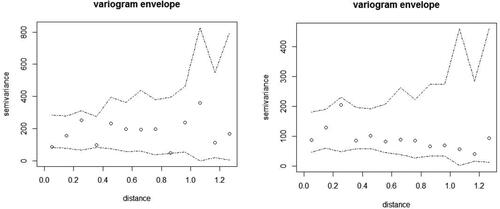
3.2.1. Variogram envelope
Before the spatial interpolation, a variogram envelope is used to check the spatial dependence in the data. Variogram envelopes can be constructed by using the maximum and minimum values of each bin. After constructing the variogram envelope, the points of the experimental variogram are plotted on it to check the spatial dependence. For example, in , the dashed lines are the minimum, and maximum bounds of the variogram model, whereas the dots plotted on the envelope represent the empirical variogram. Further, we can see the majority of the points of the variogram lie inside the envelope, so we conclude that spatial correlation exists among the observations.
Figure 2. Variogram envelope for WQI without Trend.
3.2.2. Parameter estimation of variogram model
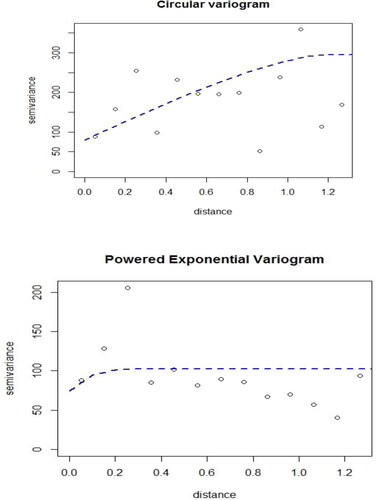
Kriging with parameters of experimental variogram does not give us appropriate predictions at unobserved locations, so different variogram models are fitted to the empirical variogram that characterizes the variation in a random process with changing lags and ensures favorable variances in the predictions. In this study, in Ordinary kriging (OK), the Circular variogram model is fitted to the experimental variogram, as in terms of root mean square error (RMSE), its performance is found better as compared to other variogram models. The parameters of fitted Circular variograms are estimated by using the Restricted Maximum Likelihood Method (REML) method, that is,, sill= 210.8 and range = 1.18. Whereas in Universal kriging (UK), the Powered Exponential variogram model’s performance is found better compared to other models. In the UK the parameters of powered exponential variogram estimated by the REML method are used as input parameters in kriging, that is,, sill= 27.8 and range = 0.085. shows the circular and powered exponential variogram models fitted to the experimental variogram for OK and UK.
Figure 3. Circular variogram fitted to emperical variogram for OK and powered exponential variogram fitted to empirical variogram for UK.
3.2.3. Prediction values maps
The two selected methods of interpolation, that is, OK and the UK, are used to interpolate WQI at unsampled locations and to generate contour maps for the study region. After predicting WQI at the unsampled location, the values are back-transformed to their original scale. The maps of predicted values of WQI and prediction error for different kriging techniques are given in shows the prediction map of WQI in the study area obtained by using Ordinary Kriging. Overall, the map can be observed as dominated by values indicating good water quality. The highest values of WQI are observed between the latitude of 28.5–29.0 and the longitude of 73–75, which means poor water quality. Another peak value of WQI can be seen between latitude 29.5–30.0 and longitude 70.6–70.8. Such regions contain water that should not be used directly for drinking purposes. In a few regions, the values of WQI indicate the good quality of water, which lies in latitudes 30.2–30.6 and longitude 70.5–70.8. But overall, the map suggests that the area is dominated by good water quality as the WQI lies below 100 in most of the region. Furthermore, in the prediction error map obtained from Ordinary kriging, the prediction error map shows that the highest error was recorded in the regions that lie between latitude 28.1–29.8 and longitude 69.8–70.2, whereas the minimum error was shown by the region having latitude 29.2–30 and longitude 70.6–71. The map shows that, on average, the error associated with different prediction points ranges from 25 to 35. presents the prediction map of WQI obtained by using Universal kriging (UK). A higher WQI has indicated poor water quality at a latitude of 29.2–29.6 and a longitude of 70.5–70.8. Overall, the map can be covered by lower WQI, then slightly higher WQI between latitude 28.2–29.6 and longitude 69.8–70.5. Overall, the map indicates a smooth trend of WQI along different longitudes and latitudes. In addition, the prediction error map obtained by the UK can show minimum errors in the latitude 29.5 and longitude 70.7; however, the prediction errors lie between 1 and 6. Moreover, the prediction performance of different techniques, that is, OK and the UK, were compared using the leave-one-out cross-validation (LOOCV) technique. shows OK and the UK with their corresponding root mean square prediction error (RMSPE). The results show that in terms of RMSPE Universal kriging (UK) performed better than Ordinary kriging (OK) while predicting WQI at unvisited locations. Furthermore, standard deviation maps shows that UK outperforms the OK in terms of prediction accuracy.
Figure 4. Prediction map of WQI by using OK and prediction error map of WQI by using OK.
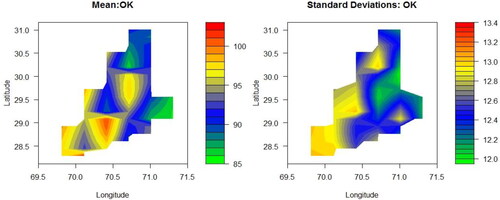
Figure 5. Prediction map of WQI by using UK and prediction error maps of WQI by using UK.
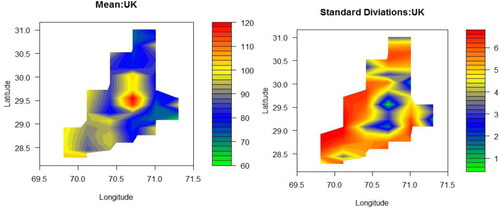
Table 3. Prediction techniques with their corresponding RMSPE.
4. Conclusion
The current research describes the water quality to the various Glacial Alpine Lakes, and Glacier fed Rivers such as River Swat and River Panjkora, Khyber Pakhtunkhwa, Pakistan. In order to determine the water quality in selected area the integrated surface water quality index (SWQI) is utilized that based on 18 hydrochemical parameters. SWQI considerably correlates with pH, EC, SO4, HCO3, and heavy metals. Thus, these parameters are used in the calculation of SWQI. Moreover, geostatistical interpolation methods, that is, Ordinary kriging and Universal kriging are used to interpolate the SWQI at unsampled locations, in order to understand the spatial distribution of the SWQI in the study area the prediction values maps are generated. The prediction maps revealed that in the majority of the areas, the water quality is not deteriorated to a higher level. However, in some areas the WQI has crossed the permissible limit, which indicates that in such regions, the water is not appropriate for drinking purpose, agricultural activities and fish farms etc. Cross-validation technique are used to evaluate and compare the performance of different proposed models (i.e. Ordinary kriging and Universal kriging). The results show that the predictive performance of universal kriging is greater than Ordinary kriging in terms of root mean square prediction error (RMSPE). The outcomes of the current research may provide the valuable reference and procedures for water resource and water quality management Pakistan. Moreover, due to the depth of these lakes, access to soil and sediments is not accessed in this research. However, in future the combination of Hdrogeochemical and Mineralogical analyses of these lakes can be analyzed to link the contamination sources of water.
Author contributions
All authors contributed equally.
Ethics statement
All procedures followed were in accordance with the ethical standards of the Helsinki Declaration of 1975, as revised in 2000.
Consent to participate
All authors are voluntarily agreed to participate in this research study.
Consent to publish
All authors agreed to publish; there is no legal constraint in publishing the data used in the manuscript.
Acknowledgments
The authors extend their appreciation to the Deanship of Scientific Research at King Khalid University for funding this work through Larg Groups. (Project under grant number (RGP.2/23/44). And this study is supported via funding from Prince Sattam bin Abdulaziz University project number (PSAU/2023/R/1444).
Disclosure statement
No potential conflict of interest was reported by the authors.
Data Availability statement and codes
The data and codes used for the preparation of the manuscript are available with the corresponding author and can be provided upon request.
References
- Ageta Y, Iwata S, Yabuki H, Naito N, Sakai A, Narama C. 2000. Expansion of glacier lakes in recent decades in the Bhutan Himalayas. In: Nakawo M, Raymond CF, Fountain A, editors. Debris-covered Glaciers, Proceedings of a Workshop, Seattle, Washington, USA. IAHS Publication; p. 165–175.
- Ahmadi SH, Sedghamiz A. 2007. Geostatistical analysis of spatial and temporal variations of groundwater level. Environ Monit Assess. 129(1-3):277–294.
- Alloway B, Ayres DC. 1997. Chemical principles of environmental pollution. London: Blackie Academic.
- Anju M, Banerjee D. 2012. Multivariate statistical analysis of heavy metals in soils of a Pb–Zn mining area, India. Environ Monit Assess. 184(7):4191–4206.
- APHA. 2007. WEF (2005) Standard methods for the examination of water and wastewater. National government publication, Washington, DC. https://www.worldcat.org.
- Arslan H. 2012. Spatial and temporal mapping of groundwater salinity using ordinary kriging and indicator kriging: the case of Bafra Plain, Turkey. Agric Water Manage. 113:57–63.
- Babiker IS, Mohamed MA, Hiyama T. 2007. Assessing groundwater quality using GIS. Water Resour Manage. 21(4):699–715.
- Battarbee RW, John Anderson N, Jeppesen ERIK, Leavitt PR. 2005. Combining palaeolimnological and limnological approaches in assessing lake ecosystem response to nutrient reduction. Freshwater Biol. 50(10):1772–1780.
- Baudo R, Tartari G, Vuillermoz E. 2007. Mountains witnesses of global changes. Amsterdam, Netherlands: Elsevier.
- Benn D, Wiseman S, Hands K. 2001. Growth and drainage of supraglacial lakes on debris-mantled Ngozumpa Glacier. J Glaciol. 47(159):626–638.
- Boudibi S, Sakaa B, Zapata-Sierra A. 2019. Groundwater quality assessment using GIS, ordinary kriging and WQI in an arid area. Ponte Int Sci Res J. 75:204–226.
- Bouguerne A, Boudoukha A, Benkhaled A, Mebarkia A-H. 2017. Assessment of surface water quality of Ain Zada dam (Algeria) using multivariate statistical techniques. Int J River Basin Manage. 15(2):133–143.
- Brown LE, Hannah DM, Milner AM. 2007. Vulnerability of alpine stream biodiversity to shrinking glaciers and snowpacks. Global Change Biol. 13(5):958–966.
- Delbari M, Pour Miremadisar A. 2010. The analysis of the spatial and time changes in salinity and depth of groundwater (Case study: Mazandaran province). J Irrigat Drain Iran. 3(4):359–374.
- Dindaroğlu T. 2014. The use of the GIS Kriging technique to determine the spatial changes of natural radionuclide concentrations in soil and forest cover. J Environ Health Sci Eng. 12(1):1–11.
- El Baba M, Kayastha P, Huysmans M, De Smedt F. 2020. Evaluation of the groundwater quality using the water quality index and geostatistical analysis in the Dier al-Balah Governorate, Gaza Strip, Palestine. Water 12(1):262.
- Gu YG, Li QS, Fang JH, He BY, Fu HB, Tong ZJ. 2014. Identification of heavy metal sources in the reclaimed farmland soils of the pearl river estuary in China using a multivariate geostatistical approach. Ecotoxicol Environ Safety. 105:7–12.
- Gyamfi C, Ndambuki JM, Diabene PY, Kifanyi GE, Githuku CR, Alexander A. 2016. Using GIS for spatial exploratory analysis of borehole data: a firsthand approach towards groundwater development. J Sci Tech. 36(1):38–48.
- Hooshm A, Delghandi M, Izadi A, Aali KA. 2011. Application of kriging and cokriging in spatial estimation of groundwater quality parameters. Afr J Agric Res. 6(14):3402–3408.
- Huang C, Chen Y, Zhang S, Wu J. 2018. Detecting, extracting, and monitoring surface water from space using optical sensors: a review. Rev Geophys. 56(2):333–360.
- Ibrahim S, Nafi’u S. 2017. Phytoplankton as indicators of water quality in Thomas Dam, Dambatta, Kano State, Nigeria. Dutse J Pure Appl Sci (DUJOPAS). 3(1):119–133.
- Iqbal J, Saleem M, Shah MH. 2016. Spatial distribution, environmental assessment and source identification of metals content in surface sediments of freshwater reservoir, Pakistan. Geochemistry 76(1):171–177.
- Iqbal J, Shah MH. 2013. Health risk assessment of metals in surface water from freshwater source lakes, Pakistan. Human Ecol Risk Assess Int J. 19(6):1530–1543.
- Kamenik C, Koinig KA, Schmidt R, Appleby PG, Dearing JA, Lami A, Thompson R, Psenner R. 2000. Eight hundred years of environmental changes in a high Alpine lake (Gossenköllesee, Tyrol) inferred from sediment records. J Limnol. 59(1s):43–52.
- Karlsson J, Jonsson A, Jansson M. 2005. Productivity of high‐latitude lakes: climate effect inferred from altitude gradient. Global Change Biol. 11(5):710–715.
- Kaufmann RB, Staes CJ, Matte TD. 2003. Deaths related to lead poisoning in the United States, 1979–1998. Environ Res. 91(2):78–84.
- Khan M, Ellahi A, Niaz R, Ghoneim ME, Tag-Eldin E, Rashid A. 2022. Water quality assessment of alpine glacial blue water lakes and glacial-fed rivers. Geomatics Nat Hazards Risk. 13(1):2597–2617.
- Khatri N, Tyagi S. 2015. Influences of natural and anthropogenic factors on surface and groundwater quality in rural and urban areas. Front Life Sci. 8(1):23–39.
- Kuniyal J, Jain A, Shannigrahi A. 1998. Public involvement in solid waste management in Himalayan trails in and around the Valley of Flowers, India. Resour Conserv Recycl. 24(3-4):299–322.
- Lami A, Guilizzoni P, Marchetto A, Bettinetti R, Smith D. 1998. Palaeolimnological evidence of environmental changes in some high altitude Himalayan lakes (Nepal). Mem Dell’Istit Ital Idrobiol. 57:131–130.
- Langård S, Andersen A, Gylseth B. 1980. Incidence of cancer among ferrochromium and ferrosilicon workers. Occup Environ Med. 37(2):114–120.
- Laurion I, Lami A, Sommaruga R. 2002. Distribution of mycosporine-like amino acids and photoprotective carotenoids among freshwater phytoplankton assemblages. Aquat Microb Ecol. 26(3):283–294.
- Lee J-J, Jang C-S, Wang S-W, Liu C-W. 2007. Evaluation of potential health risk of arsenic-affected groundwater using indicator kriging and dose response model. Sci Total Environ. 384(1-3):151–162.
- Nazeer S, Hashmi MZ, Malik RN. 2014. Heavy metals distribution, risk assessment and water quality characterization by water quality index of the River Soan, Pakistan. Ecol Indic. 43:262–270.
- Paudyal R, Kang S, Sharma CM, Tripathee L, Huang J, Rupakheti D, Sillanpää M. 2016. Major ions and trace elements of two selected rivers near Everest region, southern Himalayas, Nepal. Environ Earth Sci. 75(1):1–11.
- Peterside A, Hart A, Nwankwoala H. 2022. Assessment of groundwater quality using water quality index (WQI) Method in Southern Ijaw Local Government Area of Bayelsa State, Nigeria. World Sci News. 171:35–48.
- Pickering CM, Buckley RC. 2003. Swarming to the summit. Mt Res Dev. 23(3):230–233.
- Qasim M, Hubacek K, Termansen M, Khan A. 2011. Spatial and temporal dynamics of land use pattern in District Swat, Hindu Kush Himalayan Region of Pakistan. Appl Geogr. 31(2):820–828.
- Rashid A, Khattak SA, Ali L, Zaib M, Jehan S, Ayub M, Ullah S. 2019. Geochemical profile and source identification of surface and groundwater pollution of District Chitral, Northern Pakistan. Microchem J. 145:1058–1065.
- Raza A, Hussain I, Ali Z, Faisal M, Elashkar EE, Shoukry AM, Al‐Deek FF, Gani S. 2021. A seasonally blended and regionally integrated drought index using Bayesian network theory. Meteorol Appl. 28(3):e1992.
- Richardson SD, Reynolds JM. 2000. An overview of glacial hazards in the Himalayas. Quat Int. 65:31–47.
- Salerno F, Thakuri S, D’agata C, Smiraglia C, Manfredi E, Viviano G, Tartari G. 2012. Glacial lake distribution in the Mount Everest region: uncertainty of measurement and conditions of formation. Global Planet Change. 92:30–39.
- Salerno F, Gaetano V, Gianni T. 2018. Urbanization and climate change impacts on surface water quality: enhancing the resilience by reducing impervious surfaces. Water Res. 144:491–502.
- Sani HA, Ahmad MB, Hussein MZ, Ibrahim NA, Musa A, Saleh TA. 2017. Nanocomposite of ZnO with montmorillonite for removal of lead and copper ions from aqueous solutions. Process Safety and Environmental Protection. 109:97–105.
- Satterthwaite D, McGranahan G, Tacoli C. 2010. Urbanization and its implications for food and farming. Phil Trans R Soc B. 365(1554):2809–2820.
- Sommaruga R, Psenner R. 2001. High-mountain lakes and streams: indicators of a changing world. Arctic Antarctic Alpine Res. 33(4):383–384.
- Stafilov T, Šajn R, Boev B, Cvetković J, Mukaetov D, Andreevski M, Lepitkova S. 2010. Distribution of some elements in surface soil over the Kavadarci region, Republic of Macedonia. Environ Earth Sci. 61(7):1515–1530.
- Stenseth NC, Mysterud A, Ottersen G, Hurrell JW, Chan K-S, Lima M. 2002. Ecological effects of climate fluctuations. Science 297(5585):1292–1296.
- Stephenson PJ. 1993. The impacts of tourism on nature reserves in Madagascar: perinet, a case-study. Envir Conserv. 20(3):262–265.
- Usman UN, Toriman M, Juahir H, Abdullahi MG, Rabiu A, Isiyaka H. 2014. Assessment of groundwater quality using multivariate statistical techniques in Terengganu. Sci Technol. 4(3):42–49.
- Verma RK, Murthy S, Tiwary RK, Verma S. 2019. Development of simplified WQIs for assessment of spatial and temporal variations of surface water quality in upper Damodar river basin, Eastern India. Appl Water Sci. 9(1):1–15.
- Wali SU, Alias N, Bin Harun S. 2020a. Hydrogeochemical evaluation and mechanisms controlling groundwater in different geologic environments, Western Sokoto Basin, Northwestern Nigeria. SN Appl Sci. 2(11):1–28.
- Wali SU, Alias N, Harun SB. 2020b. Quality reassessment using water quality indices and hydrochemistry of groundwater from the Basement Complex section of Kaduna Basin, NW Nigeria. SN Appl Sci. 2(10):1–21.
- Wali SU, Alias N, Harun SB. 2021. Reevaluating the hydrochemistry of groundwater in basement complex aquifers of Kaduna Basin, NW Nigeria using multivariate statistical analysis. Environ Earth Sci. 80(5):1–25.
- Wali SU, Alias NB, Harun SB, Umar KJ, Gada MA, Dankani IM, Kaoje IU, Usman AA. 2022. Water quality indices and multivariate statistical analysis of urban groundwater in semi-arid sokoto basin, northwestern Nigeria. Groundwater Sustain Dev. 18:100779.
- Wrona FJ, Prowse TD, Reist JD, Hobbie JE, Lévesque LMJ, Vincent WF. 2006. Climate change effects on aquatic biota, ecosystem structure and function. AMBIO J Human Environ. 35(7):359–369.
- Wu B, Zhao DY, Jia HY, Zhang Y, Zhang XX, Cheng SP. 2009. Preliminary risk assessment of trace metal pollution in surface water from Yangtze River in Nanjing Section. Bull Environ Contam Toxicol. 82(4):405–409.
- Yang L, Linyu X, Shun L. 2009. Water quality analysis of the Songhua River Basin using multivariate techniques. J Water Resour Prot. 1(2):110–121.
- Zhou Z-M, Toriman M, Juahir H, Abdullahi MG, Rabiu A, Isiyaka H. 2011. Risk assessment of soil salinity by multiple-variable indicator kriging in the low plain around the Bohai Sea. Shuili Xuebao (J Hydra Eng). 42(10):1144–1151.
- Żukowska J, Biziuk M. 2008. Methodological evaluation of method for dietary heavy metal intake. J Food Sci. 73(2):R21–R29.