
 ?Mathematical formulae have been encoded as MathML and are displayed in this HTML version using MathJax in order to improve their display. Uncheck the box to turn MathJax off. This feature requires Javascript. Click on a formula to zoom.
Abstract
Landslides result in the devastation of property and loss of lives. This study assesses landslide susceptibility by employing geographic information systems (GIS) and machine learning techniques, that is, support vector machine (SVM) and artificial neural network (ANN), with the integration of advanced optimization techniques, that is, particle swarm optimization (PSO). The landslide-inducing factors considered in this study include fault density, lithology, road density, slope, elevation, flow direction, aspect, earthquake intensity, curvature, Normalized Difference Water Index (NDWI), waterways density, rainfall, and Normalized Difference Vegetation Index (NDVI). The resulting landslide susceptibility maps (LSMs) showed that the areas falling under the high and very high susceptibility class have higher rainfall levels, weak lithology, high NDWI, and flow direction. The accuracy assessment of the techniques showed that ANN with an Area Under the Curve (AUC) of 0.81 performed better than SVM with an AUC of 0.78 without the optimization. Similarly, the performance of ANN was also better than SVM using PSO. During the integrated modeling, the AUC of PSO-ANN was 0.87, whereas the AUC of PSO–SVM was 0.84. The accuracy assessment of the produced LSMs also showed a similar trend in terms of accuracy percentage as that of the models.
1. Introduction
Landslides are often considered to be one of the most destructive types of natural hazards. causing extensive destruction, including harm to natural resources, cause loss of life, and lead to the destruction of property (Mondini et al. Citation2021). Almost everywhere in the world, there are different types, frequencies, and intensities of landslides, such as rockfall and debris flow (Zhu et al. Citation2019; Abdo et al. Citation2022; Ghorbanzadeh et al. Citation2022). Primarily in the world’s hilly regions, they are acknowledged as the most dangerous natural hazards causing colossal destruction (Zhu et al. Citation2019; Abdo et al. Citation2022; Maqsoom et al. Citation2022). Landslide hazard losses are anticipated to escalate in the future due to increased urbanization, economic growth, and atypical occurrence of severe regional precipitation brought on by climate change (Saha et al. Citation2021; Jakob Citation2022; Li et al. Citation2022; Naceur et al. Citation2022). Furthermore, early mapping of landslides in the aftermath of heavy rains or severe earthquakes is critical for speedy reaction, delivery of humanitarian aid, and other disaster mitigation measures. (Piralilou et al. Citation2021; Jaafari et al. Citation2022; Pham et al. Citation2022). Therefore, it is vital to research and assesses this severe natural hazard in order to prevent and lessen its devastating effects through susceptibility modeling and offering susceptibility maps (Bai et al. Citation2021; Piralilou et al. Citation2021; Yuan et al. Citation2022).
The creation of accurate and precise landslide maps is crucial for effective risk assessment. Achieving high-quality landslide susceptibility models typically involves utilizing various geospatial factors that trigger landslides, including elevation, land use, aspect, geology, land cover, slope, and other relevant variables (Mallick et al. Citation2021). Numerous studies were conducted in the past to examine landslide risk using various methods, as evidenced in the existing literature. In 2022, Saleh Yousefi and colleagues conducted a study to evaluate the susceptibility of a 6682 km area to landslides. They utilized a two-step methodology that involved creating landslide susceptibility maps using (a) boosted regression trees, (b) random forest, (c) multivariate adaptive regression splines, and (d) multiple discriminant analysis. In addition, they applied the analytic hierarchy process (AHP) to determine the exposure of roads to landslides by assigning weights to four buffer zones (i.e., 0–50 m; 50–150 m; 150–300 m; and >300 m) based on their proximity to the road network (Yousefi et al. Citation2022a). In 2019, Ataollah Shirzadi and co-authors conducted a study to examine the impact of sample size and raster resolution on the accuracy of landslide susceptibility modeling and prediction of shallow landslides. They used the Information Gain Ratio technique to assess the usefulness of each conditioning factor, and they employed the Alternating Decision Tree, which is not commonly used in landslide modeling, to develop their models (Shirzadi et al. Citation2019). Moreover, numerous other studies have established the superiority of ANN and support vector machine (SVM; Dou et al. Citation2015; Pham et al. Citation2016; Chen et al. Citation2017a; Xi et al. Citation2019; Yu and Chen Citation2020; Gautam et al. Citation2021; Liu et al. Citation2021; Maqsoom et al. Citation2022; Aslam et al. Citation2022c) when used individually or when integrated with other techniques.
For instance, Pham et al. (Citation2016) measured the effectiveness of five ML methods for assessing the susceptibility of landslides in Uttarakhand, India: Fisher’s Linear Discriminant Analysis (FLDA), LGR, Bayesian Network, NB, and SVM. They found that in comparison with the other methods, SVM performed better. For the landslide susceptibility mapping of the Indrawati watershed in Nepal, Gautam et al. (Citation2021) employed four ML techniques: LGR, ANN, SVM, and frequency ratio. They discovered that ANN outperforms all of the other techniques. Also, Aslam et al. (Citation2021) adopted a methodology involving the integration of conventional ML techniques, namely support vector machine (SVM), random forest (RF), and logistic regression (LGR), with the DL technique of convolution neural network (CNN) for landslide susceptibility mapping. For feature extraction and modeling during the integration phase, CNN and ML techniques were used, respectively. The outcomes demonstrated that SVM outperformed other models when used exclusively for modeling. Also, when integrated with CNN, SVM showed significant improvement, followed by LGR and RF. To further explore the performance of various techniques, Aslam et al. (Citation2022a) compared different conventional and unconventional ML techniques, including Linear Discriminant Analysis, Naïve Bayes (NB), Quadratic Discriminant Analysis, RF, Multivariate Adaptive Regression Spline, Artificial Neural Network (ANN) for the same objective. The authors observed that the ANN outperformed the other techniques. Furthermore, witnessing the performance of ANN in Aslam et al. (Citation2022a) and CNN in Aslam et al. (Citation2021), Aslam et al. (Citation2022b) compared multiple neural networks, including different CNN architectures and residual network (ResNet), and found that ResNet outperformed others. From these previously conducted studies, it can be concluded that among the conventional ML techniques, ANN and SVM were the best in terms of their performance and that the model integration enhances the predictions.
In general, researchers have employed different methodologies to generate final landslide susceptibility models. These methodologies include physical-based, heuristic, and statistical approaches (Huang et al. Citation2017; He et al. Citation2019). The physical-based approach involves the use of physical principles and equations to predict the probability of landslides. These methods require detailed topographical data and are best suited for small areas (Huang et al. Citation2017). Heuristic approaches, on the other hand, rely on expert knowledge and judgment to identify areas that are prone to landslides based on past experiences and observations, making them somewhat subjective and potentially biased. As a result, they often produce moderately accurate results (He et al. Citation2019). Statistical methods use quantitative analysis of data to identify the key factors that contribute to landslide susceptibility, but they require normally distributed triggering factors, which can be difficult to obtain (He et al. Citation2019). In contrast, machine learning algorithms have gained popularity due to advancements in remote sensing databases and algorithm development (Maqsoom et al. Citation2022) and some examples of commonly used algorithms are ANN, SVM, RF, and decision tree (Tien Bui et al. Citation2018; Achour and Pourghasemi Citation2020; Pandey et al. Citation2020). However, these algorithms have their limitations, including the potential for local optimum, over-fitting, and slow training speed (Hussain et al. Citation2022).
To address the limitations of traditional machine learning algorithms and generate high-quality landslide susceptibility maps, researchers have developed and utilized ensemble machine learning algorithms. These algorithms have demonstrated superior performance in generating landslide susceptibility maps, including naive Bayes, AdaBoost, random subspace, ANFIS, Rotation forest, Reptree, and bagging (Park et al. Citation2019; Chen et al. Citation2021b). The success of these algorithms has inspired scholars to produce and test new ensemble machine-learning models for generating even more precise landslide susceptibility maps. However, there is no consensus on the optimal approach for landslide susceptibility modeling, researchers suggest continued development and testing of new models in order to achieve the highest possible accuracy (Talukdar et al. Citation2020; Islam et al. Citation2021).
It has been noted that many ensemble machine-learning algorithms suffer from over-fitting (Talukdar et al. Citation2020). Eshtay et al. (Citation2018) reported that the weights of the input layers in some ensemble machine learning algorithms are randomly produced and not optimized during the training phase, leading to unstable performance and the potential for overfitting. To address this issue, they proposed the use of metaheuristic optimization algorithms, such as particle swarm optimization (PSO), to search for the best parameters and optimize the weights of the input layer. Xi et al. (Citation2019) in their study evaluated the effectiveness of particle swarm optimization (PSO), a cutting-edge optimization technique, in improving the effectiveness of ANN in simulating the seismic landslides in China’s Ludian districts. Results from the PSO algorithm showed that the performance of ANN experienced a significant increase. Similarly, in the study of Zhao and Zhao (Citation2021), SVM and PSO were combined, and the use of grid and slope units was examined in order to evaluate the methodologies for creating LSMs in Luoyang County, China. The outcomes demonstrated that PSO–SVM with slope units outperformed in terms of landslide susceptibility mapping in contrast to the same model with grid units and the individual SVM model with both units. In these previously mentioned two studies, the performance of SVM and ANN was improved after the optimization with PSO, which shows the efficacy of PSO. Therefore from the literature above, it is deduced that ML techniques, when optimized with PSO, provide more accurate results.
The district of Muzaffarabad is the capital of the state of Azad Jammu and Kashmir (AJK), which is an earthquake-prone region owing to its topographical settings. Previously, rainfalls and earthquakes are established majorly as the sources of activation of landslides in the region (Owen et al. Citation2008). The region has been exposed to frequent earthquakes of various degrees (Rossetto and Peiris Citation2009). An example of an extremely devastating earthquake event is the 2005 Kashmir earthquake. The earthquake brought havoc not only to Muzaffarabad city, which was the epicentre but also to its surrounding areas and disrupted several slopes prompting 158 landslides (Kamp et al. Citation2008; Khan et al. Citation2011). There are limited studies concerning the mapping of landslides in this region. To the best of our knowledge, the majority of these investigations only utilized conventional statistical and machine learning (ML) techniques. For example, Kamp et al. (Citation2008) used the GIS-based multi-criteria evaluation method in their study for plotting landslide susceptibility in Kashmir during the earthquake of 2005 with the help of eight exploited landslide-inducing factors. Other studies that investigated the assessment of landslide dangers influencing the same area included Owen et al. (Citation2008), Saba et al. (Citation2010), Khattak et al. (Citation2010), Riaz et al. (Citation2018), Batool et al. (Citation2021), Hussain et al. (Citation2022), Ahmad et al. (Citation2022) and were limited to conventional techniques. Therefore, the combination of machine learning techniques optimized with metaheuristic optimization algorithms such as PSO can provide reliable and better results for landslide susceptibility mapping in the Muzafarabad region, which can ultimately aid in risk assessment and better disaster risk management of the region.
The objective of this study is to conduct the landslide susceptibility investigation of the Muzaffarabad region using state-of-the-art ML techniques and an optimization technique. The used optimization technique is PSO, and ML techniques are SVM and ANN. The latest landslide inventory and a database of landslide-inducing factors were exploited to establish the models and ultimately generate the study area’s landslide susceptibility maps (LSMs). Moreover, as established previously that the techniques involving integrated models perform better than the individual model. This study aims to assess if the integration of PSO and ML techniques fosters better results. Thus, the purpose of using the two ML techniques is to evaluate their effectiveness independently and in the case of integration with PSO. This study used 13 landslide-inducing factors derived from the latest available data for the specified objective stated above.
2. Study area
Geographically speaking, Muzaffarabad region lies in northern Pakistan’s lower Himalayas, in the AJK region. The Muzaffarabad region is tectonically uplifted and dissected by the Main Boundary Thrust (MBT) and Bagh-Balakot faults (known for crustal deformation) (Kazmi and Jan Citation1997; Saba et al. Citation2010). The NW Himalayan Syntaxis, where crustal-scale north-leaning fold makeups are overlain over EW local thrusts, is where Northern Pakistan is located. Among these significant north-swerving folds is the Hazara-Kashmir Syntaxis, where significant regional thrusts are folded over Syntaxis’ northern extremity. The MBT and the Panjal Thrust are somewhat amalgamated as they loop around the Syntaxis. The Muzaffarabad Thrust, a third fault that borders the Kashmir-Himalaya at its southwest corner and extends diagonally over the Hazara-Kashmir Syntaxis’ central region before merging with the MBT-Panjal Thrust at the Syntaxis’ western edge (Baig Citation2006). A 75 km stretch of this fault was ruptured by the 2005 Kashmir earthquake, running from Balakot in the northwest through Muzaffarabad to Bagh in the southeast. (Avouac et al. Citation2006).
The district is located on a very high and steep hilly terrain above the Neelum as well as the Jhelum river. The considered area is eminent for the earthquake having a magnitude of 7.5 in 2005, causing more than 80 thousand deaths (Avouac et al. Citation2006; Rai and Murty Citation2006). Muzaffarabad is the capital of AJK and has an area of 20,665 m2. It is located with the geographical coordinates of 34°21′30″N and 73°28′20″E. The city of Muzaffarabad suffered the most due to the devastating Kashmir 2005 earthquake (Rai and Murty Citation2006).
The climate of the region varies greatly. December to February are cold months with snowfall on high mountain peaks. Snowmelt occurs in June, July, and August because of the greater warmth of these months. In the winter, the typical maximum weather is 16 °C and a minimum of 3 °C, while in summer, the temperature ranges from 35 to 23 °C. The annual high temperature recorded is 22.3 °C, and the low temperature is 11.1 °C. The area receives the highest rainfall for the monsoon spell between June to September every year and receives 1242.8 mm of average annual rainfall. The wettest month, July, receives an average precipitation of 328.7 mm, followed by August, which receives an average of 229.9 mm. From October to December, there is a slight rainfall, with the lowermost average of 37.2 mm observed in November.
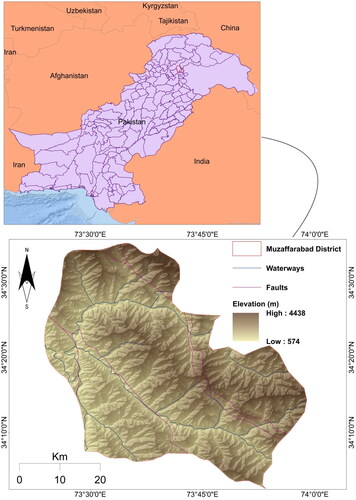
The lithologies found in the region date back to the Precambrian age (Hussain et al. Citation2009). The fundamental lithologies are largely sedimentary or meta-sedimentary, containing schist, slate, shale, siltstone, sandstone, and limestone (Baig Citation2006; Hussain et al. Citation2009). These lithologies have been fractured and joined by a number of faults (such as the MBT and Panjal faults) and fold structures (such as the Hazara-Kashmir syntaxis), further weakening their stability. The rugged terrain characterized by steep slopes, deeply incised valleys, and high-relief mountains has exacerbated these precarious geological states (Kamp et al. Citation2008; Owen et al. Citation2008; Khan et al. Citation2019). The study area map is shown in .
Figure 1. Map of Pakistan with the study area highlighted in red and map showing the elevation, fault lines, and waterways of the studied area.
3. Materials and methods
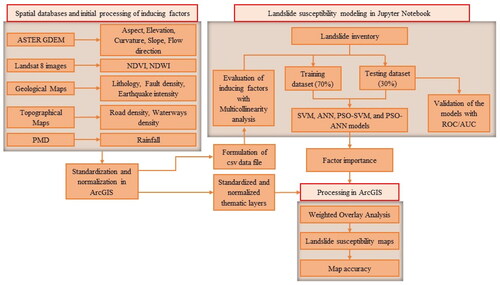
As identified previously, the primary objective of this work is to check the applicability and performance of SVM and ANN for evaluating the landslide susceptibility individually and when integrated with PSO. For this, 13 landslide conditioning parameters were selected as the input data along with landslide inventory. A detailed outline of the approach is given in , and the different steps involved are as follows:
Figure 2. Methodological flowchart of the study showing all the important steps and sequence of the work.
3.1. Landslide inventory and training and testing datasets
The first step in the research was to create the spatial distribution of landslide locations. A widespread assumption is that past, and present landslides are the basis for all landslide prediction studies (Van Den Eeckhaut et al. Citation2006; Capitani et al. Citation2013). In other words, a specific set of conditioning elements determines slope failures, and future slope failures are predicted to occur under similar conditions. Consequently, accurate recognition of the landslide locations is substantial for the probabilistic investigation of landslide susceptibility (Pradhan et al. Citation2009; Pradhan Citation2010; Choi et al. Citation2012; Umar et al. Citation2014).
In the current study, the past landslide locations were marked using the official historical records and Landsat satellite images, which are available freely. The procedure of change vector analysis for change detection, as explained in Aslam et al. (Citation2022c), was adopted to prepare the inventory. In order to determine the landslide distribution in the region, a landslide inventory map was created. Both landslides, as well as non-landslide locations, were exploited for applying machine learning (ML) techniques, which is normal practice (Ballabio and Sterlacchini Citation2012; Chen et al. Citation2017a). Previous 606 landslide locations (the center points) were identified for the inventory and were labeled as ‘1’. While other 606 non-landslide randomly selected center points were labeled as ‘0’. In total, 1212 landslide points were used in the study. Furthermore, 1212 points of landslide inventory were split into 2/3 and 1/3 ratios for testing and training the datasets. Thus, 67% of the data were randomly labeled as a training dataset, and the rest of the 33% data was nominated as testing data.
3.2. Database of landslide-inducing factors
Although mapping of landslide susceptibility is still the center of attention of the research community, there are no agreed procedures for the assortment of landslide-inducing factors (Bui et al. Citation2016). However, it has been established by several researchers (Saha et al. Citation2005; Owen et al. Citation2008; Khattak et al. Citation2010; Saba et al. Citation2010; Pourghasemi et al. Citation2012; Kanwal et al. Citation2017; Ali et al. Citation2019; Rahman et al. Citation2022) that landslides tend to occur where few conditions such as elevated mountains with steeper slopes, high rainfall concentration, and seismicity are substantially found. Therefore, the choice of landslide-inducing factors in this study was based on the previously conducted research and according to the topography of the considered area. In total, 13 inducing factors, namely aspect, slope, elevation, curvature, lithology, flow direction, fault density, road density, rainfall, earthquake intensity, waterways density, Normalized Difference Water Index (NDWI), and Normalized Difference Vegetation Index (NDVI) were considered for the landslide susceptibility investigation.
The current study used the ASTER GDEM and Landsat-8 images with 30 m × 30 m resolution. These data sources are open-access, and data can be downloaded for free. The five geomorphometric factors, elevation, aspect, slope, curvature, and flow direction, were extracted using DEM. NDVI and NDWI were taken out from Landsat 8 images acquired very recently. The infrared (IR) and red (R) bands were used to get the NDVI by exploiting the following relation (Hong et al. Citation2016; Chen et al. Citation2018; Yousefi et al. Citation2022b) in the raster calculator of ArcGIS:
(1)
(1)
Similar to NDVI, the NDWI was also obtained through the raster calculator of ArcGIS but by using green (G) and near-infrared (NIR). The following relation (Du et al. Citation2016) was used:
(2)
(2)
The geological maps of Pakistan were used for digitizing the layers like faults, earthquake intensity, and lithology at a scale of 1:2,000,000. The thematic layers of roads and waterways were digitized from the topographic maps of Pakistan. For the polyline features such as faults, roads, and waterways, the line density was used to calculate density in ArcGIS. The formulation of the rainfall layer was done by the station data from Pakistan Meteorological Department. The average monthly data for the last 21 years was used. The average yearly rainfall was calculated through the below-stated formula using the available data source (Arnoldus Citation1980):
(3)
(3)
where pi denotes the average rainfall of a month while p denotes the average yearly rainfall.
Finally, all the thematic layers were standardized and normalized for further processing. For standardization, all three vector layers of landslide conditioning factors, including point, polygon, and polyline with distinct resolutions, were transformed with a resolution of 30 m * 30 m into a raster format. Afterwards, the Natural breaks (Jenks) classification technique was initially used to classify the thematic layers of all the factors into five classes. Subsequently, for the normalization, all factors were further reclassified into five categories (where 1 stand for very low susceptibility; 2 stands for low susceptibility; 3 stands for medium susceptibility; 4 stands for high susceptibility, and 5 stands for very high susceptibility) dependent on the potential of inducing landslide susceptibility.
3.3. Methods
The SVM and ANN models were trained using the training dataset. First, the models were operated without any enhancement. Afterwards, the models were integrated with PSO to enhance their functionality. During the training, the models examined the factors, such as hydrological, topographical, lithological, etc., against the landslide and non-landslide points. Then the trained model’s performance was evaluated on the basis of the testing data set. Jupyter Notebook was used for the implementation of the techniques used. The 10-fold cross-validation process was adopted in order to reduce inconsistency and eliminate over-fitting. The models were fine-tuned to enhance their accuracy and performance.
As a result, this process assisted in advising the importance of individual factors. The final LSMs were then prepared in ArcGIS utilizing the weighted overlay analysis, together with the thematic layers of the factors. Afterwards, LSMs were prepared and were classified into five categories of susceptibility including very high; high; moderate; low; and very low; using the Natural breaks (Jenks) classification technique.
3.3.1. Multicollinearity analysis
The correlation between considered landslide-inducing factors was assessed by multicollinearity analysis. This statistical analysis highlights the strong correlation among two or more variables in a multiple regression model (O’brien Citation2007). The variance inflation factor (VIF) and tolerance (TOL) were assessed to identify multicollinearity among the causative components. The TOL value is the reciprocal of the VIF value. The equation expressed below was used to calculate the VIF value:
(4)
(4)
To understand the above equation, assume that X = {X1, X2, …, XN} represents the independent variables set, and the coefficient of determination is represented by All the other variables in the regression model are regressed through the jth independent variable Xj. The value of tolerance (TOL) indicates the correlation intensity amongst the independent variables. A variable with a VIF value of greater than 10 and TOL value of less than 0.1 exhibits multicollinearity and should be eliminated (Wang et al. Citation2019; Aslam et al. Citation2022b).
3.3.2. Swarm optimization (PSO)
PSO was proposed for the first time by Eberhart and Kennedy (Citation1995). It is a vigorous evolutionary algorithm that possesses a superior learning rate and requires less memory. These aspects demonstrate the extraordinary brilliance of the PSO, contrasted with other optimization algorithms. Through the implementation of PSO, pbest, which represents the most convenient personal, and gbest shows the best global positions, are discovered by the particle activity. The following equation formulates the position of particles:
(5)
(5)
And the velocity of the particles is given by the subsequent equation:
(6)
(6)
where, X1, X2, indicates the current and new position, V1 indicates the current and V2 indicates new velocity of each particle.
signifies the inertia weight. Moreover, C1 and C2 represent two constant and positive acceleration rates that are chosen by the user. Furthermore, the terms r1 and r2 signify arbitrary values, which can be specified by the form of (0,1).
3.3.3. Support vector machine (SVM)
The most popular ML approach and most effective classifier used for supervised learning are the SVM, which was initially proposed by Vapnik (Citation1999). The simple concept of SVM is based on the statistical learning theory (Cortes and Vapnik Citation1995). The advantage of using high dimensional and linearly non-separable datasets is why SVM is used widely in diverse classifications and regression problems (Mountrakis et al. Citation2011; Kavzoglu et al. Citation2014) comprising the landslide susceptibility prediction based on a set of input data (Gleason and Im Citation2012).
SVM defines the margin of the hyperplane by using support vectors. Centered on the statistical methodology, SVM can distinguish the optimum hyperplane for differentiating two classes (Kavzoglu et al. Citation2014; Pham et al. Citation2016). Suppose that the vector of landslide conditioning factors is X = x1, x2, …, xn, and the vector of classified variables (non-landslide and landslide) is represented by Y. The optimum distinguishing hyperplane can be established by resolving the subsequent classification function:
(7)
(7)
where,
is constant, c signifies the offset from the origin of the hyperplane, n represents the total number of conditioning factors and
is the kernel function. In the present study, the kernel function used is the Gaussian Radial basis function. Aimed at a binary classification problem such as the present problem of landslide involving non-landslide and landslide points, the constraint condition for solving the equation is:
(8)
(8)
where
if Y = +1 and
if Y = −1. In the above condition, W is the weighting factor, and h(X) structures a non-linear function that separates the input space from high-dimension spaces.
3.3.4. Artificial neural network (ANN)
Modern times have observed the usage of computational intelligence, particularly ANN, for resolving numerous problems. ANN is encouraged by the human neural network and is trained to ascertain the non-linear comparisons amongst a set of input–output data (Wang Citation2003). Compared with statistical techniques, the extraordinary benefit of ANN is its implementation efficiency. To put it in another way, the numerical data is not required to be categorized for use in ANN. Multilayer perceptron (MLP) is the most commonly used and robust type of ANN. MLP is highly pertinent in modeling functional relations (Günther and Fritsch Citation2010).
MLP is based on three layers, specifically the input, hidden, and output layers, including the computational nodes. The working of MLP is represented in graphical form in . In general, MLP establishes the influence of every landslide conditioning factor by allocating weights and biases. In the input layer, let X be the input parameter. In the hidden layer, the weight (W) is multiplied by the input parameter, and then the bias (b) is added. In the end, in the output layer, an activation function (f(x)) is employed to the gained value to generate the local output. Mathematically, the following equation supports the representation of MLP:
(9)
(9)
Figure 3. The general structure showing different kinds of layers and learning mechanism of ANN as an MLP.
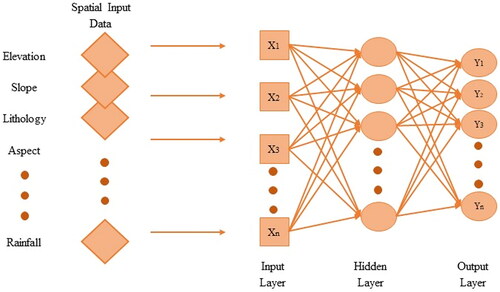
In the present study, the chosen (f(x)) is the Tan-sigmoid (Tansig) activation function because of its solid performance in preceding analyses (Seyedashraf et al. Citation2018; Xi et al. Citation2019). This relation is expressed in the following equation:
(10)
(10)
3.4. Model evaluation
To assess the performance of the suggested model framework, measurements of the Receiver Operating Characteristic (ROC) curve were used. The ROC curve is a typical method for the assessment of the performance of prediction techniques adopted by Bradley (Citation1997). It is generated by mapping the true positive (true prediction made by the model) rate against the false positive (false prediction made by the model) rate at several threshold values. In statistics, the true positive and false positive rates are also mentioned as sensitivity and 100-specificity. Additionally, the Area under the Curve (AUC) measure has been utilized broadly to quantitatively assess the performance of various techniques in the context of landslide susceptibility mapping (Tsangaratos and Ilia Citation2016; Pham et al. Citation2017; Chen et al. Citation2017b, Citation2017c; Qi et al. Citation2021). In particular, a prediction approach is believed to be excellent if the AUC value is near 1 (Tsangaratos and Ilia Citation2016; Zhu et al. Citation2018).
4. Results
4.1. Outcomes of multicollinearity analysis
describes the outcomes of the multicollinearity analysis of landslide-inducing factors. None of the factors was removed from the further analysis as it was found that none of the variables had a VIF value greater than 10, the threshold value. Therefore, there is no need to remove any of the factors from further analysis.
Table 1. Multicollinearity analysis of landslide inducing factors.
4.2. Thematic layers of inducing factors
The aspect of the study area was found to have 9 orientations: Flat, West, Northwest, North, Northeast, East, Southeast, South, and Southwest. A substantial portion of the area has Northern and Southward orientations, as can be seen from . It is primarily the elevated mountain slopes of the area that are directed toward the North and South sides. Moreover, the elevation in the area varies from 574 to 4438 m. It can be observed from that the Northeast side has a high elevation while the southwest side has a lower elevation.
Figure 4. Thematic layers of landslide inducing factors used in this study: aspect (a), elevation (b), curvature (c), slope (d), flow direction (e), earthquake intensity (f), NDWI (g), NDVI (h), rainfall (i), lithology (j), waterways density (k), roads density (l), fault density (m). The layers are overlaid on hillshade using 30% transparency.
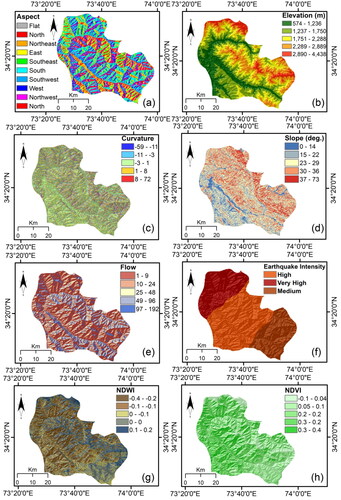
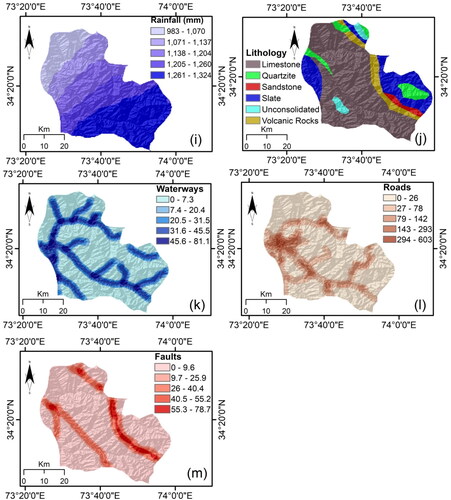
The curvature map of the considered area represented in illustrates the geomorphological characteristic of the area by offering information about the divergent/convergent or accelerated/decelerated character of the flow. The positive values show the concave/divergent surfaces, and the negative values reflect the convex/convergent character of the surface of the study area. The convexity/convergence (accelerated flow) or concavity/divergence (decelerated flow) of the surface greatly influences the moisture-holding capacity of the soil.
The angles of the slopes in the area show that the area is dominated by steeper slopes which usually have a greater chance of sliding than mild slopes. The steeper slopes are mostly centered on the Southeastern part of the area, which also has a higher elevation than the rest of the area, as can be perceived from . Furthermore, the flow direction map represented in shows that the flow is from North to South, which is typical in mountainous regions. There is more cutting of slopes on the way to Southward flow, therefore, resulting in higher landslide susceptibility.
Since the considered area has experienced large-magnitude earthquakes, the earthquake intensity is comparatively high in this area. The Northern portion of the selected area has high seismicity and thus has high susceptibility. The Southern portion has relatively moderate seismicity, as evident from . Moreover, higher soil moisture is much more responsible for destabilizing the slopes as compared to less moisture soil. Thus, the NDWI is crucial. Most of the regions having high NDWI are on the Northeast and Southeast side, as can be seen in . The possible reason for high NDWI on these sides can be the snow on elevated mountains. However, some central regions also have high NDWI, which is basically due to the tributaries and rivers in the area.
In contrast to the NDWI, the high NDVI is primarily centered in the Northwest and Southwest direction, which is the low-lying area. Overall, the NDVI for most of the area is high, as can be seen in . The area’s high NDVI concentration is compatible with the dense vegetation seen in the hilly areas.
Higher vegetation cover on slopes leads to a reduction in slope failure and soil erosion. Contrary to this, no vegetation enhances the chances of failure as the surface is open. This was applied to the re-classification procedure of NDVI. Moreover, (rainfall map) shows that the rainfall in the studied area varies between 983 and 1324 mm and increases gradually from North to South. Normally, as compared to the lower level of rainfall, a higher level of rainfall has more potential to trigger landslides.
The study area is composed of diverse lithology. Limestone covers the larger part of the area, as shown in . Other protruding lithologies are slate, volcanic rock, and quartzite. Examples of weak lithologies are limestone and slate, which cover most of the area. The waterways in the area cover almost all of the area. Several small tributaries drain into the main river, which runs from North to South, as seen in . Normally, the areas nearer to the waterways possess higher landslide susceptibility because of the cutting of slopes and moisture. At the same time, with the increase in distance, susceptibility decreases.
The road network in the area is mainly centered in areas with low elevation and less steep slopes, as can be observed from . In mountainous areas like the one selected for the study purpose, usually, the slopes are unstable because of the cutting of toes of the slopes for the construction of the roads. Therefore, similar to waterways, susceptibility decreases with the increase in remoteness from the roads, whereas the areas closer to the roads are more prone to landslides. Additionally, as already shown in the earthquake intensity map, the region has high seismicity because two important fault lines traverse the region. These faults run from North to South along the East and West margins, as shown in . Like waterways and roads, the areas closer to the faults have a greater landslide susceptibility, while the susceptibility decreases with the increase in remoteness from the faults.
4.3. The relative importance of inducing factors
From , it can be observed that the significance of landslide-inducing factors is the same for all the models, with slight differences. It is also important to note that the influence of the similar controlling element varies in accordance with the distinct models. Some of the landslide-inducing factors, NDWI, flow direction, lithology, rainfall, elevation, and slope, have a higher effect on the models, whereas the remaining factors cause less effect.
Table 2. Obtained relative importance of landslide inducing factors from different models.
4.4. Landslide susceptibility maps (LSMs)
After applying the SVM model, the resulting landslide susceptibility map () shows that 23% of the area has low and 3.9% of the area has very low susceptibility. These regions are primarily situated on the Northeast and Southeast sides of the district. The area falling under the moderate susceptibility class covers 43.1%, and 23.32% of the total area has high susceptibility, as listed in . At the same time, 6.75% of the total area represents very high susceptibility and is mainly found in the West and Southwest of the district. The resulting landslide susceptibility map from the ANN model ( and ) portrays that 3.2% of the area lies in the very low susceptibility class, and 23.9% of the area is covered by the low susceptibility class. However, moderate susceptibility covers an area of 42.1%.
Figure 5. Formulated landslide susceptibility maps using SVM (a), ANN (b), SVM-PSO (c), and ANN-PSO (d) models.
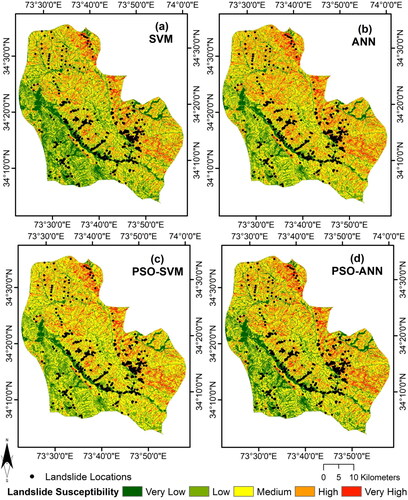
Table 3. Area division of landslide susceptibility types generated from different models.
Furthermore, 23.6% of the total area comes under the high, and the very high susceptibility class covers 7.2% of the total area. These regions are primarily positioned in the West and Southwest of the district, just like the dissemination in the LSM by SVM. The produced LSMs have very comparable distributions and proportions of respective susceptibility classes for both SVM and ANN models. Additionally, the LSM produced as a result of the integrated modeling of PSO–SVM shows that an area of 6.8% falls under the very high moderate susceptibility class ( and ), which is slightly lower than the results of ANN but is similar to the results of SVM. Furthermore, PSO–SVM based LSM shows a very comparable trend to SVMM and ANN for the rest of the susceptibility classes.
Interestingly, the LSM produced after the integrated modeling through PSO–ANN shows that 6.8% of the area has high susceptibility ( and ), which is slightly lower than the results of the ANN model but is the same as the results of the SVM, and PSO–SVM models. The percentage of area for other susceptibility classes is again very similar to the rest of LSMs. For all of the LSMs, the areas having high and very high susceptibility are generally located towards the West and Southwest of the district. This is considering the variation of inducing factors and their importance. It can be observed that the West and Southwest of the district are low elevated, has lower slope angles, higher flow direction, higher NDWI, relatively high rainfall intensity, and limestone as the lithological unit. Moreover, in accordance with the results, the area falling under different susceptibility classes is also very similar.
4.5. Accuracy assessment
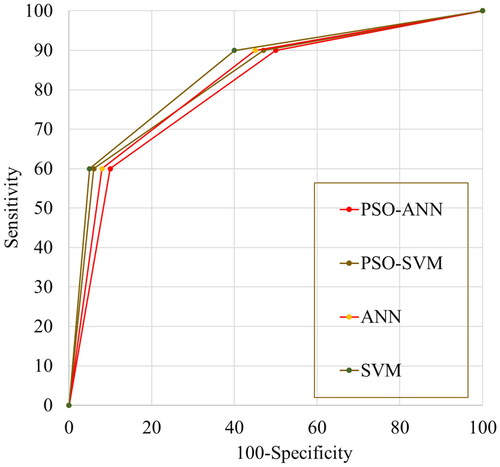
The accuracy assessment results are depicted in . The ANN model with 0.81 AUC outperformed the SVM model having an AUC of 0.78 when used for modeling without the optimization. Moreover, a similar trend of model performances was observed with the optimization, with the only difference that the accuracies were enhanced. When integrated with PSO, the ANN model obtained an AUC of 0.87, whereas the AUC of the SVM model during the integration with PSO stood at 0.84.
Figure 6. The ROC curves of the used models obtained for the testing dataset.
5. Discussion
In this work, the Muzaffarabad district’s landslide susceptibility was mapped using an integrated technique, which produced the landslide susceptibility maps (LSMs). The approach involves a well-known optimization technique: PSO, and two state-of-the-art Machine Learning techniques: SVM and ANN.
A precise landslide inventory map is required as a key step for performing such modeling and accurate analysis. Satellite imageries are the most reliable data source for detecting landslides and preparing inventory maps (Đurić et al. Citation2017; Ghorbanzadeh et al. Citation2022). The imageries from Landsat are also used to prepare a landslide inventory map in this study. Moreover, selecting inducing factors is critical in landslide susceptibility mapping (Hong et al. Citation2018; Shu et al. Citation2021; Li et al. Citation2022). There is not a single method that is universally acknowledged for choosing the components that cause landslides, although most of them are based on the area’s geographical characteristics and landslide literature. On the basis of previous literature and topographical and geographical settings of the region, 13 landslide-inducing factors were chosen for plotting the landslide susceptibility (Saha et al. Citation2005; Owen et al. Citation2008; Khattak et al. Citation2010; Saba et al. Citation2010; Pourghasemi et al. Citation2012; Kanwal et al. Citation2017; Ali et al. Citation2019).
Afterwards, the considered factors were attained from relevant data sources and used along with the landslide inventory for further analysis. As multiple landslide-inducing factors were used in this study, the correlation between them was assessed utilizing the multicollinearity analysis. The outcomes of the analysis showed no collinearity among the considered factors ().
The data were divided into testing and training data with a proportion of 67 and 33%, respectively. The training data was used to construct the models with 10-fold cross-validation, and testing data was used to check the functionality of the trained models. The models’ processing resulted in advising weights for the inducing factors. Finally, the LSMs were produced in ArcGIS using the weights of the conditioning factors found from the models.
According to the produced LSMs, the high and very high susceptibility classes are centered in the West and Southwest of the district (). These regions have lower elevations, less steep slopes, higher rainfall volumes, NDWI, and flow direction. Even though normally, the regions with higher elevation tend to have more susceptibility, as established in previous studies, the results of this study, however, show that the regions having relatively low elevation than the rest of the area have higher susceptibility (). The possible reason behind this is that the low elevated regions are the floodplains of the main river in the area, and the huge water flows make the slopes unstable. This can also be justified by the previous studies that landslides were possibly debris flow because most of them occurred along the rivers. Due to this reason, the models have forecasted that lower elevation areas are highly susceptible. The other possible reason can be the disturbance to the natural settings due to human activities in lower elevated regions (Pradhan and Kim Citation2014; Dragićević et al. Citation2015).
The slope angles of most landslide-susceptible regions are between 0° and 23°, and rarely the susceptibility is high in areas where the slope is too sharp (). There is nearly no shallow landslide on the slope, which is too steep due to the thin soil layer (Chen et al. Citation2021a). Additionally, the regions with lower slope angles are more influenced by anthropogenic activities, which makes the slopes unstable. Anthropogenic activities greatly influence an area’s inherent topography, which has consequences. With time, the risk of landslides has grown because of the increase in deforestation rates, rising population density, and unrestrained urbanization (Flentje and Chowdhury Citation2018; Froude and Petley Citation2018; Bragagnolo et al. Citation2020).
Furthermore, flow direction, rainfall, and NDWI are linked to water content and have been ranked among the most substantial inducing factors. Rainfall is related strongly to very high landslide susceptibility in the area, which is very pragmatic as the area receives significant rainfall over a year, varying from 983 to 1323 mm at different places (). The degree of saturation of the soil increases because of the rapid infiltration of water in the soil due to heavy rainfall (Mandal and Mandal Citation2018; Maqsoom et al. Citation2020). When the moisture upsurges, the slope material becomes loose, and the risk of sliding increases.
The flow direction was also found to be very crucial related to the landslide susceptibility, possibly owing to the topography and water regime of the area. The flow direction in the area is from North to South, as indicated by the major rivers in the area (). While flowing from North to south, the cutting of slopes due to huge flow always causes debris flow (Ballabio and Sterlacchini Citation2012; Rahim et al. Citation2018). The considered area in this research has experienced a huge number of landslides positioned near the rivers and debris flow (Saba et al. Citation2010). Moreover, the NDWI is used to calculate moisture growth at a particular location (Rahim et al. Citation2018). Higher soil moisture creates higher landslide susceptibility than lower moisture levels (Yang et al. Citation2017; Aslam et al. Citation2022c).
provides a detailed depiction by comparing the results of different areas falling under different classes of susceptibility of LSMs. The comparison shows that all the models showed a similar trend in terms of area under different susceptibility classes with slight variations. However, for all of the models, the maximum area (around 8850 Sqm) has moderate susceptibility, and around 6100 Sqm area has high to very high susceptibility. Additionally, the assessment results proved that the PSO–ANN model has better accuracy (AUC = 0.87) than PSO–SVM (AUC = 0.84). ANN (AUC = 0.81) also performed better than SVM (AUC = 0.78) without the optimization. The results lead to the conclusion that the optimization improved the accuracy of both ANN and SVM.
Aslam et al. (Citation2021) in their study integrated CNN with multiple ML techniques, including SVM, and found that SVM outperformed other techniques with (AUC = 0.87) and without (AUC = 0.86) integration. The integration of SVM with CNN showed a noticeable improvement in accuracy. The accuracy of SVM in this study is less than the accuracy of SVM in the Aslam et al. (Citation2021)study, and the reason is that they used a bigger area (combination of two Muzaffarabad and Nowshera districts) and also the choice of their inducing factors was different. Also, another possible reason for the low accuracy of SVM in this study as compared to Aslam et al. (Citation2021) is that in this study, the kernel function used for the implementation of SVM is the Gaussian Radial basis function whereas they have used the Radial basis function. Moreover, another potential reason can be that Aslam et al. (Citation2021) used a cross-fold validation process for the implementation of the models; however, in this study, the hold-out implementation process is used. Also, Aslam et al. (Citation2022a), when comparing the performance of different conventional and unconventional ML techniques, including ANN, observed that the ANN (AUC = 0.92) outperformed the other techniques. The accuracy of the ANN is very high than the accuracy of the ANN with and without the optimization in this study. However, again the reasons for the difference are very comparable to the reasons mentioned previously. The neural network used in this study and in Aslam et al. (Citation2022a) is the same, which is MLP. The differences are the targeted area and a different implementation method, that is, hold-out.
Further, Xi et al. (Citation2019) assessed the efficiency of PSO for improving the performance of the ANN for plotting landslide susceptibility and found that the performance of ANN experiences a substantial increase when optimized with PSO. The AUC of ANN increased from 0.77 to 0.83 for the validation dataset. Similarly, in this study, PSO also enhanced the accuracy of ANN from 0.81 to 0.87, which is a very significant increase. Moreover, Zhao and Zhao (Citation2021), when combined PSO with SVM to prepare landslide susceptibility maps, also found an increase in the accuracy of the SVM. Based on the slope units, the accuracy of SVM (AUC = 0.85) improved considerably when optimized with PSO (AUC = 0.95). In these previously mentioned two studies, the performance of SVM and ANN improved considerably after the optimization with PSO, which resembles the outcomes of this study.
Moreover, the produced LSMs were assessed for their accuracy using the historical landslide locations. For the accuracy assessment, a correlation was calculated between the LSMs and the landslide locations. The results showed acceptable conformity for PSO–SVM, and PSO–ANN, with PSO–ANN performing better (89%) than the rest, as listed in . However, the ANN model-based LSM outperformed (82%) the SVM model for individual models. Thus, it can be concluded that the accuracy of an LSM is dependent on the assessment model and the inducing factors used for a given area.
Table 4. Outcomes of accuracy assessment of the generated maps from different models.
6. Conclusion
Several techniques have been created and utilized to map landslide susceptibility, both individually and in an integrated manner where one technique is amalgamated with another technique. All of these techniques differ from one another based on their effectiveness. Whereas, in this study, to evaluate the landslide susceptibility of Muzaffarabad district, two state-of-the-art techniques, that is, SVM and ANN, are adopted to compare the results for two scenarios. In the first scenario, these methods were used alone; for the second scenario, they were integrated with a state-of-the-art optimization technique of PSO. Based on the landslide phenomenon-related knowledge and the characteristics of the considered area, 13 inducing factors, namely slope, fault density, curvature, elevation, road density, lithology, earthquake intensity, curvature, waterways density, flow direction, NDWI, rainfall, and NDVI were selected in this study. The outcomes of multicollinearity showed that there is no collinearity present among the considered factors. A landslide inventory containing 1212 landslide points (including 606 landslide points and the same amount of non-landslide points) was used. Out of the 1212 points, 67% were used as training and 33% as testing datasets. The models were built based on the training data and were validated using the testing data.
The models in both scenarios ranked NDWI, lithology, slope, flow direction, rainfall, and elevation as the most important landslide-inducing factors. However, their weights varied for every model. The resulting LSMs from every model revealed that almost 30% of the area is subjected to high to very high susceptibility, while approximately 40% has moderate susceptibility. The areas having high susceptibility are mainly on the Southwestern side, while the low and moderate susceptibility areas are mainly on the Northeastern side of the district. Considering the outcomes of this study relative to the referred literature, the performance of all the models used in this study was fairly decent. The accuracy assessment revealed that the performance of the ANN model was relatively greater than the SVM model with (AUC = 0.87) and without (AUC = 0.81) the PSO optimization. Moreover, the results of the accuracy assessment of the produced LSMs also showed that the PSO–ANN model-produced map had the highest accuracy (89%). Followingly it was the PSO–SVM models’ LSM with an accuracy of 86%. The accuracy of SVM and ANN-produced LSMs are 82%, and 80% respectively. Thus, this study establishes the fact that integrated techniques can result in more efficient results than the individual models.
This study was limited to the integration of conventional techniques, that is, ANN and SVM with optimization technique PSO only. Nevertheless, as mentioned above, this study yielded better results as compared to the previous literature. Future studies can consider applying the used integrated techniques in different regions having similar or different topographical and environmental settings as of the area focused in this study for landslide susceptibility mapping. Also, the conventional techniques used in this study can be integrated with other optimization techniques such as Grey Wolf and Firefly for better results. Lastly, the LSMs produced in this study can help mitigate the damaging effects of this natural hazard by delineating the spatial distribution of potential landslide risk areas in the studied area. This makes it easier for the authorities to undertake necessary measures in a localized manner.
Authors’ Contributions
MB and JAK: Methodology, MB and JAK: Software, MB and JAK: Formal analysis and investigation. MB and JAK: visualization, MB, JAK, HGA and HA: Writing—original draft preparation, MB, JAK, HGA and HA: Writing—review and editing, MB, JAK, HGA and HA: Supervision. All authors have read and agreed to the published version of the manuscript.
Ethical Approval
This article does not contain any studies with human participants or animals performed by any of the authors.
Acknowledgements
The authors are thankful to the editor and reviewers for their kind feedback. Authors are thankful to HITEC University for its support in completing this research.
Disclosure Statement
The authors have no conflicts of interest to declare.
Availability of Data
The data that support the findings of this study are available on request from the corresponding author.
References
- Abdo HG. 2022. Assessment of landslide susceptibility zonation using frequency ratio and statistical index: a case study of Al-Fawar basin, Tartous, Syria. Int J Environ Sci Technol. 19(4):2599–2618.
- Abdo HG, Almohamad H, Al Dughairi AA, Ali SA, Parvin F, Elbeltagi A, Costache R, Mohammed S, Al-Mutiry M, Alsafadi K. 2022. Spatial implementation of frequency ratio, statistical index and index of entropy models for landslide susceptibility mapping in Al-Balouta river basin, Tartous Governorate, Syria. Geosci Lett. 9(1):1–24.
- Achour Y, Pourghasemi HR. 2020. How do machine learning techniques help in increasing accuracy of landslide susceptibility maps? Geosci Front. 11(3):871–883.
- Ahmad MN, Shao Z, Aslam RW, Ahmad I, Liao M, Li X, Song Y. 2022. Landslide hazard, susceptibility and risk assessment (HSRA) based on remote sensing and GIS data models: a case study of Muzaffarabad Pakistan. Stochastic Environ Res Risk Assess. 36:4041–4056.
- Ali S, Biermanns P, Haider R, Reicherter K. 2019. Landslide susceptibility mapping by using a geographic information system (GIS) along the China–Pakistan Economic Corridor (Karakoram Highway, Pakistan. Nat Hazards Earth Syst Sci. 19(5):999–1022.
- Arnoldus H. 1980. An approximation of the rainfall factor in the Universal Soil Loss Equation. In: De Boodt M, Gabriels D, editors. Assessment of Erosion. New York: John Wiley and Sons; 127–132.
- Aslam B, Maqsoom A, Khalil U, Ghorbanzadeh O, Blaschke T, Farooq D, Tufail RF, Suhail SA, Ghamisi P. 2022c. Evaluation of different landslide susceptibility models for a local scale in the Chitral District, Northern Pakistan. Sensors. 22(9):3107.
- Aslam B, Zafar A, Khalil U. 2021. Development of integrated deep learning and machine learning algorithm for the assessment of landslide hazard potential. Soft Comput. 25(21):13493–13512.
- Aslam B, Zafar A, Khalil U. 2022a. Comparison of multiple conventional and unconventional machine learning models for landslide susceptibility mapping of Northern part of Pakistan. Environ Dev Sustain. 1–28.
- Aslam B, Zafar A, Khalil U. 2022b. Comparative analysis of multiple conventional neural networks for landslide susceptibility mapping. Nat Hazards. 115(1):673–707.
- Avouac J-P, Ayoub F, Leprince S, Konca O, Helmberger DV. 2006. The 2005, Mw 7.6 Kashmir earthquake: sub-pixel correlation of ASTER images and seismic waveforms analysis. Earth Planet Sci Lett. 249(3–4):514–528.
- Bai Z, Liu Q, Liu Y. 2021. Landslide susceptibility mapping using GIS-based machine learning algorithms for the Northeast Chongqing Area, China. Arab J Geosci. 14(24):1–16.
- Baig MS. 2006. Active faulting and earthquake deformation in Hazara-Kashmir syntaxis, Azad Kashmir, northwest Himalaya, Pakistan. In: Extended Abstracts, International Conference on 8 October 2005 Earthquake in Pakistan: Its Implications and Hazard Mitigation, Islamabad, Pakistan, 18–19 January 2006, Citeseer, p. 27–28.
- Ballabio C, Sterlacchini S. 2012. Support vector machines for landslide susceptibility mapping: the Staffora River Basin case study, Italy. Math Geosci. 44(1):47–70.
- Batool M, Ahmad SR, Asif M. 2021. An assessment of landslide hazards in Muzaffarabad-Azad Jammu & Kashmir using geospatial techniques. Pak Geogr Rev. 76:164–173.
- Bradley AP. 1997. The use of the area under the ROC curve in the evaluation of machine learning algorithms. Pattern Recognit. 30(7):1145–1159.
- Bragagnolo L, da Silva RV, Grzybowski JMV. 2020. Landslide susceptibility mapping with r. landslide: a free open-source GIS-integrated tool based on Artificial Neural Networks. Environ Modell Softw. 123:104565.
- Bui DT, Tuan TA, Klempe H, Pradhan B, Revhaug I. 2016. Spatial prediction models for shallow landslide hazards: a comparative assessment of the efficacy of support vector machines, artificial neural networks, kernel logistic regression, and logistic model tree. Landslides. 13(2):361–378.
- Capitani M, Ribolini A, Bini M. 2013. The slope aspect: a predisposing factor for landsliding? CR Geosci. 345(11–12):427–438.
- Chen W, Chen X, Peng J, Panahi M, Lee S. 2021b. Landslide susceptibility modeling based on ANFIS with teaching-learning-based optimization and Satin bowerbird optimizer. Geosci Front. 12(1):93–107.
- Chen L, Guo H, Gong P, Yang Y, Zuo Z, Gu M. 2021a. Landslide susceptibility assessment using weights-of-evidence model and cluster analysis along the highways in the Hubei section of the Three Gorges Reservoir Area. Comput Geosci. 156:104899.
- Chen W, Pourghasemi HR, Panahi M, Kornejady A, Wang J, Xie X, Cao S. 2017a. Spatial prediction of landslide susceptibility using an adaptive neuro-fuzzy inference system combined with frequency ratio, generalized additive model, and support vector machine techniques. Geomorphology. 297:69–85.
- Chen W, Xie X, Peng J, Wang J, Duan Z, Hong H. 2017b. GIS-based landslide susceptibility modelling: a comparative assessment of kernel logistic regression, Naïve-Bayes tree, and alternating decision tree models. Geomatics Nat Hazards Risk. 8(2):950–973.
- Chen W, Xie X, Wang J, Pradhan B, Hong H, Bui DT, Duan Z, Ma J. 2017c. A comparative study of logistic model tree, random forest, and classification and regression tree models for spatial prediction of landslide susceptibility. Catena. 151:147–160.
- Chen W, Zhang S, Li R, Shahabi H. 2018. Performance evaluation of the GIS-based data mining techniques of best-first decision tree, random forest, and naïve Bayes tree for landslide susceptibility modeling. Sci Total Environ. 644:1006–1018.
- Choi J, Oh H-J, Lee H-J, Lee C, Lee S. 2012. Combining landslide susceptibility maps obtained from frequency ratio, logistic regression, and artificial neural network models using ASTER images and GIS. Eng Geol. 124:12–23.
- Cortes C, Vapnik V. 1995. Support-vector networks. Mach Learn. 20(3):273–297.
- Dou J, Yamagishi H, Pourghasemi HR, Yunus AP, Song X, Xu Y, Zhu Z. 2015. An integrated artificial neural network model for the landslide susceptibility assessment of Osado Island, Japan. Nat Hazards. 78(3):1749–1776.
- Dragićević S, Lai T, Balram S. 2015. GIS-based multicriteria evaluation with multiscale analysis to characterize urban landslide susceptibility in data-scarce environments. Habitat Int. 45:114–125.
- Du Y, Zhang Y, Ling F, Wang Q, Li W, Li X. 2016. Water bodies’ mapping from Sentinel-2 imagery with modified normalized difference water index at 10-m spatial resolution produced by sharpening the SWIR band. Remote Sensing. 8(4):354.
- Đurić D, Mladenović A, Pešić-Georgiadis M, Marjanović M, Abolmasov B. 2017. Using multiresolution and multitemporal satellite data for post-disaster landslide inventory in the Republic of Serbia. Landslides. 14(4):1467–1482.
- Eberhart R, Kennedy J. 1995. A new optimizer using particle swarm theory. In MHS'95. Proceedings of the Sixth International Symposium on Micro Machine and Human Science, IEEE, p. 39–43.
- Eshtay M, Faris H, Obeid N. 2018. Improving extreme learning machine by competitive swarm optimization and its application for medical diagnosis problems. Expert Syst Appl. 104:134–152.
- Flentje P, Chowdhury R. 2018. Resilience and sustainability in the management of landslides. In Proceedings of the Institution of Civil Engineers-Engineering Sustainability, vol ES1.
- Froude MJ, Petley DN. 2018. Global fatal landslide occurrence from 2004 to 2016. Nat Hazards Earth Syst Sci. 18(8):2161–2181.
- Gautam P, Kubota T, Sapkota LM, Shinohara Y. 2021. Landslide susceptibility mapping with GIS in high mountain area of Nepal: a comparison of four methods. Environ Earth Sci. 80(9):1–18.
- Ghorbanzadeh O, Shahabi H, Crivellari A, Homayouni S, Blaschke T, Ghamisi P. 2022. Landslide detection using deep learning and object-based image analysis. Landslides. 19(4):929–939.
- Gleason CJ, Im J. 2012. Forest biomass estimation from airborne LiDAR data using machine learning approaches. Remote Sens Environ. 125:80–91.
- Günther F, Fritsch S. 2010. Neuralnet: training of neural networks. R J. 2(1):30.
- He Q, Xu Z, Li S, Li R, Zhang S, Wang N, Pham BT, Chen W. 2019. Novel entropy and rotation forest-based credal decision tree classifier for landslide susceptibility modeling. Entropy. 21(2):106.
- Hong H, Liu J, Bui DT, Pradhan B, Acharya TD, Pham BT, Zhu A-X, Chen W, Ahmad BB. 2018. Landslide susceptibility mapping using J48 Decision Tree with AdaBoost, Bagging and Rotation Forest ensembles in the Guangchang area (China). Catena. 163:399–413.
- Hong H, Naghibi SA, Pourghasemi HR, Pradhan B. 2016. GIS-based landslide spatial modeling in Ganzhou City, China. Arab J Geosci. 9(2):112.
- Huang F, Yin K, Huang J, Gui L, Wang P. 2017. Landslide susceptibility mapping based on self-organizing-map network and extreme learning machine. Eng Geol. 223:11–22.
- Hussain MA, Chen Z, Wang R, Shah SU, Shoaib M, Ali N, Xu D, Ma C. 2022. Landslide susceptibility mapping using machine learning algorithm. Civ Eng J. 8(2):209–224.
- Hussain A, Yeats RS, MonaLisa. 2009. Geological setting of the 8 October 2005 Kashmir earthquake. J Seismol. 13(3):315–325.,
- Islam ARMT, Talukdar S, Mahato S, Kundu S, Eibek KU, Pham QB, Kuriqi A, Linh NTT. 2021. Flood susceptibility modelling using advanced ensemble machine learning models. Geosci Front. 12(3):101075.
- Jaafari A, Janizadeh S, Abdo HG, Mafi-Gholami D, Adeli B. 2022. Understanding land degradation induced by gully erosion from the perspective of different geoenvironmental factors. J Environ Manage. 315:115181.
- Jakob M. 2022. Landslides in a changing climate. In Landslide hazards, risks, and disasters. Elsevier, p. 505–579.
- Kamp U, Growley BJ, Khattak GA, Owen LA. 2008. GIS-based landslide susceptibility mapping for the 2005 Kashmir earthquake region. Geomorphology. 101(4):631–642.
- Kanwal S, Atif S, Shafiq M. 2017. GIS based landslide susceptibility mapping of northern areas of Pakistan, a case study of Shigar and Shyok Basins. Geomatics Nat Hazards Risk. 8(2):348–366.
- Kavzoglu T, Sahin EK, Colkesen I. 2014. Landslide susceptibility mapping using GIS-based multi-criteria decision analysis, support vector machines, and logistic regression. Landslides. 11(3):425–439.
- Kazmi AH, Jan MQ. 1997. Geology and tectonics of Pakistan. Karachi: Graphic Publishers,
- Khan AN, Collins AE, Qazi, F, Atta-Ur-Rahman. 2011. Causes and extent of environmental impacts of landslide hazard in the Himalayan region: a case study of Murree, Pakistan. Nat Hazards. 57(2):413–434.,
- Khan H, Shafique M, Khan MA, Bacha MA, Shah SU, Calligaris C. 2019. Landslide susceptibility assessment using Frequency Ratio, a case study of northern Pakistan. Egypt J Remote Sens Space Sci. 22(1):11–24.
- Khattak GA, Owen LA, Kamp U, Harp EL. 2010. Evolution of earthquake-triggered landslides in the Kashmir Himalaya, northern Pakistan. Geomorphology. 115(1–2):102–108.
- Li W, Fang Z, Wang Y. 2022. Stacking ensemble of deep learning methods for landslide susceptibility mapping in the Three Gorges Reservoir area, China. Stoch Environ Res Risk Assess. 36(8):2207–2228.
- Li BV, Jenkins CN, Xu W. 2022. Strategic protection of landslide vulnerable mountains for biodiversity conservation under land-cover and climate change impacts. Proc Natl Acad Sci USA. 119(2):e2113416118.
- Liu R, Li L, Pirasteh S, Lai Z, Yang X, Shahabi H. 2021. The performance quality of LR, SVM, and RF for earthquake-induced landslides susceptibility mapping incorporating remote sensing imagery. Arab J Geosci. 14(4):1–15.
- Mallick J, Alqadhi S, Talukdar S, AlSubih M, Ahmed M, Khan RA, Kahla NB, Abutayeh SM. 2021. Risk assessment of resources exposed to rainfall induced landslide with the development of GIS and RS based ensemble metaheuristic machine learning algorithms. Sustainability. 13(2):457.
- Mandal B, Mandal S. 2018. Analytical hierarchy process (AHP) based landslide susceptibility mapping of Lish river basin of eastern Darjeeling Himalaya, India. Adv Space Res. 62(11):3114–3132.
- Maqsoom A, Aslam B, Hassan U, Kazmi ZA, Sodangi M, Tufail RF, Farooq D. 2020. Geospatial assessment of soil erosion intensity and sediment yield using the revised universal soil loss equation (RUSLE) model. IJGI. 9(6):356.
- Maqsoom A, Aslam B, Khalil U, Kazmi ZA, Azam S, Mehmood T, Nawaz A. 2022. Landslide susceptibility mapping along the China Pakistan Economic Corridor (CPEC) route using multi-criteria decision-making method. Model Earth Syst Environ. 8(2):1519–1533.
- Maqsoom A, Aslam B, Yousafzai A, Ullah F, Ullah S, Imran M. 2022. Extracting built-up areas from spectro-textural information using machine learning. Soft Comput. 26(16):7789–7808.
- Mondini AC, Guzzetti F, Chang K-T, Monserrat O, Martha TR, Manconi A. 2021. Landslide failures detection and mapping using Synthetic Aperture Radar: past, present and future. Earth Sci Rev. 216:103574.
- Mountrakis G, Im J, Ogole C. 2011. Support vector machines in remote sensing: a review. ISPRS J Photogramm Remote Sens. 66(3):247–259.
- Naceur HA, Abdo HG, Igmoullan B, Namous M, Almohamad H, Al Dughairi AA, Al-Mutiry M. 2022. Performance assessment of the landslide susceptibility modelling using the support vector machine, radial basis function network, and weight of evidence models in the N'fis river basin, Morocco. Geosci Lett. 9(1):1–20.
- O’brien RM. 2007. A caution regarding rules of thumb for variance inflation factors. Qual Quant. 41(5):673–690.
- Owen LA, Kamp U, Khattak GA, Harp EL, Keefer DK, Bauer MA. 2008. Landslides triggered by the 8 October 2005 Kashmir earthquake. Geomorphology. 94(1–2):1–9.
- Pandey VK, Pourghasemi HR, Sharma MC. 2020. Landslide susceptibility mapping using maximum entropy and support vector machine models along the Highway Corridor, Garhwal Himalaya. Geocarto Int. 35(2):168–187.
- Park S, Hamm S-Y, Kim J. 2019. Performance evaluation of the GIS-based data-mining techniques decision tree, random forest, and rotation forest for landslide susceptibility modeling. Sustainability. 11(20):5659.
- Pham BT, Bui DT, Prakash I, Dholakia M. 2017. Hybrid integration of Multilayer Perceptron Neural Networks and machine learning ensembles for landslide susceptibility assessment at Himalayan area (India) using GIS. Catena. 149:52–63.
- Pham BT, Pradhan B, Bui DT, Prakash I, Dholakia M. 2016. A comparative study of different machine learning methods for landslide susceptibility assessment: a case study of Uttarakhand area (India). Environ Modell Softw. 84:240–250.
- Pham BT, Vu VD, Costache R, Phong TV, Ngo TQ, Tran T-H, Nguyen HD, Amiri M, Tan MT, Trinh PT, et al. 2022. Landslide susceptibility mapping using state-of-the-art machine learning ensembles. Geocarto Int. 37(18):5175–5200.
- Piralilou ST, Shahabi H, Pazur R. 2021. Automatic landslide detection using bi-temporal sentinel 2 imagery. Gi_Forum. 1:39–45.
- Pourghasemi HR, Pradhan B, Gokceoglu C. 2012. Application of fuzzy logic and analytical hierarchy process (AHP) to landslide susceptibility mapping at Haraz watershed, Iran. Nat Hazards. 63(2):965–996.
- Pradhan B. 2010. Landslide susceptibility mapping of a catchment area using frequency ratio, fuzzy logic and multivariate logistic regression approaches. J Indian Soc Remote Sens. 38(2):301–320.
- Pradhan AMS, Kim Y-T. 2014. Relative effect method of landslide susceptibility zonation in weathered granite soil: a case study in Deokjeok-ri Creek, South Korea. Nat Hazards. 72(2):1189–1217.
- Pradhan B, Lee S, Buchroithner MF. 2009. Use of geospatial data and fuzzy algebraic operators to landslide-hazard mapping. Appl Geomat. 1(1–2):3–15.
- Qi T, Zhao Y, Meng X, Shi W, Qing F, Chen G, Zhang Y, Yue D, Guo F. 2021. Distribution modeling and factor correlation analysis of landslides in the large fault zone of the western Qinling Mountains: a machine learning algorithm. Remote Sens. 13(24):4990.
- Rahim I, Ali SM, Aslam M. 2018. GIS Based landslide susceptibility mapping with application of analytical hierarchy process in District Ghizer, Gilgit Baltistan Pakistan. GEP. 06(02):34–49.
- Rahman G, Bacha AS, Ul Moazzam MF, Rahman AU, Mahmood S, Almohamad H, Al Dughairi AA, Al-Mutiry M, Alrasheedi M, Abdo HG. 2022. Assessment of landslide susceptibility, exposure, vulnerability, and risk in Shahpur valley, eastern Hindu Kush. Front Earth Sci. 10:953627.
- Rai DC, Murty C. 2006. Effects of the 2005 Muzaffarabad (Kashmir) earthquake on built environment. Curr Sci. 90(8):1066–1070.
- Riaz MT, Basharat M, Hameed N, Shafique M, Luo J. 2018. A data-driven approach to landslide-susceptibility mapping in mountainous terrain: case study from the Northwest Himalayas, Pakistan. Nat Hazards Rev. 19(4):05018007.
- Rossetto T, Peiris N. 2009. Observations of damage due to the Kashmir earthquake of October 8, 2005 and study of current seismic provisions for buildings in Pakistan. Bull Earthq Eng. 7(3):681–699.
- Saba SB, van der Meijde M, van der Werff H. 2010. Spatiotemporal landslide detection for the 2005 Kashmir earthquake region. Geomorphology. 124(1–2):17–25.
- Saha AK, Gupta RP, Sarkar I, Arora MK, Csaplovics E. 2005. An approach for GIS-based statistical landslide susceptibility zonation—with a case study in the Himalayas. Landslides. 2(1):61–69.
- Saha S, Sarkar R, Roy J, Hembram TK, Acharya S, Thapa G, Drukpa D. 2021. Measuring landslide vulnerability status of Chukha, Bhutan using deep learning algorithms. Sci Rep. 11(1):1–23.
- Seyedashraf O, Mehrabi M, Akhtari AA. 2018. Novel approach for dam break flow modeling using computational intelligence. J Hydrol. 559:1028–1038.
- Shirzadi A, Solaimani K, Roshan MH, Kavian A, Chapi K, Shahabi H, Keesstra S, Ahmad BB, Bui DT. 2019. Uncertainties of prediction accuracy in shallow landslide modeling: sample size and raster resolution. Catena. 178:172–188.
- Shu H, Guo Z, Qi S, Song D, Pourghasemi HR, Ma J. 2021. Integrating landslide typology with weighted frequency ratio model for landslide susceptibility mapping: a case study from Lanzhou city of northwestern China. Remote Sens. 13(18):3623.
- Talukdar S, Ghose B, Salam R, Mahato S, Pham QB, Linh NTT, Costache R, Avand M, Shahfahad. 2020. Flood susceptibility modeling in Teesta River basin, Bangladesh using novel ensembles of bagging algorithms. Stoch Environ Res Risk Assess. 34(12):2277–2300.,
- Tien Bui D, Shahabi H, Shirzadi A, Chapi K, Alizadeh M, Chen W, Mohammadi A, Ahmad B, Panahi M, Hong H, et al. 2018. Landslide detection and susceptibility mapping by airsar data using support vector machine and index of entropy models in cameron highlands, malaysia. Remote Sensing. 10(10):1527.
- Tsangaratos P, Ilia I. 2016. Comparison of a logistic regression and Naïve Bayes classifier in landslide susceptibility assessments: the influence of models complexity and training dataset size. Catena. 145:164–179.
- Umar Z, Pradhan B, Ahmad A, Jebur MN, Tehrany MS. 2014. Earthquake induced landslide susceptibility mapping using an integrated ensemble frequency ratio and logistic regression models in West Sumatera Province, Indonesia. Catena. 118:124–135.
- Van Den Eeckhaut M, Vanwalleghem T, Poesen J, Govers G, Verstraeten G, Vandekerckhove L. 2006. Prediction of landslide susceptibility using rare events logistic regression: a case-study in the Flemish Ardennes (Belgium). Geomorphology. 76(3–4):392–410.
- Vapnik V. 1999. The nature of statistical learning theory. New York: Springer Science & Business Media.
- Wang S-C. 2003. Artificial neural network. In Interdisciplinary computing in java programming. New York: Springer, p. 81–100.
- Wang Y, Fang Z, Hong H. 2019. Comparison of convolutional neural networks for landslide susceptibility mapping in Yanshan County, China. Sci Total Environ. 666:975–993.
- Xi W, Li G, Moayedi H, Nguyen H. 2019. A particle-based optimization of artificial neural network for earthquake-induced landslide assessment in Ludian county, China. Geomatics Nat Hazards Risk. 10(1):1750–1771.
- Yang Z, Qiao J, Uchimura T, Wang L, Lei X, Huang D. 2017. Unsaturated hydro-mechanical behaviour of rainfall-induced mass remobilization in post-earthquake landslides. Eng Geol. 222:102–110.
- Yousefi S, Jaafari A, Valjarević A, Gomez C, Keesstra S. 2022a. Vulnerability assessment of road networks to landslide hazards in a dry-mountainous region. Environ Earth Sci. 81(22):521.
- Yousefi S, Mirzaee S, Almohamad H, Al Dughairi AA, Gomez C, Siamian N, Alrasheedi M, Abdo HG. 2022b. Image classification and land cover mapping using sentinel-2 imagery: optimization of SVM parameters. Land. 11(7):993.
- Yu C, Chen J. 2020. Landslide susceptibility mapping using the slope unit for southeastern Helong City, Jilin Province, China: a comparison of ANN and SVM. Symmetry. 12(6):1047.
- Yuan X, Liu C, Nie R, Yang Z, Li W, Dai X, Cheng J, Zhang J, Ma L, Fu X, et al. 2022. A comparative analysis of certainty factor-based machine learning methods for collapse and landslide susceptibility mapping in Wenchuan County, China. Remote Sens. 14(14):3259.
- Zhao S, Zhao Z. 2021. A comparative study of landslide susceptibility mapping using SVM and PSO-SVM models based on Grid and Slope Units. Math Prob Eng. 2021:1–15.
- Zhu A-X, Miao Y, Yang L, Bai S, Liu J, Hong H. 2018. Comparison of the presence-only method and presence-absence method in landslide susceptibility mapping. Catena. 171:222–233.
- Zhu Z, Wang H, Pang B, Dou J, Peng D. 2019. Comparison of conventional deterministic and entropy-based methods for predicting sediment concentration in debris flow. Water. 11(3):439.