
 ?Mathematical formulae have been encoded as MathML and are displayed in this HTML version using MathJax in order to improve their display. Uncheck the box to turn MathJax off. This feature requires Javascript. Click on a formula to zoom.
Abstract
Hydrodynamics and socio-economic impacts of compound floods as the result of co-occurring pluvial and fluvial floods, have not been well studied, which challenges conventional urban flood risk management that treats different types of floods separately. This study generates a high-resolution land surface digital surface model based on images from unmanned aerial vehicles, and incorporates it into a combined flooding model that integrates the 1D river hydrodynamic model, 1D urban drainage hydrodynamic model and 2D overland flow model, in order to simulate the inundation characteristics of extreme floods when local pluvial floods coincide with upstream fluvial floods, and in a further step to quantify the direct economic losses on urban physical systems. As demonstrated by an empirical study of Longyan, China, the combination of pluvial and fluvial floods leads to substantial exacerbation in inundation extent and depth. Consequently, the joining of pluvial and fluvial floods greatly amplifies economic losses to urban physical systems, indicating that ignoring co-occurrence of different types of floods will potentially lead to underestimation of flood risk and insufficient adaptation. Our study emphasizes the need to account for the co-occurrence of multiple types of floods in flood risk assessment and management, to avoid the shortcomings of fragmented responses.
1. Introduction
Flooding is among the most frequent and destructive natural disasters facing cities globally, and its risk has been accelerating in the context of climate change and socio-economic development (Jongman Citation2021; Tellman et al. Citation2021; Winsemius et al. Citation2016), causing potentially severe direct and indirect damage to urban socio-economic and ecological systems (Shrestha et al. Citation2021; Wang et al. Citation2020; Xu et al. Citation2016). Direct economic damage of floods is more than $40 billion for globe annually, according to the Organization for Economic Cooperation and Development (OECD), constituting about a third of the economic losses inflicted by natural hazards worldwide (OECD Citation2016). Given the observed and predicted global and regional increases of precipitation extremes under global warming, the frequency and severity of floods are also expected to increase (IPCC Citation2021). Apart from climate change, on-going rapid urbanization is another vital driver of flood risks. As populations migrate to urban areas, there is an increase in the concentrations of buildings, infrastructure, facilities and impervious surfaces (Forman and Wu Citation2016; Liu et al. Citation2020), increasing the area’s exposure and vulnerability to flooding (Iglesias et al. Citation2021; Wake Citation2021; Xu et al. Citation2019).
Flooding that inundates the urban built environment can arise from coastal, fluvial and pluvial flood. Coastal flood is triggered by extreme sea level events from high tides, storm surges or their combination; fluvial flood happens when the channel cannot cope with the water draining into it and water starts to overtop river banks; and pluvial flood occurs when torrential rain overwhelms the drainage capacity of a local area (Muthusamy et al. Citation2019). All of these floods have been causing devastating damage to urban systems, through either their individual events or their composites. In particular, composites—for example, coincident pluvial flooding and fluvial flooding—cause more severe consequences than any of them individually (Leonard et al. Citation2014). However, since conventional urban flood risk management has focused on only one of these types of floods at a time, policy makers are challenged by large uncertainties in trying to determine the compound effects of pluvial flood and fluvial flood on inundation characteristics, and consequent damages. Therefore, consideration of joint pluvial and fluvial flooding for inundation modeling and impact assessment is fundamentally important to plan and implement adaptation for urban flood.
Many studies have already been conducted, to understand different types of floods in isolation, covering frequency analysis, hydrodynamic simulations, and socio-economic impact assessments. More recently, increasing attention has been focused on studying the compound effects of different types of floods. However, most of the relevant studies have focused on the co-occurrence of coastal floods and fluvial floods in estuaries (Couasnon et al. Citation2020; Jane et al. Citation2020; Moftakhari et al. Citation2017; Paprotny et al. Citation2018), attempting to investigate the dynamics of their historical and future frequencies and intensities. Currently, there is a lack of clear understanding of the socio-economic effects of such compound floods. Moreover, composite flooding as the result of the co-occurrence of pluvial and fluvial floods has not been well studied, especially in terms of the hydrodynamics and socio-economic impacts on the urban environment.
Many previous studies have revealed the increasing trend of the historical occurrence of coastal and pluvial compound floods. For example, Ganguli and Merz Citation2019 found an increase trend in compound flooding as a result of high sea levels and peak river discharge in the midlatitude regions of northwestern Europe during 1901-2014. Wahl et al. Citation2015 found that compound flood events have significantly increased in number in many of the major coastal cities, over the past century. A study by Jalili Pirani and Najafi Citation2020 along Canada’s coasts also showed an increased trend of compound flooding on the Atlantic coast. However, the future frequency of coastal and pluvial compound floods is uncertain. Bevacqua et al. Citation2019 projected that the probability of compound floods along parts of the northern European coast will increase, although results from Ganguli and Merz Citation2019 indicate a decreasing trend over the majority of sites in northwestern coastal Europe by the 2050s. With respect to the intensity of compound flooding in coastal areas, extreme water levels from the ocean can amplify fluvial flood hazards greatly. An empirical study in the San Francisco Bay by Herdman et al. Citation2018 indicated that maximal water levels will occur in a tidal river when high tide, storm surge, and large fluvial discharge events are coincident. A global scale analysis by Eilander et al. Citation2020 showed that riverine flooding depths in deltas, globally, are significantly underestimated—by 9.3%—if storm surge is ignored as a factor.
Studies that concentrate on the combined effects of pluvial and fluvial flooding are relatively rare, because (1) hydrodynamic simulation of pluvial and fluvial combined flooding is technically complicated, relying on the advanced 1D river hydrodynamic model, the 1D sewer model and the 2D surface flow hydraulic model; and (2) a wide range of data is required, covering meteorological data, hydrological data, topographic data, land use/cover data, etc. Despite these difficulties, there are still several pioneering studies being conducted in this field. Generally, they concentrate either on the effects of compound flood on inundation extents and depths, or on comparing the damages caused by pluvial and fluvial floods individually. Few of them have completely assessed the hydrodynamic characteristics of the compound flood and the consequent economic damages to the urban built environment. Chen et al. Citation2010 and Patra et al. Citation2016 considered the flow interactions among channels, floodplains, and underground sewer networks in their 1D and 2D coupled hydrodynamic model, and successfully simulated the pluvial and fluvial combined flood, including inundation extent, depth, duration and maximum flow velocity. In a study by Apel et al. Citation2016, the probabilities of coincidence of pluvial and fluvial floods were quantified and applied to model spatially explicit probabilistic hazard maps of compound floods in Can Tho city, Vietnam. However, none of these studies took the further step of analyzing the economic damages of the compound flood on urban systems. Although Tanaka et al. Citation2020, based on a large-ensemble climate simulation database, succeeded in deriving ‘damage-exceedance’ curves for pluvial and fluvial floods respectively, and compared their distinctions, the damages induced by compound flooding were not investigated.
Therefore, this study, using Longyan City, China as a case study, focuses on the compound floods caused by local pluvial flood and upstream fluvial flood, for inland cities, in order to investigate the hydrodynamic characteristics of compound flooding and the consequent economic losses. This empirical study (1) not only contributes to revealing the inundation features of the compound flood by integrating the 1D river hydrodynamic model, the 1D urban drainage hydrodynamic model and the 2D overland flow model, (2) but also, more importantly, helps investigate the effects of the composite flood on the physical damages induced by either fluvial flood or pluvial flood in isolation. In addition, policy implications for joint consideration of different types of floods, in risk management and response, are discussed.
2. Study area
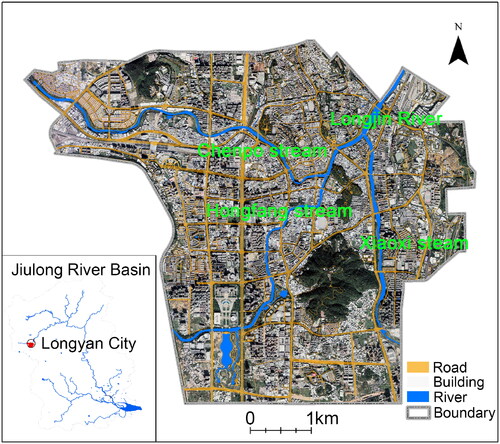
Longyan is a rapidly urbanizing city located in the upstream reach of the Jiulong River—the second largest river in Fujian province, China, with a main stream of 258 km2. From 1990 to 2020, Longyan City grew fast, with its population, GDP and impervious area increasing from 2.65 million to 3.18 million, 378 4.7 RMB million yuan to 267895.84 RMB million yuan and 12 to 74 km2, respectively. Longyan has a northern subtropical ocean monsoon climate and is frequently affected by cyclonic storms, especially during the wet season (July to September). For instance, an extreme precipitation event induced by typhoon No. 10 in 1996 led to a fluvial and pluvial combined extreme flood, which caused 242 deaths, 174.6 thousand collapsed houses, and 2.89 billion RMB yuan in direct economic losses. A similar catastrophic typhoon-induced flood occurred in 2005, inundating 1.28 million population and causing 1.21 billion RMB yuan in direct economic losses. The city center of Longyan, with an area of 27.7 km2, is the most prone to flood risk, due to its high exposure and geographic proximity to rivers. Population and economic activities are concentrated in the highly urbanized city center. Three sub-streams of the Jiulong River—Longmen stream, Chenpo stream and Xiaoxi stream—flow through and converge in the city center. In fact, the city center has experienced urban floods every year in the most recent decade. Extreme combined pluvial and fluvial floods have become an increasingly important concern for local government and residents. Hence, in this study we choose the city center of Longyan as the study area. Map of Longyan city center is shown in .
Figure 1. Map of Longyan city center, including its location, rivers, buildings and roads.
3. Data and methods
3.1. Framework
describes the framework used to investigate the inundation characteristics and the consequent direct economic losses in the center city of Longyan, in the cases of pluvial flood, fluvial flood and the extreme event when pluvial flood is compounded with fluvial flood, respectively. This study is organized as follows:
Figure 2. Framework for compound flood simulation and impact assessment.
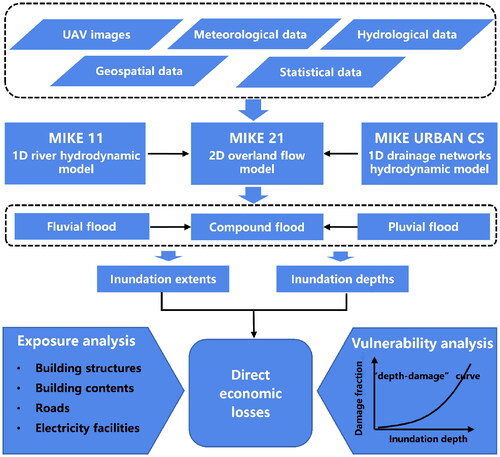
A dataset required for the inundation modeling and economic loss estimation is established. The dataset consists of multiple sources of data, generally including unmanned aerial vehicle (UAV) images, meteorological data, hydrological data, geospatial data and statistical data. Details of the dataset, including data types, descriptions, purposes and sources, are provided in the .
MIKE FLOOD platform—a commercial toolbox for professional flood modelers—is applied to simulate the hydrologic processes and inundation features, including inundation area and depth. In this study, we combine the MIKE 11 model and the MIKE 21 surface flow model for the fluvial flood modeling, and the MIKE URBAN model and the MIKE 21 model for the pluvial flood modeling, then integrate all three of them for modeling the extreme flood event: coupling fluvial and pluvial floods.
Flood loss for each event risk is quantified by multiplying exposure by vulnerability. Here, we focus on flood losses on urban physical systems, including damages to urban buildings (including both structures and contents), and key infrastructure (roads and electrical facilities).
Table 1. Data sources for compound flood simulation and impact assessment.
3.2. Hazard scenarios
To compare the respective inundation characteristics and the resulting direct economic losses of fluvial and pluvial floods, with the outcomes of the compound flood, we design and conduct our analysis as three different scenarios:
Pluvial flood scenario, which only considers the occurrence of an urban flood from a localized 2-hours heavy rainfall; here we simulated pluvial floods for 1-year, 2-year, 10-year and 50-year return periods of rainfall.
Fluvial flood scenario, which only considers the occurrence of inundation as the result of water overtopping the river banks from upstream 24-hours precipitation. Here we simulated fluvial floods for 20-year, 50-year, 100-year, and 200-year return periods of rainfall. In our study, rainfall data for the period 1970 to 2015 from Zhongcheng and Longyan rainfall stations were used, in which rainfall data from Zhongcheng station were applied in the pluvial flood modeling, and rainfall data from Longyan station were used in the fluvial flood modeling. Since the historical rainfall data available for computing the return periods of an upstream 24-hours rainfall and a local 2-hours precipitation differ, the return periods for a fluvial flood and a pluvial flood also differ.
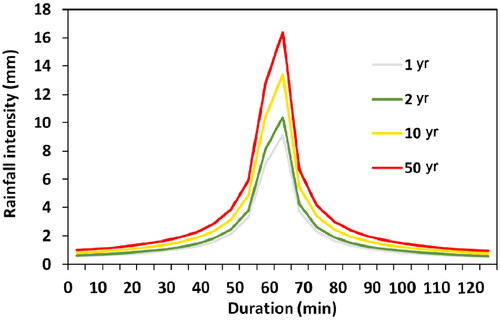
Composite scenario, which expresses the extreme flood event, when a pluvial flood coincides with a fluvial flood. Given that long-term records are insufficient for calculating the frequency of co-occurrence of fluvial and pluvial floods, here we didn’t analyze the compound floods with explicit return periods. Instead, we followed a simplified approach to create two assuming extreme flood scenarios: we combine a local short-term rainfall with an upstream long-term rainfall with approximately the same maximum hourly precipitation. As shown in , we find that the maximum hourly precipitation of a 10-year 2-hours rainfall and a 50-year 2-hours rainfall are roughly equivalent to the maximum hourly precipitation of a 50-year 24-hours rainfall and a 200-year 24-hours rainfall, respectively. This indicates high probabilities of co-occurrence of a 10-year 2-hours rainfall with a 50-year 24-hours rainfall, and co-occurrence of a 50-year 2-hours rainfall with a a 200-year 24-hours rainfall. Therefore, we simulated compound floods under two cases: a 10-year return period pluvial flood coinciding with a 50-year return period fluvial flood; and a 50-year return period pluvial flood coinciding with a 200-year return period fluvial flood. Additionally, we compared the annual maximum hourly rainfalls for the two rainfall stations, and analyzed the timings of their occurrence. We found that average value of annual maximum hourly rainfalls for Zhongcheng station from 1970 to 2015 is 29.1 mm, with a standard deviation (SD) of 9.04 mm, and average value of annual maximum hourly rainfalls for Longyan station is 28.4 mm (SD = 8.08 mm). 87.3% of annual maximum hourly rainfall events for the two stations occurred at the same day, and 71.6% of them occurred at the same hour. This demonstrates that rainfall events observed at Zhongcheng and Longyan station have a high probability of co-occurring, especially those extreme rainfall is likely to trigger co-occurrence of fluvial and pluvial flood.
Table 2. Maximum hourly precipitation for a short-term rainfall and a long-term rainfall.
3.3. Flood inundation modeling
3.3.1. Pluvial flood modeling
A MIKE URBAN model was combined with a MIKE 21 Flow Model, for the pluvial flood modeling. The MIKE URBAN model consists of two components: hydrological and hydraulic. The hydrological model calculates the rainfall-runoff hydrographs for each sub-catchments, and then the hydraulic model employs the rainfall-runoff hydrographs to be the manhole inflows and hence simulates the complex flow in drainage networks. The MIKE 21 Flow Model is then employed for the surface flow simulation, for visualizing floodplain inundation and depths. For precise two-dimensional modeling of surface flow, a high-resolution land surface digital surface model (DSM)—which enables the consideration of the impacts of streets, buildings, and other surface obstacles on the hydraulic processes—is generated, based on images from unmanned aerial vehicles. The DSM has a spatial resolution of one meter and its extent covers the entire study area with an area of 38 km2. Moreover, high-resolution 1:2000 land use data was used to determine the explicit spatial roughness coefficients of the land surface, to enhance the accuracy of flood simulation. Based on the land use data, the land surface of the study area was classified into five categories: built-up land, roads, green space, water and other. These have different degrees of roughness, resulting in different runoff coefficients. In this study, by referring to the China National Standard for Outdoor Drainage Design (GB50014-2014), runoff coefficients of these five land-use types were determined as 90%, 85%, 20%, 0% and 60%, respectively. Here, on the basis of the municipal rainstorm formula for Longyan City and the Comprehensive Planning of Drainage and Flooding Prevention of Longyan City, we followed the Chicago method for obtaining the distribution processes of design rainstorm (), which present rainfall rates as continuous functions of time, for different rainfall return periods (Rosbjerg and Madsen Citation2019). In our study, municipal rainstorm formula refers to the equation that we applied to determine the frequency of the short-duration design rainstorm and its corresponding intensity (Ouyang et al. Citation2019).
Figure 3. Design rainstorm distribution process for different return periods.
3.3.2. Fluvial flood modeling
This study simulates a fluvial flood by integrating the MIKE 11 hydrodynamic model (HD) with a MIKE 21 Flow Model. The MIKE 11 hydrodynamic model (HD) uses an implicit, finite difference scheme for the computation of unsteady flows in rivers. Similar to the pluvial flood, the MIKE 21 model was built for overland flow simulations. In the 1D hydrodynamic model, a digital orthophoto map (DOM) was obtained from unmanned aerial photography in dry season and was adjusted with reference to a high-resolution 1:1000 digital elevation model (DEM) through the 3D Analyst on the ArcGIS platform, to finely extract the elevation for each channel section of the river. This study sampled 60 channel sections, which inclue 18 channel sections in Chenpo stream, 15 channel sections Xiaoxi stream, 20 channel sections in Longmen stream, and 7 channel sections in Longjin River.
Flow data for the period 1970 to 2015 from the Longmen, Chenpo, Xiaoxi and Dongxin hydrological station were employed. The Dongxin station are located in the downstream reach, while the others are located in the upstream reach, of the study area. Based on the historical flow data, Pearson Type III Distribution was applied to generate peak flow corresponding to different return periods (Durrans Citation1992).
In this study, boundary conditions include three upstream inflow boundaries, for Longmen stream, Chenpo stream and Xiaoxi stream, and a downstream water-level boundary for Longjin River. Based on land use, soil, topographic, meteorological and historical flow data, we built a SWAT (Soil and Water Assessment Tool) hydrological model to generate the hydrograph. Here, we compared the modeled daily flows in 2010 with the actually observed daily flows in 2010 for Longmen station, Chenpo station and Xiaoxi station, in order to validate the built hydrological model. The Nash-Sutcliffe coefficient of efficiency (NS), coefficient of determination (R2) and root mean square error (RMSE) were employed to evaluate its performance. presents the results of the validation, which demonstrates that our hydrological analysis performed well.
Table 3. Validation of the SWAT model.
3.3.3. Compound flood modeling
Finally, the MIKE 11 HD, MIKE URBAN and MIKE 21 flow models are linked together in the MIKE FLOOD platform for the hydrological and hydrodynamic process simulations of the compound floods.
3.3.4. Calibration and validation
The observed flow data on June 11, 2011 were used for the calibration of the MIKE 11 HD model for the correction of the model parameters. The calibrated MIKE 11 HD was then applied to simulate the flood process of two flood events, on August 14, 2005 and June 12, 2019, and their results were compared with the actual observed peak flow of each flood event, for validating the performance of the built model. As shown in , the accuracy of the built MIKE 11 HD model was acceptable, as demonstrated by the low magnitudes of the errors.
Table 4. Validation of the MIKE 11 HD model.
Using the rainfall data on June 11, 2019 9:00-23:00 as input, the pluvial flood model simulated the urban inundation and depths. These were compared with the actual observed inundation depths for four observation sites. As shown in the model errors range from 6.1% to 17.4% (with an average of 12.4%), which demonstrate a good performance of the pluvial flood model.
Table 5. Performance of the pluvial flood model.
3.4. Flood loss assessment
In this study, we focus on physical damage to the building sector (including building structures and building contents) and key infrastructure (including urban roads and electricity facilities), and calculate their direct economic losses by multiplying exposures by their respective ‘depth-damage’ curves. To be specific, building sector includes residential, office, commercial and industrial buildings. Their contents refer to major furniture and common household appliances in residential and commercial building, and major equipment in industrial buildings. Exposures of urban physical system to flood are extracted by overlaying the spatial distribution maps of buildings, roads and electrical facilities with the inundation maps. Here, ‘depth-damage’ curves represent the damage or loss degree in relation to the degree of inundation depth. As shown in , we refer to the ‘depth-damage’ curves for building systems and infrastructure that were built and well demonstrated in our previous works (Xu et al. Citation2016; Xu et al. Citation2021).
Table 6. Vulnerability curves for building, road and Electricity facility.
4. Results and discussion
4.1. Inundation characteristics
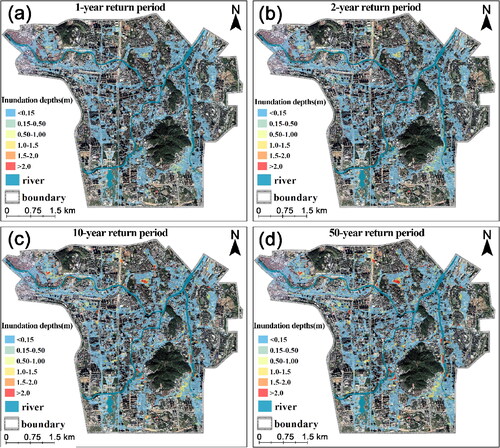
The hazard maps of pluvial floods corresponding to a series of return periods are shown in . Generally, hazard severities in terms of maximum inundation extents and depths increase with the rise of the return period. The maximum inundation areas for the 1-year, 2-year, 10-year and 50-year returns are 5.84 km2, 6.29 km2, 7.04 km2 and 7.63 km2, accounting for 21.08%, 22.71%, 25.42% and 27.55%, respectively, of the study area. Compared to the relatively slight growth trend of inundation extent, the inundation depths exhibit a more dramatic increasing trend with the rise of the return period. For example, maximum inundation depth will increase from 0.39 m in a 1-year return period flood to 0.79 m in 2-year return period flood, to 2.36 m in 10-year return period flood, and to 3.22 m in 50-year return period flood; average inundation depth will increase from 0.04 m in 1-year return period flood to 0.05 m in 2-year return period flood, to 0.09 m in 10-year return period flood, and to 0.11 m in 50-year return period flood. In the inundated area, residential land is the major land use type, indicating that the urban living environment would be subjected to large impacts from pluvial floods.
Figure 4. Maximum inundation extents and depths in the cases of (a) 1-year, (b) 2-year, (c) 10-year, and (d) 50-year return period pluvial floods.
Hazard maps in terms of maximum inundation extents and depths of fluvial floods are shown in . Inundation areas under 20-year, 50-year and 100-year return period river floods are 0.04 km2, 0.34 km2 and 0.91 km2, occupying only 0.14%, 1.23% and 3.29% of the study area, respectively. These results can be explained thus: the river dike along the city center of Longyan is well constructed and is basically able to combat river floods with return periods of less than 100 years. However, when it comes to a more extreme river flood event, this river dike alone fails to protect the urban built environment. For example, a 200-year fluvial flood will cause 2.46 km2 land to be affected, occupying 8.88% of the land of the study area. Given that climate change and socio-economic development make it an increasingly complex task for the conventional engineering approaches to combat unpredictable floods, the approach to dealing with floods should be transformed from the current passive ‘reduction and prevention’ thinking to proactive thinking, by enhancing the resilience capacity to unknowable and destructive events (Berbés-Blázquez et al. Citation2017; Friend et al. Citation2014). Adaptation should concentrate more on a city’s capacity to resist and keep functioning during and after a flood event than on the city’s ability to prevent the hazard, regardless of cost.
Figure 5. Maximum inundation extents and depths in the cases of (a) 20-year, (b) 50-year, (c) 100-year, and (d) 200-year return period fluvial floods.
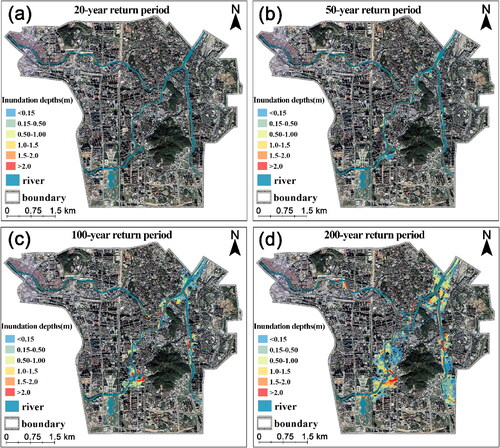
With respect to inundation depths, although inundation extents under 20-year, 50-year and 100-year return period river floods are relatively small, these inundations are nevertheless relatively deep, with maximum depths reaching 2.83 m, 3.78 m and 4.74 m, respectively. Maximum depth in a 200-year fluvial flood could be as high as 5.78 m, indicating the remarkably destructive characteristics of a major river flood.
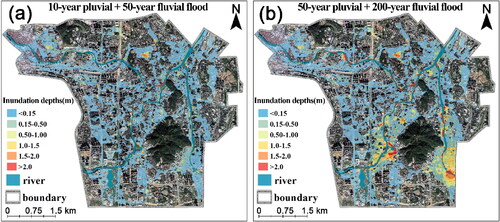
In the scenario that combines a fluvial flood with a pluvial flood, the severities of inundation extents and depths are exaggerated dramatically, compared to the results in either fluvial-alone or pluvial-alone flood scenarios. As depicted in , in the case of ‘10-year pluvial flood coincides with 50-year fluvial flood’, maximum inundation extent rises to 7.31 km2 (26.39% of the study area). The increase trend is more significant when a 50-year return period pluvial flood coincides with a 200-year return period flood: the maximum inundation extent is expected to rise to 9.15 km2—19.9% and 272% larger in comparison to a pluvial flood and a fluvial flood in isolation, respectively. Inundation depths also increase dramatically in the compound flood. In the case of ‘10-year pluvial flood coinciding with 50-year fluvial flood’, the average inundation depth increases by 44%, reaching 0.13 m, when compared to a pluvial flood alone. More significantly, the average depth increases by 200%, reaching 0.33 m, in the case where a 50-year pluvial flood coincides with a 100-year fluvial flood. In our study, we also determined that the hazard—including inundation extent and depth—of a compound flood is not a simple linear sum of pluvial and fluvial floods, but rather the result of their interactive and complex hydraulic processes.
Figure 6. Maximum inundation extents and depths of compound floods: (a) combined 10-year pluvial and 50-year fluvial floods; (b) combined 50-year pluvial and 200-year fluvial floods.
4.2. Direct economic losses
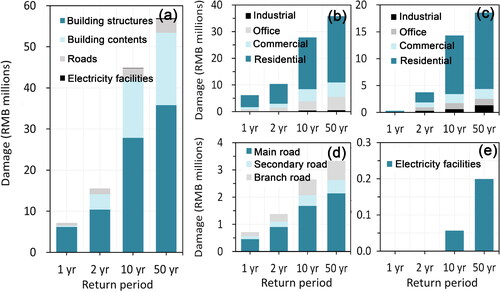
The flood damages to urban physical systems due to pluvial flood are shown in . As expected, the overall direct economic losses also increase with the increasing intensity of floods. The direct economic losses—including building structures, building contents, roads and electrical facilities—for 1-year, 2-year, 10-year and 50-year pluvial floods are 7.20, 15.52, 44.82 and 56.92 RMB million, respectively.
Figure 7. Direct economic losses of pluvial floods on urban physical systems: (a) total economic losses, (b) building structures, (c) building contents, (d) roads, and (e) electrical facilities.
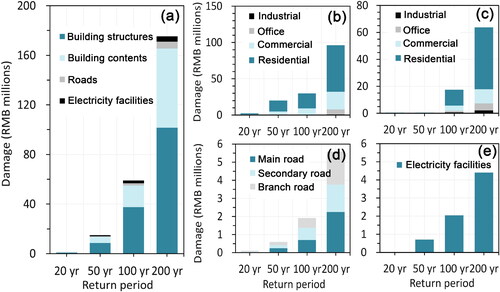
As shown in , in the fluvial flood scenario, the direct economic losses for 20-year, 50-year, 100-year and 200-year floods are 1.30, 14.77, 58.91, and 175.32 RMB million, respectively. It should be noted that although inundation extents under some fluvial floods are smaller than those from pluvial floods, their direct economic losses on urban physical systems can be much higher. For instance, a 200-year return period fluvial flood with only a 2.46 km2 inundation area causes 175.32 RMB million in losses, whereas a 50-year return period pluvial flood with a 7.63 km2 inundation area causes only 56.92 RMB million in losses. We compared the spatial distributions of buildings, roads and electrical facilities, and found no significant spatial disparity between the pluvial and fluvial flooded areas. This comparison helped determine that higher inundation depths in fluvial floods led to higher direct damages than in pluvial floods, implying that fluvial flooding is more devastating. Tanaka et al. Citation2020 compared the damages caused by pluvial and fluvial floods in Nagoya, Japan, and also found that in some cases a fluvial flood of smaller inundation extent is more destructive than a pluvial flood of larger inundation extent but shallower depth. However, pluvial flooding normally leads to more intangible and indirect impacts: for example, disrupting or even stopping the normal operation of the city.
Figure 8. Direct economic losses on physical systems, from fluvial floods: (a) total direct economic loss, (b) building structures, (c) building contents, (d) roads, (e) electrical facilities.
In the compound flood scenario, the joining of pluvial and fluvial floods greatly exacerbates the damages to urban physical systems. As shown in , total direct economic loss in the case of ‘a 10-year pluvial flood coinciding with a 50-year fluvial flood’ is 72.40 RMB million, increases of 61.54% and 390.18% compared to the damages caused by isolated pluvial and fluvial events, respectively. More notably, total direct economic loss in case of ‘a 50-year pluvial flood coinciding with a 200-year fluvial flood’ increases to 230.5 million RMB—4.05 times and 1.31 times as much, respectively, as the damages caused by a single type of flood. Coupling pluvial and fluvial floods is essential for accurate flood risk assessment. For city-level flood risk assessment, considering only pluvial flood or fluvial flood alone will lead to underestimates regarding the actual damages to an urban system, as demonstrated by our results. Many developing countries like China dedicate themselves to constructing river defenses or updating urban drainage systems, in order to solve flood problems facing the urban built environment. However, these cities are still suffering from inundation and consequent damages. Aside from the driving effects of climate change and urban socio-economic development, we argue that failure to consider the event of combined pluvial and fluvial floods causes cities to underestimate flood risk, leading to deficient planning, design and implementation of flood adaptation measures. In addition, if pluvial and fluvial floods coincide, the compound damages are not a simple sum of the individual values for a single type of flood. Ignoring this fact may also result in uncertainties with respect to flood risk assessment, undermining the efforts toward flood adaptation.
Figure 9. Direct economic losses to physical systems, from compound floods: (a) total direct economic losses, (b) building structures, (c) building contents, (d) roads, and (e) electrical facilities.
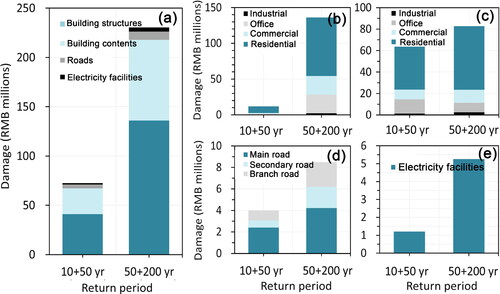
Building structures and contents are particularly affected, making up over 90% of direct economic losses. Contribution of each building type to direct economic losses is significantly different. Residential building accounts for most of the direct economic losses in the building sector, with its occupation of 50%. This result is consistent with the study by Hallegatte et al. Citation2011, where residential sector, including structure and content, also bears the most part of flood impacts, compared to commercial and industrial sectors. Although direct economic losses on roads and electrical facilities is far less than the building sector, they should not be ignored in flood risk management and emergency response, because damages to road and electrical facilities may lead to substantial indirect losses. Roads and electrical facilities are fundamental lifelines in supporting economic growth and social development. Once they are disturbed or destroyed, daily activities of residents, business and services, and industrial production will be severely affected indirectly (Chinowsky et al. Citation2013; Chinowsky et al. Citation2015; Yin et al. Citation2016).
4.3. Limitations
The main purpose of our study was to investigate the compound effects of pluvial flood and fluvial flood on urban inundation characteristics and the consequent direct damages, in order to emphasize the necessity of integrating both types of hazards into urban flood risk management. While the hazard scenarios we used here were able to achieve our study purpose, the study also labors under several limitations that should be addressed in future researches. First, the rainfalls for the development of pluvial and fluvial flood scenarios occur with different return periods, making it impossible for our study to compare the inundation features and damages between pluvial floods and fluvial floods. Second, the compound floods we analyzed here were based on hazard scenarios where pluvial floods coincide with fluvial floods. Lack of adequate historical observation records hinders the calculation of joint probabilities of their coincidences, and therefore it is impossible to generate the ‘damage-exceedance probability’ curves for further flood risk assessment. Future studies should concentrate on determining the joint probability with multiple data sources and case studies, contributing to reveal the differences of pluvial and fluvial floods in terms of their hydrodynamic and socio-economic effects, and in a further step, to assess the compound flood risk.
5. Conclusions
Here we provide a novel empirical study: integrating a 1D river hydrodynamic model, a 1D urban drainage hydrodynamic model and a 2D overland flow model for the inundation simulation of extreme compound floods due to co-occurrence of a pluvial flood and a fluvial flood, and in a further step quantitively evaluating the direct economic losses on urban physical systems, including buildings and key infrastructure. As demonstrated by an empirical study of Longyan, China, the combination of upstream fluvial and local pluvial flood leads to a substantial exacerbation in urban flood hazard regarding inundation extent and depth, and this amplification effect is more pronounced for larger compound floods. Consequently, the joining of pluvial and fluvial floods greatly exacerbates the economic losses to urban physical system, compared to the damages in either fluvial or pluvial flood scenarios alone, indicating that considering only pluvial or fluvial flood alone will lead to an underestimate of flood risk assessment. Moreover, the compound effects of the co-occurrence of these two types of floods on inundation and damages is not a simple linear sum of pluvial and fluvial flood damage, but is the result of their interactive and complex hydraulic processes. Building structures and contents, especially in residential buildings, occupy the dominant part of direct economic losses. Although physical damage to roads and electrical facilities is relatively lower, extra attention should be paid to them, owing to their intangible but substantial indirect impacts as lifelines. Our study implies that policies and actions for flood risk mitigation and management should be transformed from focusing on one type of flood to considering multiple types of coincident floods, in order to combine them in the life cycle of flood risk reduction and management.
Disclosure statement
No potential conflict of interest was reported by the authors.
Additional information
Funding
References
- Apel H, Martínez Trepat O, Hung NN, Chinh DT, Merz B, Dung NV. 2016. Combined fluvial and pluvial urban flood hazard analysis: concept development and application to Can Tho City, Mekong Delta, Vietnam. Nat Hazards Earth Syst Sci. 16(4):941–961.
- Berbés-Blázquez M, Mitchell CL, Burch SL, Wandel J. 2017. Understanding climate change and resilience: assessing strengths and opportunities for adaptation in the global South. Clim Change. 141(2):227–241.
- Bevacqua E, Maraun D, Vousdoukas MI, Voukouvalas E, Vrac M, Mentaschi L, Widmann M. 2019. Higher probability of compound flooding from precipitation and storm surge in Europe under anthropogenic climate change. Sci Adv. 5(9):eaaw5531.
- Chen AS, Djordjevic S, Leandro J, Savic DA. 2010. An analysis of the combined consequences of pluvial and fluvial flooding. Water Sci Technol. 62(7):1491–1498.
- Chinowsky P, Schweikert A, Strzepek N, Manahan K, Strzepek K, Schlosser CA. 2013. Climate change adaptation advantage for African road infrastructure. Clim Change. 117(1-2):345–361.
- Chinowsky PS, Schweikert AE, Strzepek NL, Strzepek K. 2015. Infrastructure and climate change: a study of impacts and adaptations in Malawi, Mozambique, and Zambia. Clim Change. 130(1):49–62.
- Couasnon A, Eilander D, Muis S, Veldkamp TIE, Haigh ID, Wahl T, Winsemius HC, Ward PJ. 2020. Measuring compound flood potential from river discharge and storm surge extremes at the global scale. Nat Hazards Earth Syst Sci. 20(2):489–504.
- Durrans SR. 1992. Parameter estimation for the Pearson type 3 distribution using order statistics. J Hydraul Eng. 133:215–232.
- Eilander D, Couasnon A, Ikeuchi H, Muis S, Yamazaki D, Winsemius HC, Ward PJ. 2020. The effect of surge on riverine flood hazard and impact in deltas globally. Environ Res Lett. 15(10):104007.
- Forman RTT, Wu JG. 2016. Where to put the next billion people. Nature. 537(7622):608–611.
- Friend R, Jarvie J, Reed SO, Sutarto R, Thinphanga P, Toan VC. 2014. Mainstreaming urban climate resilience into policy and planning; reflections from Asia. Urban Clim. 7:6–19.
- Ganguli P, Merz B. 2019. Extreme coastal water levels exacerbate fluvial flood hazards in Northwestern Europe. Sci Rep. 9(1):13165.
- Hallegatte S, Ranger N, Mestre O, Dumas P, Corfee-Morlot J, Herweijer C, Wood RM. 2011. Assessing climate change impacts, sea level rise and storm surge risk in port cities: a case study on Copenhagen. Clim Change. 104(1):113–137.
- Herdman L, Erikson L, Barnard P. 2018. Storm surge propagation and flooding in small tidal rivers during events of mixed coastal and fluvial influence. JMSE. 6(4):158.
- Iglesias V, Braswell AE, Rossi MW, Joseph MB, McShane C, Cattau M, Koontz MJ, McGlinchy J, Nagy RC, Balch J, et al. 2021. Risky development: increasing exposure to natural hazards in the United States. Earths Future. 9(7):e2020EF001795.
- IPCC. 2021. Climate change 2021: the physical science basis. Contribution of Working Group I to the Sixth Assessment Report of the Intergovernmental Panel on Climate Change. New York: cambridge University Press.
- Jalili Pirani F, Najafi MR. 2020. Recent trends in individual and multivariate compound flood drivers in Canada’s coasts. Water Resour Res. 56(8):e2020WR027785.
- Jane R, Cadavid L, Obeysekera J, Wahl T. 2020. Multivariate statistical modelling of the drivers of compound flood events in south Florida. Nat Hazards Earth Syst Sci. 20(10):2681–2699.
- Jongman B. 2021. Fraction of population at risk of floods is growing. Nature. 596(7870):37–38.
- Leonard M, Westra S, Phatak A, Lambert M, van den Hurk B, McInnes K, Risbey J, Schuster S, Jakob D, Stafford-Smith M. 2014. A compound event framework for understanding extreme impacts. Wiley Interdisciplinary Reviews-Climate Change. 5(1):113–128.
- Liu X, Huang Y, Xu X, Li X, Li X, Ciais P, Lin P, Gong K, Ziegler AD, Chen A, et al. 2020. High-spatiotemporal-resolution mapping of global urban change from 1985 to 2015. Nat Sustain. 3(7):564–570.
- Moftakhari HR, Salvadori G, AghaKouchak A, Sanders BF, Matthew RA. 2017. Compounding effects of sea level rise and fluvial flooding. Proc Natl Acad Sci U S A. 114(37):9785–9790.
- Muthusamy M, Rivas Casado M, Salmoral G, Irvine T, Leinster P. 2019. A remote sensing based integrated approach to quantify the impact of fluvial and pluvial flooding in an urban catchment. Remote Sens. 11(5):577.
- OECD. 2016. Financial management of flood risk. https://www.oecd.org/daf/fin/insurance/Financial-Management-of-Flood-Risk.pdf.
- Ouyang S, Xu CJ, Shao J, Guo W. 2019. Discussion on the analysis method of urban design rainstorm under the “new normal” of "city seeing the sea. IOP Conf Ser: earth Environ Sci. 344(1):012109.
- Paprotny D, Vousdoukas MI, Morales-Nápoles O, Jonkman SN, Feyen L. 2018. Compound flood potential in Europe. Hydrol Earth Syst Sci Discuss. 2018:1–34.
- Patra JP, Kumar R, Mani P. 2016. Combined fluvial and pluvial flood inundation modelling for a project site. Procedia Technol. 24:93–100.
- Rosbjerg D, Madsen H. 2019. Initial design of urban drainage systems for extreme rainfall events using intensity–duration–area (IDA) curves and Chicago design storms (CDS). Hydrol Sci J. 64(12):1397–1403.
- Shrestha S, Cui S, Xu L, Wang L, Manandhar B, Ding S. 2021. Impact of land use change due to urbanisation on surface runoff using GIS-based SCS–CN method: a case study of Xiamen City, China. Land. 10(8):839.
- Tanaka T, Kiyohara K, Tachikawa Y. 2020. Comparison of fluvial and pluvial flood risk curves in urban cities derived from a large ensemble climate simulation dataset: a case study in Nagoya, Japan. J. Hydrol. 584:124706.
- Tellman B, Sullivan J, Kuhn C, Kettner A, Doyle C, Brakenridge G, Erickson T, Slayback D. 2021. Satellite imaging reveals increased proportion of population exposed to floods. Nature. 596(7870):80–86.
- Wahl T, Jain S, Bender J, Meyers SD, Luther ME. 2015. Increasing risk of compound flooding from storm surge and rainfall for major US cities. Nature Clim Change. 5(12):1093–1097.
- Wake B. 2021. Buildings at risk. Nat Clim Chang. 11(8):642–642.
- Wang X, Xu L, Cui S, Wang C. 2020. Reflections on coastal inundation, climate change impact, and adaptation in built environment: progresses and constraints. Adv Clim Chang Res. 11(4):317–331.
- Winsemius HC, Aerts Jeroen CJH, van Beek Ludovicus PH, Bierkens Marc FP, Bouwman A, Jongman B, Kwadijk Jaap CJ, Ligtvoet W, Lucas PL, van Vuuren Detlef P, et al. 2016. Global drivers of future river flood risk. Nature Clim Change. 6(4):381–385.
- Xu L, He Y, Huang W, Cui S. 2016. A multi-dimensional integrated approach to assess flood risks on a coastal city, induced by sea-level rise and storm tides. Environ Res Lett. 11:014001.
- Xu L, Wang X, Liu J, He Y, Tang J, Nguyen M, Cui S. 2019. Identifying the trade-offs between climate change mitigation and adaptation in urban land use planning: an empirical study in a coastal city. Environ Int. 133(Pt B):105162.
- Xu L, Cui S, Wang X, Tang J, Nitivattananon V, Ding S, Nguyen Nguyen M. 2021. Dynamic risk of coastal flood and driving factors: integrating local sea level rise and spatially explicit urban growth. J Clean Prod. 321:129039.
- Yin J, Yu D, Yin Z, Liu M, He Q. 2016. Evaluating the impact and risk of pluvial flash flood on intra-urban road network: A case study in the city center of Shanghai, China. J Hydrol. 537:138–145.