
 ?Mathematical formulae have been encoded as MathML and are displayed in this HTML version using MathJax in order to improve their display. Uncheck the box to turn MathJax off. This feature requires Javascript. Click on a formula to zoom.
Abstract
The Himalayan Frontal Thrust (HFT) and the surrounding piedmont alluvial region represent a zone of active deformation in the Indo-Gangetic plains. We investigated the Piedmont zone between the Ghaggar and Yamuna River basins in Haryana, India, for geomorphic signatures of active tectonics using remotely sensed data and validated by Geophysical Ground Penetrating Radar (GPR) surveys. The possible locations and the types of active tectonic features such as sub-surface fault, ridges, lineaments and warps were identified based on the presence of geomorphic signatures such as drainage gradient anomalies, abrupt change in flow direction, river offset, compressed meanders, paleochannels and topographic breaks. We used various optical satellite imageries to detect and map the temporal changes in the flow pattern of rivers in the study area. GPR investigations were done at selected test sites to locate and verify the continuity of subsurface fault. The GPR profiles were taken in the North-South direction using the common midpoint technique with 40 and 100 MHz antennae. Low frequency bi-static GPR scanning confirmed a number of dipping reflectors due to fault planes and warp surfaces in the study area. It is concluded that the piedmont zone of Haryana is actively deforming and could become a future seismic hazard zone.
Introduction
The rise of the Himalayan mountain belt is result of the collision of the Indian tectonic plate with Eurasia. The Indian plate has been under thrusting beneath Eurasia since the closing of the Tethys Sea in the early Tertiary, and the mountain-building deformation front has moved southward from the initial collision contact at the Indus-Tsangpo Suture Zone (ITSZ) by processes that transfer Indian crust to the overriding plate. The deformational front gradually shifted along the Main Central Thrust (MCT), Main Boundary Thrust (MBT) and at present it is along the Himalayan Frontal Thrust (HFT) and its surrounding region (Joshi and Patel Citation1997; Valdiya Citation2001; Champel et al. Citation2002; Patel and Kumar Citation2003; Pant and Paul Citation2007; Roy and Mondal Citation2012; Goswami and Deopa Citation2013). The active HFT marks the present day physiographic and tectonic boundary between the Himalayan mountain belt and the Indo-Gangetic plains (Thakur et al. Citation2010). It is postulated that the active deformation is propagating further south of the HFT to the 10–50 km wide piedmont zone of the Indo-Gangetic alluvial plains (Shukla and Bora Citation2003; Yeats and Thakur Citation2008).
Several geomorphological and ground penetrating radar (GPR) studies in the piedmont zone revealed many active faults south of the HFT trending parallel as well as transverse to the Himalayan strike (Valdiya Citation1976; Parkash et al. Citation2000; Thakur and Pandey Citation2004a; Bhosle et al. Citation2007; Yeats and Thakur Citation2008; Goswami et al. Citation2009; Malik et al. Citation2010; Goswami Citation2012; Goswami and Deopa Citation2013). Abrupt rise of surface (Thakur Citation2004; Thakur and Pandey Citation2004b; Yeats and Thakur Citation2008) and rise of younger hills (Malik et al. Citation2010) in the piedmont zone are described as a result of movements along the Frontal Piedmont Thrust (FPT). The growing FPT and active tectonic features such as faults in the piedmont alluvial zone take up a significant part of convergence of the Himalayan orogen. The Delhi Hardwar Ridge (DHR) also controls the active tectonics of the area in a major way by subducting beneath the Siwalik and lesser Himalayan rocks (Sahoo et al. Citation2000). Nevertheless, the Plio-Quaternary evolution of the Himalayan Piedmont zone of Haryana in NW India is poorly constrained, and the sense of movement in Quaternary times remains a matter of debate (Nakata Citation1972; Citation1989; Kumar et al. Citation2001; Valdiya Citation2001). Geological evidence of active faulting is limited to the FPT.
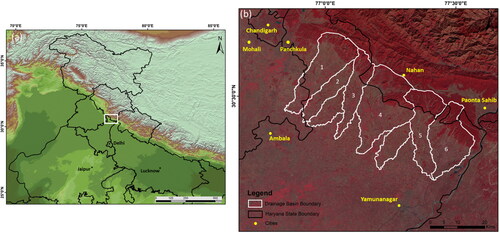
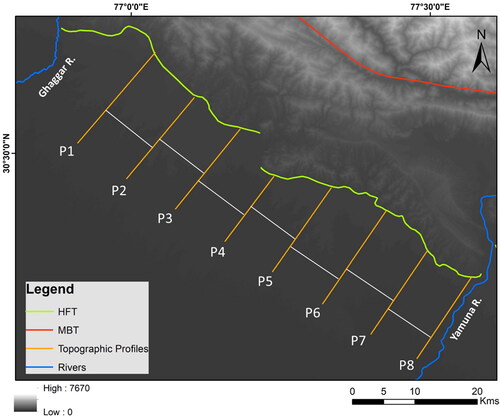
The objectives of the study are to document the tectonic geomorphology of active tectonic deformation in the Himalayan Piedmont zone of the Haryana and Punjab state, NW-India and the geometry of the active tectonic features. The study focuses in the Piedmont alluvial plains and covers parts of Panchkula, Ambala and Yamunanagar districts of Haryana and Mohali district of Punjab state (). The Himalayan Piedmont zone of the present study area is one of the tectonically active regions in Haryana and Punjab as it lies in the seismic zone IV of the seismic zonation map of India. These areas have experienced many seismic events and tremors in the recent past. The present study attempts to understand active tectonic deformation and their geometry by analysing four geomorphic indices and GPR studies in six basins in the Himalayan Piedmont zone of the Haryana and Punjab. These four geomorphic indices and GPR studies were combined to characterize tectonic activity and the geometry of the active tectonic features of the area.
Figure 1. Landsat (OLI) image depicting the study area in the Piedmont zone basins starting from the left (1) Tangri, (2) Balaiali, (3) Begna, (4) Markanda, (5) Somb, and (6) Pathrala.
Geology, geomorphology and seismotectonics
The study area is a part of the tectonically formed Himalayan foreland basin. It is bounded by the Ghaggar River in the west and the Yamuna River in the east (). It is covered by the recent Quaternary sediments brought down by the rivers from the Himalayan belts and from the peninsular India. The maximum thickness of the Quaternary sediments deposited is about ∼ 4.5 km (Goswami and Deopa Citation2013). The piedmont plains are composed of coarse textured, poorly sorted sediments brought down by the streams. The alluvial deposits are made up of sand, silt and clay intermixed with calcareous concretions (kankar) and pebbles in varying proportions. The Quaternary alluvium deposits can be divided into two chronostratigraphic units: (i) Older alluvium and (ii) Newer alluvium (Patel and Thakur Citation2000). The Older alluvium is formed by the depositional processes of the pre-existing palaeo-drainage of Middle to Upper Pleistocene period, comprising admixture of reddish clay, silt, sand with kankar, grey medium to coarse calcareous sand with kankar and sub-rounded to sub-angular unsorted pebble, gravel and cobble beds. The Newer alluvium is formed of present day streams, representing Holocene/Recent period. It is chiefly composed of blue to white-grey micaceous sand with alluvium inter-bands of purple and red clay.
Figure 2. Geomorphological map of the study area prepared with files provided by BHUKOSH portal of Geological Survey of India (GSI).
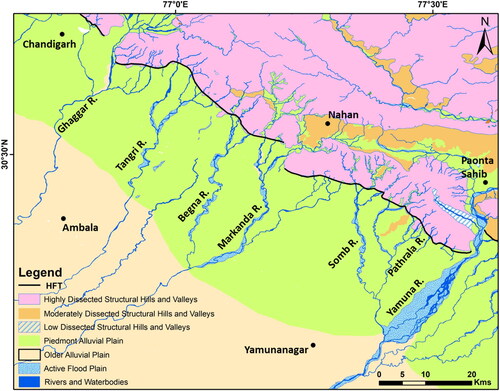
Geomorphologically, the area comprises four major geomorphic units viz. dissected structural hills of Siwalik, Piedmont alluvial plains, older alluvial plains, and active flood plains (). In the Sub-Himalayan zone where the Siwaliks are directly exposed, the dendritic drainage pattern is predominant and its density is high. On the other hand, the parallel pattern dominates in the area where new alluvial deposits cover the Siwaliks. In the plain, the streams emerging from the Siwalik ranges, display coarse texture and rough drainage due to the gentle inclination of the Piedmont fan deposits, on which most of the rivers flow intermittently. Parallel drainage pattern is the most typical in these zones. The important rivers that contribute to making Piedmont alluvial plains are Ghaggar, Markanda and Yamuna along with their tributaries such as Tangri, Begna and Somb, respectively.
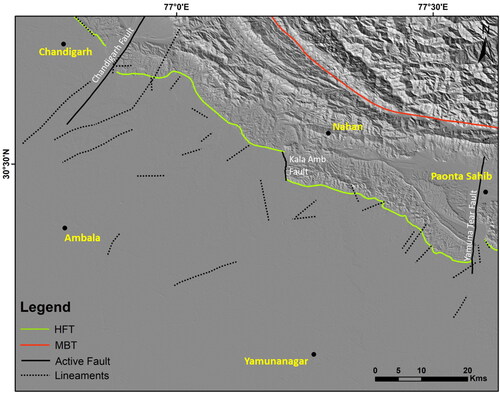
Tectonically, the study area is bounded by the HFT in the north and the vast Central alluvial plains in the south. It is a part of the central seismic gap lying between the rupture zones of 1905 Kangra earthquake in the northwest and 1934 Bihar–Nepal earthquake in the southeast having high probability for large magnitude Himalayan earthquakes (Khattri and Tyagi Citation1983; Bilham et al. Citation1998; Rawat et al. Citation2022). It is associated with several transverse faults and tectonic alignments which facilitate on-going tectonic activity in the region (). Some N-S verging faults dissect the frontal thrust in many places viz. Chandigarh Fault, Kala-amb Fault, and Yamuna Tear Fault, from west to east. According to Yeats and Thakur (Citation2008), piedmont fault is exposed near Solani basin south of HFT namely Solani fault formed due to northward movement of Indian plate. This fault is considered to be the most recent fault parallel to HFT.
Figure 3. Major faults and lineaments present in the area deaped over SRTM 30 m DEM based hillshade image. (Modified from BHUKOSH portal and Seismotectonic Atlas of GSI, 59th publication, 2000).
The region passes through the seismic zone IV of the seismic zonation map of India. Seismic activity data and trends of seismicity of last 50 years of the region are available on the Data Portal of the National Centre of Seismology (NCS) and could be requested through the website (https://seismo.gov.in/) as listed in .
Table 1. Earthquake epicentres data around the HFT and Piedmont alluvial zone of Haryana.
Materials and methods
In this study we used different types of multispectral satellite images, which have different resolution and optical properties. The variation in the resolution of the selected images would cause uncertainty in the analysis and hence resampled to the same resolution. The processed images are Resourcesat LISS-III (23.5 m), Landsat 4-5 TM, Landsat 8 OLI (30 m) and Cartosat-1 PAN ortho image (2.5 m). A unified False Colour Composite (FCC) image for the study area was prepared by mosaicking different Landsat TM FCC images. Landsat multispectral images with a spatial resolution of 30 m were used for studying dynamic changes in the drainage system. Geological data such as lithology, geomorphology and structures (faults/lineaments) were collected from the BHUKOSH online portal of GSI (http://bhukosh.gsi.gov.in/Bhukosh/MapViewer.aspx). In the present study, Shuttle Radar Topographic Mission (SRTM) DEM of 30 m resolution was used for topographic analysis and geomorphic mapping of active tectonic features in the Piedmont alluvial plains. The DEM is available in geographic (lat/long) projection system with the WGS84 horizontal datum and the EGM96 vertical datum. The SRTM data is processed in Arc GIS (10.3) environment.
Morphometric analysis
Surface topographic profiles and geomorphic indices are widely used to monitor for tectonic influences (Delcaillau et al. Citation2006; Singh and Tandon Citation2008; Tsodoulos et al. Citation2008; Chatterjee et al. Citation2019; Özkaymak and Sözbilir Citation2012; Giano and Schiattarella Citation2014; Zygouri et al. Citation2015; Dey et al. Citation2016; Różycka et al. Citation2021). Morphometric analysis reveals the drainage basin’s hydrogeological conditions and tectonic setting (Das and Gupta Citation2019; Rawat et al. Citation2022). In this study, the geomorphic indices used are sensitive to tectonic deformation, which help to quantify the active tectonics:
Stream length gradient (SL) index
The deformation due to active tectonics in an area changes the stream length gradient. Stream gradient is measured by stream length (SL) gradient index. SL index is sensitive to active tectonics in an area. Commonly, high SL index values are present where rivers cross hard rocks and reflect relatively high tectonic activity, while low SL index values indicate relatively low tectonic activity (Hack Citation1973; Keller and Pinter Citation2002). Thus, the SL index helps to investigate the recent tectonic activity (Kellar and Pinter Citation2002). It shows the relationship among tectonic activity, rock resistance and topography.
The stream-length (SL) index is given by:
where ΔH = change in elevation, ΔL = length of channel segment. L is the total length of the channel from its source to the midpoint of the particular segment.
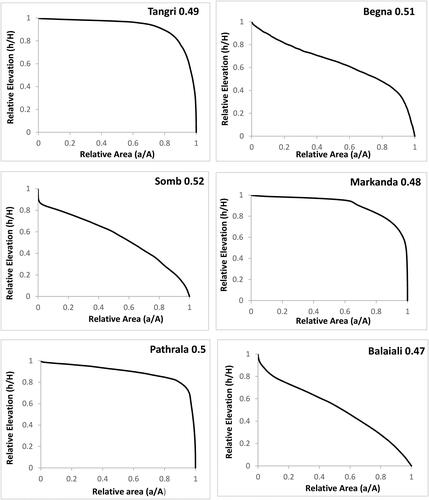
Hypsometric curve & hypsometric integral (HI)
The hypsometric curve describes the elevation distribution in an area ranging from one simple drainage basin to the entire planet, independent of the size of the basin. The hypsometric curve is created by plotting the relative basin height (h/H) against the relative basin area (a/A) (Keller and Pinter Citation2002). The total height represents the relief of the area (maximum elevation – minimum elevation). The total surface area of the basins is the sum of the area between each pair of adjacent contour lines. The area (a) is the surface area within the basin above a given elevation (h). The value of relative area (a/A) always varies from 1.0 at the lowest point in the basin to 0.0 at the highest point in the basin.
The hypsometric integral is used to distinguish the shape of the hypsometric curve; it is defined as the degree of dissection from the sub-basin to the whole basin. Different characteristic shape of hypsometric curve represents different types of landforms (Strahler Citation1952) and to study the influence of varying factors like tectonics, climate and lithology on landform evolution. The area under the hypsometric curve is the hypsometric integral (HI). A high HI is attributed to the younger stage that infers rugged relief or deep incision. The moderate HI is explained as the mature equilibrium stage, whereas the lower HI values imply the older stage.
The hypsometric integral has been calculated using the equation (Pike and Wilson Citation1971; Keller and Pinter Citation2002):
where is the hypsometric integral,
is the average elevation,
and
is the maximum and minimum elevation in the basin, respectively.
Asymmetry factor (AF)
An asymmetry factor is a tool used to identify the tilting direction of a basin (Hare and Gardner Citation1985; Keller and Pinter Citation2002). Stream networks that flow in equilibrium settings have the AF value close to 50, whereas the value greater or less than 50 represents tectonic tilting (Keller and Pinter Citation1996). The AF is determined by the formula
where
is the area to the rightside basin facing downstream, and
is the basin’s total area.
Mountain front sinuosity (Smf)
Mountain front sinuosity index (Smf) balances between tectonic uplift and erosional processes. It is defined as Lmf/Ls where, Lmf is the length of the mountain front along the foothill of the mountain and Ls is the straight line length of the mountain front. Smf describes the degree of denudational modification of the tectonic contact (Bull and McFadden Citation1977). Lower values of Smf index indicate relatively active mountain fronts, while higher values signify a relatively moderate to less/inactive mountain fronts (Burbank and Anderson Citation2001; Keller and Pinter Citation2002). In case of active mountain fronts, tectonic uplift is dominant over the erosional processes, which gives rise to straight mountain fronts with Smf values close to 1.0. Generally, Smf values less than 1.4 imply tectonically active mountain fronts (Rockwell et al. Citation1984; Keller Citation1986).
Ground penetrating radar (GPR)
GPR survey is a high resolution, non-invasive geophysical measurement method that allows the investigation of the shallow sub-surface on the basis of dielectric properties of the layers. GPR is an important tool ideally suited for obtaining high resolution profiles of the sub surface over a depth range of a few metres to several tens of metres with a vertical resolution of a few tens of centimetres to a metre (Basson Citation2000; Knight Citation2001). GPR studies have been conducted to detect the near-surface Quaternary deformations, near-surface faults in unconsolidated sediments, palaeoliquefaction-tectonic deformations, and earthquake subsidence events (Maurya et al. Citation2005). GPR is ideally suited for detecting and imaging geological features between the surface and a depth of several tens of metres, to construct a complete picture of subsurface features caused by earthquakes and other tectonic events.
GPR uses a high-frequency (MHz) electromagnetic wave to detect electrical discontinuities in shallow subsurface earth material. When georadar waves propagate down into the earth’s surface, they are refracted and reflected back to the surface, depending on the lithological composition of rocks. The quantity of reflected energy increases as the contrast in the subsurface layers increases, as measured by the reflection coefficient, R, which is determined by the contrast in relative velocities as well as the contrast in relative dielectric constants:
where, V1 and V2 are relative velocities, and ε1 and ε2 are the adjacent layers’ relative dielectric constants. The velocity of the medium (V) is determined by the velocity of light in air (0.3 m/ns) and may be calculated using the following formula:
Results and interpretation
This research aims to quantify the tectonic activities in the study area and prepare an anomaly map to identify the locations showing tectonic control in the geomorphic evolution of the region. Morphometric indices were used for all six basins in the current study to evaluate the relative tectonic activity of the Haryana Piedmont plains.
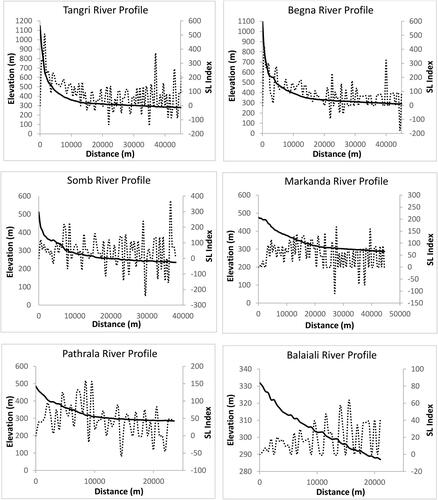
Longitudinal Profile and SL index analysis are carried out in GIS environment using the SRTM-DEM with a resolution of 30 m, for six major streams present in the Piedmont zone to investigate the control of neotectonics on the development of geomorphic landscapes. Most of the rivers in the study area show an increase in the SL values at the downstream section () and thus are indicators of areas undergoing uplift. It indicates the tectonic influence around the area as the SL index value suddenly increases. High SL index value at the mouth of the river could be related to the recent tectonic activities of the HFT. Somb basin shows the highest value of SL and thus suggests a highly active basin. Around four high SL index peaks are identified on the longitudinal profile of the Somb river. Tangri and Begna drainages also show a similar pattern, where the SL value reaches more than 200, first in the HFT region and then again in the lower reaches in the piedmont zone. Other basins Balaiali, Markanda, and Pathrala show moderate SL index values (100–150) and represent basins affected by moderate tectonic activity. There are several segments in all river basins with prominent knick points with high values of SL index downstream of the Siwalik hills that suggest the presence of several unidentified structures/faults in the Piedmonts. The longitudinal profile of the rivers shows presence of major knick points, which corresponds to the significant breaks in the distal part of the alluvial fan.
Figure 4. Longitudinal river profiles with SL index for Tangri, Begna, Markanda, Somb, Pathrala and Baliali river basins, respectively.
The Hypsometric curve describes the drainage development stage of basins. In the present study, HI varies from 0.47 to 0.52 and the hypsometric curves show a sigmoidal shape, which allowed us to infer, all basins are in their mature or early mature stages (). It is clearly visible that the shape of the curves varies for different basins whereas the basins of same segment have nearly similar shape of hypsometric curve. All over, the hypsometric curves have sigmoidal shape that suggests moderately eroded landscape and the early mature stage of cycle of fluvial erosion. Somb basin has the highest HI value (0.52), followed by Begna and Pathrala basins.
Figure 5. Hypsometric curve and hypsometric integral calculated for six drainage basins in the study area.
The Asymmetry factor is an aerial parameter that tells information about the tilt direction. Results suggest that nearly all the basins in the study area show tilting either towards left or towards right (). Tangri and Balaiali basins are tilted in the east direction as they show the AF values 59.7 and 57.29, respectively, which are more than 50. The AF values for Begna, Markanda, Somb and Pathrala basins are 32.67, 46.27, 41.71 and 45.61, respectively, suggesting the basin tilt direction is westward.
Table 2. Asymmetry factor (AF) value showing the tilt direction of the basins.
Mountain front sinuosity (Smf) ratios for different segments of the study area are calculated to identify tectonically active segments. Depending upon the orientation of the mountain front, these have been divided into 10 segments (). The influence of tectonic activities can be deciphered from the low values of mountain front sinuosity (Smf). All the segments yield very low values of Smf, ranging between 1.15 and 1.67 () suggesting that the mountain front is active.
Figure 6. Different segments (S1–S10) of the mountain front on which Smf is calculated using the hillshade of the study area.
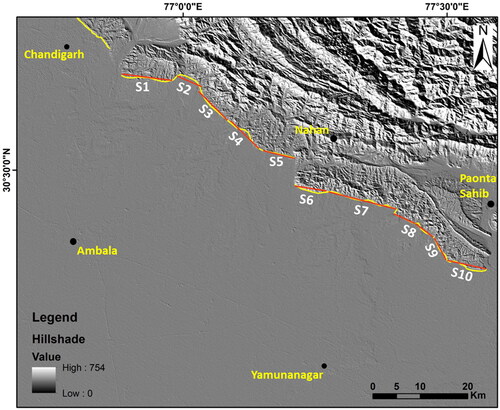
Table 3. Mountain front sinuosity values (Smf) calculated for 10 segments along the Himalayan front.
Geomorphic observations and field checks
Using geomorphological signatures such as break in slope in topography, drainage anomaly, drainage shift and river terraces; active fault along the frontal region can be identified (Pati et al. Citation2011). Many authors suggested the piedmont region to be tectonically active region by morphometric analysis (Bull and McFadden Citation1977; Wells et al. Citation1988; Thakur and Pandey Citation2004a; Kirby and Whipple Citation2012; Joshi and Kotlia Citation2018), OSL dating (Parkash et al. Citation2000; Singh and Tandon Citation2008) and validated through trenching.
Drainage properties can be well diagnosed by image interpretation method. Detailed categorization of drainage pattern can attribute each pattern to specified terrain settings. However, there can also be many distortions in expected drainage pattern. These distortions or anomalies are widely observed in the study area.
Drainage pattern is highly sensitive to topography especially in foothill regions. Weak planes attribute to the change in drainage pattern in plain areas (Bhosle et al. Citation2009). Active tectonic features affect the regular pattern of drainage flow resulting anomalous segments. Drainage system in the area is highly controlled by major and minor structures. Various drainage anomalies identified in the area include drainage shift, rectilinearity, right angled bend, compressed meanders and presence of paleo/abandoned channels.
The tributaries of Ghaggar, Yamuna and seasonal streams debouching into the piedmont zone from the Siwaliks show various evidences, which are characteristic of tectonically controlled evolution of landscape in the region. Fluvial anomalies like abrupt changes in flow direction, anomalous river flow, high sinuosity and entrenchment along the courses of rivers can be clearly observed on Cartosat-1 PAN ortho image ().
Figure 7. Cartosat-1 PAN ortho images showing fluvial anomalies observed along the course of rivers and seasonal rivulets debouching from Siwalik hills. Drainage anomalies viz. rectilinearity, river segment anomalies, river offsets bends, and lineaments are marked by black dashed line.
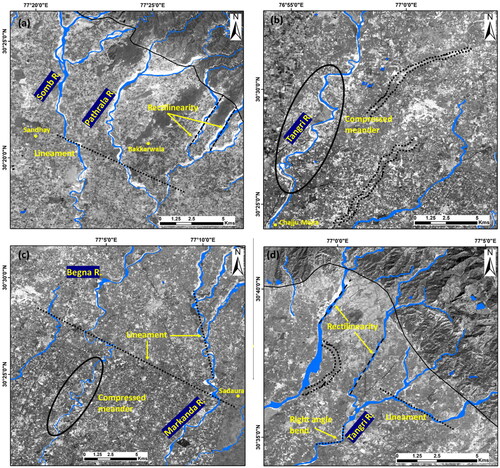
Tangri or Dangri is a tributary of the Ghaggar River that rises in the Morni Hills of south-eastern Himachal Pradesh and flows towards south along the Haryana-Punjab border (). It is observed that normally flowing Tangri River exhibits anomalous compressed meanders abruptly in a restricted domain () before entering the Ambala city of Haryana. These types of compressed meanders have been demonstrated to be indicative of active tectonics. Balaiali is an eastern tributary of the Tangri river which originates near the south of the Morni hills and flows up to the Chajju Majra village where it unites with the Tangri river. It is relatively smaller in length compared to other rivers. Two abandoned channels are present in between Tangri and Balaiali ().
The Markanda river flows across the piedmont region after debouching from the Siwalik hills through Kala Amb town, forming a large alluvial fan (Patel and Thakur Citation2000). It is observed that the main channel of the Markanda river, which flows in southeast direction, suddenly gets deflected near Sadaura town and starts flowing in southwest direction (). A paleochannel of the Markanda river, towards its west, has been abandoned and there has been vegetal growth in it since its abandonment. Fluvial landforms deposits such as mid channel bars, straight channel form, vertical erosion and braided channels are observed in the area ().
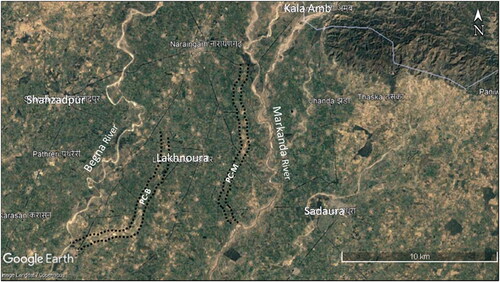
Begna river is one of the main tributaries of Markanda river, which has an abandoned channel towards the east of the present channel. The Begna river flowing in the southwest direction takes a sharp right angle turn near Shahzadpur village to change its course in southeast direction towards Lakhnaura ().
Figure 8. Google Earth imagery of the Markanda and Begna rivers showing their present channel and the paleochannels. PC-M and PC-B are the older paleochannels of the Markanda and Begna rivers, respectively.
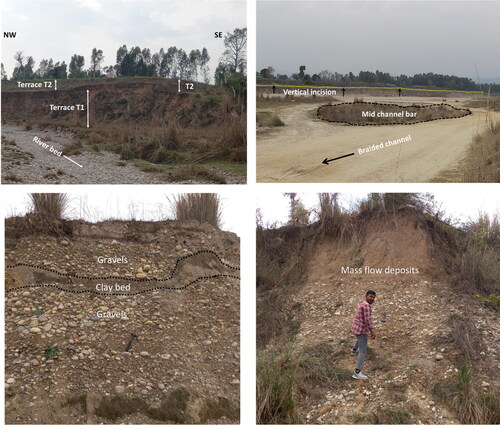
The Somb river is a tributary of the Yamuna river (), which originates in the Dhanaura range and flows in the eastern boundary of the Haryana piedmont zone. It enters the piedmont zone through Adi badri village in Haryana. There have been development of two sets of unpaired fluvial terraces; named as T1 and T2; reported along the Somb river near Sandhay village (). These terraces are formed due to episodic upliftment of the alluvial fan and subsequent down cutting of the rivers. Most of terraces are present in Somb and Begna rivers.
Figure 9. Field photographs showing evidences of recent tectonics in the Piedmonts: (a) Unpaired river terraces of Somb river, (b) vertical incision of river valley and mid channel bars in the present channel of Markanda river, (c) clay and gravel alternating layers with bend in clay bed, and (d) recently deposited mass flow debris in front of piedmonts.
Topographic breaks
The region south of the HFT shows very gently slope with major drainages incised into plane. We found fluvial terraces or structural highs along the rivers across the mountain front in the area, which are records of active tectonics. Topographic profiles show offset in various locations showing significant break of 5–7 m. In piedmont alluvial region, the signatures of active tectonics are quickly obliterated by physical processes of weathering and erosion. However, the remnants of topographic scarps, bumps and linear depressions can be used to identify active faults, warps and tectonic alignments, respectively. For this purpose, transverse (∼NE-SW) topographic profiles were prepared using high resolution SRTM (30 m) DEM (). All terrain profiles are taken in piedmont area in all basins, in transverse direction in order to understand and quantify the marked differences in elevation within the basin.
Figure 10. SRTM 30 m DEM based transverse topographic profiles (perpendicular to HFT).
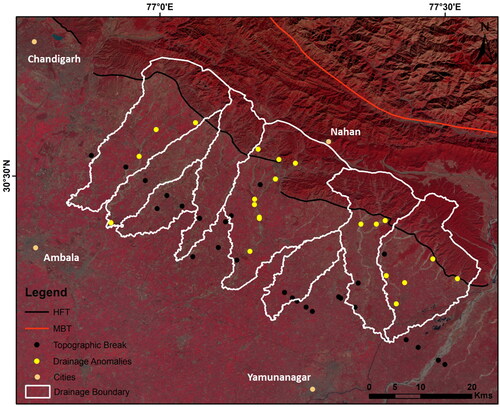
From the topographic profile analysis, the upliftment of alluvial fans in the distal part is quite evident and is marked by NW–SE trending, south facing scarps suggesting fore-landward propagation of tectonic activity in the Piedmonts (). Due to uplift caused by upwarping, topographic highs of 5–7 m are observed in the piedmont region, which has led to the migration of the sub-parallel rivers emerging from the Siwalik hills. However, these raised geomorphic surfaces/highs are not continuous and are preserved in isolated outcrops. An anomaly map has been prepared showing the locations of fluvial anomalies and topographic breaks in the drainage basins ().
Figure 11. Potential locations of active tectonic features (fault scarps, lineaments) based on subtle topographic breaks unrelated to piedmont slope.
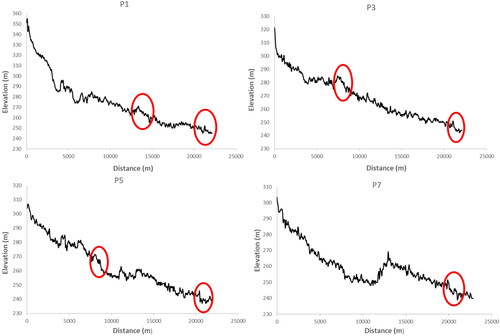
Figure 12. Anomaly map showing locations of drainage anomalies and topographic breaks in the study area. (Landsat TM standard FCC mosaic is used as background).
Distribution of earthquake
Major parts of Haryana state fall under seismic Zone-IV. Most of the earthquakes in this region originate at shallow depth, though a few earthquakes recorded from this region originated from intermediate depth. Earthquake epicentres from the study area are plotted on the map showing faults and lineaments (). It is observed that the region between the Kala Amb Fault and Yamuna Tear Fault is quite active.
Figure 13. Spatial frequency distribution of historical seismicity and abundance of active tectonic features in the Himalayan foothills and piedmont region in and around HFT.
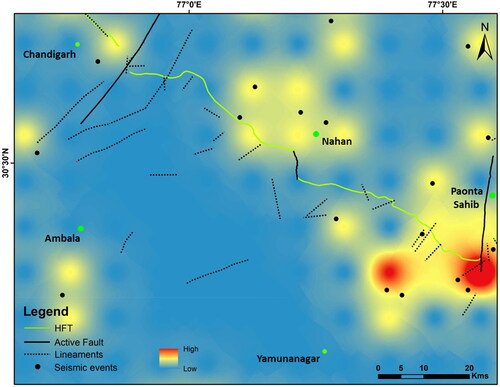
A geographical frequency distribution pattern for historical earthquakes with magnitudes (Mw) >2.5 is prepared. To do this, a spatial frequency map was initially created on 10 km × 10 km grids, which was then interpolated using the moving average point interpolation method and the inverse distance weight (IDW) algorithm. The spatial frequency distribution pattern is overlain with previously mapped major active tectonic features such as faults and lineaments. The map has been delimited up to the north of the HFT to highlight spatial frequency distribution pattern of historical earthquakes in and around the HFT particularly in the piedmont alluvial region. High spatial frequency distribution of previous seismicity is observed in and around Yamuna, Somb and Pathrala drainage basins which corroborates the results inferred from the geomorphic indices.
Discussion
The river system analysis is an important tool for studying the tectonic geomorphology as they are capable of adjusting to the crustal deformation that takes place over periods of centuries to decades (Keller and Pinter Citation2002). It is well established fact that large rivers follow the pattern of the basement structures, indicating that younger alluvium has been impacted by inherited underlying fault system (Sirocko et al. Citation2002; Gawthorpe and Leeder Citation2008; Brandes et al. Citation2011; Ramkumar et al. Citation2017). Thus, the sensitivity of the six major streams in the Himalayan piedmont zone of Haryana has been analysed using the morphometric and morphotectonic parameters. The DEM analysis and surface profiles across the Himalayan strike, covering the entire width of the Piedmont zone of Haryana, has helped in identification of different geomorphic surfaces of the area. The basins exhibit features indicating strong maturity level along with certain features of rejuvenation and immaturity. Rejuvenation of relief in the recent past is also indicated by gullying in some of the basins. Recent neotectonic activity in the form of uplift and some tilt rejuvenated the basins to develop several features of immature basin. The tectonic uplift has resulted in distinct eastward and westward tilt of the ground surface in areas located on eastern and western sides of the water divide, respectively. Moreover, the region witnessed differential uplift and tilting of different blocks influencing drainage pattern of individual river basins. The contact between the distal part of alluvial fans and central alluvial plains is marked by a sharp topographical break and series of knee-bend turn in streams defining a fault/lineament, which coincides with the Piedmont Fault (PF) and Najibabad Fault (NF).
The Quaternary piedmont deposits along an NW-SE trending corridor in the region are extensively incised that may be attributed to local increase in either river down cutting or/and neotectonic activity. Yeats and Thakur (2004) suggest the presence of the PF to the south of the HFT, towards Solani area; and extend it up to Chandigarh. This PF might have resulted in the growth of an uplifted surface in the piedmont zone of Haryana. The results of SL index analysis of streams arising on the Siwalik hills support the presence of an unidentified structure to the south of the HFT as prominent knick points and high SL index values are observed corresponding to it. Also, the field investigations show presence of deformed sediments in this zone. Thus sedimentary structures and the deformational imprints in the piedmont sediments faithfully portray the structural evolution of the terrain during the Quaternary Period.
The rivers appear to be migrating mostly along the upwarped zone in the study area. The upwarping is E-W trending parallel to the Himalayan strike, causing the shift in the course of the rivers. The majority of the rivers in the study area exhibit an increase in SL values at the downstream section, which serves as a sign of uplift in those places. Movement might have taken place after the deposition of the earliest alluvial fans and followed by the movements along the northerly trending faults. Some of the old piedmont zone terraces have been elevated as a result of this second phase of movement. With increasing subsurface folding and faulting, the geomorphic landscape changes, and the river flowing across the axis of deformation must incise the uplifted area. If the river lacks sufficient power for the incision, it deflects off its course and moves to a lower point along with the deformation where it is able to maintain its gradient (Anderson and Burbank Citation2011). The rivers in the Haryana piedmont zone have effectively recorded the changes in the topography.
The upliftment is in the distal part of the alluvial fan () and this upwarped zone may be attributed to the presence of a sub-surface blind fault in line with the PF and NF. The main characteristic of this upwarped zone is the drainage, which emerges from the distal part of the alluvial fan, and two rivers, i.e. the Sarasuti Nadi and Chautang Nadi, are flowing from the upwarped zone, and dendritic drainage pattern has been developed here. Braided channels, mid-channel bars, straight channels are other results by influence of the recent tectonics in this region. Development of associated bends in the clay beds at Bakkarwala village () could most possibly be the result of deformation due to seismic activity as the other factors responsible for deformation are absent and the site is located close to the Yamuna Tear fault.
Figure 14. Elevation profile of the uplifted part of study area (NW-SE), from east the Pathrala and Somb rivers are present and towards their west is an uplifted zone with ∼25-30 m uplifted block along the paleochannels of the Nakti and Vedic Saraswati rivers. The PC-N1 and PC-N2 are the paleochannels of Nakti river, which has abandoned its course and has shifted towards the west; PC-Y is the paleochannel of the Yamuna river.
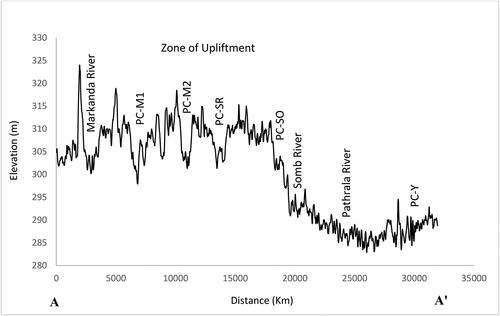
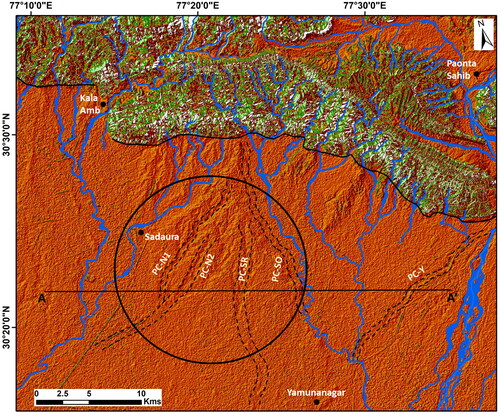
Using Cartosat data, the hill shade DEM of the study area is created to analyse the elevation in the paleo-channels of rivers. The piedmont zone has been upwarped, with a 10- to 12-km-wide upwarped bad land zone trending parallel to the Himalayan strike. Unpaired river terraces, which formed during the course of upliftment, suggest that the continuous shifting of the channel is mainly due to tectonic instability in the region. Evidence of the paleo-flow can be inferred from the abandoned channels and small abandoned tributaries. It has implications on the Markanda, Somb and Yamuna rivers that were once tributaries of the mighty Saraswati river.
It is clear from the shaded relief map of the uplifted zone that the Nakti river (a tributary of the Markanda river) has moved towards the west whereas the Markanda, Somb, and Yamuna rivers have moved towards the east (). The rivers have shifted their courses in response to the upliftment in the piedmont zone and have been exhibiting a migration pattern.
Figure 15. Shaded relief map of the uplifted zone of study area, PC-N1, and PC-N2: Nakti river paleochannels, PC-SR: Saraswati river paleochannel, PC-Y: Yamuna river paleochannel. The solid black circle represents the central axis of the uplifted zone.
GPR investigations
Topographic profiles suggest that there is a significant topographic break across the piedmont plains and the southern side of the fault has gone down relative to the northern side by about 5–7 m. However, no significant sub-surface structure has been reported in the region before except for a few lineaments (). Therefore, GPR surveys have been conducted and profiles are obtained at some of the prospective locations based on spatial co-occurrence of geomorphic anomalies. Electrical poles, mobile phones and heavy traffic were avoided as it could introduce noise to the radar signal. Normal processing steps have been adopted for post processing of radar profiles. Low pass space domain along with time domain filters are applied to the profiles in order to obtain the probable penetration depth and orientation of the fault in the area. For different sites, the penetration depths are variable between 25–40 m depth for 40 MHz and 10–15 m depth for 100 MHz antenna.
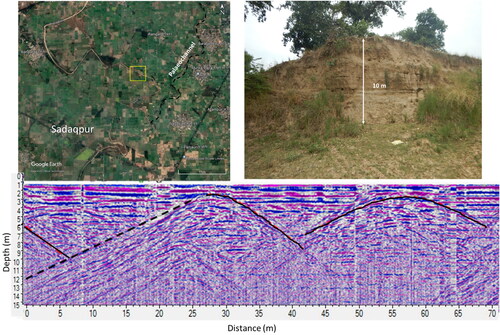
Site1 (Sadaqpur village)
GPR profiling was carried out across the Begna river bed near Sadaqpur village for subsurface fault study. The area lies in one of the oldest piedmont regions with uplifted topography and river offset (). The topographic offset of approximately 10 m is observed in the area. Therefore, a N-S profile is taken using 100 MHz antenna for identifying the structure underneath. The profile shows a depth up to 15 m. Centre frequency of 100 mHz monostatic GPR antenna (GSS1 manufacture) has been used for data acquisition. The 2-D profile reveals prominent inclined discontinuities geo-radar reflections between 20–30 and 50–60 m, respectively. Considering the angle of dip in the 2-D profile, it can be suggested that the deformation is due to movement from NE to SW along a low angle thrust fault. Discontinuity and warping of the reflectors along more than one inclined reflection may suggest splays of branching faults from the main fault ().
Figure 16. (a) Survey site selected in Begna river bed near Sadaqpur village in Haryana where the stream takes right angle bend, (b) abrupt topographic break of about ∼10 m (possible location of fault) striking – northwest and (c) GPR Profile is 70 m long, oriented north-south; 2-D radargram shows possible locations of faults and warped surfaces marked in black lines.
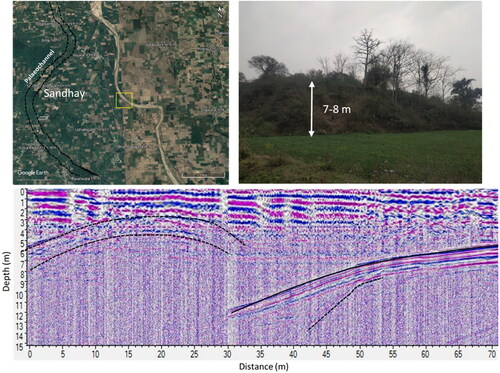
Site 2 (Sandhay village)
Somb river shows a number of anomalies in its course of flow comprising rectilinearity in the segment near Muglawali village in Haryana and development of compressed meanders and two set of terraces near Sandhay village of Yamunanagar (). Eastward shift in channel is also identified analysing data of Landsat series. Therefore, GPR survey has been carried out in this site to decipher the structural control over the landforms development. The profile shows a sharp truncation in layers between 30 and 50 m, indicating a major fault surface dipping in northward direction. The fault shows discontinuous sediment layers in the profile (). The sediment layers north of fault plane show warped surface which is associated with the main fault.
Figure 17. (a) Survey was done in Somb river near Sandhay village of Haryana in NE-SW direction (b) a significant topographic break of about 7-8 m abutting against a palaeochannel and (c) GPR profile for the site using 40 MHz antennae. 2-D radargram profile indicate traces of fault marked in solid black lines dipping towards northern side. A warped surface could also be seen before the fault line.
By visual interpretation of 2D GPR profiles (radargrams), we identified subsurface signatures to confirm active tectonic features. The GPR results reveal clear evidence of upwarping/faulting at several locations. The presence of north dipping layers is revealed by GPR measurements obtained near the geomorphic anomalies at Sadaqpur and Sandhay villages. The presence of a sub-surface fault similar to Piedmont Fault, one of the most notable tectonic features known in the region, could explain the north dipping layers.
The rapid uplift caused by the tectonic PF is forcing the rivers to change their courses. Thakur and Pandey (Citation2004b) and Yeats and Thakur (Citation2008) demonstrated that PF is the next emergent fault branching from the HFT in the Himalaya. The strikes of the PF in the Mohand piedmont zone, NF in the Kotdwar area and the blind fault in the Haryana piedmont zone are similar. The PF, NF and blind fault in Haryana may be different segments of the same fault separated by the Ganga Tear Fault and Yamuna Tear Fault, respectively, and may merge in one in the future. According to Gawthrope and Leeder (Citation2008), the incipient faults grow as independent segments and merge into a single fault as the segments propagate. The blind faults pose a significant seismic hazard. A blind thrust fault, interpreted in the subsurface, bounded by the HFT and two tear faults make this area a potential seismic hazard in the near future.
Conclusions
Morphotectonic analysis has helped to identify and quantify the tectonic activity in the Himalayan Piedmont zone of Haryana state. Using geomorphic anomalies such as drainage gradient, river offset, paired terraces, palaeochannels and topographic breaks, the possible locations of active tectonic features have been identified in the piedmont alluvial zone. Low frequency bi-static GPR scanning at selected potential locations confirm active tectonic deformation and geometry of the active tectonic features. A prominent topographic break of 5 to 7 m separates the Piedmont alluvial zone from the central alluvial plains. The break could be the remnant of a blind Piedmont fault in the subsurface south of the HFT. This could evolve into a new frontal thrust in the future. Near the main Piedmont fault, folded sediment layers are imbricated and interspersed with subtly-curved fault planes. Those are suggestive of an incipient fold-thrust belt similar to the HFT. This study concludes that the piedmont alluvial zone of the Himalayan Foreland basin in and around HFT is tectonically active. Paleoseismic investigations by means of trenching are also needed to understand stress partitioning in the region.
Council of Scientific and Industrial Research, India;
Acknowledgements
The study was funded by Indian Space Research Organization (ISRO) under the Earth Observation Application Mission (EOAM) project scheme. The first author acknowledges the grant of CSIR-JRF fellowship from Council of Scientific and Industrial Research (CSIR), New Delhi. This work forms a part of the doctoral work carried out of the first author in the Department of Geophysics, Kurukshetra University, Kurukshetra, India. Authors are very grateful to the editor-in-chief and two anonymous reviewers for reviewing this paper. Excellent critical reviews by Dr Salvatore Ivo Giano and one anonymous reviewer helped greatly improve the quality of the manuscript. This manuscript is benefitted from constructive comments by the handling Editor Prof Ramesh Singh and Associate Editor Prof Manfred Buchroithner. We express our deepest gratitude for their painstaking help.
Disclosure statement
The authors have no conflicts of interest to declare that are relevant to the content of this article.
Data availability
The data used to support the findings in this study will be available by the corresponding author upon reasonable request. Restrictions are applied to data, such as GPR radargrams.
Additional information
Funding
References
- Anderson RS, Burbank DW. 2011. Tectonic geomorphology. John Wiley & Sons.
- Basson U. 2000. Imaging of active fault zone in the Dead Sea Rift: The Evrona Fault Zone as a case study. University of Tel-Aviv 196.
- Bhosle B, Parkash B, Awasthi AK, Pati P. 2009. Use of digital elevation models and drainage patterns for locating active faults in the Upper Gangetic Plain, India. Int J Remote Sens. 30(3):673–691.
- Bhosle B, Parkash B, Awasthi AK, Singh VN, Singh S. 2007. Remote sensing-GIS and GPR studies of two active faults, Western Gangetic Plains, India. J Appl Geophys. 61(2):155–164.
- Bilham R, Blume F, Bendick R, Gaur V. K. 1998. Geodetic constraints on the translation and deformation of India: implications for future great Himalayan earthquakes. Curr Sci. :213–229.
- Brandes C, Polom U, Winsemann J. 2011. Reactivation of basement faults: interplay of ice‐sheet advance, glacial lake formation and sediment loading. Basin Res. 23(1):53–64.
- Bull WB, McFadden LD. (1977). Tectonic geomorphology north and south of the Garlock Fault, California. In: Doehring DO, editor. Geomorphology in arid regions: a proceedings volume of the 8th Annual Geomorphology Symposium; . Binghamton: State University of New York p. 115–138.
- Burbank DW, Anderson RS. 2001. Geomorphic markers. In: Tectonic geomorphology. Malden: Blackwell Publishing. p. 13–32.
- Champel B, van der Beek P, Mugnier JL, Leturmy P. 2002. Growth and lateral propagation of fault‐related folds in the Siwaliks of western Nepal: rates, mechanisms, and geomorphic signature. J Geophys Res. 107(B6): ETG-2.
- Chatterjee RS, Nath S, Kumar SG. 2019. Morphotectonic analysis of the Himalayan Frontal region of Northwest Himalaya in the light of geomorphic signatures of active tectonics. Remote Sens Northwest Himalayan Ecosyst. 17–35.
- Das S, Gupta K. 2019. Morphotectonic analysis of the Sali river basin, bankura district, West Bengal. Arab J Geosci 12(7).
- Delcaillau B, Carozza JM, Laville E. 2006. Recent fold growth and drainage development: the Janauri and Chandigarh anticlines in the Siwalik foothills, northwest India. Geomorphology. 76(3-4):241–256.
- Dey S, Thiede RC, Schildgen TF, Wittmann H, Bookhagen B, Scherler D, Strecker MR. 2016. Holocene internal shortening within the northwest Sub‐Himalaya: out‐of‐sequence faulting of the Jwalamukhi Thrust, India. Tectonics. 35(11):2677–2697.
- Gawthorpe RL, Leeder MR. 2008. Tectono‐sedimentary evolution of active extensional basins. Basin Res. 12(3-4):195–218.
- Giano SI, Schiattarella M. 2014. Age constraints and denudation rate of a multistage fault line scarp: an example from Southern Italy. Geochronometria. 41(3):245–255.
- Goswami PK. 2012. Geomorphic evidences of active faulting in the northwestern Ganga Plain, India: implications for the impact of basement structures. Geosci J. 16(3):289–299.
- Goswami PK, Deopa T. 2013. Quaternary block-tilting in southern Himalayan ranges of eastern Uttarakhand, India. zfg. 57(1):45–60.
- Goswami PK, Pant CC, Pandey S. 2009. Tectonic controls on the geomorphic evolution of alluvial fans in the Piedmont Zone of Ganga Plain, Uttarakhand, India. J Earth Syst Sci. 118(3):245–259.
- Hack JT. 1973. Stream-profile analysis and stream-gradient index. J Res US Geol Survey. 1(4):421–429.
- Hare PW, Gardner TW. 1985. Geomorphic indicators of vertical neotectonism along converging plate margins, Nicoya Peninsula, Costa Rica. Tectonic Geomorphol. 4:75–104.
- Joshi LM, Kotlia BS. 2018. Tectonic footprints and landscape evaluation along Kulur river valley, Kumaun lesser Himalaya, India. J Asian Earth Sci. 162:121–136.
- Joshi A, Patel RC. 1997. Modelling of active lineaments for predicting a possible earthquake scenario around Dehradun, Garhwal Himalaya, India. Tectonophysics. 283(1-4):289–310.
- Keller EA. 1986. Investigation of active tectonics: use of surficial earth processes. Active Tectonics. 1:136–147.
- Keller EA, Pinter N. 1996. Active tectonics (Vol. 338). Upper Saddle River, NJ: Prentice Hall.
- Keller EA, Pinter N. 2002. Active tectonics: earthquakes, uplift, and landscape. Prentice Hall.
- Khattri KM, Tyagi AK. 1983. Seismicity patterns in the Himalayan plate boundary and identification of the areas of high seismic potential. Tectonophysics. 96(3-4):281–297.
- Kirby E, Whipple KX. 2012. Expression of active tectonics in erosional landscapes. J Struct Geol. 44:54–75.
- Knight J. 2001. A geocultural classification of landscapes in Northern Ireland: implications for landscape management and conservation. Faculty of Agriculture at University College Dublin.
- Kumar S, Wesnousky SG, Rockwell TK, Ragona D, Thakur VC, Seitz GG. 2001. Earthquake recurrence and rupture dynamics of Himalayan Frontal Thrust, India. Science. 294(5550):2328–2331.
- Malik JN, Sahoo AK, Shah AA, Shinde DP, Juyal N, Singhvi AK. 2010. Paleoseismic evidence from trench investigation along Hajipur fault, Himalayan Frontal Thrust, NW Himalaya: implications of the faulting pattern on landscape evolution and seismic hazard. J Struct Geol. 32(3):350–361.
- Maurya DM, Patidar AK, Mulchandani N, Goyal B, Thakkar MG, Bhandari S, … Chamyal LS. 2005. Need for initiating ground penetrating radar studies along active faults in India: an example from Kachchh. Curr Sci. 88(2):231–240.
- Nakata T. 1972. Geomorphic history and crustal movements of the foothills of the Himalayas. Sci Rep Tohoku Univ 7th Ser (Geogr). 22:39–177.
- Nakata T. 1989. Active faults of the Himalaya of India and Nepal. Geol Soc Am Spec Paper. 232(1):243–264.
- Özkaymak Ç, Sözbilir H. 2012. Tectonic geomorphology of the Spildağı high ranges, western Anatolia. Geomorphology. 173-174:128–140.
- Pant CC, Paul A. 2007. Recent trends in seismicity of Uttaranchal. J Geol Soc India. 70(4):619.
- Parkash B, Kumar S, Rao MS, Giri SC, Kumar CS, Gupta S, Srivastava P. 2000. Holocene tectonic movements and stress field in the western Gangetic plains. Curr Sci. 438–449.
- Patel RC, Kumar Y. 2003. Geomorphological study of Quaternary tectonics of the Doon Valley, Garhwal Himalaya, Uttranchal, India. J Nepal Geol Soc. 28:121–132.
- Patel RC, Thakur SK. 2000. Hydro-geomorphological studies of the Markanda basin, Haryana, India. J Appl Hydrol. 13:20–29.
- Pati P, Parkash B, Awasthi AK, Acharya V. 2011. Holocene tectono-geomorphic evolution of parts of the Upper and Middle Gangetic plains, India. Geomorphology. 128(3-4):148–170.
- Pike RJ, Wilson SE. 1971. Elevation-relief ratio, hypsometric integral, and geomorphic area-altitude analysis. Geol Soc Am Bull. 82(4):1079–1084.2.0.CO;2]
- Ramkumar M, Menier D, Mathew M, Santosh M, Siddiqui NA. 2017. Early Cenozoic rapid flight enigma of the Indian subcontinent resolved: roles of topographic top loading and subcrustal erosion. Geosci Front. 8(1):15–23.
- Rawat A, Kumar D, Chatterjee RS, Kumar H. 2022. A GIS-based liquefaction susceptibility mapping utilising the morphotectonic analysis to highlight potential hazard zones in the East Ganga plain. Envir Earth Sci. 81(13):358.
- Rawat A, Kumar D, Chatterjee RS, Kumar H. 2022. Reconstruction of liquefaction damage scenario in Northern Bihar during 1934 and 1988 earthquake using geospatial methods. Geom Nat Hazards Risk. 13(1):2560–2578.
- Rockwell TK, Keller EA, Clark MN, Johnson DL. 1984. Chronology and rates of faulting of Ventura River terraces, California. Geol Soc Am Bull. 95(12):1466–1474.
- Roy PNS, Mondal SK. 2012. Identification of active seismicity by fractal analysis for understanding the recent geodynamics of central Himalaya. J Geol Soc India. 79(4):353–360.
- Różycka M, Jancewicz K, Migoń P, Szymanowski M. 2021. Tectonic versus rock-controlled mountain fronts–geomorphometric and geostatistical approach (Sowie Mts., Central Europe). Geomorphology. 373:107485.
- Sahoo PK, Kumar S, Singh RP. 2000. Neotectonic study of Ganga and Yamuna tear faults, NW Himalaya, using remote sensing and GIS. Int J Remote Sens. 21(3):499–518.
- Shukla UK, Bora DS. 2003. Geomorphology and sedimentology of Piedmont zone, Ganga plain, India. Curr Sci. 1034–1040.
- Singh V, Tandon SK. 2008. The Pinjaur dun (intermontane longitudinal valley) and associated active mountain fronts, NW Himalaya: tectonic geomorphology and morphotectonic evolution. Geomorphology. 102(3-4):376–394.
- Sirocko F, Szeder T, Seelos C, Lehné R, Rein B, Schneider WM, Dimke M. 2002. Young tectonic and halokinetic movements in the North-German-Basin: its effect on formation of modern rivers and surface morphology. Netherlands J Geosci. 81(3-4):431–441.
- Strahler AN. 1952. Dynamic basis of geomorphology. Geol Soc Am Bull. 63(9):923–938.2.0.CO;2
- Thakur VC. 2004. Active tectonics of Himalayan frontal thrust and seismic hazard to Ganga Plain. Curr Sci. 1554–1560.
- Thakur VC, Jayangondaperumal R, Malik MA. 2010. Redefining Medlicott–Wadia’s main boundary fault from Jhelum to Yamuna: an active fault strand of the main boundary thrust in northwest Himalaya. Tectonophysics 489(1–4):29–42.
- Thakur VC, Pandey AK. 2004a. Active deformation of Himalayan Frontal Thrust and piedmont zone south of Dehradun in respect of seismotectonics of Garhwal Himalaya. Himalayan Geol. 25(1):23–31.
- Thakur VC, Pandey AK. 2004b. Late Quaternary tectonic evolution of Dun in fault bend/propagated fold system, Garhwal Sub-Himalaya. Curr Sci. 1567–1576.
- Tsodoulos IM, Koukouvelas IK, Pavlides S. 2008. Tectonic geomorphology of the easternmost extension of the Gulf of Corinth (Beotia, Central Greece). Tectonophysics. 453(1-4):211–232.
- Valdiya KS. 1976. Himalayan transverse faults and folds and their parallelism with subsurface structures of north Indian plains. Tectonophysics. 32(3-4):353–386.
- Valdiya KS. 2001. Reactivation of terrane-defining boundary thrusts in central sector of the Himalaya: implications. Curr Sci. 81(11):1418–1431.
- Wells SG, Bullard TF, Menges CM, Drake PG, Karas PA, Kelson KI, Ritter JB, Wesling JR. 1988. Regional variations in tectonic geomorphology along a segmented convergent plate boundary pacific coast of Costa Rica. Geomorphology. 1(3):239–265.
- Yeats RS, Thakur VC. 2008. Active faulting south of the Himalayan Front: establishing a new plate boundary. Tectonophysics. 453(1-4):63–73.
- Zygouri V, Koukouvelas IK, Kokkalas S, Xypolias P, Papadopoulos GA. 2015. The Nisi Fault as a key structure for understanding the active deformation of the NW Peloponnese, Greece. Geomorphology. 237:142–156.