
 ?Mathematical formulae have been encoded as MathML and are displayed in this HTML version using MathJax in order to improve their display. Uncheck the box to turn MathJax off. This feature requires Javascript. Click on a formula to zoom.
Abstract
The southeastern margin of the Bayanhar block (BHB) is located at the junction of the Bayanhar block and the southern China block (SCB). Strong earthquakes occurred frequently in this region because of the intensive tectonic movement. The stress changes caused by strong earthquakes and the observed background seismicity can be used to forecast strong earthquake probability in this region. Therefore, we construct a 3D (three Dimension) viscoelastic finite element model that includes the complex fault system, inhomogeneous medium, tectonic stress, and gravity to simulate the evolutionary stress field when using the observed Global Positioning System (GPS) vectors as the boundary conditions. In addition, we calculate the strong earthquake probability based on the calculated stress and a Poisson probability distribution. The stress evolution result shows the Xianshuihe fault (XSHF), the Huya fault (HYF) and the southern segment except for the Yaan County of Longmenshan fault (LMSF) are located in the stress enhancement area indicating high seismic potential. However, the Minjiang fault (MJF) is located in the stress shadow area. After the Lushan and Jiuzhaigou earthquakes, there is still a high possibility of strong earthquakes in the MJF, HYF, and LMSF zone, according to the strong earthquake probability result.
1. Introduction
The southeastern margin of the Bayanhar block (BHB) is located at the junction of the Bayanhar block and the southern China block (SCB). It is not only the leading edge of the uplift and development of the Qinghai-Tibetan Plateau, but also in the middle of the north-south seismic belt in China. The tectonic movement on the boundary faults of BHB is extremely complex. The East Kunlun Fault (EKLF) on the northern boundary of BHB is about 1800 km long, and the average sinistral strike-slip rate since the late Pleistocene is 10–12.5 mm/a (Van Der Woerd et al. Citation2002), but the slip rate is shortened to 1 mm/a (Kirby et al. Citation2007) at the junction with the eastern boundary of BHB. The same situation also occurred on the Xianshuihe fault (XSHF) zone at the southern boundary of BHB. The horizontal slip rates of different sections of the Longmenshan fault (LMSF) on the eastern boundary are also very different. As for the middle section of LMSF, the average horizontal shortening slip rate is about 3.5 mm/a and the dextral strike-slip rate is about 6 mm/a, while the average horizontal shortening slip rate in the north section is 5-6 mm/a and the dextral strike slip s rate is 2-3 mm/a (Zhang et al. Citation2009; Du et al. Citation2009), which reflects that the active tectonic movement mode of the eastern boundary zone is mainly horizontal compression. The above tectonic movement characteristics show that the east-southward movement of BHB is blocked by the SCB, which makes the block movement change from horizontal strike-slip to thrust with strike-slip. The intensive tectonic movement causes strong interaction between different faults at the boundary of BHB, which controls the occurrence of a series of historical strong earthquakes.
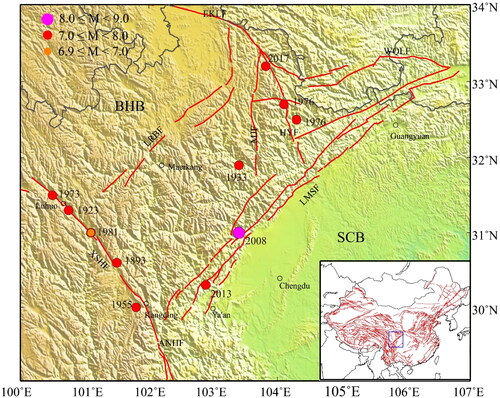
shows the main fault zones and the spatial distribution of strong earthquakes on the southeastern margin of BHB. As we can see, a few strong earthquakes with M ≥ 7 have were occurred around in the central and southern sections of LMSF and Minjiang fault (MJF), and Huya fault (HYF) since 1976. The strong earthquakes (M ≥ 7) on XSHF all occurred before 1973, There are no strong earthquakes (M ≥ 7) for almost 50 years on XSHF. The temporal and spatial distribution of historical earthquakes shows two characteristics. One is that the strong earthquakes on the northern and eastern boundaries of BHB seem to be accelerating, while the southern boundary is in a state of lack of large earthquakes (Xu et al. Citation2005, Citation2014). Therefore, the interaction between strong earthquake activities and the seismic potential in the fault zone on the southeastern margin of BHB is worth investigating detailly.
Figure 1. Regional geologic tectonics, major active faults configuration and strong earthquakes distribution, in which, BHB: BayanHar block; LMSF: Longmenshan fault; MJF: MinJiang fault; XSHF: XianShuiHe fault; LRBF: LongRiBa fault; ANHF: AnNingHe fault; HYF: HuYa fault; QCF: Qingchuan faultEKLF: Eastern KunLun fault; WQLF: Western qinling fault.
The generation, occurrence, development, and post-earthquake adjustment process of earthquakes are closely related to crustal stress (Shi et al. Citation2013; Harris et al. Citation2018; Luttrell and Hardebeck Citation2021). The research of crustal stress plays a very important role in studying the interaction of strong earthquakes and estimating seismic risk (or seismic potential). The calculation of coseismic Coulomb stress is frequently used to research the earthquake trigger and estimate seismic potential. There are many successful cases of applying Coulomb stress change to seismic potential analysis. For example, Stein et al. (Citation1997) found that 9 of the 10 earthquakes with M ≥ 6.7 on the North Anatolian Fault in Turkey occurred in the area with increased Coulomb stress. Based on this, it is speculated that the seismic risk is high in the Izmit area in the future, which was confirmed by the Izmit Earthquake in 1999.
For our study region, part of the research work focuses on the triggering effect on adjacent faults induced by the Wenchuan earthquake and Lushan earthquake. I.e. some research (Parsons et al. Citation2008; Wan and Shen Citation2010; Shan et al. Citation2009) calculated the coseismic Coulomb stress of the Wenchuan earthquake based on the elastic dislocation model and analyzed the influence of stress change on the nearby faults. Some research calculated the coseismic Coulomb stress and viscoelastic relaxation after the earthquake to study the stress evolution or stress trigger (Wang et al. Citation2014; Liao et al. Citation2019). Furthermore, the strong earthquake probability on nearby faults of LMSF also has been calculated to estimate the seismic risk (Toda et al. Citation2008; Liu et al. Citation2013). Another part of the research work mainly focuses on the XSHF in the southern boundary of this region. Chen et al. (Citation2008) analyzed the loading and unloading effects induced by earthquake sequences with M ≥ 6.5 from 1980 to 2000 on XSHF and Anninghe fault (ANHF). Wang et al. (Citation2008) used a 3D finite element model to study the interaction of earthquakes with M ≥ 6.7 on XSHF since 1893. Xu et al. (Citation2013) analyzed the seismic risk of XSHF by calculating the coseismic Coulomb stress of earthquakes with M ≥ 6.7 on XSHF from 1893 to 1981, and the tectonic stress change.
The above research results are helpful to our understanding of seismic risk on the southeastern margin of BHB. However, considering that there is a very strong interaction fault system in this region, it is necessary to put the faults system into a unified model and systematically study the stress evolution (including coseismic Coulomb stress induced by historical strong earthquakes, interseismic stress change) of the fault system on the southeastern margin of BHB in the study area. In order to evaluate the stress evolution and to assess the seismic potential (seismic risk), a 3D (three Dimension) viscoelastic finite element model and a strong earthquake probability calculated method that takes into account the complicated fault system in this region has been built. It should be mentioned that our finite element model’s viscoelastic parameters are derived based on the inversion outcomes of the 3D velocity structure and density structure, which is useful for obtaining a more precise stress field in this area. The prior finite element model’s restriction that material parameters could only be set in designated locations is changed. Furthermore, in order to have a more precise understanding of the seismic potential in this area, we quantitatively calculate the strong earthquakes probability on the main faults in the study area using the rate-state friction law and the strong earthquake probability model.
In this paper, the model and method are introduced in Section 2. The simulation results of stress evolution and strong earthquake probability are presented in Sections 3 and 4, respectively. The discussions and conclusions of this research are presented in Sections 5 and 6.
2. Model and method
2.1. 3D viscoelastic finite element model and its parameters
The main purpose of the 3D finite element model developed in this paper is to obtain the stress evolution results within the southeastern margin of BHB surrounded by the LRBF, XSHF, LMSF, WQLF and EKLF. Considering the stress change triggered by these strong earthquakes within the southeastern margin of BHB could possibly affect the adjacent block of BHB, we constructed a three-dimensional viscoelastic finite element model ranging from 97°-106°E and 26°-36°N, which is a little larger than our major research region. The Maxwell viscoelastic constitutive relationship is adopted in the model because it can well simulate the rheological effect of the lithosphere in the long process of geological evolution and the elastic effect at the moment of the earthquake. The constitutive relation of the model is as follows:
(1)
(1)
where K(t) and G(t) are the bulk and shear moduli of the Maxwell model, respectively, η is the coefficient of viscosity, K is the elastic bulk modulus, and μ is the elastic shear modulus, The latter two parameters can be obtained by converting Young’s modulus (E) and Poisson’s ratio (ν) of the linear elastic medium. The E and ν can be calculated from the three-dimensional P-wave and S-wave velocity and density models (Yin Citation2011). The P wave and S wave velocity structure obtained by Li et al. (Citation2013) are used to calculate Young’s modulus and Poisson’s ratio.
The 120 km-thick model is divided into 4 layers: upper crust (surface∼20km), lower crust (20 km ∼ Moho), lithospheric upper mantle (Moho∼80km), and asthenospheric upper mantle (80 km∼120km). The fault zone width is 5 km and the fault depth extends to 20 km. Considering the high dip of the LMSF, the dip angle of the LMSF is set to be 70° (Zhang et al. Citation2010), and the other faults in this region are assumed to be vertical for simplification in the simulations. The forward direction of the X-axis is east, the forward direction of the Y-axis is north, and the forward direction of the Z-axis is vertical upward, respectively.
shows the 3D finite element model with gravity included. The coefficient of viscosity (shown in ) is referenced from Shi and Cao (Citation2008) and Sun et al. (Citation2013), the Moho depth is referenced from Li et al. (Citation2014), and the elevation data are from the ETOP 1′×1′ (). As we can see the Moho depth and elevation are very different on both sides of LMSF. The Poisson ratio and Young’s modulus of our Model fully reflect the inhomogeneity of the medium (). The boundary conditions of the model are provided from GPS observations (Zhang Citation2008). The GPS data is loaded from the surface to 120 km depth at the lateral boundary (for simplification, the possible existence of lower crustal flow is not considered). The vertical displacement of the bottom boundary is fixed, and the upper surface boundary is free in the model. Considering that the fault medium is weaker than the surrounding blocks, the calculated Young’s modulus is multiplied by a weakening coefficient to fulfill the weakening of the fault (Hu et al. Citation2012; Wang et al. Citation2007). In this study, the weakening coefficient is set to be 1/3 to reflect the difference between the fault and the rock block.
Figure 2. The constructed 3D Finite element model.
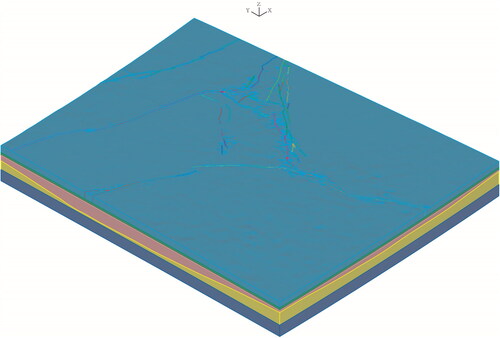
Figure 3. The elevation (a), Moho depth (b), Possion ratio at 0 and 20 km (c,d) and young’s modulus at 0 and 20 km (e,f) of model.
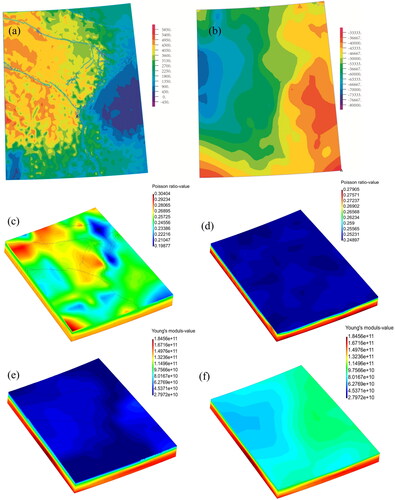
Table 1. Viscosity coefficient of this model.
2.2. Calculation of the Coulomb stress change
From the Coulomb friction criterion, the Coulomb failure stress change (ΔCFS) on a fault is defined as the following formula (Harris and Simpson Citation1998)
(2)
(2)
where
is the change in the shear stress,
is the change in the normal stress (extension is positive),
is the friction coefficient, and
is the change in the pore pressure. The effect of the friction reduction due to pore pressure can be represented by an equivalent friction coefficient
in which B is the Skempton coefficient in the range of 0 ∼ 1 (Rice Citation1992). EquationEquation (3)
(3)
(3) becomes
(3)
(3)
It is difficult to measure the value of the coefficient directly. Therefore, empirical values are adopted (Parsons et al. Citation1999). The value is usually between 0 ∼ 0.75 and the average value is about 0.4 (Freed Citation2005). In this paper, we set the coefficient of friction to 0.4 as adopted in some previous research (Stein et al. Citation1992; King et al. Citation1994).
2.3. The method to calculate earthquake probability based on stress change
2.3.1. The method to calculate the earthquake occurrence rate
According to the rate-state friction law (Dieterich Citation1994), we deduced the relationship between stress variation caused by strong earthquakes and earthquake occurrence rate, The calculation formula is as follows:
(4)
(4)
where r is the background earthquake occurrence rate (background seismicity) in the study area, which refers to the number of earthquakes in this area during a period. Generally, this parameter can be obtained from the earthquake catalog. But for strong earthquake with magnitude over 6, this parameter could be 0. In this case, we can extrapolate this value number of earthquakes from the minimum magnitude of completeness (MC) according to the Gutenberg-Richter relation.
is the duration of stress perturbation, which represents the duration of seismic activity returning to the background seismicity. The duration of stress perturbation caused by strong earthquake can also be expressed by the duration of aftershocks. According to the theory of Dieterich (Citation1994),
is changing rate of shear stress, and usually the
is given by experiment. The values of
are different in different studies, usually between 0.0012 ∼ 0.6 MPa. Referring to the values of existing studies in this area, we set
as 0.01 MPa,
as 20 years and 85 years respectively (Toda et al. Citation2008; Liu et al. Citation2013).
in the formula is the change of Coulomb stress. Therefore, the R (earthquake occurrence rate in the research region) can be determined after all the parameters on the right side of EquationEquation (4)
(4)
(4) are obtained.
2.3.2. The method to calculate strong earthquake probability
There are a series of models to calculate earthquake probability, including Poisson distribution, Weibull distribution, Brownian Passage Time model, and so on (Zhang et al. Citation2009). This study adopts Poisson distribution, which assumes that earthquakes in a fault zone occur randomly in time and space, and the quantity and magnitude of earthquakes accord with the Gutenberg-Richter relation. Poisson distribution is especially suitable in the region where geological and seismic data are scarce. The density function of the Poisson distribution is as follows:
(5)
(5)
The strong earthquakes probability (P) in the future years () can be expressed as
(6)
(6)
In which, is the annual average occurrence rate of earthquakes in the fault zone。
We then translated R into the stational Poissonian probability P with the following simple formula:
(7)
(7)
2.4. Model validation
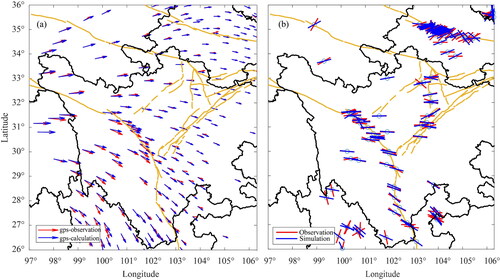
After setting up the material parameters and constraint conditions, we apply the tectonic loading and gravity to the model with time. The Restart Algorithm of ADINA software is used to eliminate the influence of model collapse caused by gravity. After 100 thousand years of tectonic loading, the calculated surface velocity and stress direction are stable and in good agreement with the observed values, as shown in . The simulated results including surface velocity and stress direction fully reflect the general trend of movement in the SEE direction in the research area, especially the surface velocity match the GPS observed result well in the direction and size. For the maximum principal compressive stress direction, the measured data are derived from the latest results released by the world stress map (WSM) in 2008 (Heidbach et al. Citation2010). We can see from that the simulated values generally agree well with the measured results in most research areas except for a few values in the southwestern boundary of the model, but it is beyond our study area. In general, the simulated results reflect the characteristics of the maximum principal compressive stress direction along with the NE and NEE directions in the research area. This stress field can be used as the present background stress field for the earthquake sequence simulation.
Figure 4. (a) The comparison between the simulated result and observation of GPS, (b) The comparison between the simulation result and observation of the maximum principal compressive stress direction from World stress map 2008.
3. Stress evolution results
3.1. The historical strong earthquakes in the research region
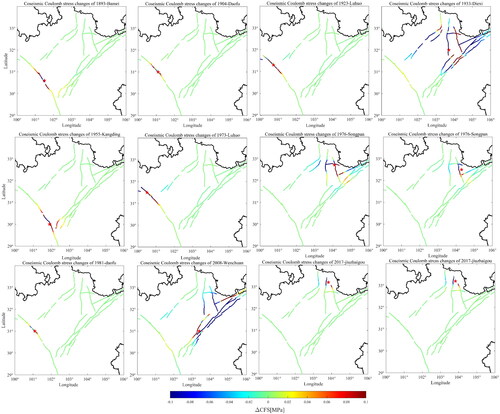
The seismic stress evolution includes the coseismic and interseismic stress change on the fault (Scholz Citation1998). The annual stress change tends to be stable in a Maxwell viscoelastic model when we obtained a stable stress state under long-term tectonic stress loading. Therefore, we can accumulate the annual stress change to obtain the interseismic stress change after we have calculated the current tectonic stress field. To obtain the coseismic Coulomb stress change, we need to select the strong earthquakes involved in the stress evolution process. Next, the coseismic stress change is calculated firstly according to seismic dislocations, and then the coseismic Coulomb stress is calculated according to the parameters of the target fault in our research region. Considering that the static Coulomb stress change caused by earthquakes below M 7 is not significant. Therefore, we select earthquakes with M ≥ 7 since 1893 to calculate the stress evolution in the research region. Although the magnitude of the Daofu earthquake that occurred in 1981 is 6.9, it also is selected because its magnitude is very close to 7. The parameters of selected strong earthquakes are listed in .
Table 2. The parameters of these strong earthquakes since 1893 in research region.
3.2. Annual Coulomb stress change
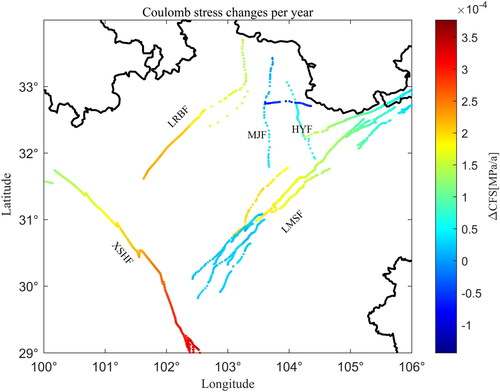
As mentioned above, the annual stress change will be stable when the tectonic stress is loaded on the viscoelastic medium for a long time, which reflects the effects of long-term tectonic stress on the viscoelastic medium. The annual stress change can be accumulated to calculate interseismic stress change induced by tectonic stress. Furtherly, we calculate the annual Coulomb stress change by projecting the annual stress change to receiving fault according to their parameters. shows the annual Coulomb stress change at 20 km depth in the research region. We can see the annual Coulomb stress change is very significant in the southern segment of XSHF, LRBF, and middle segment of LMSF, which also indicates the effect of the tectonic movement. The various features of annual Coulomb stress are also in agreement with the historical seismicity in this region (Chen et al. Citation2013).
Figure 5. The annual Coulomb stress change at 20 km depth.
3.3. The stress evolution results on the faults in the research region
An intraplate earthquake often occurs at a depth of 15-20 km at the brittle-ductile transition zone., therefore, the stress calculated in this paper is the stress at a depth of 20 km. To obtain the stress evolution result of the faults in the research region, we calculate the coseismic Coulomb stress change of every selected strong earthquake since 1893 (). It can be seen that the regions with complex faults system have more complex Coulomb stress changes (e.g. 1933 Diexi earthquake, 2008 Wenchuan earthquake, and 2013 Lushan earthquake), which suggests that it is more important to study the stress-triggering effects of strong earthquakes in such cases.
Figure 6. Coseismic Coulomb stress changes of strong earthquakes since 1893 in the research area.
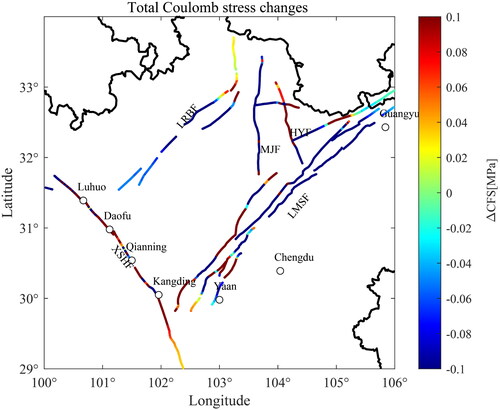
We add up the stress changes caused by tectonic movements and the Coulomb stress changes caused by strong earthquakes to obtain the stress evolution results on the faults in the study area (). As can be seen from , after strong earthquakes and tectonic activity, the XSHF is in a stress-loaded area except in the area near Kangding county, showing a high seismic risk (or seismic potential). The result is also consistent with the predicted peak ground acceleration (PGA) distribution of the XSHF obtained by Cheng et al. (Citation2021) using Multisegment Rupture Hazard Model, which also shows the higher predicted PGA except for the region next to Kangding county. In addition, the junction of LMSF and XSHF as well as the ANHF, the north-central section of HYF, and the northern section of the LRBF have strong stress accumulation and may also have seismic risk in the future. The MJF, the middle section of LRBF, the southern section (near Yaan County), and the north-central section of the LMSF are in the stress shadow area. From the perspective of the stress state, the seismic risk of these fault segments is likely to be low in the future.
Figure 7. Stress evolution of the main faults in the study area since 1893.
4. The results of strong earthquake probability based on stress change
The previous section gives the results of stress evolution on the faults in the research region since 1893 by considering the effects of both coseismic Coulomb stress and interseismic stress changes. However, the analysis of seismic risk based on the calculation of Coulomb stress evolution on faults is a means of qualitative analysis, which cannot estimate the future seismicity more accurately in the research region. Therefore, in this section, the strong earthquake probability in the research area after the Wenchuan and Jiuzhaigou earthquakes is calculated quantitatively based on the stress change and rate-state friction law.
4.1. The strong earthquake probability after the Wenchuan earthquake
We obtained the Coulomb stress change based on a three-dimensional viscoelastic model and then apply it to calculate the strong earthquake probability in the study area using the formula (7) deduced by the rate-state friction law and a historical earthquake catalog. In addition, the duration of the stress perturbation (set to 20 years), (set to 0.1 bar) and other parameters were set with reference to Toda et al. (Citation2008). The historical earthquake catalog is taken from the China Earthquake Network Center, and the minimum magnitude of completeness (Mc) is taken as 3.0. As mentioned earlier, r is the background seismicity. In this paper, the Gutenberg-Richter relation is used for extrapolation to obtain the background seismicity (r) of magnitude 6 and 7 earthquakes in the study area. The b value used in the Gutenberg-Richter relation to extrapolate is taken as 1 concerning the results of Toda et al. (Citation2008) in this area. To obtain the spatial distribution of r-values in the study area, a Gaussian smooth for earthquake probability within a 30 km radius has been performed.
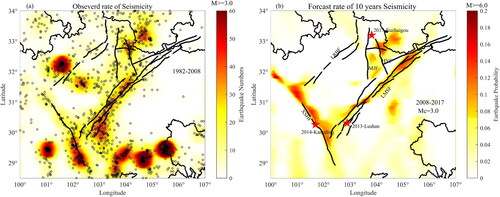
shows the spatial distribution of earthquakes of magnitude 3.0 or greater in the study area since 1982 (because the last strong earthquake before the Wenchuan earthquake occurred in 1981), and shows the probability of magnitude 6.0 earthquakes in the next 10 years after Wenchuan earthquake based on the results of our stress evolution calculations (coseismic Coulomb stress plus tectonic stress changes) in the study area. The results show that the southern section of the LMSF, the HYF, and the XSFH are the areas with a higher probability to occur strong earthquakes with magnitude 6 in the next 10 years after the Wenchuan earthquake. Actually, the 2013 Lushan 7.0 earthquake, 2014 Kangding 6.3 earthquake, and 2017 Jiuzhaigou 7.0 earthquake basically occurred in the above high earthquake probability region, respectively.
Figure 8. The spatial distribution of historical earthquake with magnitude over 3 (a) and spatial distribution of probability of strong earthquakes with Magnitude 6 (b) in the next 10 years in the study region.
The border faults that circle the southeast corner of the Bayanhar block include the Huya Fault (HYF), Minjiang Fault (MJF), Longriba Fault (LRBF), Xianshuihe Fault (SXHF), and Longmenshan Fault (LMSF). Different portions of the Longmenshan fault zone displayed noticeable variances throughout the rupture process in the Wenchuan earthquake. We split the Longmenshan fault zone into three sections from south to north in light of this distinction. Therefore, we divided the main fault zones in the study area into seven sections and calculated the possible strong earthquakes probability of magnitude 6 in the next 10 years for each section of the fault zone (information on the fault segments is shown in ). The maximum probability of a strong earthquake with magnitude 6 in the next 10 years is 12.99% for the HYF, 15.29% for the middle section of the LMSF, 12.85% for the north section of the LMSF, 13.99% for the south section of the LMSF 4.5% for the LRB, 3.68% for the MJF, and 13.51% for the XSHF. The earthquake probability is high in the southern section of XSHF, the LMSF, and the HFY in the next future 10 years after the Wenchuan earthquake.
Table 3. Earthquake probability of major faults in study region after Wenchuan earthquake.
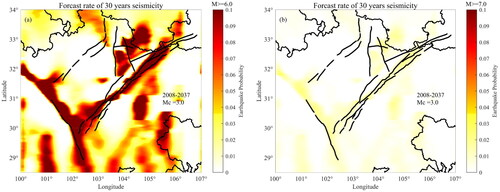
We further calculated the probability of strong earthquakes with magnitudes 6 and 7 in the region in the next 30 years after the Wenchuan earthquake (). It can be found that the probability of strong earthquakes with magnitude 6 in all the faults further increases with the accumulation of time in the next 30 years, especially in the LMSF and HYF (the detail of earthquake probability shown in ). The probability of a strong earthquake with magnitude 7 occurring in the study area in the next 30 years is significantly lower than that of a strong earthquake with magnitude 6, and the maximum probability of a strong earthquake with magnitude 7 occurring in all the faults does not exceed 2.4% (the detail of earthquake probability shown in ). It should be noted that the middle and southern sections of the LMSF and the southern section of the XSHF are the areas with a relatively high probability to occur strong earthquakes with magnitude 7 or higher.
Figure 9. The spatial distribution of probability of strong earthquakes with Magnitude 6(a) and magnitude 7 (b) in the next 30 years in the study region.
4.2. The strong earthquake probability after the Jiuzhaigou earthquake
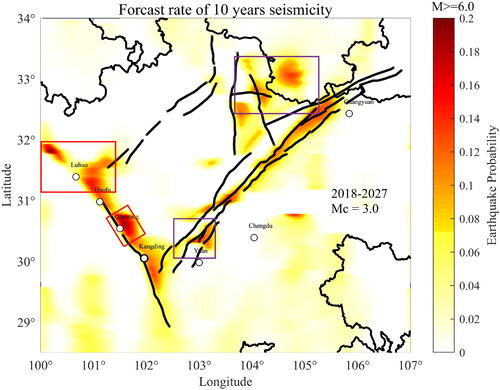
We also calculate the strong earthquake probability after the Jiuzhaigou earthquake. The duration of the stress perturbation is also set to 20 years, is set to 0.1 bar in the study region with reference to Toda et al. (Citation2008). The historical earthquake catalog is taken from the China Earthquake Network Center, and the minimum magnitude of completeness (Mc) is taken as 3.0. shows the probability of a strong earthquake with magnitude 6 in the study area in the next 10 years after the Jiuzhaigou earthquake. We can see the probability of strong earthquakes with magnitude 6 has increased in the Qianning Section, the Daofu to Luho Section of XSHF, and the Southern Section of the LRBF (red square in ), compared with the strong earthquake probability after the Wenchuan earthquake. Additionally, although the probability of a strong earthquake with magnitude 6 in the MJF and the Yaan Section of the LMSF has weakened after the Lushan and Jiuzhaigou earthquakes, still has a high seismic potential (purple square in ).
Figure 10. The spatial distribution of probability of strong earthquakes with Magnitude 6 in the study region in the next 10 years.
The stress perturbation duration (ta) in the research area has been estimated by various authors in a variety of ways. Therefore, we set the stress perturbation duration (ta) to 85 years concerning Liu et al. (Citation2013), and other parameters remain unchanged to calculate the probability of strong magnitude 6 earthquakes in the study area in the next 10 years after the Jiuzhaigou earthquake. We compare the results with that when the stress perturbation duration is set to 20 years. It is easier to find that the earthquake probability on the faults in the study area increases significantly when the ta is change from 20 a to 85 a (). Especially the earthquake probability increases to more than 30% on HYF, LMSF, and XSHF.
Table 4. Earthquake probability of major faults in study region after Jiuzhaigou earthquake.
5. Discussions
5.1. The calculated result applied to two strong earthquakes with magnitude over 6 in the region in 2022
As known, there are two strong earthquakes with magnitude over 6 in our study region in 2022 including Ms 6.1 Lushan earthquake occurred on the southern LMSF in June 1, 2022 and Ms 6.8 Luding earthquake ccurred on the southern XSF in September 5, 2022, which provides good cases to test our estimation results. As shows, these two strong earthquakes (denoted by pentagrams and black arrows) both occurred in the region with higher estimated probability, which suggests our model and results can more accurately reflect the seismic potential and risk in the study area.
Figure 11. The spatial distribution of probability of strong earthquakes and two strong earthquakes with Magnitude over 6 in the study region in 2022.

5.2. Uncertainty of stress evolution calculation
There are some important factors that will affect the stress evolution results. We need to pay attention to these factors to obtain precise results of stress evolution. Firstly, we should obtain a better present background stress field. In this paper, we use a maxwell viscoelastic 3D finite element model which involved gravity (induced by the elevation in our model) and tectonic loading (caused by the boundary’s GPS value) to calculate the present background stress field after long-term tectonic movement. The simulated background stress field agrees with the observed principal stress direction and the simulated velocity field also agree well with GPS data, which provides us with a good foundation for further stress evolution calculation. Secondly, the coseismic Coulomb stress is determined by the rake, dip and strike angle of faults. In our simulation, these parameters are obtained from other research papers which have been detailed and described in . The value of the equivalent friction coefficient also will affect the Coulomb stress, which can vary from 0 to 0.75. Some researchers (King et al. Citation1994; Wan et al. Citation2000) have investigated its effect on Coulomb stress, their experiments show that the spatial distribution of CFS values calculated using different values of equivalent friction coefficient is not very different but that those obtained using different magnitudes of stress exhibit a certain difference. Therefore, the coefficient usually is set to 0.4 to obtain the CFS value.
5.3. Uncertainty of strong earthquake probability
The predicted strong earthquake occurrence rate will be affected by material parameters and stress disturbance time
is usually given by experiments, but the value varies in different studies, usually between 0.0012 ∼ 0.6 MPa (Dieterich 1994). Referring to the value of existing studies in this area (Toda et al. Citation2008), we take 0.01 MPa in this paper. The stress disturbance time can be represented by the duration of aftershocks. The duration of aftershocks refers to the characteristic time when the seismicity of aftershocks recovers to the background level, which is related to the loading rate of shear stress. It should be noted that when the historical earthquake catalog and Coulomb stress change are determined, these two parameters (
and
) will not affect the spatial distribution of strong earthquake probability basically. Furthermore, the
is longer, the strong earthquake probability is higher. In this paper, we set
to 20 years and 85 years respectively with reference to the previous results in this region (Toda et al. Citation2008; Liu et al. Citation2013). The calculated probability is close to the result of Toda et al. (Citation2008), but it is lower than the result of Liu et al. (Citation2013) when the parameters are set as their parameters respectively. That is because we use Toda’s way to extrapolate the background seismicity (r) above M6. The background seismicity (r) above M6 used by Liu is obtained from the earthquake catalog, however, when strong earthquakes are lacking or the earthquake catalog is not exhaustive in the research region, this approach will no longer work.
5.4. Seismic potential in the research region
After the 2017 Jiuzhaigou earthquake, the stress evolution results of Xu et al. (Citation2013) have indicated the Coulomb stress increased in the middle and southern segments of XSHF, and southern segments of LMSF. The seismic risk on the northern segments of LRBF also increases, which is determined by the geological method (Xu et al. Citation2017). Our stress evolution and probability estimation results ( and ) agree with these results. Besides, the seismic potential increase on southern LRBF can also be obtained from our probability estimation results. Furthermore, Li et al. (Citation2022) analyze the seismic potential of XSHF by inversing the fault locking degree by GNSS data and the negative dislocation model. Their results indicate that Qianning and southern Kanding sections have a high potential for future strong earthquakes, which is consistent with our calculated strong earthquake probability on XSHF. Li and Bürgmann (Citation2021) inverted the interseismic shallow slip of XSHF through InSAR data from 2014 to 2019, they identify two regions with high seismic potential including the southern section of Luhuo and Qianning section, which is also consistent with our results about XSHF (red squares in ). Although, the seismic potential can be estimated through our calculated strong earthquake probability. However, it is necessary to invert the locking degree and stress change of the fault plane through GPS or InSAR data to obtain a much more accurate and detailed estimation of seismic potential.
6. Conclusions
We developed a 3D viscoelasticity finite element model to calculate the stress evolution and furtherly calculate the strong earthquake probability in the southeastern margin of BHB since 1893. Based on the above results we estimate the seismic potential in this region. Our major conclusions are as follows:
The stress evolution result shows XSHF is located in the stress enhancement area indicating high seismic potential except in Kangding county because 2014 Kangding earthquake reduced the nearby stress. In addition, the junction of LMSF and XSHF as well as the ANHF, the north-central section of HYF, and the northern section of the LRBF have strong stress accumulation and may also have seismic risk in the future. The MJF, the middle section of LRBF, the southern section (near Yaan County), and the north-central section of the LMSF are in the stress shadow area. From the perspective of the stress state, the seismic risk of these fault segments is likely to be low in the future.
The strong earthquake probability results show that the southern section of the LMSF, the HYF, and the XSFH are the areas with a higher probability to occur strong earthquakes with magnitude 6 in the next 10 years after the Wenchuan earthquake. Actually, the later 2013 Lushan 7.0 earthquake, 2014 Kangding 6.3 earthquake, and 2017 Jiuzhaigou 7.0 earthquake basically occurred in the above high earthquake probability region, respectively. And the probability of strong earthquakes gradually increases over time which is demonstrated by the probability results in the next 30 years after the Wenchuan earthquake.
The strong earthquake probability result also shows the Qianning and Daofu to Luhuo segment of XSHF have a high strong earthquake probability in the future. In addition, although the seismic risk has weakened, there is still a high probability of strong earthquakes in the MJF, HYF, and LMSF zone after Lushan and Jiuzhaigou earthquakes. In addition, the duration of stress perturbation will significantly affect the strong earthquake probability. As we have seen, the strong earthquake probability is much higher when the duration of stress perturbation is set to 85 years than the result when the duration is set to 20 years.
Author contribution
Liao Li: Conceptualization, Methodology, Software, Visualization, Investigation, Data curation, Writing- Original draft preparation, Writing- Reviewing and Editing. Li Pingen: Conceptualization, Methodology, Software, Visualization, Writing- Reviewing and Editing. Yang Jiansi: Supervision, Writing- Reviewing and Editing. Feng Jianzhou: Visualization.
Acknowledgements
We appreciate the critical and constructive comments by anonymous reviewers and the Editor that helped us to improve the manuscript.
Disclosure statement
No potential conflict of interest was reported by the authors.
Code availability
The code is available from the corresponding author on reasonable request.
Data availability
The terrain elevation data of ETOPO1, which are released by the U.S. National Geophysical Data Center (http://www.ngdc.noaa.gov/mgg/global/global.html). The observed and inversed stress data which have been used to compare with our simulated stress are obtained from World Stress Map (http://www.world-stress-map.org/data/). The GPS data, Moho Depth, Poisson ratio data are obtained from authors of references which have described detailly in the manuscript. The datasets generated during and/or analyzed in this study are available from the corresponding author on reasonable request.
Additional information
Funding
References
- Chen L, Ran Y, Wang H, Li Y, Ma X. 2013. The Lushan MS7.0 earthquake and activity of the southern segment of the Longmenshan fault zone. Chin Sci Bull. 58(28–29):3475–3482. doi:10.1007/s11434-013-6009-6.
- Chen L, Zhang P, Lu Y, Chen H, Ma H, Li L, Li H. 2008. Numerical simulation of loading/unloading effect on Coulomb failure stress among strong earthquakes in Sichuan-Yunnan area. Chin J Geophys. 51(5):1411–1421. (In Chinese).
- Cheng C. 2014. Block motion and deformation of boundary faults of active blocks in eastern BayanHar block and its adjacent regions [doctoral thesis]. Beijing: Institute of Geology, China Earthquake Administration (in Chinese).
- Cheng J, Chartier T, Xu X. 2021. Multisegment rupture hazard modeling along the xianshuihe fault zone, southeastern Tibetan Plateau. Seismol Res Lett. 92(2A):951–964. http://doi.org/10.1785/0220200117.
- Cheng J, Yao S, Liu J, Yao Q, Gong H, Long H. 2018. Visoelastic Coulomb stress of historical earthquakes on the 2017 Jiuzhaigou earthquake and the subsequent influence on the seismic hazards of adjacent faults. Chin J Geophys. 61(5):2133–2151. 2110.6038/cjg2018L0609. (in Chinese).
- Dieterich J. 1994. A constitutive law for rate of earthquake production and its application to earthquake clustering. J Geophys Res. 99(B2):2601–2618. doi:10.1029/93JB02581.
- Du F, Wen X, Zhang P, Wang Q. 2009. Interseismic deformation across the Longmenshan fault zone before the 2008 M8.0 Wenchuan earthquake. Chin J Geophys. 52(11):2729–2738. http://doi.org/10.3969/j.issn.0001-5733.2009.11.007 (in Chinese).
- Freed AM. 2005. Earthquake triggering by static, dynamic, and postseismic stress transfer. Annu Rev Earth Planet Sci. 33(1):335–367. doi:10.1146/annurev.earth.33.092203.122505.
- Harris RA, Barall M, Aagaard B, Ma S, Roten D, Olsen K, Duan B, Liu D, Luo B, Bai K, et al. 2018. A suite of exercises for verifying dynamic earthquake rupture codes. Seismol Res Lett. 89(3):1146–1162. doi:10.1785/0220170222.
- Harris RA, Simpson RW. 1998. Suppression of large earthquakes by stress shadows: a comparison of Coulomb and rate-and-state failure. J Geophys Res. 103(B10):24439–24451. doi:10.1029/98JB00793.
- Heidbach O, Tingay M, Barth A, Reinecker J, Kurfeß D, Müller B. 2010. Global crustal stress pattern based on the World Stress Map database release 2008. Tectonophysics. 482(1–4):3–15. doi:10.1016/j.tecto.2009.07.023.
- Hu X, Cui X, Ning J, Chen L. 2012. Preliminary study on tectonic deformation models in the Longmenshan region based on focal mechanism solutions of the Wenchuan earthquake sequence. Chin J Geophys. 55(8):2561–2574. (in Chinese).
- Kan R, Zhang S, Yan F, Yu L. 1977. Present tectonic stress filed and its relation to the characteristics of recent tectonic activity in southwestern China. Chin J Geophys. 20(2):96–109. (in Chinese).
- King GCP, Stein RS, Lin J. 1994. Static stress changes and the triggering of earthquakes. Bull Seismol Soc Am. 84(3):935–953.
- Kirby E, Harkins N, Wang E, Shi X, Fan C, Burbank D. 2007. Slip rate gradients along the eastern Kunlun fault. Tectonics. 26(2):TC2010. doi:10.1029/2006TC002033.
- Li L, Wu Y, Li Y, Zhan W, Liu X. 2022. Dynamic deformation and fault locking of the Xianshuihe Fault Zone, Southeastern Tibetan Plateau: implications for seismic hazards. Earth Planets Space. 74(1):35. http://doi.org/10.1186/s40623-022-01591-9.
- Li Y, Bürgmann R. 2021. Partial coupling and earthquake potential along the Xianshuihe Fault, China. J Geophys Res Solid Earth. 126(7):e2020JB021406. doi:10.1029/2020JB021406.
- Li Y, Wu Q, Pan J, Zhang F, Yu D. 2013. An upper-mantle S-wave velocity model for East Asia from Rayleigh wave tomography. Earth Planet Sci Lett. 377-378:367–377. doi:10.1016/j.epsl.2013.06.033.
- Li YH, Gao MT, Wu QJ. 2014. Crustal thickness map of the Chinese mainland from teleseismic receiver functions. Tectonophysics. 611:51–60. doi:10.1016/j.tecto.2013.11.019.
- Liao L, Li P, Yang J, Liu P, Feng J. 2019. The stress evolution before the 2013 M7.0 Lushan earthquake in the Longmen Shan area since 1900. J Geodyn. 125:1–12. doi:10.1016/j.jog.2019.01.016.
- Liu B, Shi B, Lei J. 2013. Effect of Wenchuan earthquake on probabilities of earthquake occurrence of Lushan and surrounding faults. Acta Seismol Sin. 35(5):642–651. (in Chinese).
- Luttrell K, Hardebeck J. 2021. A unified model of crustal stress heterogeneity from borehole breakouts and earthquake focal mechanisms. J Geophys Res Solid Earth. 126(2):e2020JB020817. doi:10.1029/2020JB020817.
- Molnar P, Qidong D. 1984. Faulting associated with large earthquakes and the average rate of deformation in central and eastern Asia. J Geophys Res. 89(B7):6203–6227. doi:10.1029/JB089iB07p06203.
- Parsons T, Ji C, Kirby E. 2008. Stress changes from the 2008 Wenchuan earthquake and increased hazard in the Sichuan basin. Nature. 454(7203):509–510. doi:10.1038/nature07177.
- Parsons T, Stein RS, Simpson RW, Reasenberg PA. 1999. Stress sensitivity of fault seismicity: a comparison between limited-offset oblique and major strike-slip faults. J Geophys Res. 104(B9):20183–20202. doi:10.1029/1999JB900056.
- Rice JR. 1992. Fault stress states, pore pressure distributions, and the weakness of the San Andreas Fault. Int Geophys. 51:475–503.
- Scholz CH. 1998. Earthquakes and friction laws. Nature. 391(6662):37–42. doi:10.1038/34097.
- Shan B, Xiong X, Zheng Y, Diao F. 2009. Stress changes on major faults caused by M_w7.9 Wenchuan earthquake, May 12, 2008. Sci China Ser D-Earth Sci. 52(5):593–601. (in Chinese). doi:10.1007/s11430-009-0060-9.
- Shi Y, Zhang B, Zhang S, Zhang H. 2013. Numerical earthquake prediction. Physics. 42(4):237–255.
- Shi YL, Cao JL. 2008. Effective viscosity of China continental lithosphere. Earth Sci Front. 15(3):82–95. (in Chinese). doi:10.1016/S1872-5791(08)60064-0.
- Stein RS, Barka AA, Dieterich JH. 1997. Progressive failure on the North Anatolian fault since 1939 by earthquake stress triggering. Geophys J Int. 128(3):594–604. doi:10.1111/j.1365-246X.1997.tb05321.x.
- Stein RS, King GCP, Lin J. 1992. Change in failure stress on the southern San Andreas fault system caused by the 1992 magnitude = 7. 4 Landers earthquake. Science. 258(5086):1328–1332. doi:10.1126/science.258.5086.1328.
- Sun YJ, Dong SW, Fan TY, Zhang H, Shi YL. 2013. 3D rheological structure of the continental lithosphere beneath China and adjacent regions. Chin J Geophys. 56(9):2936–2946. (in Chinese). 2910.6038/cjg20130908.
- Toda S, Lin J, Meghraoui M, Stein RS. 2008. 12 May 2008 M = 7.9 Wenchuan, China, earthquake calculated to increase failure stress and seismicity rate on three major fault systems. Geophys Res Lett. 35(17):L17305. doi:10.1029/2008GL034903.
- Van Der Woerd J, Tapponnier P, Ryerson FJ, Meriaux A-S, Meyer B, Gaudemer Y, Finkel RC, Caffee MW, Zhao G, Xu Z. 2002. Uniform postglacial slip-rate along the central 600km of the Kunlun Fault (Tibet), from 26Al, 10Be, and 14C dating of riser offsets, and climatic origin of the regional morphology. Geophys J Int. 148(3):356–388. doi:10.1046/j.1365-246x.2002.01556.x.
- Wan Y, Shen Z. 2010. Static Coulomb stress changes on faults caused by the 2008 Mw 7.9 Wenchuan, China earthquake. Tectonophysics. 491(1–4):105–118. doi:10.1016/j.tecto.2010.03.017.
- Wan Y, Wu Z, Zhou G, Huang J. 2000. “Stress triggering" between different rupture events in several earthquakes. Acta Seimol Sin. 13(6):607–615. (In Chinese). doi:10.1007/s11589-000-0062-3.
- Wang H, Liu J, Shi YL, Zhang H, Zhang G. 2008. Dynamic simulation of interactions between major earthquakes on the Xianshuihe fault zone. Sci China Ser D-Earth Sci. 51(10):1388–1400. (in Chinese). doi:10.1007/s11430-008-0110-8.
- Wang H, Zhang GM, Zhang H, Shi YL. 2007. The numerical simulation on coseismic effect of the 14 November 2001 KunLun earthquake, northern Tibet, China. Seismol Geol. 29(3):637–647. (in Chinese).
- Wang Y, Wang F, Wang M, Shen ZK, Wan Y. 2014. Coulomb stress change and evolution induced by the 2008 Wenchuan earthquake and its delayed triggering of the 2013 Mw 6.6 Lushan earthquake. Seismol Res Lett. 85(1):52–59. doi:10.1785/0220130111.
- Wells DL, Coppersmith KJ. 1984. New empirical relationships among magnitude, rupture length, rupture width, rupture area, and surface displacement. Bull Seismol Soc Am,. 84(4):974–1002.
- Xu J, Shao Z, Liu J, Ji L. 2017. Analysis of interaction between great earthquakes in the eastern Bayan Har block based on changes of Coulomb stress. Chin J Geophys. 60(10):4056–4068. (in Chinese). 4010.6038/cjg20171031.
- Xu J, Shao Z, Ma H, Zhang L. 2013. Evolution of Coulomb stress and stress interaction among strong earthquakes along the Xianshuihe fault zone. Chin J Geophys. 56(4):1146–1158. (in Chinese).
- Xu X, Cheng J, Xu C, Li X, Yu G, Chen G, Tan X, Wu X. 2014. Discussion on block kinematic model and future themed areas for earthquake occurrence in the Tibetan plateau: inspriation from the Ludian and Jinggu earthquakes. Seismol Geol. 36(4):1116–1134. (in Chinese).
- Xu X, Wen X, Han Z, Chen G, Li C, Zheng W, Zhnag S, Ren Z, Xu C, Tan X, et al. 2013. Lushan MS7.0 earthquake: a blind reserve-fault event. Chin Sci Bull. 58(28–29):3437–3443. doi:10.1007/s11434-013-5999-4.
- Xu X, Zhang P, Wen X, Qin Z, Chen G, Zhu A. 2005. Features of active tectonics and recurrence behaviors of strong earthquakes in the western Sichuan province and its adjacent regions. Seismol Geol. 27(3):446–461. (in Chinese).
- Xu XW, Wu XY, Yu GH, Tan XB, Li K. 2017. Seismo-geological signatures for identifying m ≥ 7.0 earthquake risk areas and their premilimary application in mainland China. Seismol Geol. 39(2):219–275. (in Chinese).
- Yin XC. 2011. Solid mechanics. Beijing: Seismological Press. (in Chinese).
- Yue H, Zhang Z, Chen Y. 2008. Interaction between adjacent left-lateral strike-slip faults and thrust faults: the 1976 Songpan earthquake sequence. Sci Bull. 53(16):2520–2526. doi:10.1007/s11434-008-0210-z.
- Zhang P, Wen X, Xu X, Gan W, Wang M, Shen Z, Wang Q, Huang Y, Zheng Y, Li X, et al. 2009. Tectonic model of the great Wenchuan earthquake of May 12, 2008, Sichuan, China. Chin Sci Bull (Chinese Ver). 54(7):944–953. (in Chinese).
- Zhang P. 2008. The tectonic deformation, strain distribution and deep dynamic processes in eastern margin of Qinghai-Tibetan Plateau. Sci China Earth Sci. 38(9):1041–1056. (in Chinese).
- Zhang X. 2009. Seismic hazard assessment of the active faults in southern Sichuan-Yunnan Region using GPS observations [master thesis]. Beijing: Institute of Geodynamics, China Earthquake Administration (in Chinese).
- Zhang Y, Xu LS, Chen YT. 2013. Rupture process of the Lushan 4.20 earthquake and preliminary analysis on the disaster-causing mechanism. Chin J Geophys. 56(4):1408–1411. 1410.6038/cjg20130435.(in Chinese).
- Zhang Z, Zhang P, Wang Q. 2010. The structure and seismogenic mechanism of Longmenshan high dip-angle reverse fault. Chin J Geophys. 53(9):2068–2082. (in Chinese).