
 ?Mathematical formulae have been encoded as MathML and are displayed in this HTML version using MathJax in order to improve their display. Uncheck the box to turn MathJax off. This feature requires Javascript. Click on a formula to zoom.
Abstract
Accurate input of geological elements is essential for evaluating or predicting natural hazards such as subsidence, landslides, and earthquakes. This paper proposes an approach to carry out an open pit’s overall and whole-process mechanical analysis with complex geological conditions, using precise modeling and large-scale parallel calculation techniques. Taking the Fushun West Open-pit Mine (the largest open-pit coal mine in Asia) as an example, through the elaborate multi-method geological investigation, the interfaces of interbedded shales and mudstones, the unloading zones, and the small structures were identified, a detailed 3D geological model was built and finely meshed in full-size with 100 million degrees of freedom, large-scale parallel numerical simulation was then performed, the results agree well with the InSAR monitoring data and in situ observations. Besides, the simulation can replicate the landslides in recent years. Through the simulation, it is possible to locate the potential landslide area, and targeted backfilling schemes for stability treatment were put forward and further simulated. The results indicate that the proposed approach can more effectively and reliably evaluate the Fushun West Open-pit Mine’s overall slope stability and closure plan.
1. Introduction
As the largest greenhouse gas emission country (26.1% of the world according to (BP Citation2021)), China has pledged to peak CO2 emissions before 2030, and to achieve carbon neutrality by 2060 (Elzen et al. Citation2016; Shi et al. Citation2021), in order to tackle the problem of climate change and promote the high-quality economic development. China’s coal consumption has declined in these two years. Nevertheless, it was still 2.8 billion tons in 2020, accounting for 56.9% of the total energy consumption (BP Citation2021). Reducing and substituting coal consummation is an important measure to achieve peak carbon emissions. The Chinese government has continuously implemented policies to control coal consumption and support the new energy industry (Zhou et al. Citation2020; Jia and Lin Citation2021). In the foreseeable future, many coal mines will be closed and enter the stage of geological disaster management and environmental rehabilitation (Liu et al. Citation2022).
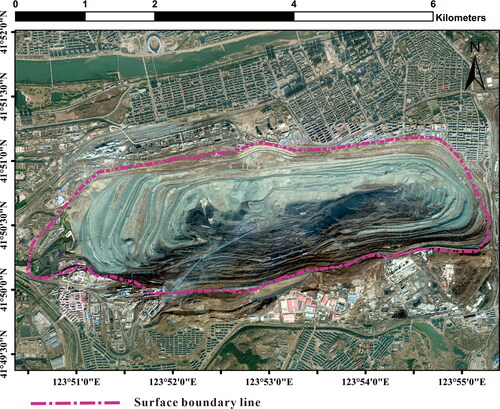
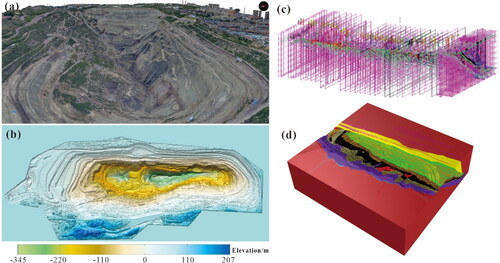
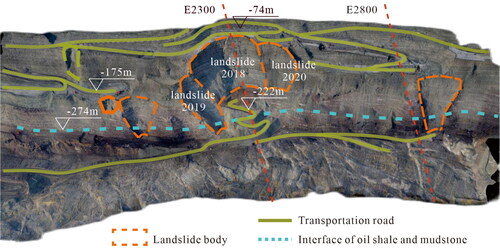
The Fushun West Open-pit Mine is the largest open pit in Asia, located downtown Fushun city, Liaoning Province, China. The pit is around 6.6 km long from east to west, and 2.2 km wide from north to south, as shown in . Its lowest point is 339 m below sea level (Zhang et al. Citation2019). The ground elevation varies from 65 m to 90 m in the north and 85 m to 160 m in the south. The coal mining began in 1901. since the founding of the People’s Republic of China in 1949, over 280 million tons of coal and 530 million tons of oil shale have been mined, and the open pit used to be a significant source of coal for China in the 1960s and 1970s with an annual capacity of over 10 million tons. However, Fushun is also plagued by many problems brought about by coal mining, such as environmental pollution and geological disasters, which are common issues shared by many resource-dependent cities. The Fushun West Open-pit Mine was officially shuttered in 2019 and stepped into the stage of ecological restoration and geological disaster control. The downtown location of the Fushun West Open-pit Mine determines that its slope needs to remain stable for a long time after closure. During the continuous mining of the Fushun West Open-pit Mine for more than 100 years, a high and steep slope with a height of about 400 − 500 m has been formed. At the same time, the geological structure of the Fushun West Open-pit Mine is complex, causing a series of geological disasters such as landslides, debris flow, toppling deformation, and ground subsidence. Among them, the landslide is the primary geological disaster. Since 1927, more than 90 landslides of different scales have occurred during the opencast mining process, with a cumulative landslide volume of about 500 million m3. Although located in the same mining area, the complex geological condition led to different landslide characteristics. The south high bedding slope has a slip body controlled by the weak interlayer, undergoing continuous deformation of the bedding slip (Nie et al. Citation2015; Li et al. Citation2021; Zhang et al. Citation2021). The core of the syncline in the northwest slope (Johnson Citation1990; Wang et al. Citation2019) can develop a toppling-rotational slide (Hungr et al. Citation2014). Due to the past underground mining activities and the long-term erosion of rainfall infiltration, the green mudstone rock mass in the central part of the north slope is relatively weak (Li et al. Citation2023a). A considerable proportion of the reported landslide events occurred in this area, mainly triggered by intense rainfall (Nian et al. Citation2022; Sun et al. Citation2022). The eastern area is prone to wedge landslides with two small fault planes as the control boundary (Yuan et al. Citation2021).
Figure 1. The overview of the Fushun West Open-pit Mine.
A complete analytical model does not exist to study a large open pit’s landslide mechanisms and deformation characteristics. Therefore, combining engineering analogy, on-site monitoring, and numerical simulation is often necessary to obtain relatively accurate mechanical solutions (Yang et al. Citation2020; Wang et al. Citation2023). However, the complex geometry and geological condition of the Fushun Open-pit Mine make it challenging to conduct comprehensive numerical simulation, which needs a large-size but finely meshed model and enormous calculation power. Thus, most previous studies simplify the research objects in two dimensions or only analyze part of the slope. Parallel Finite Element Method (PFEM) is a numerical technique used to solve partial differential equations (PDEs) using the finite element method (FEM) in a parallel computing environment (Fukuda et al. Citation2020). In PFEM, the computational domain is divided into smaller subdomains, each of which can be solved independently on different processors, allowing faster solution times and the ability to solve larger and more complex problems (Fujita et al. Citation2021). The PFEM is particularly useful for solving large-scale engineering problems.
This paper proposes a 100 million degrees of freedom (DOF) numerical simulation technique based on fine geological modeling and large-scale parallel computing. Taking the Fushun West Open-pit Mine as an example, through the simulation, the potential landslide area was located, and targeted backfill plans for stability treatment were put forward and further simulated. The results indicate that the proposed approach can more effectively and reliably evaluate the overall slope stability and the closure plan of the Fushun West Open-pit Mine.
2. Study area and geological settings
2.1. Study area
The Fushun West Open-pit Mine is a large-scale deep open-pit coal mine with a long history, measuring 6.6 km in the east-west direction and 2.2 km in the north-south direction, with a depth of approximately 424 m, making it the largest open-pit mine in Asia. It is located in a narrow and elongated plain area between the Hunchun River to the north and the foot of the Qiantai mountain to the south, spanning across the two central districts of XinFu and Wanghua in Fushun City. The Qiantai Mountain’s northern wing has a ground elevation of 102.9 − 204.9 m, with a relative height difference of 102 m and a natural slope angle of 20° − 30°. The mining area has been transformed into artificial stepped terrain, with the lowest elevation of the mining pit being −339 m. The overall slope angle of the south slope is 19° − 27°, while that of the north slope is about 30°. The terrain on the north side of the mining pit is gentler and lower, with a ground elevation of +70 to +80 m. The general trend is slightly higher to the northeast and slightly lower to the southwest, with a terrain slope of about 2°, and the elevation is relatively low, with a ground elevation of 70–80 meters.
2.2. Geological characteristics of the Fushun West Open-pit Mine
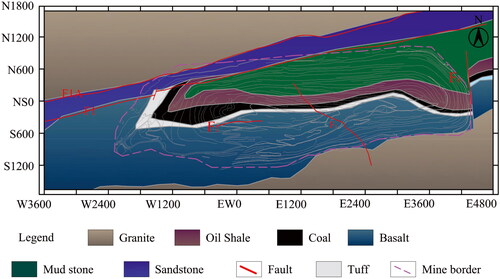
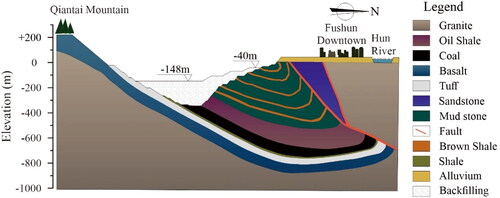
The thickness of the coal seam ranges from 35 m to 178 m. The coal is included in a sequence of early Tertiary rocks consisting of Paleocene basalt and tuff, and Eocene coal, oil shale, and mudstone. These units have been folded into a syncline with the strata of the north limb anti-dipped and the south limb overturned with a gentler dip angle of 20° − 30° compared with 48° − 55° of the north limb, the fold plunges gently to the east, as the north limb partly removed by a thrust fault of F1. The dominant faults within the coalfield are mainly Hunhe faults, a group of NEE-striking reverse faults (represented by F1 and F1A) distributed nearly parallel to each other. The strike of F1 is NE 80°, and the dip angle varies from 47° to 52°, while the strike of F1A varies from NE 80° to NE 85° and the dip angle varies from 70° to 75°. Between F1 and F1A forms an inverted triangular-shaped sandstone rock body. The main faults in the south slope consist of the EW-striking normal fault F2, which develops in the western part, and the NW-striking fault F5 and its secondary faults in the central part. Additionally, at the eastern end of the open pit, there is a north-south transverse normal fault F6.
The green mudstone is widely exposed on the north slope, interbedded with over 40 layers of brown shale. The thickness of the green mudstone layer ranges from 1 m to 10 m, while the brown shale layer thickness ranges from 0.3 m to 2 m, with a total thickness ratio of 0.75:0.25. The contact between the two layers forms a 1–20 cm thick green marl. Under the effects of weathering and unloading, the surface rock mass within the depth of 40–50 m has become loose and fractured. The rock mass of the south slope is mainly basaltic rocks, partially covered by tuff. The west and east slopes are already covered by backfills, with bedrocks rarely exposed. The upper Quaternary alluvial unit is exposed at the top bench of the north slope, with a maximum thickness of 35 m and an average thickness of 17.5 m. The engineering geological map of the Fushun West Open-pit Mine is shown in .
Figure 2. Engineering geological map of the Fushun West Open-pit Mine.
3. Methodology
3.1. Identification of unloading zones and subsurface structures
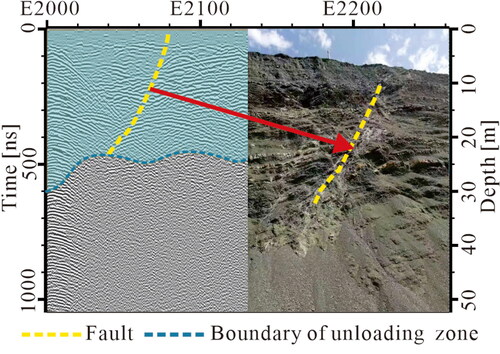
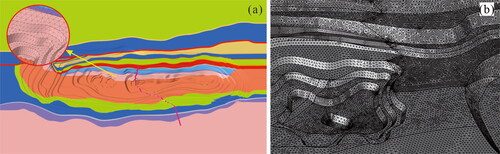
Ground Penetrating Radar (GPR) is a geophysical method that uses high-frequency electromagnetic waves to detect geological structures such as faults, fractures, bedrock, and sedimentary layers (Xie et al. Citation2018; Hamran et al. Citation2022), and has several advantages in this regard, including non-destructive, high-resolution, versatile, rapid data acquisition, depth of penetration. The GPR instrument used in this study is a CrossOver CO730 by the Impulse RADAR Company (Switzerland). It incorporates two channels with ultra-wideband frequencies centered around 70 MHz and 300 MHz, inbuilt GPS unit. The extra-large bandwidth offers an exceptional dynamic range for maximum signal penetration, data clarity, and quality. On three benches of the slope from E1600 to E3200, a round-trip survey was conducted at the elevation from −50 m to −130 m. The radar was pulled by a vehicle at a speed of approximately 5 km/h. To obtain high-quality data, the radar was deployed with direct contact with the ground.
The 2D GPR visualization software CrossPoint from the Impulse RADAR Company was applied for the GPR data processing. The acquired data were denoised. Through spacial interpolation, the processed GPR Profiles along the survey line were generated, as shown in . The radargram reflected strength as a function of linear distance and depth (in meters) with no vertical exaggeration. Continuous and smooth reflections represent the existence of strata interfaces, while discontinuous reflections and the presence of diffraction hyperbola can be interpreted as subsurface structures. The apparent discontinuities at the yellow dotted line in the figure can be recognized as the existence of faults, which is consistent with the fault exposed on the bench face. In the blue-covered area, the high density of discontinuous reflections indicates that the rock mass is more fractured, which can be interpreted as the overlying unloading zone with low strength, high permeability, and sensitivity to water, making it prone to local-scale landslides.
Figure 3. Identification of unloading zones and subsurface structures by GPR.
The rock integrity coefficient is considered to be greater than 0.6 when the Rock Quality Designation (RQD) exceeds 75% (Deere and Miller Citation1966; Dearman et al. Citation1978), which indicates that the quality of the rock mass is relatively good, where open-pit mining and weathering have not caused significant impacts on the rock mass. Therefore, the RQD value (shown in ) has been employed in this study to classify the rock mass and ascertain the thickness of the unloading zone. The analysis of the borehole data delineates a transition from a fragmented to an intact state of the borehole core as the depth increases. Specifically, the RQD for boreholes ZK89 and ZK90, at depths exceeding 66 m and 48 m, respectively, exhibit a high-quality rock mass with values surpassing 75%, indicating that the thickness of the unloading zone for these respective boreholes to be 66 m and 48 m.
Figure 4. Identification of unloading zones by RQD value and water injection Test.
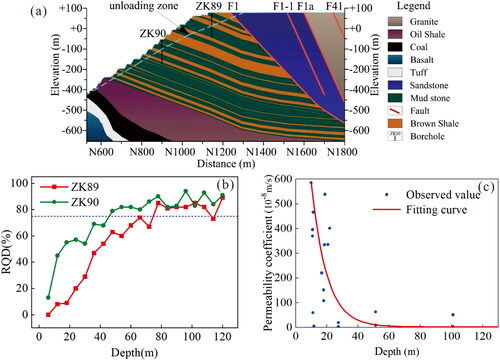
Moreover, the borehole water injection experiments yielded results (shown in ) that portray a negative exponential decay of the permeability coefficient as a function of depth. This coefficient reaches a state of stabilization at a depth of 50 m, which signifies that the shallow rock mass above this particular depth possesses a relatively high degree of fragmentation and permeability.
The analysis above aligns well with the proposition that the depth of the unloading zone corresponds effectively with the interpretation rendered by the Ground Penetrating Radar (GPR) profile. illustrates the profile of E2400, where a cyan dashed line demarcates the boundary between the unloading zone and the bedrock.
3.2. Fine geological modeling and high-precision mesh refinement
3.2.1. Fine geological modeling
Unmanned aerial vehicle (UAV) tilt photography (using DJ M300 RTK drone and a SHARE 102S five-lens camera) was employed in 2019 to acquire the ground surface data, including ground point cloud and texture. A high-precision Digital Terrain Model (DTM) was generated through the surface fitting process.
The structure of the Fushun West Open-pit Mine was initially recognized via drilling and geophysical methods. A database of 820 boreholes was established. Through the elaborate multi-methods investigation based on geological radar, high-density electrical method, seismic image method, borehole TV, etc., the interfaces of interbedded brown shales and green mudstones, the unloading zones, and the small structures were identified.
A three-dimensional geological model was constructed. In order to ensure the accuracy of the model, an absolute tolerance of 0.01 and an angular tolerance of 1° were set. By coordinate calibration, geological profiles with a horizontal spacing of 50 meters were placed in three-dimensional space. Faults and strata interfaces were fitted from the boundary curves by the loft function and were subsequently used to cut geometric entities, including the ground surface. Corresponding lithologies were assigned to the resulting cut geometric entities, which culminated in the construction of a detailed geological model, shown in .
Figure 5. Fine geological modeling. (a) UAV tilt photography. (b) DTM model. (c) Reference control profiles (spacing 50 m). (d) Overview of the geological model.
3.2.2. High-precision meshing
The utilization of tetrahedrons, pentahedrons, or hexahedrons governed by specific mapping rules is a well-established method for generating structural grids. This technique offers strict control over the size, quality, and spatial distribution of the elements. For complex models, however, an unstructured approach utilizing tetrahedral and hexahedral grids is typically employed, each exhibiting their particular pros and cons. Hexahedral grids generally outperform tetrahedral grids in computational efficiency and precision. Nonetheless, in the realm of mining geological models, irregular strata often exhibit intersections and intrusions, leading to an array of complex and variable shapes. This complexity poses a challenge for unstructured hexahedral grids in accurately delineating the geological features of the Fushun West Open-pit Mine, therefore, tetrahedral elements was selected as the most suitable choice for the numerical simulation.
The lithology of the Fushun West Open-pit Mine is characterized by a rich diversity and multi-scale features. For example, the granite gneiss extends several kilometers in both the north and south directions, while the F3-4 fault and interbedded layers of mudstone and shale can be as thin as tens of centimeters. A large size mesh may lead to substantial deviation from the actual model, consequently decreasing computational accuracy and resulting in noticeable jagged edges on mesh boundaries. On the other hand, an overly small mesh size would result in an excessive number of elements, making computations challenging for numerical simulation software. In our study, we chose the minimum meshing size to be 1/4 of the strata thickness.
It is crucial to simplify the complex geological model to ensure the continuity and accuracy of the numerical simulation mesh. Specifically, simplification was applied to the transportation routes, secondary structures, and joints of select strata. Considering the boundary effects within the study area, the model boundary was expanded by 3000 m in each horizontal direction. The overall dimensions of the model are 15 km × 10 km × 1.5 km, and it comprises nine distinct lithologies, major faults (F1, F1A, F5, F3-4, F6), interbedded mudstone-shale, unloading zones, the large southern slide body, 19 benches, and other dominant geological structures.
The geometric model was subjected to solid geometry repair, lithology coplanar continuity processing, and edge smoothing processing. The surface mesh was subsequently partitioned, and its quality was improved by adjusting mesh size and density. The F5 and F3-4 faults were partitioned, followed by the granite strata in a north-to-south sequence. The mesh size for the faults and the open pit surface was defined as 3 m, while for the F1 and F1A faults, it was set at 6 m. The mesh size for the sandstone strata was determined as 10 m. In each partition, a first-order triangle mesh type was employed.
In order to ensure mesh computability and accuracy, mesh quality checks were performed to repair distorted meshes (with an aspect ratio greater than 5), degraded meshes (with an area of 0 or an edge length of 0), and free edges. The equivalency function was used to repair most free edges, but some still required manual repair.
The shale syncline was meshed separately, while uneven zigzag meshes occurred at the fold, control lines were manually added to divide the area into several sub-blocks, and then each sub-block was divided into a mesh, the mesh size distribution then became more uniform, and the arc part was excessively smooth, which was consistent with the original geometric model and of higher quality. Finally, tetrahedral grids were divided and grouped according to different lithologies. The triangulated tetrahedral mesh contained 41 million nodes, 229 million tetrahedral elements, and more than 100 million DOF for linear elements. The mesh is depicted in .
Figure 6. High precision tetrahedral mesh of the Fushun West Open-pit Mine. (a)Overview of the mesh model. (b) Details of the refined mesh.
3.3. Damage model
The damage behavior of rock refers to the progressive fracturing and weakening effects of loading and stress on the rock structure (Lemaitre Citation2012; Kachanov Citation2013). The damage variables (D), range from 0 (undamaged) to 1 (fully damaged). The extent of damage can also be related to the rock’s stiffness through the use of the damage modulus E, which is expressed as:
(1)
(1)
The maximum tensile stress criterion and the Mohr-Coulomb (MC) criterion are incorporated into the damage model (Zhu et al. Citation2013), beyond which damage initiates and progresses, which can be expressed as:
(2)
(2)
where
and
are ultimate tensile strain and ultimate compression strain,
and
are state variables that record max tensile strain and max compression strain,
and
represent tensile strength criterion and the Mohr-coulomb criterion (Tang Citation1997); n is the empirical coefficient with a value of 2. The detailed definitions of each symbol are shown in EquationEquation (3)
(3)
(3) to EquationEquation (10)
(10)
(10) .
(3)
(3)
(4)
(4)
(5)
(5)
(6)
(6)
(7)
(7)
(8)
(8)
(9)
(9)
(10)
(10)
where
is uniaxial compressive strength,
is the ratio of compressive strength to tensile strength,
and
represent equivalent tensile strain and equivalent compression strain,
and
are used to record the maximum equivalent tensile strain and maximum equivalent compressive strain,
and
represent the maximum, intermediate, and minimum principal strains, respectively, where
denotes the Macaulay bracket (replaced by zero for negative values).
and
represent the maximum and minimum principal stresses, respectively.
In this paper, we implemented the damage model in COMSOL Multiphysics as an external material model. This functionality allows calling an external dynamic link library (DLL), written in C language, that contains the material’s relationships between stresses and strains. The damage variable was inherited from the previous step through interpolation files, which were subsequently updated for each calculation step. This progress made the damage progress irreversible. In order to ensure the convergence of the finite element calculation program, the maximum value of the damage variable was set to 0.99.
4. Numerical simulation
4.1. Simulation of the current state slope
4.1.1. Model description
The large-scale parallel numerical simulation was performed by single-machine multi-core parallel computing, employing a high-performance Asus server with an Intel Xeon W-3245M CPU (16 cores, 32 threads) and 8 × 64 GB RAM (512 GB memory). This setup offered sufficient capabilities to handle finite element numerical simulations with billion degrees of freedom (DOF).
The lateral boundaries of the 3D model were fixed in the normal direction but the z-direction was free, whereas the bottom boundary was fixed in the z-direction but free in the x-direction. The physical and mechanical parameters utilized in the numerical model (as listed in ) were determined through laboratory experiments and the back analysis approach of landslide events. Additionally, recommendations from other scholars’ articles were taken into consideration when selecting these parameters (Yang et al. Citation2005; Li et al. Citation2023b). The slope model was subjected to gravity loading in order to determine the initial stress field. Subsequently, the impact of excavation unloading on the slope was assessed, and a slope stability analysis was conducted using damage theory and strength reduction theory.
Table 1. Physical and mechanical parameters used in this study.
4.1.2. Simulation results
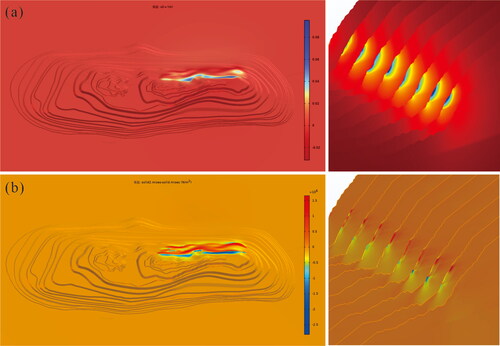
After more than a century of open-pit and underground mining operations, followed by landslides and backfilling treatments, the geometry structure and original stress field of the slope at the Fushun Western Open-pit Mine have undergone tremendous changes. In order to investigate the impact of mining activities on the slope, a simulation of the excavation scheme in 2017 − 2018 was conducted. The rock stripping area was located in the eastern part of the North Slope. The simulation results are shown in . The stripping of rock disrupted the original stress balance of the slope surface. The interaction force between the stripped rock and the bedrock was released, causing the slope rock mass to undergo unloading rebound deformation towards the direction of the free face. The rock mass at the lower part was no longer constrained by the bedrock, with the maximum horizontal displacement reaching 0.1 m (). From the Mises stress contour (), it can be observed that the stress redistribution occurred after excavation, leading to the concentration of shear stress at the toe of the slope, making it more prone to landslides.
Figure 7. Simulation results of excavation. (a)Y-directional displacement. (b) Changes in von Mises stress caused by excavation.
Based on the theory of strength reduction, the damage process of the slope rock mass under evolutionary tensile and compressive strength was considered, and the damaged zone depicting the area prone to landslide was characterized by the damage state variables. The range of strength reduction factor (SRF) was set from 1 to 1.2 with a step size of 0.005, totaling 40 steps, to characterize the evolution process of the slope rock mass from stability to instability. The results are shown in . Green means no damage occurred, blue indicates an element damaged in shear, and red indicates an element damaged in tension.
Figure 8. The evolution and spatial distribution of damaged elements at different SRF.
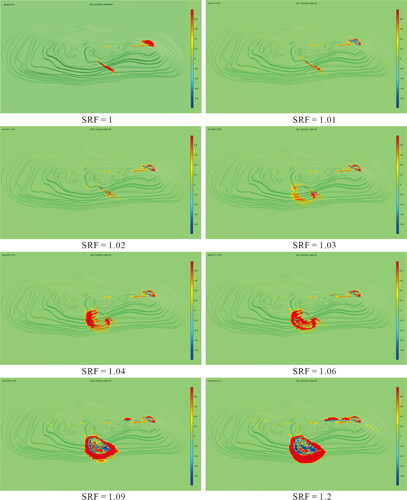
When the SRF was 1, due to the relatively low tensile strength of the fault and mudstone-shale interlayers, the elements of the F5 fault on the south slope and the lower eastern part of the north slope were damaged in tension. As the SRF increased, the shear stress on the F5 fault and mudstone-shale interlayers on the north slope reached the shear strength, leading to internal shear damage. When the SRF reached 1.02, the damage zone of the F5 fault on the south and north slopes began to migrate and expand to the southwest, while on the north slope, there was almost no change.
When the SRF reached 1.04, the south slope continued to deform, driving the development of rear cracks at the upper bench. The secondary cracks of the mudstone-shale interlayers on the north slope began to expand at E2200–E3000, and tension damage occurred at the rear edge of the lower slope benches. When the SRF was increased to 1.06, shear damage was observed along the weak layer of the south slope, where creep deformation occurred from E800 to E1600, and a wedge-shaped landslide was formed at E2800 of the north slope. When the SRF was increased to 1.2, multiple landslides were formed in the north slope with a broader distribution range, close to the locations where landslides occurred between 2018 and 2020, shown in .
Figure 9. UAV tilt photography of landslides in the north slope of the Fushun West Open-pit Mine in Recent years.
4.1.3. Validation with InSAR monitoring data
To validate the numerical simulation result, we employed InSAR satellite imagery to analyze the deformation trends and characteristics of the study area. InSAR monitoring was deemed appropriate due to its advantages, such as large executable range, non-contact monitoring, and high spatiotemporal resolution. Specifically, in this case, data from the Sentinel-1B satellite, operated by the European Space Agency, of a total of 103 images from January 11, 2017, to May 31, 2020, were processed using pixel offset tracking (POT) and multi-temporal interferometry (MTI) methods (Wei et al. Citation2021). depicts the distribution of annual subsidence rates in 2019 in the study area.
Figure 10. Annual vertical deformation rate of 2019. (a) Overall view. (b) East side of the north slope. (c) South slope.
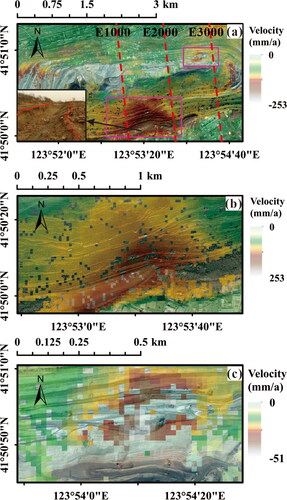
In the north slope, the deformation becomes more pronounced with E2800 as the center. In fact, three wedge-shaped landslides were recorded in the east part of the north slope, respectively, on May 4, 2018, August 13, 2019, and August 23, 2020. also reveals the presence of ground subsidence in the area between E2800 and E3400, within the fault zone between the F1A and F1 faults. This area is densely populated with many residential buildings, most of which are low-rise brick and concrete structures built in the 1980s and 1990s with shallow foundations, and are therefore more sensitive to surface subsidence.
The large-scale landslide body in the south slope has continued to experience significant deformation up to 2019, with a maximum vertical displacement rate of 253 mm/a near the paleochannel of Liushan River. also presents field photographs depicting the ground subsistence at the rear edge of the slide body on the south slope. This is because the alluvial deposits of the paleochannel consist of loose and permeable strata that are prone to deformation. According to , the deformation of the southern slope is more significant in the east than in the west, which is consistent with numerous fissures associated with the F5 fault identified during field investigations.
The numerical simulation results show a high level of agreement with the InSAR monitoring results. Through the simulation, it is possible to locate the potential landslide area, and a targeted backfilling scheme for stability treatment was put forward and further simulated.
4.2. Simulation of the backfill treatment
4.2.1. Scheme description
Considering the mine’s extensive and deep dimensions and the proximity of dense infrastructure within 50 m to 500 m from the pit boundary, backfilling will permanently enhance the pit’s stability. It reduces the high costs associated with relocating and resettling residents. This paper proposes a backfilling scheme, of which the overview is shown in . A total of 178 million m3 of backfill material is required.
Figure 11. Overview of the backfilling scheme.
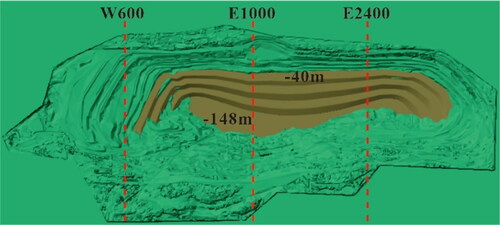
The southern slope of the Fushun West Open-pit Mine consists of basalt and tuff, which possess high strength. However, the rock mass excavation caused the foot of the south high bedding slope to lose weight, destroying the arch support effect between the south and north banks. Furthermore, multiple deep fracture zones and weak structural layers contribute to instability. The significant landslide that occurred in 2009 followed these structures. The slide body is estimated at 452 million m3, measuring approximately 1200 − 1500 m in width from north to south and stretching about 3100 m along its rear edge from east to west. The deformation was alleviated through backfilling and anti-slide piles reinforcement, but the south slope was undergoing continuous deformation until now due to insufficient backfilling. According to safety calculations, further backfilling to the elevation of −148 m allows for an overall stability assurance of the south slope, and prevents pollution from coal, oil, and mixed contaminants originating from coal seams and oil shale at the pit’s bottom.
The northern slope is a protruding anti-dipped slope with an inflection point of −40 m elevation. The rock mass on the slope is mainly composed of interbedded mudstone and shale with relatively low strength and high sensitivity to water. Therefore, based on overall backfilling to −148 m, stepped backfilling at steep slopes below −40 m is implemented, forming a terraced retaining wall. The backfilling is divided into three benches, with a slope angle of 16° and a single bench angle of 30°. The first and second benches are 40 m in height, the upper third bench is 28 m high, and the berms have a width of 90 m. depicts the detailed scheme in the profile of E1600.
Figure 12. Backfilling scheme (profile of E1600).
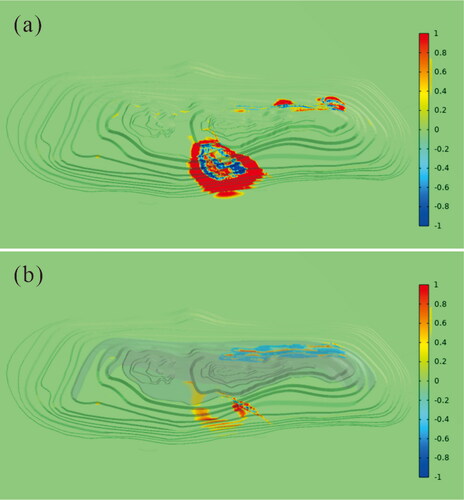
4.2.2. Simulation results compared with current state slope
The effectiveness of backfill treatment can be verified by comparing the extent of slope damage before and after backfilling. , respectively, show the distribution of damaged elements for the current state slope and the slope after treatment with a reduction factor of 1.1. By comparing the two, it can be observed that the large-scale creep landslide damage on the southern slope is significantly reduced through backfill compaction. The upper damaged zone at location E3000 of the steep eastern slope of the northern slope almost disappears, while slight shear damage appears below the stepped backfill body due to increased self-weight. However, the magnitude and concentration of damage values are significantly reduced compared to the current state slope. The stepped backfill scheme effectively reduces the slope angle of the northern slope composed of interbedded soft rocks, significantly reducing the possibility of shallow wedge slides controlled by small structural planes. In conclusion, considering the complex geological structure of the Fushun West Open-pit Mine and the targeted backfill scheme based on the causes of landslides, the stability of the post-closure slope can be effectively improved, and landslide risks can be reduced.
Figure 13. Comparison of the distribution of damaged elements before and after treatment when SRF = 1.1. (a) Current state slope. (b) Slope after backfill treatment.
5. Discussion
China has 262 resource-based cities, which have made historic contributions to establishing an independent and complete industrial system and promoting national economic development (Yu et al. Citation2019). However, many resource-based cities have entered a period of resource depletion, with lagging economic development and severe ecological damage after long-term and large-scale resource development. In the context of carbon neutrality, many coal mines will be closed and enter the stage of geological disaster management and environmental rehabilitation. Risk assessment and management is an underlying approach in all closure planning (Read and Stacey Citation2009).
This paper proposes a 100 million degrees of freedom (DOF) numerical simulation technique based on fine geological modeling and large-scale parallel computing. Taking the Fushun West Open-pit Mine as an example, through the simulation, the potential landslide area was located, a targeted backfill plan for the Fushun West Open-pit Mine’s slope stability management after mine closure was put forward and further simulated. The results indicate that the proposed approach can more effectively and reliably evaluate the overall slope stability and the closure plan of the Fushun West Open-pit Mine.
The closure plan designates the Fushun West Open-pit Mine and its surrounding areas as ecological, cultural, tourism, and healthcare functional zones. It uses backfilling and foot-pressing methods to create a well-arranged surface morphology. The backfilling materials can be obtained from the Fushun East Open-pit Mine and nearby dumping sites. This approach can reduce the transportation distance of external discharge from the Fushun East Open-pit Mine and restore the occupied land of dumping sites. This closure scheme aims to preserve the unique landscape and spatial resources of Asia’s largest open-pit coal mine while laying a solid foundation for ecological utilization and landscape design. The further comprehensive management approach for the Fushun West Open-pit Mine, incorporating backfilling, ignition source covering, water drainage, and ecological restoration will be put forward.
6. Conclusions
Through the elaborate multi-method geological investigation, including UAV tilt photography, geological radar, boreholes data, etc., the stratigraphic distribution, the unloading zones, and the small structures of the Fushun West Open-pit Mine were identified, a detailed 3D geological model was built, and finely meshed in full-size with 31 million nodes and 173 million elements, with nearly 100 million degrees of freedom.
The damage model was implanted in COMSOL Multiphysics as an external material model. Using the COMSOL multi-core parallel computing, numerical simulation was conducted. The distribution of the damaged elements shows that the western side of the F5 fault within a 500 m range on the southern slope and the lower part of the northern slope from E2000 to E3000 are susceptible areas to be unstable. The results agree well with the InSAR monitoring data and in situ observations.
The present study indicates that the simulation model is a reliable tool for evaluating the Fushun West Open-pit Mine’s overall slope stability and can aid in designing a closure plan to minimize the risk of ground instability. Through the simulation, it is possible to locate the potential landslide area and targeted backfilling schemes for stability treatment were put forward and further simulated, showing a significant reduction in the damaged area after implementing the backfilling treatment. Furthermore, the simulation results provide a detailed understanding of the slope failure mechanism, as the complex geological condition led to different landslide characteristics. In conclusion, the numerical simulation results represent a significant step forward in our ability to predict and manage the risks associated with mine closure.
Acknowledgements
The authors thank the anonymous reviewers for their helpful suggestions.
Disclosure statement
No potential conflict of interest was reported by the authors.
Data availability statement
The data that support the findings of this study are available from the corresponding authors, upon reasonable request.
Additional information
Funding
References
- BP. 2021. BP statistical review of world energy 2021. https://www.bp.com/en/global/corporate/energy-economics/statistical-review-of-world-energy.html.
- Dearman W, Baynes F, Irfan T. 1978. Engineering grading of weathered granite. Eng Geol. 12:345–374. doi:10.1016/0013-7952(78)90018-2.
- Deere DU, Miller R. 1966. Engineering classification and index properties for intact rock. Springfield, (VA): National Technical Information Service. doi:10.21236/ad0646610.
- Elzen M, Fekete H, Höhne N, Admiraal A, Forsell N, Hof AF, Olivier JGJ, Roelfsema M, van Soest H. 2016. Greenhouse gas emissions from current and enhanced policies of China until 2030: can emissions peak before 2030? Energy Policy. 89:224–236. doi:10.1016/j.enpol.2015.11.030.
- Fujita K, Koyama K, Minami K, Inoue H, Nishizawa S, Tsuji M, Nishiki T, Ichimura T, Hori M, Maddegedara L. 2021. High-fidelity nonlinear low-order unstructured implicit finite-element seismic simulation of important structures by accelerated element-by-element method. J Comput Sci. 49:101277. doi:10.1016/j.jocs.2020.101277.
- Fukuda D, Mohammadnejad M, Liu H, Zhang Q, Zhao J, Dehkhoda S, Chan A, Kodama J-i, Fujii Y. 2020. Development of a 3D hybrid finite-discrete element simulator based on GPGPU-parallelized computation for modelling rock fracturing under quasi-static and dynamic loading conditions. Rock Mech Rock Eng. 53(3):1079–1112. doi:10.1007/s00603-019-01960-z.
- Hamran S-E, Paige DA, Allwood A, Amundsen HEF, Berger T, Brovoll S, Carter L, Casademont TM, Damsgård L, Dypvik H, et al. 2022. Ground penetrating radar observations of subsurface structures in the floor of Jezero crater, Mars. Sci Adv. 8(34):eabp8564. doi:10.1126/sciadv.abp8564.
- Hungr O, Leroueil S, Picarelli L. 2014. The Varnes classification of landslide types, an update. Landslides. 11(2):167–194. doi:10.1007/s10346-013-0436-y.
- Jia Z, Lin B. 2021. How to achieve the first step of the carbon-neutrality 2060 target in China: the coal substitution perspective. Energy. 233:121179. doi:10.1016/j.energy.2021.121179.
- Johnson EA. 1990. Geology of the Fushun coalfield, Liaoning province, People’s Republic of China. Int J Coal Geol. 14(3):217–236. doi:10.1016/0166-5162(90)90004-I.
- Kachanov L. 2013. Introduction to continuum damage mechanics. Vol. 10. Dordrecht: Springer doi:10.1007/978-94-017-1957-5.
- Lemaitre J. 2012. A course on damage mechanics. 2 ed. Berlin: Springer doi:10.1007/978-3-642-18255-6.
- Li Z, Cheng P, Zheng J. 2021. Prediction of time to slope failure based on a new model. Bull Eng Geol Environ. 80(7):5279–5291. doi:10.1007/s10064-021-02234-1.
- Li J, Gao Y, Yang T, Zhang P, Deng W, Liu F. 2023a. Effect of water on the rock strength and creep behavior of green mudstone. Geomech Geophys Geo-Energ Geo-Resour. 9(1):101. doi:10.1007/s40948-023-00638-9.
- Li J, Gao Y, Yang T, Zhang P, Zhao Y, Deng W, Liu H, Liu F. 2023b. Integrated simulation and monitoring to analyze failure mechanism of the anti-dip layered slope with soft and hard rock interbedding. Int J Min Sci Technol. doi:10.1016/j.ijmst.2023.06.006.
- Liu F, Yang K, Yang T, Gao Y, Li J, Liu Q, Fu Q. 2022. Pumped storage hydropower in an abandoned open-pit coal mine: slope stability analysis under different water levels. Front Earth Sci. 10:1–12. doi:10.3389/feart.2022.941119.
- Nian G, Chen Z, Bao M, Zhang L, Zhou Z. 2022. Rainfall infiltration boundary conditions and stability of a fractured-rock slope based on a dual-continuum model. Hydrogeol J. 30(3):829–847. doi:10.1007/s10040-022-02468-7.
- Nie L, Li Z, Zhang M, Xu L. 2015. Deformation characteristics and mechanism of the landslide in West Open-Pit Mine, Fushun, China. Arab J Geosci. 8(7):4457–4468. doi:10.1007/s12517-014-1560-2.
- Read J, Stacey P. 2009. Guidelines for open pit slope design. Collingwood: CSIRO Publishing. doi:10.1071/9780643101104.
- Shi X, Zheng Y, Lei Y, Xue W, Yan G, Liu X, Cai B, Tong D, Wang J. 2021. Air quality benefits of achieving carbon neutrality in China. Sci Total Environ. 795:148784. doi:10.1016/j.scitotenv.2021.148784.
- Sun S, Liu L, Hu J, Ding H. 2022. Failure characteristics and mechanism of a rain-triggered landslide in the northern longwall of Fushun west open pit, China. Landslides. 19(10):2439–2458. doi:10.1007/s10346-022-01926-3.
- Tang C. 1997. Numerical simulation of progressive rock failure and associated seismicity. Int J Rock Mech Min Sci. 34(2):249–261. doi:10.1016/S0148-9062(96)00039-3.
- Wang H, Yang T, Zhang P, Liu F, Liu H, Niu P. 2023. Landslide susceptibility prediction considering rock integrity and stress state: a case study. Bull Eng Geol Environ. 82(7):259. doi:10.1007/s10064-023-03250-z.
- Wang S, Zhu C, Wang P, Zhang Z. 2019. Stability analysis of slope with multiple sliding surfaces based on dynamic strength-reduction DDA method. Adv Civ Eng. 2019:1–12. doi:10.1155/2019/2183732.
- Wei L-H, Liu S-J, Yang T-H, Zhao Y. 2021. Collaborative monitoring of open pit mine induced large scale landslide with LiDAR DEM and time series SAR data. J Northeast Univ. 42(12):1753–1760. Chinese. doi:10.12068/j.issn.1005-3026.2021.12.012.
- Xie P, Wen H, Xiao P, Zhang Y. 2018. Evaluation of ground-penetrating radar (GPR) and geology survey for slope stability study in mantled karst region. Environ Earth Sci. 77(4):122. doi:10.1007/s12665-018-7306-9.
- Yang T, Wang H, Dong X, Liu F, Zhang P, Deng W. 2020. Current situation, problems and countermeasures of intelligent evaluation of slope stability in open pit. J China Coal Soc. 45(6):2277–2295. Chinese doi:10.13225/j.cnki.jccs.NZ20.0347.
- Yang TH, Xie L-K, Wang S-Y, Zheng H, Rui Y-Q, Tang C-A. 2005. Effect evaluation of distortion for north project of side slope in Fushun west open cast. Chin J Rock Mech Eng. 24(11):1841–1846. Chinese doi:10.3321/j.issn:1000-6915.2005.11.004.
- Yu J, Li J, Zhang W. 2019. Identification and classification of resource-based cities in China. J Geogr Sci. 29(8):1300–1314. doi:10.1007/s11442-019-1660-8.
- Yuan Y, Xu T, Heap MJ, Meredith PG, Yang T, Zhou G. 2021. A three-dimensional mesoscale model for progressive time-dependent deformation and fracturing of brittle rock with application to slope stability. Comput Geotech. 135:104160. doi:10.1016/j.compgeo.2021.104160.
- Zhang F, Yang T, Li L, Bu J, Wang T, Xiao P. 2021. Assessment of the rock slope stability of Fushun West Open-pit Mine. Arab J Geosci. 14(15):1459. doi:10.1007/s12517-021-07815-8.
- Zhang F, Yang T, Li L, Wang Z, Xiao P. 2019. Cooperative monitoring and numerical investigation on the stability of the south slope of the Fushun west open-pit mine. Bull Eng Geol Environ. 78(4):2409–2429. doi:10.1007/s10064-018-1248-z.
- Zhou A, Hu J, Wang K. 2020. Carbon emission assessment and control measures for coal mining in China. Environ Earth Sci. 79(19):461. doi:10.1007/s12665-020-09189-8.
- Zhu WC, Wei CH, Li S, Wei J, Zhang MS. 2013. Numerical modeling on destress blasting in coal seam for enhancing gas drainage. Int J Rock Mech Min Sci. 59:179–190. doi:10.1016/j.ijrmms.2012.11.004.