
 ?Mathematical formulae have been encoded as MathML and are displayed in this HTML version using MathJax in order to improve their display. Uncheck the box to turn MathJax off. This feature requires Javascript. Click on a formula to zoom.
Abstract
Unstable rock slopes pose a hazard to inhabitants and infrastructure in their vicinity, necessitating advanced monitoring methodologies for timely risk assessment and mitigation. Recent geotechnical monitoring techniques often rely on sensor data fusion to enhance forecasting for imminent failures. Our investigation extends beyond a single sensor type to data fusion for heterogeneous sensor networks using a Multimodal Asynchronous Kalman Filter. We illustrate the application of the proposed method on a case study data set consisting of data from an on-site sensor network enriched by remote sensing data. Employing a Multimodal Asynchronous Kalman Filter, we capitalise on the distinct resolutions inherent in each sensor input. The outcome was a combined dataset with a high spatiotemporal resolution. Our approach facilitates the estimation of essential physical attributes for monitored objects, encompassing translation, rotation, velocities and accelerations. The case study site was an unstable rock section of ca. 50.000 m3 in Aurland, Norway, which collapsed as a multi-stage failure in July 2023. Our method can be transposed to various sites with distinct sensor networks, enhancing state estimations for objects on unstable rock slopes. These estimations can significantly improve applications such as risk assessment and robust early-warning systems, enhancing predictions of critical failure points.
1. Introduction
Sensor data fusion has a long history and many applications in different fields, including agriculture monitoring (Comba et al. Citation2019), medical applications (Liggins et al. Citation2017), robotics (Luo et al. Citation2002; Sasiadek and Hartana Citation2000), as well as target recognition in military applications (Hall and McMullen Citation2004; Smith and Singh Citation2006). The main objective of a data fusion application is to combine data from multiple sources to achieve inferences that a single source cannot provide (Hall and Llinas Citation1997). One key concept in data fusion is exploiting statistical advantages gained by combining independent observations of the same phenomenon. Assuming the observations follow a certain distribution around the true value of the physical phenomenon and are combined optimally, an estimation of the true value will ideally be improved proportionally by a factor of where N is the number of independent observations (Liggins et al. Citation2017). The same improvement can be achieved by combining N observations from several independent sources, providing independent observations of the same physical property. Furthermore, data fusion enables the combination of complementary information from different sensors. For instance, Inertial Measurement Unit (IMU) and Global Positioning System (GPS) measurements can be fused to combine the reactivity of inertia measurements with the long-term accuracy of GPS measurements, which compensate for the decreasing accuracy of IMU position estimates when estimating position and orientation of an object.
In the last decade, with the advance of processing techniques, computational capacity, and cheap and accurate sensor technology availability, near real-time and real-time data fusion has significantly improved (Noordam et al. Citation2020). However, sensor data fusion is not yet exploited to its fullest in the context of geotechnical monitoring applications. While attempts to generalise data fusion approaches to monitoring applications exist (Li Citation2015), they often focus on combining information from networks with a single sensor type (Li et al. Citation2016; Ling et al. Citation2020; Mishra Citation2022), only few sensors with similar information characteristics (Liu et al.Citation 2019; Noordam et al. Citation2020) or high-level information fusion based on expert knowledge rather than low-level sensor data fusion (Carlà et al. Citation2019; Leinauer et al. Citation2021; Tofani et al. Citation2014; Zhu et al. Citation2018). At the same time, many monitoring efforts on unstable rock slopes or landslides use a variety of sensors capturing different physical parameters of the monitored object but fail to combine and exploit data from the sensor networks to their full potential (Kristensen et al. Citation2021; Leinauer et al. Citation2021). Hence, further research is needed for best-practice sensor data fusion schemes in applications focusing on monitoring rock slopes or slow-moving landslides with spatiotemporal and geo-tagged data.
In particular, this concerns the practical problems encountered in the field, such as missing data due to instrument or communication link malfunctioning and interference with the environment, since many sites are situated in remote areas with harsh environments.
In this study, we propose an integrated sensor data fusion framework based on a modified Asynchronous Kalman Filter. The proposed method is designed for multi-modal sensor data in a heterogeneous sensor network, enabling estimations with non-uniform sample rates, i.e. missing values. Furthermore, the proposed method can be retrospectively used for data analysis and in a near real-time monitoring setup.
2. Methodology
Our sensor data fusion approach is based on a high-level process model derived from the Data Fusion Process Model developed by the Joint Directors of Laboratories (JDL) () (Hall and Llinas Citation1997). An adapted version of the JDL Data Fusion Process Model for geotechnical applications, especially regarding geohazards, has been presented by Li (Citation2015).
Figure 1. The JDL Data fusion process model, after Hall and Llinas (Citation1997).
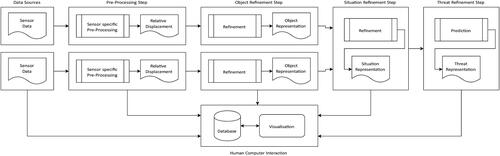
The JDL model aims at simplifying technology transfer using a unified terminology for data fusion processes. Input to the Data Fusion domain is data acquired from different sources, which are usually nodes in a sensor network. The domain output is some form of Human-Computer Interaction that allows communication with the Data Fusion system through reports and commands. Four data processing steps are defined as follows in the Data Fusion Domain.
2.1. Pre-processing
As a first step, the input data from the individual sensors is pre-analysed and prepared for the subsequent fusion process. First, raw sensor data is converted to measurement values in units from the International System of Units (SI). Subsequently, outliers are filtered with a non-sensitive function. This function identifies outliers if the data points lie outside a range of feasibility, which is defined by the physical boundaries of the property measured, such as the extension of a crack, which must be non-negative. Furthermore, this filtering identifies values outside the detectable range defined by the individual sensor data sheets, which can occur due to instrument malfunctions when recording the data or data corruption in the communication chain between the sensor and the analysis system. However, coarse filtering reduces noise and thus already optimises the data input to the processing step while preserving data whose removal could result in a type II error (false negative), which is critical for rock slope failure applications (Li Citation2015).
Moreover, the pre-processing step involves transforming the relative reference systems into the same global reference system to have comparable data. Accordingly, pre-processing has to be adapted to the sensor network, providing data for analysis, accounting for noise and interference from the environment and malfunctioning equipment anywhere in the sensor network. The case study in section III provides additional insight into sensors and sensor-specific pre-processing.
2.2. Object refinement
The second step combines the pre-screened data into an object representation. This object representation mainly comprises estimated position, orientation, and kinematics. This step involves an estimation method such as a Kalman Filter (Kalman Citation1960), which corresponds to a sensor data fusion method that can be used to estimate the object state. The general description of the Kalman Filter in matrix form is given as follows:
(1)
(1)
(2)
(2)
A is the state transition matrix describing the state dynamics, and ωk is the process noise at time step k. The latter is being used to model uncertainty in the model. Furthermore, h(xk) describes the relationship between the measurements Zk and the observed system states Xk, with νk being the measurement noise.
We derive the prediction and update step of the Kalman Filter as:
Prediction
(3)
(3)
(4)
(4)
Update
(5)
(5)
(6)
(6)
(7)
(7)
Where Pk is the covariance matrix of the estimation process at time step k, R the covariance matrix of the signal noise for all time steps k and Gk the Kalman Gain at time step k. The matrix Q represents the covariance of the process noise ωk, for all time steps k. The measurement matrix H links the obtained measurements to the system states of the model.
Using the Kalman Filter to fuse the pre-processed data from the first processing step provides a more accurate and holistic estimation of the object properties.
However, as presented above, a single Kalman Filter does not provide a favourable result for any sensor network. Sensors may operate at different sampling rates, requiring up-sampling of a lower-resolution time series to match the highest temporal resolution or down-sampling of a high-resolution series to a common lower sampling rate. Both approaches are suboptimal, with the first adding false information about the short-term evolution of the system, potentially influencing the state estimation. The latter omits valuable information about the system evolution between the down-sampled points. Moreover, the filter has to be adapted to deal with missing values, which may occur in the time series due to malfunctioning equipment or issues arising on the communication path between the instrument and the database. Hence, we propose the usage of a Multimodal Asynchronous Kalman Filter.
To achieve asynchronous fusion for data from N sensors with missing values that do not follow a specific pattern, we propose a filter structure () which is based on Kordestani et al. (Citation2020).
Figure 2. The proposed Multimodal Asynchronous Kalman Filter architecture.
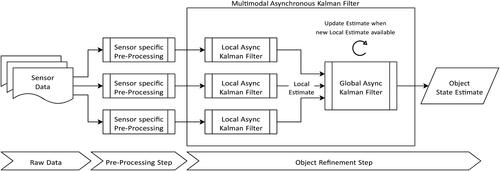
The Multimodal Asynchronous filter relies on N local Kalman Filters, one filter per sensor. These filters constitute the first stage and compute an estimate based on the measurements of a specific sensor, calibrated to the sensor specifications. The local estimations are then fused in a second-stage global Kalman Filter.
To compute the local estimate based on measurements of sensor i, the prediction step of the Kalman Filter is performed whenever a new measurement of the sensor becomes available. According to the timestamp of the new measurement and the last received measurement, the time difference Δt is computed. The prediction uses Δt to compute the system state based on the system model defined by Equationequation (1)(1)
(1) after Δt. The new measurement value is then used to compute the filter udpate.
The local estimates are aggregated and fed into a secondary Kalman Filter in the second stage. The Kalman Filter in this stage uses the same system model as the first stage but combines the local estimates based on a matrix that links all local estimates to the system states. The second stage effectively synchronizes the filter output by keeping an estimate as filter output for a predetermined time if no updated local estimate reaches the global filter. The next time window then starts by using only the system dynamics to predict the next state. Incoming local estimates are used subsequently to update the filters’ global estimate in the current window.
The resulting time series of system state estimates is used as object representation in the following subsequent processing steps. For each object of interest, an independent Multimodal Asynchronous Kalman Filter is applied for state estimation in order to account for different system dynamics.
2.3. Situation refinement
Based on the object representation computed in the Object Refinement step, this step establishes the relationship between multiple objects, such as distinct rock column on a rock slope. Essentially, the object information is aggregated, and relational information is extracted. This process accounts for the spatial relation between the objects and their environment, considering topography, geological, and geodesic domain knowledge. In geotechnical applications, this comprises, for example, the movement of different objects on an unstable rock slope, both relative to each other but also absolutely with regard to the slope or a global reference system.
2.4. Threat refinement
The threat refinement, as the third processing step, aims at predicting the evolution of the current situation based on the identified objects and their relations. Moreover, this step includes an analysis of the prediction regarding the consequences of the situation evolution. In geotechnical applications, this would, for example, aim to forecast the state of a monitored object to estimate a failure date or build an early-warning system around the forecast.
2.5. Database management system
Lastly, the Database Management System provides functionality for storing and managing the data used in the fusion process (Hall and Llinas Citation1997). The database aggregates all available sensor time series and stores the computed estimates and filter parameters to evaluate the filter. All data is accessible via the Human-Computer Interface, which allows users to explore the raw data, pre-processed data from the first processing step, the local estimates (Object Refinement result), and the global state estimates (Situation Refinement result) of the monitored objects. The interface also allows for the inspection of the filter gain and covariance matrix evolution.
In our case study, we focus on illustrating the processing steps from Pre-Processing to Situation Refinement since no forecasting has been performed yet. The outcomes of the fusion process up to the Situation Refinement step are then used to interpret the evolution of the given system. Section IV describes the processing steps using data from multiple sensors from the case study site.
3. Application: a case study from the unstable rock slope Stampa
3.1. Study site and instrumentation
The unstable rock slope Stampa is located near the tourist town Flåm in Western Norway. Directly below the rock slope lies the European Road E16 (), a highly frequented connection to Bergen and Oslo. Stampa has been subject to various mapping and monitoring efforts in the past (Oppikofer et al. Citation2012). These led to the identification of two high-risk objects continuously monitored by the Norwegian Energy and Water Directorate (Hermanns et al. Citation2013). An unstable part of the slope, named Scenario 4a, consisted of a rock column with a volume of approximately 5,000 m3, identified as Block 4a, that was not classified as a high-risk object (Hermanns et al. Citation2016). However, Block 4a was resting on a highly fractured base of approximately 40,000 m3, and parts of this base as well as Block 4a, have displayed increased movement rates in recent years until their eventual failure in summer 2023.
Figure 3. (a) Hillshaded elevation model of the unstable rock slope Stampa showing the locations of sensors. Coodinates given in UTM zone 32V. (b) Block 4a and its highly fractured base outlined. Prism locations are shown.
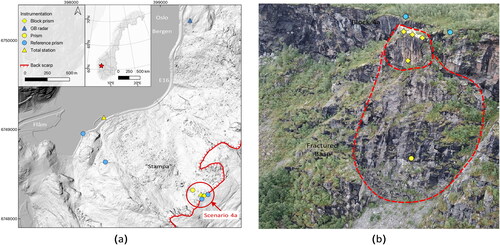
The sensor network monitoring Block 4a consisted of a series of on-site and remote sensing instruments ().
Table 1. Instruments in the sensor network.
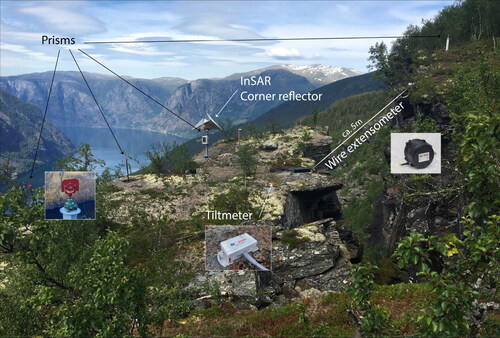
A wire extensometer and a tiltmeter formed the on-site sensor network. Both were installed on Block 4a (). Additionally, a corner reflector had been installed on Block 4a, which aided in measuring the block’s movement through satellite interferometry (). A robotic total station installed at the bottom of the slope and a ground-based radar provided data on the movements of Block 4a and the base directly below Block 4a (). Lastly, a nearby weather station situated at a similar elevation as the top of Block 4a provided temperature, humidity, wind and precipitation data.
Figure 4. Instruments on Block 4a.
3.2. Results
An application of the presented methodology was carried out following the JDL data fusion process model steps.
3.3. Pre-processing: sensor network and data sources
The instruments used in this case study have been selected to provide duplicate as well as complementary information about the monitored object. The difference in sensor type and nature of data acquisition results in different noise patterns without significant correlation. Additionally, the duplicate acquisition makes the network more reliable in case one or more sensors do not provide data as expected.
The following section elucidates the specific sensors employed in this study, shedding light on their characteristics and the data they yield.
3.3.1. Total station
The sensor network features a robotic total station with various reflection targets (Leica GPR111 and GPR112 circular prisms) on the Stampa instability ().
For each measurement, the total station first targets a set of reference prisms with known positions to calibrate the readings. This calibration is necessary to account for changes in atmospheric conditions, such as temperature and pressure. Following the calibration, all prisms on the unstable slope are targeted, and the vertical and horizontal angles, as well as the slope distances, are recorded. The absolute positions of the total station and the reference prisms have been established and are controlled by differential Global Navigation Satellite System (GNSS) measurements. Similarly, the position of the total station in the absolute reference system (EUREF89 coordinate system) has been recorded after its installation and is confirmed periodically.
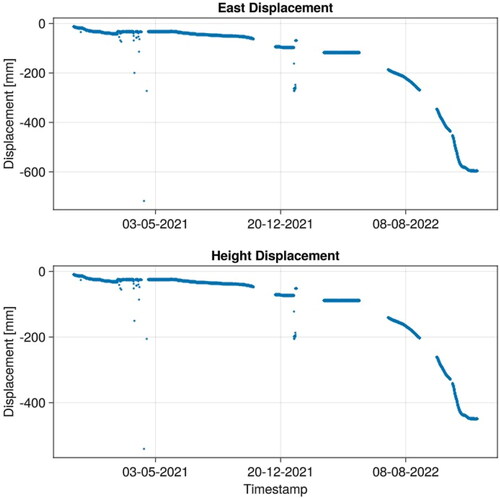
Pre-Processing focuses on transforming the raw measurement data into absolute positions along East, North and Height. The recorded angles are combined with the distance measurement to derive the absolute positions of the prisms. The time series of the three targets on Block 4a can be combined to estimate the translation and rotation of the entire block.
The combined data of the three targets on Block 4a () are referred to as the total station data below. The three selected targets form a triangle. The centroid of the resulting triangle is used as the block position lying approximately in the gravitational centre of the block. The time series have been acquired since the start of the observation period, i.e. 01.12.2020, and have recorded relative displacement along the East, North and Height axis of the EUREF89 coordinate system.
Given two edges of the triangle between two pairs of vertices (targets), the surface normal vector can be computed. The system’s rotation between two sample times can be derived from the difference between the two normal vectors. Hence, the total station measurements contribute to estimating the absolute position, 3D translation and rotation of the block. The displacement of Block 4a since the start of the observation roughly followed the slope orientation, with mostly westward and downward movement and little movement towards the north (). The extracted data are a direct result of the described Pre-Processing step, where the data are an aggregate of three total station target measurement series. Whenever all three targets have available measurements, the relative placement of the targets to each other is exploited to infer the rotation angle changes of the block. We assume the block was a rigid body over the observation time frame, i.e. the relative positioning of the total station targets did not change over time. This assumption constitutes a simplification, as the resulting model does not allow for complex displacement patterns where parts of the object evolve independently, for example, following the opening of a new crack. In future works, an improved model will be developed to be used in the data processing, which can account for object evolution throughout the monitoring process.
Figure 5. Aggregated total station data revealing displacement along east, north and Height after pre-processing.
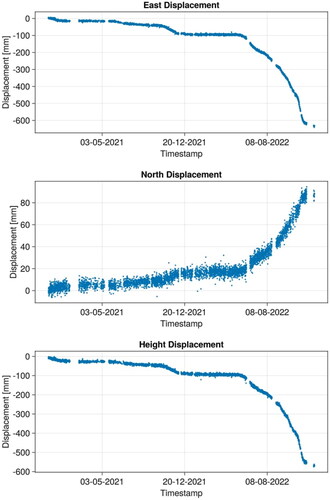
After removing systematic and gross errors, we are left with random noise mainly caused by atmospheric effects on the measurements. Random noise cannot be fully accounted for during the calibration process. The raw data displays significant gaps over multiple days where no accurate translation estimation is possible only with the total station data.
3.3.2. Satellite-based InSAR
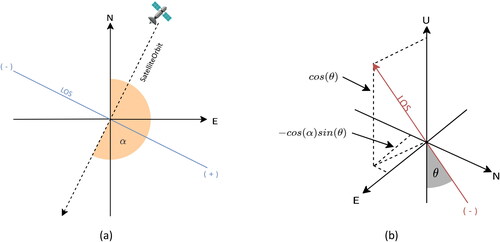
The corner reflector from Block 4a () has been used in combination with the Sentinel 1 A and 1B satellites for satellite-based InSAR measurements. Pre-Processing starts by extracting displacement information from the two orbits ascending and descending using the corner reflector as Persistent Scatterer in the recorded radar data. After unwrapping the data, the resulting Line of Sight (LOS) displacement time series are decomposed into east and vertical movements. A decomposition based on Cigna et al. (Citation2021) has been used, knowing both orbits’ incidence and track angles from the Sentinel dataset annotation. As shown in Equationequations (8)-(11), combining the information from both ascending and descending orbits (LOSA and LOSD respectively) leads to an estimation of displacement perpendicular to the flight direction DE as well as in vertical or up direction DU ().
(8)
(8)
(9)
(9)
Figure 6. (a) Satellite orbit direction and heading angle α in 2D. (b) LOS to E-W and up decomposition, incidence angle θ. Figures after Cigna et al. (Citation2021).
Where
(10)
(10)
(11)
(11)
Two sets of Interferometric Wide Swath Single Look Complexes are available for the corner reflector, IW2 and IW3. We combine both time series data using an average of each pair of measurements.
While movement along the flight direction is underestimated, the pre-processed total station data indicate that the east-west and vertical movements of Block 4a are the largest components of the translation. Thus, underestimating the north-south movement of Block 4a does not omit critical information. At the same time, including the satellite InSAR time series adds complementary information, for example, in time periods where the robotic total station was not operative.
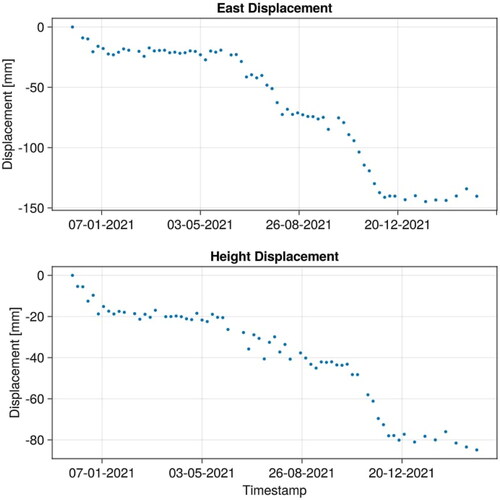
Pre-Processing of the InSAR data leads to separate time series describing the east and vertical components of the displacement (). Note that the time series ends in April 2022 since the movement in spring and autumn 2022 exceeded the maximum displacement detectable with satellite-based InSAR on the C-Band, resulting in phase ambiguities, which led to the data not being processed after April.
Figure 7. East and height displacement derived from satellite InSAR after Pre-Processing.
3.3.3. Ground-based InSAR
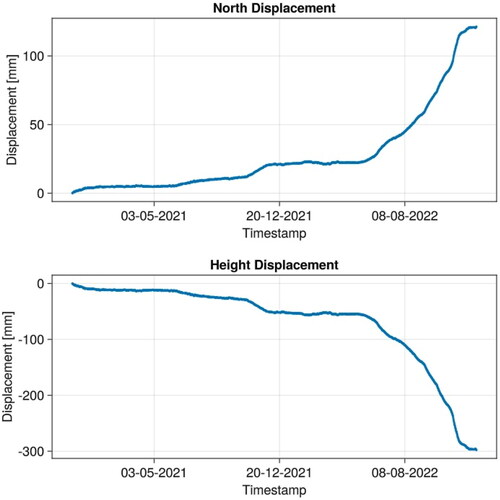
A ground-based radar is positioned approximately 2 km north of Block 4a (). The raw measurements of the phase and amplitude of the reflection can be converted to distances between the radar and the surface of Block 4a. Even though a fixed point can be followed on the Block during the measurement processing over time, the actual displacement value is the mean of all pixels on a surface with the approximate dimensions of 2 m by 2 m. Additionally, the detected displacement represents distance changes in the LOS of the instrument, which almost aligns with the global north, making the sensor insusceptible to east-west movement. The decomposition of the LOS measurements into north and height displacement, which is part of the Pre-Processing step, is based on the radars’ view angle. The latter can be computed given the initial height and north position differences.
Assuming that the LOS measurements align with the north, the decomposition can be reduced to a trigonometric problem. Hence, the pre-processing results in north and vertical decomposition of the input data (). The daily measurements have been conducted very consistently during the observation time frame. In selected periods, the sampling frequency has been tripled to record one measurement every eight hours. The actual displacement is expected to be underestimated since the measurements cannot account for the east displacement, and phase jumps are likely to occur on days with large displacements, such as during autumn 2022 (). A direct comparison with the robotic total station data in the same period enables the identification of phase jumps.
Figure 8. North and height displacement derived from ground-based InSAR after Pre-Processing.
3.3.4. Extensometer
As part of the sensor network, a wire extensometer monitored the extension across a large fracture separating Block 4a and the above mountainside. Initially spanning a length of approximately 5 meters, the wire was extended later to facilitate extension measurements during significant displacements, particularly as Block 4a approached failure. Installed at an angle of approximately 37°, it measured the movement of Block 4a north-westwards and in the vertical direction.
Since the extensometer data exhibits significant outliers and systematic offsets due to instrument failures, Pre-Processing first filters values outside the instrument range as well as negative distances and measurements that correspond to extreme accelerations followed by extreme deceleration. The latter is due to environmental factors, such as ice on the wire during winter, which are unrelated to block movements. The measurements are treated as LOS measurements and decomposed into an east and vertical translation component based on the vertical angle of the wire. The Pre-Processing result thus acts mainly as an outlier filter for the extensometer ().
Figure 9. East and height displacement derived from extensometer after Pre-Processing.
The prefiltering performed in this step cannot remove all the outliers as it is designed to filter conservatively, according to the general Pre-Processing guidelines. Similar to other sensor measurements, the time series of the extensometer has several holes with missing data. The extensometer offers a very high temporal resolution with a sample time of 1h ().
3.3.5. Tiltmeter
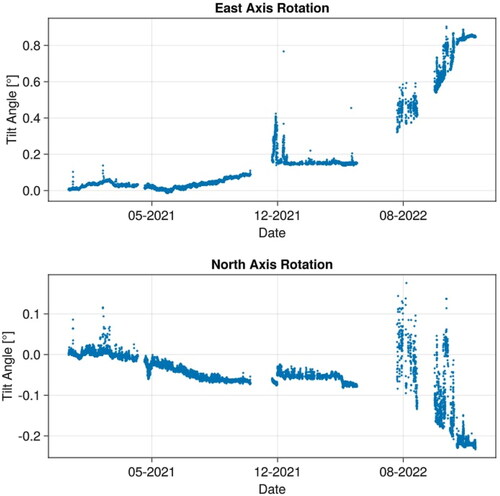
The tiltmeter contributes to estimating the tilt around the East axis (roll) and North axis (pitch). Due to the sensor being a Micro-Electro-Mechanical System (MEMS) based sensor and the relatively high sensitivity to vibrations and electromagnetic fields, the measurement data is considerably noisy in large parts, including outliers outside the theoretical measurement range of the instrument. Since the data is being preprocessed and merged, we mitigate the problems arising from the noise present in the raw data when estimating the system states. To align the tiltmeter data to a common reference frame with the total station data, the data needs to be adjusted according to the orientation of the instrument such that the rotation axis aligns with the East and North axis. The rotation matrix transforming the tiltmeter reference frame into the global reference frame can be computed based on the installation report of the instrument.
With a temporal resolution identical to the extensometer data, the tiltmeter can provide essential insights into the short-term evolution of the block rotation despite the relatively large noise component. Pre-processing denoises both rotation components while preserving the sensitivity of the sensor to short-term events ().
Figure 10. Rotation around east and north axes derived from tiltmeter after Pre-Processing.
3.4. Object refinement
We assume that Block 4a can be described as a linear system whose movements are roto-translational. This simplification yields the following system model at discrete time intervals:
Note that the system is assumed to have no control input, and we thus omit a term representing system input. The assumption of a linear system holds since the monitored system evolves slowly with respect to the shortest sample time in the sensor network and can thus be approximated linearly. The system’s minimum coordinated sample time is around 1h, corresponding to the extensometer’s sampling rate. Furthermore, the process noise dominates over the linearization error, which makes a Kalman Filter an appropriate approach. Given that we aim to estimate the system’s position and rotation changes over time and the respective velocities, the system state is described as follows.
(12)
(12)
Where [x,y,z] represent the systems position and [ψ,θ,ϕ] the systems orientation as Euler angles.
Furthermore, we define the state transition matrix as follows:
(13)
(13)
With
(14)
(14)
A Multimodal Asynchronous Kalman Filter filter has been used to estimate the states of Block 4a and, separately, the base the block rests on.
For Block 4a, four separate local Kalman Filters have been used. The measurement matrices relate the measurements after pre-processing to the system state. In this case, the measurement matrix elements equal 1 for a pre-processed measurement that corresponds with the system state of the element column and 0 otherwise. lists the relations between the pre-processed measurements and the system states.
Table 2. Relation pre-processed measurements to system states.
The measurement covariance matrices, which can be seen as hyperparameters to tune the filter, are based on the expected variances as described by the sensor datasheet or on the variance of the actual measurements over the first weeks of the measurement campaign since no significant movement has been detected in this period.
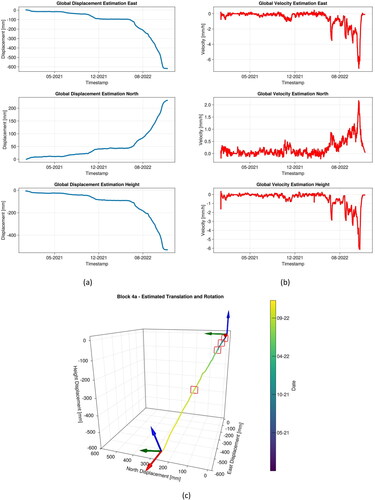
The resulting displacement time series generally follows the trend of the instruments while allowing instruments with lower variance to dominate the estimation. Additionally, the displacement velocity and rotation are estimated ().
Figure 11. Fusion result constraining estimated Block 4a (a) displacement (b) velocity, and (c) roto-translation in 3D using the Multimodal Asynchronous Kalman Filter. Red wireframes in (c) indicate the dates on the ticks of the colorbar.
Two local Kalman Filters have been employed for the base Block 4a is resting on. Accordingly, only two instruments provide measurements for the base displacement: the total station with one target as well as the ground-based radar. The processing uses the same hyperparameters as the fusion of the Block 4a data since the same instruments provide the data used as estimation input. The resulting estimates have the same resolution as the Block 4a fusion output ( and ).
Figure 12. (a) Multimodal Asynchronous Kalman Filter fusion result showing estimated (a) displacement and (b) velocity of the base of Block 4a.
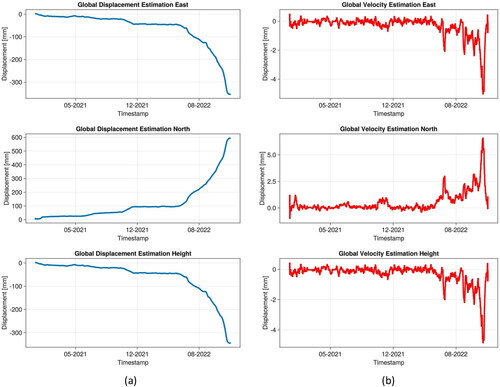
Figure 13. Comparison of estimated 3D displacement for Block 4a and its base.
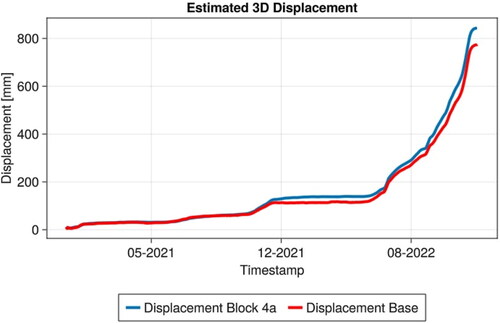
Our data fusion approach provides insights into both the short-term movement over multiple days and the long-term evolution of Block 4a and the base over several months. Since the measurement noise covariances are in the same order as the process noise covariance, the model and measurements are equally important in the resulting estimation.
3.5. Situation refinement
Situation refinement allows for an analysis of the object movements relative to each other. Globally, we estimate that a translation down-slope towards the west dominates the movement of Block 4a. The dominating westward translation component over the observation period is with approximately 618 mm in the same order as the vertical component with approximately 530 mm. Although significantly less movement has been detected in the north direction (approx. 230 mm), this orientation component provides insights into the failure mechanism and the fault orientation. More specifically, the 3D displacement vector aligns with the slope Block 4a was resting on, indicating a sliding failure component.
At the same time, the movement of Block 4a had a rotational component. This rotation was dominated by an approximately 0.42° northward rotation around the east-west axis. Combined with an approximately 0.2° westward rotation around the north-south axis, the resulting rotation indicates that the top of the block moved quicker northwest than the base, translating to a toppling of the block in addition to the translation deformation. Lastly, the rotation of the block around the vertical axis is estimated to be about 0.28° in a clockwise direction. While the estimated rotation is much less compared to the translational component of the movement, the estimation indicates a toppling mechanism coupled with a rotation away from the back scarp (). The displacement and rotation follow the same global trend, exhibiting a proportional relation.
Similarly, the 3-dimensional displacement of the base of Block 4a is in the same order as the Block 4a displacement (). However, the base movement is dominated by a northward translation of approximately 600 mm, while the westward and down-slope translation components are in the same order of approximately 360 mm. While the base displacement impacts the Block 4a displacement, the two objects followed slightly different paths down-slope. This difference indicates that the two objects did not evolve separately but rather coupled. Most likely, Block 4a was partly resting on the unstable base, which caused movements whenever a base displacement occured, while being separated from the base by several fractures.
3.6. Threat refinement
Based on the observed displacements of both Block 4a and its base, a short-term forecast can be implemented using the proposed Multimodal Asynchronous Kalman Filter setup. By using the system model and computing the next predicted state of the objects based on the last available estimate. However, using the proposed filter for analysis, such as discussed here, does not require inspecting the Threat Refinement output.
3.7. Discussion
The proposed workflow and Multimodal Asynchronous Kalman Filter have been used to analyze historical data. The distributed architecture ensures that missing values from different sensors do not impact the global estimation and, more importantly, that the filter is rate-agnostic, which enables the filter to be implemented in any sensor network configuration without having to synchronize data acquisition.
While our case study of Block 4a in the Stampa rock slope instability illustrates the use of the filter for post-monitoring analyses, the proposed design is equally well adapted for near real-time monitoring.
The proposed filter outperforms a single-stage Kalman Filter with respect to the estimation accuracy for heterogeneous multi-rate sensor systems. This performance gain is mainly due to the fact that we do not apply interpolation to data gaps. Instead, the filter uses the respective local Kalman Filter predictions without update based on measurement value as fusion input into the second stage. The two-stage design allows finetuning both stages to the use case. Furthermore, the proposed design combines established asynchronicity mechanisms with global centralized fusion principles while conserving the optimal fusion properties of a Kalman Filter with regard to signals with normally distributed noise components (Sun et al. Citation2017). The latter is an assumption that must be verified for the system in which the filter is used.
The filter’s main advantage is that it can combine data from various sensors as opposed to approaches limited to a single sensor type (Ling et al. Citation2020). However, if only a few instruments provide data over a longer time period, the simple model used to predict the system state will degrade the global estimation. Hence, the model works best when missing data occurs but not over prolonged periods. In the presented case study example, missing data for multiple weeks from multiple instruments degrades the global state estimate because the model cannot account for movements. This could be mitigated by employing a more complex model for the system evolution. However, the filter quickly corrects the estimation when new measurements are available.
While centralized fusion generally requires a higher computational capacity than decentralized fusion, for slowly evolving systems such as the one presented in the case study above, the latency introduced by the filter computations is, in practice, negligible concerning the rate at which new measurements are acquired.
Finally, the proposed filter structure allows for a low-level data fusion which offers a novel approach to geotechnical sensor data fusion and enhances the analysis of movements of observed objects and their relation to each other. The presented analysis approach can further be combined with high-level data fusion in a hybrid approach, for instance, in cases of imminent failures for a holistic interpretation approach.
4. Conclusions
By aggregating the data from a variety of sensors, pre-processing, and combining them using the proposed Multimodal Asynchronous Kalman Filter, we were able to gain important insights into the complex displacement pattern and failure mechanism of Block 4a. While the proposed data fusion process works well to gain insights into the movement of single objects, further investigation is needed to couple the movement of multiple objects or to monitor more complex instabilities with greater spatial variations. Furthermore, basic quality assurance of the sensor data fed into the filter must not be omitted, as there is no inherent correction mechanism present in the filter. The latter stems from the attempt to avoid type II errors in the pre-processing. A possible extension of the proposed method is using variable measurement covariance matrices to adapt to varying sensor performances. This adaption can improve the filter’s accuracy, for example, when the sensor accuracy is affected by temperature changes in different seasons. Similarly, basing the implementation on Iterative Adaptive Kalman Filters, as presented by Assa and Janabi-Sharifi (Citation2015), could further improve estimation performance.
In future work, the results of the movement estimation can be used in further analysis, for example, to infer the main drivers of the movement by integrating weather data such as precipitation and soil moisture.
Once a causal inference has been established, a forecasting procedure can be built upon it. The forecasting can be used for pattern recognition to detect anomalies and eventually to issue warnings in case of an imminent failure. Existing prediction models based on Kalman Filter implementations, such as Ling et al. (Citation2020), may profit from integrating multimodal data through the presented approach as well as methods performing forecasting based on Inverse Velocity methdologies such as Leinauer et al. (Citation2023).
Disclosure statement
No potential conflict of interest was reported by the author(s).
References
- Assa A, Janabi-Sharifi F. 2015. A Kalman filter-based framework for enhanced sensor fusion. IEEE Sensors J. 15(6):3281–3292. doi: 10.1109/JSEN.2014.2388153.
- Carlà T, Tofani V, Lombardi L, Raspini F, Bianchini S, Bertolo D, Thuegaz P, Casagli N. 2019. Combination of GNSS, satellite InSAR, and GBInSAR remote sensing monitoring to improve the understanding of a large landslide in high alpine environment. Geomorphology. 335:62–75. doi: 10.1016/j.geomorph.2019.03.014.
- Cigna F, Ramírez RE, Tapete D. 2021. Accuracy of sentinel-1 PSI and SBAS InSAR displacement velocities against GNSS and geodetic leveling monitoring data. Remote Sens. 13(23):4800. doi: 10.3390/rs13234800.
- Comba L, Biglia A, Aimonino DR, Barge P, Tortia C, Gay P. 2019. 2D and 3D data fusion for crop monitoring in precision agriculture. 2019 IEEE International Workshop on Metrology for Agriculture and Forestry (MetroAgriFor), 62–67. doi: 10.1109/MetroAgriFor.2019.8909219.
- Hall D, Llinas J. 1997. An introduction to multisensor data fusion. Proc IEEE. 85(1):6–23. doi: 10.1109/5.554205.
- Hall DL, McMullen SAH. 2004. Mathematical techniques in multisensor data fusion. Norwood, MA: Artech House.
- Hermanns R, Oppikofer T, Böhme M, Dehls J, Yugsi Molina FX, Penna I. 2016. Rock slope instabilities in Norway: first systematic hazard and risk classification of 22 unstable rock slopes from northern, western and southern Norway. In: Landslides and Engineered Slopes. Experience, Theory and Practice–Proceedings of the 12th International Symposium on Landslides (Vol. 12, p. 19). Rome, Italy: Associazione Geotecnica Italiana; p. 1107–1114.
- Hermanns RL, Oppikofer T, Anda E, Blikra LH, Böhme M, Bunkholt H, Crosta GB, Dahle H, Devoli G, Fischer L, et al. 2013. Hazard and risk classification for large unstable rock slopes in Norway. In: International Conference Vajont 1963-2013. Thoughts and Analyses after 50 Years since the Catastrophic Landslide; Oct 8-10; Padua, Italy. Italian Journal of Engineering Geology and Environment - Book Series (6). Sapienza Universitá Editrice, pp. 245–254.
- Kalman RE. 1960. A new approach to linear filtering and prediction problems. J Basic Eng. 82(1):35–45. doi: 10.1115/1.3662552.
- Kordestani M, Dehghani M, Moshiri B, Saif M. 2020. A new fusion estimation method for multi-rate multi-sensor systems with missing measurements. IEEE Access. 8:47522–47532. doi: 10.1109/ACCESS.2020.2979222.
- Kristensen L, Czekirda J, Penna I, Etzelmüller B, Nicolet P, Pullarello JS, Blikra LH, Skrede I, Oldani S, Abellan A. 2021. Movements, failure and climatic control of the Veslemannen rockslide, Western Norway. Landslides. 18(6):1963–1980. doi: 10.1007/s10346-020-01609-x.
- Leinauer J, Jacobs B, Krautblatter M. 2021. High alpine geotechnical real time monitoring and early warning at a large imminent rock slope failure (Hochvogel, GER/AUT). IOP Conf Ser: earth Environ Sci. 833(1):012146. doi: 10.1088/1755-1315/833/1/012146.
- Leinauer J, Weber S, Cicoira A, Beutel J, Krautblatter M. 2023. An approach for prospective forecasting of rock slope failure time. Commun Earth Environ. 4(1):253. doi: 10.1038/s43247-023-00909-z.
- Li C. 2015. Multi-sensor data fusion for geohazards early warning system – an adapted process model [Ph.D. thesis].
- Li C, Azzam R, Fernandez-Steeger TM. 2016. Kalman filters in geotechnical monitoring of ground subsidence using data from mems sensors. Sensors (Basel, Switzerland) 16
- Liggins M, Hall D, Llinas J. 2017. Handbook of multisensor data fusion: theory and practice. 2nd ed. Boca Raton: Electrical Engineering\& Applied Signal Processing Series, CRC Press.
- Ling Q, Qu W, Zhang Q, Kong L, Zhang J, Zhu L. 2020. Improved Kalman filter method considering multiple factors and its application in landslide prediction. Front Earth Sci. 14(3):625–636. doi: 10.1007/s11707-019-0796-2.
- Liu C, Shao X, Li W. 2019. Multi-sensor observation fusion scheme based on 3D variational assimilation for landslide monitoring. Geomatics Nat Hazards Risk. 10(1):151–167. doi: 10.1080/19475705.2018.1513871.
- Luo, R.C., Yih, C.C., and Su, K.L., 2002. Multisensor fusion and integration: approaches, applications, and future research directions, IEEE Sensors J.2 (2), 107–119. doi: 10.1109/JSEN.2002.1000251.
- Mishra M. . 2022. Modeling and information reconstruction from landslide monitoring data [Theses]. Université Grenoble Alpes.
- Noordam A, Zuada Coelho B, Teixeira A, Venmans A. 2020. Data-fusion in geotechnical applications BT - information technology in geo-Engineering. Cham: springer International Publishing, p. 365–375.
- Oppikofer T, Bunkholt H, Fischer L, Saintot A, Hermanns R, Carrea D, Longchamp C, Derron MH, Michoud C, Jaboyedoff M. 2012. Investigation and monitoring of rock slope instabilities in Norway by terrestrial laser scanning, 1235–1241.
- Sasiadek JZ, Hartana P. 2000. Sensor data fusion using Kalman filter. Proceedings of the Third International Conference on Information Fusion, 2, WED5/19–WED5/25 vol.2. doi: 10.1109/IFIC.2000.859866.
- Smith D, Singh S. 2006. Approaches to multisensor data fusion in target tracking: a survey; approaches to multisensor data fusion in target tracking: a survey.
- Sun S, Lin H, Ma J, Li X. 2017. Multi-sensor distributed fusion estimation with applications in networked systems: a review paper. Information Fusion. 38:122–134. doi: 10.1016/j.inffus.2017.03.006.
- Tofani V, Ventisette CD, Moretti S, Casagli N. 2014. Integration of remote sensing techniques for intensity zonation within a landslide area: a case study in the northern Apennines, Italy. Remote Sens. 6(2):907–924. doi: 10.3390/rs6020907.
- Zhu X, Cai F, Tian J, Williams T. 2018. Spatiotemporal Fusion of multisource remote sensing data: literature survey, taxonomy, principles, applications, and future directions. Remote Sens. 10(4):527. doi: 10.3390/rs10040527.