
 ?Mathematical formulae have been encoded as MathML and are displayed in this HTML version using MathJax in order to improve their display. Uncheck the box to turn MathJax off. This feature requires Javascript. Click on a formula to zoom.
Abstract
Analyzing and optimizing the spatio-temporal characteristics of terrestrial ecosystem carbon storage, as well as examining their coupling and coordination relationships with industrial mining land and landscape pattern, can become a reference in the pursuit of carbon peaking and carbon neutrality for mining cities. This research takes the typical mining city of Ordos as the study target. Based on the LULC, the Multi-objective Planning (MOP) and Patch-generating Land Use Simulation (PLUS) model are used to predict the LULC under the natural development (Q1), ecological protection (Q2) and economic development (Q3) scenarios of 2030, and the Integrated Valuation of Ecosystem Services and Trade-offs (InVEST) model is used to analyze the dynamics of carbon storage, finally a coupling coordination of industrial mining land, landscape pattern and carbon storage is constructed to investigate the interrelationship between them. The results show: (1) From 2000 to 2020, carbon storage shows an inverted ‘V’ shape of rising and then falling; (2) Compared to carbon storage in 2020, the Q1 demonstrates a decrease, while the Q2 and Q3 demonstrate increases; (3) From 2000 to 2020, the coupling coordination degree decreases, and in the future, Q2 and Q3 show an increase in it relative to the Q1.
1. Introduction
Mining cities are a category of cities that are formed or developed as a result of mineral resources development and predominantly provide the society with mineral products and their primary processing products (Long et al. Citation2022). Current issues of urbanization, industrialization, and sustainability are intertwined and exhibit complex patterns and characteristics; this complexity is especially evident in mining cities (Jiao et al. Citation2021), which frequently face ecological degradation, excessive carbon emissions, and depletion of nonrenewable natural resources (Martinez-Fernandez et al. Citation2012). As a result of global warming and accelerated industrialization, ‘carbon emission and carbon reduction’ have become a hot topic of study around the globe (Wang et al. Citation2023). In 2020, the Chinese government announced at the 75th United Nations General Assembly that China aims to peak its carbon emissions by 2030 and achieve carbon neutrality by 2060 (Yang et al. Citation2022). China faces considerable challenges in meeting its carbon neutrality targets due to the tight timeframe and a larger fossil fuel-based energy mix than the EU and the US. Therefore it is critical to assess and identify important carbon mitigation pathways for China to achieve carbon neutrality. Current proposed pathways for attaining carbon neutrality include: carbon capture, utilization, and storage (CCUS); ecosystem carbon sinks; bioenergy with carbon capture and storage (BECCS); other negative emission technologies (NETs), etc. (Wei et al. Citation2022). These pathways provide essential carbon neutrality guidelines for localities.
Extensive human activities have resulted in accelerated landscape pattern changes during the development of mining cities (Hou et al. Citation2020). The rapid expansion of urban areas and the occupation of cropland, forests and grassland have had a significant impact on the structure and function of urban landscapes and ecosystems (Cetin et al. Citation2018), resulting in fragmented landscapes, continued vegetation and carbon sink losses, and other issues that threaten the ecological security and sustainable development of cities (Xu et al. Citation2016). Mining activities in urban areas result in the extraction of natural flora and fertile topsoil, leading to enduring marks on the terrain, degradation of soil quality and significant modifications to both the living and non-living elements of ecosystems (Mishra et al. Citation2022), The tremendous damage inflicted upon the flora, fauna, water and soil features of the area has had a significant impact on the biomes, terrain and general environment (Thakur et al. Citation2022). Consequently, from the perspective of landscape pattern, it is essential to assess the expansion of industrial and mining areas caused by mining city development, the risks faced by the landscape pattern, and the changes in the spatial and temporal patterns of carbon storage, as well as the relationship between them, optimizing the carbon storage of urban terrestrial ecosystems and carbon emission reduction are of great importance for optimizing the spatial configuration (Liu et al. Citation2022).
Carbon storage is the quantity of carbon accumulated in a regional terrestrial ecosystem. (He et al. Citation2016). Carbon storage in terrestrial ecosystems is crucial to the global carbon cycle, atmospheric CO2 concentration, and global climate change (Houghton Citation2003), and the annual net carbon uptake of terrestrial ecosystems ranges from 2.0 Pg to 3.4 Pg (Pan et al. Citation2011). The increase in terrestrial ecosystem carbon storage is therefore effective in reducing atmospheric CO2 emissions and is regarded as one of the most economically viable and environmentally benign means of mitigating the greenhouse effect’s global climate impact (Piao et al. Citation2009). Climate change and anthropogenic changes in the land use and land cover (LULC) dynamics are considered to be the two most important factors influencing carbon storage in terrestrial ecosystems (Zaehle et al. Citation2007). Variation in carbon storage in terrestrial ecosystems is affected by the alteration of their structure, function and processes, which is frequently accompanied by substantial carbon exchange (Vizcaíno-Bravo et al. Citation2020), and the carbon emissions resulting from LULC change have a large share in the global scale (DeFries et al. Citation1999). The precise examination of LULC alterations facilitates a comprehensive comprehension of their effects on ecosystems, while concurrently aiding in the effective implementation of environmental management strategies (Cetin Citation2019). Therefore, investigating the spatial and temporal variations in the dynamics of urban carbon storage based on LULC is essential for achieving carbon neutrality, improving the global climate and promoting regional sustainable development (Wang et al. Citation2022).
Current methods for assessing urban carbon storage primarily involve field surveys, remote sensing and simulation models. The primary methods for field surveys include soil profile methods (Cusack et al. Citation2018) and sample inventory methods (Krogh et al. Citation2003), but they are more difficult to implement for large study areas (Zhou et al. Citation2021), and studies based on geophysical and chemical processes have stringent parameter requirements, so the accuracy of large-scale carbon storage assessments is not ideal (Zhang et al. Citation2023). As remote sensing technology has continued to develop in recent years, the method of using remote sensing data to estimate carbon storage has become an increasingly popular area of research (Qi et al. Citation2023). Unlike the conventional field survey technique, the model simulation method can assess carbon storage changes at multiple dimensions and visualize the assessment results spatially (Kumar et al. Citation2022). Numerous researchers have conducted carbon storage research using models such as CASA model (Kelong et al. Citation2011) and FORCCHN model (Ma et al. Citation2017). Among them, the Integrated Valuation of Ecosystem Services and Trade-offs (InVEST) model has been widely used in international research due to its ease of use, flexible parameters, and relatively accurate results, as well as its support for different scenarios and scales of assessment and analysis (Li et al. Citation2021; Liu et al. Citation2022). The carbon storage and sequestration model within the InVEST model can accurately assess changes in carbon storage due to LULC, and the current assessment scales using the InVEST model include national (González-García et al. Citation2022), coastal zone (Islam et al. Citation2022), urban agglomerations (Jiang et al. Citation2017), provincial (Wang et al. Citation2022), etc. For instance, Aneseyee et al. (Citation2022) who studied the upper Omo Gibe Basin in Ethiopia, found that carbon storage was negatively correlated with altitude, population pressure and land use intensity. Tao et al. (Citation2015) concluded that carbon intensity decreases with increasing intensity of urban development in Changzhou, China. Strohbach & Haase (Citation2012) studied Leipzig and concluded that great care should be taken when transferring carbon storage values between cities. All of these investigations demonstrate the validity of the InVEST model. As one of the key parameters for calculating carbon storage in the InVEST model, the impact of LULC alterations on the terrestrial carbon cycle will become a new area of study in the future. Future scenarios facilitate effective links between future land use simulations and optimal land use strategies by describing various future development possibilities, which has enticed numerous scholars to conduct research in this area (Tian et al. Citation2022). Meanwhile, development activities in mining cities significantly alter the LULC and severely damage local regional ecosystems (Zhu et al. Citation2022), necessitating accurate modeling and forecasting of the LULC for the future sustainable development planning of mining cities, which is also essential for the analysis of future carbon storage evolution trends.
To simulate future changes in LULC, numerous scholars have developed diverse models, such as Dyna-CLUE (Wang et al. Citation2021), FLUS (Liu et al. Citation2017), CA-Markov (Sang et al. Citation2011), etc. Among them, the Patch-generating Land Use Simulation (PLUS) model (Liang et al. Citation2021) can analyze the probability of land class transfer based on geographic cellular automata and random forest algorithms, etc. It outperforms other models in terms of location, quantity, fine-scale cellular variation and landscape pattern similarity, so scholars are progressively adopting it (Wei et al. Citation2022). The majority of LULC demand forecasting is based on Markov models, which presume that future trends will mirror historical shifts (Yao et al. Citation2017). However, because of this, it is difficult for the model to take into account the individual development characteristics of different research areas, and in particular, it lacks consideration for future policy implementation (Guan et al. Citation2019). China faces a variety of development challenges, including urbanization, ecological civilization construction and rural revitalization. Therefore, it is necessary to consider the multiple objectives of economic, social and ecological benefits when building simulation scenarios (Cetin Citation2016). Meanwhile, multi-objective integrated decision making to maximize land use benefits is a hot research topic in the field of land use planning. MOP (Multi-objective planning) models can coordinate complex land use and socioeconomic constraints in cities to find optimal solutions while considering the uncertainty of constraints to enhance the scientific allocation of land resources (Li et al. Citation2022). Combining MOP and PLUS models for land use structure optimization studies allows for more effective management of competing objectives and dynamic spatial optimization in complex land use systems (Shi et al. Citation2023), predicting the LULC under different scenarios. In summary, MOP is a ‘top-down’ model for optimizing the quantitative structure of LULC, PLUS is a ‘bottom-up’ spatial simulation function, and InVEST model is a spatial-temporal carbon storage evolution analysis approach (Guo et al. Citation2022).
But when LULC changes are imperceptible, it is difficult to determine the extent of ecosystem disturbance. Therefore, it is necessary to thoroughly evaluate the effect of landscape pattern on carbon storage. The landscape pattern influences and determines the size, structure and connectivity of various ecological process patches, which highly concentrates the significance of landscape characteristics and can reflect the LULC structural composition, spatial configuration and dynamic changes (Wang & Wang Citation2022). The complex relationship between industrial and mining development, landscape pattern and carbon storage necessitates investigation into the dynamic interactions between multiple factors and methods to reconcile them (Chen et al. Citation2022). Coupling Coordination Degree Model (CCDM) is now extensively used to investigate coupling relationships and the degree of interaction between different systems (Fang et al. Citation2016), and has become an important paradigm for exploring the interrelationships between cities and the environment. Currently, from the research content perspective, some researchers have explored the relevance of ecosystem service functions and landscape patterns by analyzing their spatial and temporal variability (Zang et al. Citation2017; Chen et al. Citation2021). For example, Hu et al. (Citation2021) assessed the coupled and coordinated relationship between landscape patterns, ecosystem service values and human well-being and showed that changes in landscape patterns affect ecosystem service values. However, research has mainly focused on the state and changes in the landscape and ecology in the past, and there is a lack of forecasting and analysis of development in future scenarios (Zhang et al. Citation2022). From the research scale perspective, Liu et al. (Citation2021) conducted a study on landscape index, coal mining activities and carbon storage in an open-pit mine, but there is a lack of research on a larger scale or for mining cities. Based on the above-mentioned situation, this research carries out a coupling coordination analysis of industrial mining land, landscape pattern and carbon storage in three states: past, present and future, in order to explore the applicability of the coupling coordination model and fill the existing gaps.
Drawing from the aforementioned research findings, this study aims to evaluate the potential effects of urban expansion and mining activities on regional carbon storage in mining cities. To achieve this objective, we employ the InVEST model to estimate the carbon storage of LULC in both historical and projected future scenarios. And combine carbon storage with industrial mining land and landscape pattern to develop a new coupled and coordinated model that enables connected and coordinated analyses of industrial mining land, landscape pattern and carbon storage in the past, present and future. The model integrates the strengths of MOP, PLUS and InVEST, enabling precise simulation of urban sprawl and quantitative assessment of carbon storage, hence enhancing the accuracy of the analysis outcomes. The objective of this study is to enhance the current research methodologies and findings, analyze the past development of mining cities, propose prospective policy strategies, investigate the suitability of coupling coordination models, and address any existing research deficiencies.
Ordos, Inner Mongolia Autonomous Region, China, is a typical mining city. Its coal mining has advanced the socioeconomic development of the Yellow River basin and beyond, but at the expense of the ecological environment and the surrounding environment, as evidenced by surface subsidence, reduced vegetation biomass, landscape fragmentation, rising carbon emissions and diminished carbon sink capacity (Zhou & Zhao Citation2013), which urgently requires ecological management and restoration. However, there is a lack of a clear study of the development and extent of damage over the last 20 years. Based on the InVEST model and the MOP-PLUS model, this research analyzes, simulates and predicts the spatial and temporal changes of LULC and carbon storage in Ordos from 2000 to 2020 and the development trend of LULC and carbon storage in 2030, and innovatively explores the coordination between carbon storage and the development of landscape pattern and industrial mining land based on the coupling coordination model, with a view to sorting out the development cycle of mining cities and providing support for ecological restoration and land use planning in mining cities under the goals of carbon peaking and carbon neutrality.
This research chooses Ordos as a case study of a mining city in order to: (1) analyze the changes in land use patterns and the resulting spatial and temporal changes in carbon storage in Ordos over the past 20 years; (2) simulate how the future land use patterns of Ordos will change under different development scenarios and the carbon storage corresponding to different development scenarios and reveal its spatio-temporal variation; (3) elucidate the mechanisms of coupling impacts of industrial mining land, landscape pattern and carbon storage under past and projected scenarios, and explore future urban development strategies. This study can provide scientific recommendations and decision-making support for ecological restoration and land use planning in Ordos in accordance with the objectives of carbon peaking and carbon neutrality, as well as case studies for the development of other mining cities.
2. Materials and methods
2.1. Study area
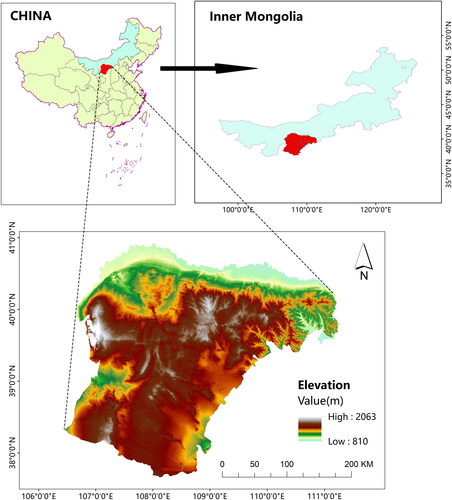
Ordos is situated in Inner Mongolia Autonomous Region, China, at 37°18′∼40°17′ N, 106°27′∼111°27′ E, with a total land area of approximately 86,800 km2 and a climate that is classified as temperate continental. The terrain is elevated in the west and low in the east, with an average elevation between 1,000 and 1,500 meters, and is situated in the ‘several bends’ hinterland of the Yellow River. The northern portion of Ordos is the Yellow River alluvial plain, the eastern portion is the hilly and gully erosion area and arsenic sandstone exposed area, and the central portion is comprised of the Mu Us Desert and the Kubuqi Desert. The Ordos has abundant coal resources, with a coal-bearing area of approximately 61,000 square kilometers and proven coal reserves of 238.3 billion tons, accounting for approximately two-thirds of the entire autonomous region and one-sixth of the country, and is one of the country’s major coal-producing regions. In the region, there are four main coal fields: Junggar Coalfield, Dongsheng Coalfield, ZhuoZishan Coalfield and Shanghai Miao Coalfield. The Dongsheng and Shanghai Miao coal fields are mined primarily through underground workings, while the Zhunger and ZhuoZishan coal fields are mined primarily through surface mining. depicts the location of the research region.
Figure 1. Overview map of Ordos.
(China map vector boundary from the Ministry of Natural Resources: GS(2020)4619, no modification from the base map boundary)
2.2. Data
The relevant data sources are enumerated in ; the research data consists of three categories: LULC data, natural environment data and socioeconomic data of Ordos. The LULC data for the years 2000, 2010 and 2020 are obtained from the Chinese Academy of Sciences’ Data Center for Resources and Environmental Sciences. In the original data, the primary category of ‘urban, rural, industrial, mining, and residential land’ includes ‘urban land’ (referring to land in large, medium, and small cities and built-up areas above the level of county towns), ‘rural settlement’ (referring to rural settlements independent of cities and towns), and ‘other construction land’ (referring to land for factories, mines, large industrial areas, oil fields, salt fields, quarries, etc., as well as transport roads). According to the actual circumstance in Ordos, ‘other construction land’ comprises a significant portion of the region’s mines and industrial zones. In this study, the term ‘other construction land’ has been renamed ‘industrial mining land’ to facilitate the description of the results of the analysis and to more precisely target the effect of the distribution of industrial and mining land in the study area on LULC and carbon storage. While ‘urban land’ and ‘rural settlement’ are reclassified and incorporated, the new land type is referred to as ‘urban rural land’. The natural environment data and socio-economic data were inputs into the PLUS model, and all the data resolution was resampled to 30 m, as shown in .
Figure 2. Map of plus model driving factors.
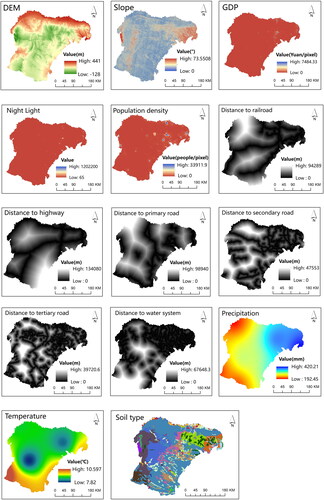
Table 1. The data sources used in this research.
2.3. Methods
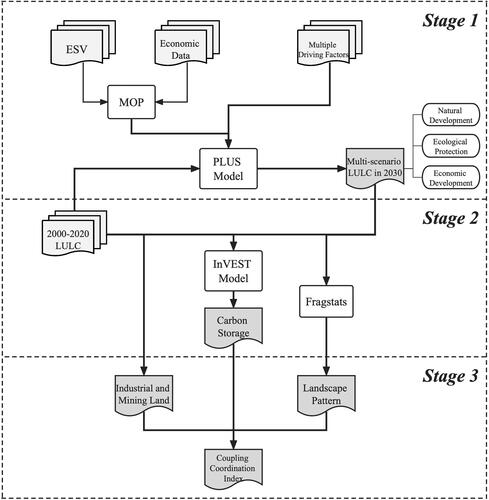
The study is divided into three sections, and depicts the technical route: The first part uses the 2000–2020 LULC, the MOP-PLUS model, setting three scenarios of natural development (Q1), ecological protection (Q2) and economic development (Q3) to derive the 2030 land use prediction data; the second part calculates the carbon storage based on the LULC under the three scenarios of 2000–2020 and 2030 using the InVEST model; and the third part calculates the landscape pattern index based on the LULC using Fragstat software. And construct a coupling coordination degree model of industrial mining land, landscape pattern and carbon storage in order to examine their coordinated development relationship.
Figure 3. Technology road map.
2.3.1. InVEST model
The InVEST model employs land use data and the corresponding carbon density values for each land use category in order to estimate the carbon storage within each grid cell, and the carbon storage module of the InVEST model consists of four primary carbon pools: aboveground biomass (carbon in living vegetation on land), belowground biomass (carbon in living plant roots), soil organic matter (carbon in soil), and dead organic matter (carbon in plant carbon in dead plant litter). 4 carbon reservoirs. Total carbon storage is computed using the following formula:
(1)
(1)
(2)
(2)
Where is the land use type;
is the total carbon density of land use type i;
is the carbon density of above-ground vegetation of land use type i;
is the carbon density of underground living roots of land use type i;
is the carbon density in soil of land use type i;
is the carbon density of vegetation die-off of land use type i;
is the total carbon storage;
is the total area of land use type i;
is the total number of land use types, and in this research
=7.
The fifth primary carbon pool of harvested wood products or related wood product areas in the model is disregarded due to the fact that the four primary carbon pools satisfied the objective of the study and the difficulty of obtaining data. Many scholars have conducted studies on carbon density in multi-scale terrestrial ecosystems, and the outcomes have led to the establishment of a comprehensive database comprising literature and simulations pertaining to carbon density.
The determination of carbon density values for the study area in existing literature and databases primarily relies on the analysis of local measurements and relevant experimental data. For instance, Xu et al. (Citation2019) compiled carbon density data for terrestrial ecosystems in China by synthesizing information from published literature between 2004 and 2014, and integrating it with corresponding experimental data from the same period. This effort resulted in the creation of a comprehensive and systematic dataset on the organic carbon density of vegetation and soil in China. Similarly, Li et al. (Citation2013) computed and examined soil organic carbon density and storage in northeastern China using data from the Second Soil Survey of China and soil samples collected in the field.
Due to the challenges associated with acquiring field data, this study opted to rely on the extant findings of relevant scholars as the foundation for its research. In the process of selecting carbon density values, locally relevant measured data are preferred, followed by research results from neighbouring or similar regions as parameters to participate in the calculation of the InVEST model (Yu et al. Citation2010; Wang et al. Citation2022). Finally, the carbon density values of Liu et al. (Citation2021) for the study located at the intersection of Ordos and northern Shaanxi were used as the basis to obtain the carbon density values of each LULC in the study area (). In this study, the carbon density values of the four primary carbon pools of industrial mining land were set to zero to more intuitively represent the environmental harm caused by industrial mining land and its effect on carbon storage.
Table 2. Carbon density of land use types in Ordos (t/hm2).
2.3.2. Plus model
The PLUS model is a refined land use forecasting model that can take into account the policy-driven, steering role based on the FLUS model, which develops the Land Expansion Analysis Strategy (LEAS) and Cellular Automata (CA) based on multiple random patch seeds model (CARS) based on the Markov model for quantitative forecasting of land use demand (Liang et al. Citation2021). The LEAS module is able to extract the expansion component of each land use type from the two-phase land use data input and implement the random forest algorithm to determine the expansion trend of each land use type. The CARS module incorporates the parameter settings for land use demand, land transfer matrix, and neighborhood weights to simulate the effect of policies on future land use changes based on the expansion probability of each land use type predicted by the LEAS module. This research establishes three future development scenarios based on the Ordos urban development plan, namely natural development (Q1), ecological protection (Q2) and economic development (Q3), in accordance with the requirements of the current macro development strategy. Using Markov chain to predict the land demand of each category in 2030, the Q1 scenario is consistent with the 2010–2020 development trend. The Q2 and Q3 scenarios are designed to meet the two development trends under the macro policy, which are ecological conservation and maximum economic efficiency, respectively. The land demand is solved using the MOP model, and all land use types can be transferred to each other under three scenarios, the neighborhood weights are calculated according to the proportion of the expansion area of each land use type.
The Markov chain allows for a forecast of site demand in 2030 based on the probability of site transfer from 2010 to 2020, with the following formula:
(3)
(3)
denotes the land use type in 2030 derived from the prediction,
denotes the probability of land use type transfer from land type i to land type j, and
denotes the land use type in 2020.
2.3.3. Multi-scenario prediction of future land use
2.3.3.1. MOP model
MOP is a fundamental mathematical model for the study of geography and regional economic development. MOP is comprised of three components: decision variables, objective function and constraints, with an emphasis on the decision to make one or more objectives satisfy the requirements of the objective function under subjective or objective conditions. This study employs the MOP model to determine the demand for land under the Q2 and Q3 scenarios.
Land use change in Ordos is primarily the result of the combined influence of social, economic and ecological benefits. However, as social benefits refer primarily to the degree of demand for land by various social classes, which is primarily reflected in the restrictions or protection of various land cover types in relevant policy documents, it is difficult to quantify a single maximum or minimum objective function. Consequently, this study selects economic and ecological benefits as the two direct objectives, which correspond to the predetermined Q2 and Q3 scenarios, while social benefits are reflected in the constraints.
The Q2 scenario, which prioritizes ecological conservation, focuses on restoring ecosystem functions and protecting the ecosystem. The objective function of the Q2 scenario, which seeks to maximize the value of ecosystem services (ESV), is:
(4)
(4)
denote ecological benefits; j is the j-th type of decision variables;
is the coefficients of ecological benefits of different land uses under unit area respectively. Taking into account the characteristics of land use in the study area, the seven land use types are used as decision variables: cropland, forest, grassland, water, urban rural land, industrial mining land and barren land, and
is the area of each decision variable.
The Q3 scenario prioritizes economic development by emphasizing the expansion of land categories with high economic efficiency. The Q3 scenario’s objective function is to maximize economic efficiency.
(5)
(5)
denote economic benefits; j is the j-th type of decision variables;
is the coefficients of economic benefits of different land uses under unit area respectively. The land use type is as same as Q1 and
is the area of each decision variable. The economic efficiency coefficients of cropland, forest, grassland and water are obtained by counting the output value of agriculture, forestry, animal husbandry and fishery in the study area respectively; the economic efficiency coefficient of industrial mining land is obtained from the output value of industrial mining land in the study area; the economic efficiency coefficient of urban rural land is calculated from the output value of secondary and tertiary industries excluding the output value of industrial mining land.
2.3.3.2. ESV
Based on the ecosystem service value assessment system proposed by Costanza et al. (Citation1998) and others, the Chinese ecosystem service value equivalent factor table constructed by Xie et al. (Citation2015) through a questionnaire survey of several Chinese experts in the field of ecology was used to determine the value of ecosystem services per unit in the study area. Moreover, by examining the Ordos Statistical Yearbook, China Agricultural Products Price Survey Yearbook and other statistical data to make corrections based on Equationequation (6)(6)
(6) (Xie et al. Citation2003), that is, a standard ecosystem service value equivalent factor equals one-seventh of the economic value of food production per unit of agricultural area, and the value of ecosystem services per unit area of farmland in Ordos is 2,117.44 CNY/ha based on the agricultural production.
(6)
(6)
denotes the economic value of food production services provided by each hectare of farmland ecosystem (yuan/ha),
and
denote the sown area, average price and production value per hectare of food crops, respectively, and M is the total planted area.
(7)
(7)
is the value of ecosystem services per unit area,
is the equivalent value of the value of ecosystem services provided by each land class per unit area as calculated by Xie et al. (Citation2015) i denotes the i-th land class and j denotes the j-th ecosystem service.
The ESV is calculated as:
(8)
(8)
denotes the total annual value of ecosystem services,
denotes the area of the land use type i, and j denotes type j ecosystem services. The table of ecosystem service values per unit area for each category in Ordos is shown in .
Table 3. Table of ecosystem service values per unit area by category in Ordos (CNY/hm2).
2.3.3.3. Constraint conditions setting
The Ordos Territorial Spatial Master Plan (2021–2035) sets out the corresponding planning policies for the development of the region as a whole and for different land types. This research sets limits on the development of each land type in Ordos in 2030 based on this plan, and the total constraints for the Q2 and Q3 scenarios are set as follows:
Total area
The sum of the areas of the various land types remains constant and equals the total area of the study area.
(9)
Cropland
From 2010 to 2020, cropland in Ordos is trending downward. The lower limit is set at 0.95 times the area in 2020 and the upper limit is set at 1.05 times the area in 2020 in order to realise the scale of cropland that should be protected as much as possible, to protect the space for agricultural production, and to construct a red line for cropland protection.
Forest
Actively encourage afforestation and greening, plan the nation’s greening strategy and the greening of strategic locations, strengthen the protection of natural forest resources, and increase the area covered by forests. As a result, set the lower limit as the area in 2020 and the upper limit as the Markov chain forecast.
Grassland
The plan actively expands the scope of the grassland and enhances its conservation and restoration. Grassland is extensively dispersed across Ordos. The lower limit is established for the area in 2020 and the upper limit is established for the area in 2010, as the extent of grassland declines obviously from 2010 to 2020.
Water
Planning to strengthen the ecological environment management of river and lake systems, promote ecological protection and restoration of wetlands, carry out groundwater overdraft area treatment, and continue to promote the construction of soil and water conservation projects, while promoting the ecological restoration and management of the Yellow River basin, so set the lower limit for the area in 2020 and the upper limit for the Markov chain prediction.
Urban Rural Land
Coordinated delineation of urban development boundaries, optimization of living space, promotion of the concentration of urban and rural land in towns and cities to concentrated construction areas within the development boundaries, reasonable expansion of urban rural land, setting the lower limit for the area in 2020 and the upper limit for 1.15 times the area in 2020.
Industrial Mining Land
Plan to complete the restoration and treatment of significant and difficult mines by 2025, while strengthening the restoration of the geological environment of mines, rational development of energy and mining resources, and optimization of the spatial layout of energy resources, with the lower limit set as the area in 2020 and the upper limit as the Markov prediction.
Barren Land
In the hilly gullies of the Loess Plateau, strengthen the management of moving sand dunes, the prevention and control of desertification, and the implementation of the preservation and restoration of the ecological function area for soil and water conservation. The lower limit should be the 2010 area and the upper limit should be the Markov chain’s predicted value.
Population
According to the plan, by 2030 the resident population will exceed 2.25 million and the urban population will exceed 1.8 million. Setting the population density of cropland, forest and grassland at 2.201 persons/ha and urban and rural land at 18.745 persons/ha.
Ecological benefits
The ecological benefits in 2030 will be no less than those in 2020.
Economic benefits
The economic benefits in 2030 are not lower than those in 2020.
2.3.4. Landscape pattern
This research employs the landscape pattern index to quantify the landscape pattern of the study region. The landscape pattern index is an essential instrument for analyzing the spatio-temporal characteristics of landscape patterns, as it reflects the composition and spatial configuration of the landscape structure and the evolution of landscape patterns (Zhang et al. Citation2022). The number of patches (NP), patches density (PD), landscape shape index (LSI), aggregation index (AI), Shannon’s diversity index (SHDI) and Shannon’s evenness index (SHEI) are selected to combine with the characteristics of Ordos to construct its landscape pattern index, which is calculated by using Fragstats 4.2 software. contains the formulas and descriptions of their significance. The selected indices reflect the degree of aggregation, degree of fragmentation, connectivity and other characteristics of the urban landscape, thereby representing its comprehensive characteristics.
Table 4. Selection of the landscape pattern index and its description.
Considering the different original data outline of the landscape pattern index, the normalization method (Li et al. Citation2012) is used to standardize each index, and the formula is:
(20)
(20)
is the original value of the index,
is the normalized value, and
and
are the maximum and minimum values of
The positive and negative effects of indicators such as the number of patches (NP), patch density (PD) and landscape shape index (LSI) must be distinguished when standardizing data using the polarization method. Negatively, the greater the value, the greater the fragmentation of areas, so the standardization formula for negative indicators must be applied. The standardized data are weighted using the entropy weighting method, and the weighted sum is used to calculate the integrated landscape index, which ranges from 0 to 1, with a higher value indicating a more integrated landscape pattern. In the meantime, the carbon storage and industrial mining land are normalized using the extreme difference method, and lastly, the coupling coordination degree of industrial mining land, landscape pattern and carbon storage is calculated.
2.3.5. Coupling coordination degree model
Coupling is the interaction between two or more systems that results in mutual influence. Positive and negative impacts on ecosystem services are cumulative over time and space as a result of human development and use activities that are continuously altering the regional landscape. Continuous expansion of industrial mining land in Ordos encroaches on high-carbon land types, destroying the landscape pattern and weakening the carbon storage service function, whereas an increase in high-carbon storage land types will optimize the landscape pattern and increase carbon storage capacity. Enhancing forest and grassland connectivity or reducing their fragmentation can mitigate the loss of carbon storage and enhance regional ecosystem services (Su et al. Citation2012). Therefore, there is a mutually reinforcing and coercive interaction between industrial mining land, landscape pattern and carbon storage. Similarly, the analysis of mining activities should not be limited to the scale of mines, but should also examine whether the demand for qualitative development on a larger scale can be met (Wang et al. Citation2017). In this study, a coupling coordination model is constructed at the urban scale by selecting industrial mining land, landscape pattern and carbon storage in Ordos to determine the degree of coordination between them. (Liu et al. Citation2021).
The degree of coupling is the degree of interaction between systems and is given by the formula:
(21)
(21)
is the landscape pattern index;
are the normalized industrial mining land and carbon storage;
is the coupling degree of industrial mining land, landscape pattern and carbon storage, which is between 0 and 1, the greater the coupling degree is, the stronger interaction among the three subsystems would be, the weaker interaction conversely (Yang et al. Citation2020).
In order to avoid a situation in which multiple systems have a very low level of development but a high degree of coupling, a coupling coordination degree model is developed to characterize the degree of coordinated development between the unions using the following formula:
(22)
(22)
(23)
(23)
is the comprehensive coordination index;
are the weights of each index, here
=
=
=1/3;
is the coupling coordination degree of them, the larger the value indicates the more coordination between the systems, and the grading criteria are shown in .
Table 5. Classification level of coupling coordination degree.
This study employs the industrial mining land area to designate industrial mining land. In addition, industrial mining land, landscape pattern and carbon storage all have different dimensions and orders of magnitude, so the normalization method (Equationequation (20)(20)
(20) ) is used to standardize industrial mining land and carbon storage prior to calculation, and the coupling coordination degree of industrial mining land, landscape pattern and carbon storage is then calculated.
3. Results
3.1. Spatial and temporal changes of carbon storage in Ordos from 2000 to 2020
3.1.1. Land use changes in Ordos from 2000 to 2020
During 2000–2020, grassland is the predominant land type in Ordos, accounting for an average of 60.81%, followed by barren land and cropland, accounting for an average of 27.99% and 5.31% respectively, while forest, water, urban rural land and industrial mining land account for less than 5% of the total urban land area (). With the city’s continuous development over the past two decades, the area of various categories of land has changed to varying degrees (). industrial mining land has continued to expand, increasing by 916.95 km2 and as much as 2371%, while cropland and grassland have decreased by 80.88 km2 and 1,087.44 km2, or 1.80% and 2.05%, respectively. In 2020, the area of water decreases by 54.13 km2, the area of arid land decreases by 302.9 km2, and the area of forest and urban rural land respectively increases by 477.3 and 128.79 km2. It can be seen from that the expansion area of industrial mining land is mainly located in the northeast of Ordos in the Dongsheng district, Junggar banner, Ejin Horo banner and other original around the built-up area, it encroaches on the original land types such as grassland and cropland; the new area of forest is mainly located along the Yellow River in the north of Ordos to play the role of windproof and sand-fixing and water-conserving.
Figure 4. Land use map of Ordos from 2000 to 2020.
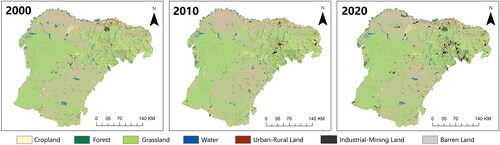
Table 6. Area and proportion of land use types in Ordos by period from 2000 to 2020 (km2).
The land use change of each category in Ordos between 2000 and 2020 is analyzed, and a land use transfer matrix () is constructed. The conversion of cropland to grassland and forest is greater, with 281.31 and 117.39 km2 respectively. This trend is primarily attributable to the national policy of ‘returning cropland to forest and grass’, which has resulted in a significant quantity of cropland being converted to forest and grassland. With the rapid urbanization process, urban rural land and industrial mining land have encroached upon cropland and grassland, with 119.37 km2 of cropland converted into urban rural land and industrial mining land and 711.83 km2 of grassland converted. Because the country actively promotes the construction of the protection forest project, 1,523.38 km2 of barren land have been converted to grassland and 253.57 km2 have been converted to forest. In varying degrees, water has also been converted into cropland, grassland, industrial mining land and other land types.
Table 7. Land use transfer matrix in Ordos from 2000 to 2020 (km2).
3.1.2. Changes in the quantity of carbon storage
The carbon storage and sequestration model of the InVEST model was used to calculate the carbon storage of Ordos in 2000, 2010 and 2020, and the carbon storage was calculated to be 753.81 × 10⁶t, 761.21 × 10⁶t and 753.17 × 10⁶t, respectively ( and ), demonstrating an inverted ‘V’ trend of increasing then decreasing carbon storage. There is a modest increase in urban carbon storage between 2000 and 2010, with a value-added of 7.4 × 10⁶t, an increase of 0.97%, compared to a larger decrease between 2010 and 2020, with a value impairment of 10.04 × 10⁶t, a decrease of 1.34%. From the perspective of LULC, grassland is the land type with the greatest capacity to store carbon in Ordos, followed by barren land, cropland, forest, water, urban rural land and industrial mining land. Ordos is rich in mineral resources, and over the past two decades, the development of mineral and associated industrial industries has encroached on grassland, cropland and barren land, which is the primary cause of the decline in land carbon storage.
Figure 5. Distribution of carbon storage in Ordos from 2000 to 2020.
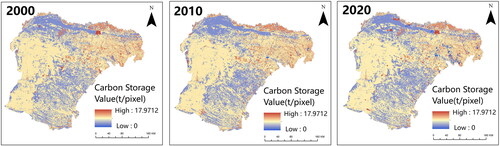
Table 8. Land use carbon storage in Ordos from 2000 to 2020 (106t).
3.1.3. Spatial variation of carbon storage
shows that there is little change in the spatial distribution of carbon storage in Ordos between 2000 and 2020, with areas with high carbon storage primarily being grassland, barren land, and forest, and areas with low carbon storage primarily being industrial mining land and urban rural land. The majority of the places in Ordos have had no change in the amount of carbon stored; the area that has seen a drop in storage is primarily where industrial mining land development has occurred, and the part of carbon storage increase is mainly the scattered areas of cropland, grassland and forest.
3.2. Forecast of land use and carbon storage change in Ordos
3.2.1. Multi-scenario land use change
Using 2020 as a baseline, the PLUS model predicts the LULC distribution for the three development scenarios in 2030 ( and ). Under the Q1 scenario, the area of cropland and grassland continues to decrease, decreasing by 376.08 km2 and 1,171.85 km2 respectively; the area of urban rural land decreases slightly, decreasing by 5.31 km2; the area of forest, water, industrial mining land and barren land increases, with the largest increase being 761.39 km2. In terms of the transfer direction of land area, reduced grassland is predominantly converted into cropland, forest, barren land and water, whereas industrial mining land, despite changing the most, is rarely converted into other land types and the increase results from a large transfer of grassland and cropland. The change in land use structure predicted by the natural development scenario mirrors the inertia tendency predicted by the current development model, i.e. economic and social development will result in certain ecological and environmental losses.
Figure 6. Land use distribution of three predicted scenarios in Ordos.
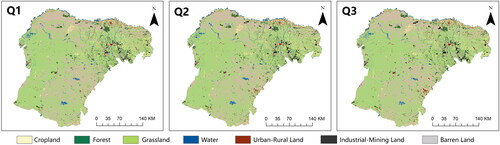
Table 9. Area of different land use types in 2030 under different development scenarios and their changes compared to 2020 in Ordos (km2).
Compared to the LULC of 2020, forest, grassland, water and urban rural land continue to increase under the Q2 scenario by 490.42, 283.78, 138.45 and 69.35 km2, respectively, while cropland and barren land decrease by 220.93 and 761.07 km2, respectively, and industrial mining land remains unchanged. The cropland is primarily converted to grassland and urban rural land, the expansion of industrial mining land area is severely constrained, and the barren land is primarily converted to forest, grassland and water. Compared to Q1, the Q2 scenario alters the trend of cropland, grassland and barren land: grassland increases, cropland decreases, and barren land shifts to ecological land such as forest, which is more in line with the construction of the future urban ecological security pattern land. Urban rural land and industrial mining land are not significantly different from their actual values in 2020, indicating that urban expansion will be curtailed to maximize ecological benefits. However, given the current technical environment of urban planning, land planning and even multi-planning, it is more challenging to achieve a win-win situation between economic and ecological benefits.
Under the Q3 scenario, compared to the LULC of 2020, the area of urban rural land and industrial mining land increases by 133.63 and 162.98 km2, respectively, while water and grasslands remain the same as in 2020 without expanding, which can be interpreted as sacrificing certain ecological benefits in exchange for economic benefits. In this scenario, the area of cropland decreases by 25.96 km2 while the area of barren land transfers to ecological land, such as forests and economic land, such as urban rural land and industrial mining land, decreasing by 761.07 km2 and increasing by 490.42 km2 for the forest. Currently, the majority of the land space required for urban development is obtained by relocating undeveloped land outward.
3.2.2. Analysis of carbon storage changes in multiple scenarios
The carbon storage and sequestration model of the InVEST model is used to calculate the carbon storage value corresponding to each scenario based on land use data obtained from multi-scenario prediction ( and ). Carbon storage in the Ordos exhibits a rising and then falling trend from 2000 to 2020, with a total carbon storage of 746.30 × 10⁶t under the Q1 scenario, which is 4.87 × 10⁶t less than in 2020. In the Q2 and Q3 scenarios, the total carbon storage rises to 759.62 × 10⁶t and 759.72 × 10⁶t, respectively, which is an increase of 8.45 × 10⁶t and 8.55 × 10⁶t compared to 2020. The large-scale decrease of grassland and cropland and the continuous expansion of industrial mining land, that is the decrease of high-carbon storage land types and the increase of low-carbon storage land types, which lead to the decrease of total carbon storage, indicate that the continued development of the current trend will lead to the continuous dilution of carbon storage. In contrast, under the Q2 scenario, thanks to the vigorous protection of forests and grasslands, high-carbon land types continue to increase, resulting in an increase in total carbon storage compared to 2020, indicating that the implementation of environmental protection policies and the enhancement of the effectiveness of regional ecological protection can effectively fulfill the role of carbon sequestration in cities, and the effect is more significant. During 2020–2030, comparing the two development scenarios of natural development and ecological conservation, the urban carbon storage under ecological conservation measures that restrict the transfer of grassland and other land types to other land types is obviously more stable and avoids a rapid decline.
Figure 7. Carbon storage distribution of three predicted scenarios in Ordos.
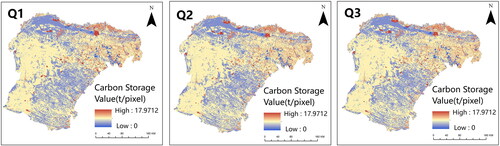
Table 10. Carbon storage of different land use types in 2030 under different development scenarios and their changes compared to 2020 in Ordos (106t).
Under the Q3 scenario, the decline in cropland reduces and forest increases relative to 2020, resulting in a rise in total carbon storage. Compared to the Q1 scenario, the significant expansion of cropland and grassland reduces the impact of the increase of urban rural land and the decrease of barren land on the total carbon storage, resulting in an increase in total carbon storage. However, the ESV in the Q3 scenario decreases by 150,800 yuan compared to the Q1 scenario, indicating that the change in carbon storage under the Q3 scenario is more concentrated in the economic high carbon storage category of cropland, while the lack of protection of grassland and the restriction of the expansion of urban rural land use makes the ecological benefits decrease compared to the Q1 scenario. Comparatively, the carbon storage under the Q3 scenario is essentially the same as under the Q2 scenario. However, the ESV under the economic development scenario decreases by 406,700 yuan, primarily due to the decrease of high ecological value land categories such as grassland and water and the increase of low ecological value land categories such as industrial mining land and urban rural land.
By controlling the growth and conversion of urban rural land, the implementation of an ecological protection strategy can effectively promote the stable growth of urban carbon storage and achieve the restoration of high carbon density ecological land such as forest and grassland, but the economic benefits will be diminished. Under the goals of carbon peaking and carbon neutrality, it is necessary to adhere to the ecological priority strategy, strengthen the implementation of ecological restoration policies such as returning cropland to forest and grassland, and regulate the development of land use types in order to realize the regional carbon cycle and sustainable development under ecological protection. Otherwise, excessive economic development will devastate the ecological environment and cause a series of larger problems, making ecological restoration more challenging.
3.3. Landscape pattern
Based on the analysis of the landscape pattern of Ordos from 2000 to 2020 at the patch scale, NP, PD and LSI of forest, industrial mining land and urban rural land exhibit an upward trend, whereas AI exhibits a downward trend, indicating that the fragmentation of forest, industrial mining land and urban rural land increases, the shape gradually becomes irregular, and the aggregation degree of patches decreases. In the 20 years, the NP and PD of cropland continue to rise, LSI first rises and then slightly falls, and AI first falls and then rises, indicating that the cohesion and aggregation of cropland show a trend of first falling and then slightly increasing; the barren land is the opposite of cropland, NP and PD continue to rise while LSI first falls and then rises, and AI first rises and then falls, indicating that the barren land turns to fragmentation after aggregation. Overall, the patch connectivity and aggregation of cultivated land increased and developed toward aggregation and orderliness, whereas the development of the remaining land types favored fragmentation and disorderliness.
On the landscape scale, NP, PD and LSI of Ordos show a continuous increase during 2000–2020, indicating that the landscape fragmentation in Ordos is becoming more severe and the shape irregularity is gradually increasing; the aggregation AI shows a decreasing trend year by year, indicating that the aggregation degree of Ordos landscape is weakening year by year and the fragmentation is worsening; SHDI and SHEI demonstrate an overall upward trend, indicating that the land uses landscape richness and complexity in Ordos is increasing, as is the heterogeneity of the landscape pattern and the distribution of landscape types.
Under the three future development scenarios, the NP, PD and LSI of the Q1 scenario are significantly higher than those of the Q2 and Q3 scenarios, and the AI is lower than in 2020 and in both the Q2 and Q3 scenarios, indicating that the landscape in the Q1 scenario develops towards disorder, with decreasing aggregation and more serious fragmentation. The Q2 and Q3 scenario landscape pattern indices are roughly comparable, with the SHDI and SHEI increasing compared to 2020, reflecting a more even distribution of overall landscape types in the context of future policy-oriented and rational planning, but the AI has both decreased compared to 2020, indicating a decrease in patchy aggregation at the urban scale, and future development should take full account of the balanced distribution of multiple land types.
3.4. Coupling coordination of industrial mining land, landscape pattern and carbon storage
The coupling coordination degree was calculated for the 2000 to 2020 and for three future scenarios, and the results are shown in .
Table 11. Coupling coordination degree of industrial mining land, landscape pattern and carbon storage.
In 2000, coupling coordination degree of industrial mining land, landscape pattern and carbon storage in Ordos was 0.950, which was in the stage of high quality coordination. At that time, the mining industry in Ordos did not develop vigorously and was little influenced by human factors. From 2000 to 2010, Ordos mined coal vigorously and built a large number of coal mines and open-pit coal mines and their supporting facilities, the landscape pattern index decreased and the coupling coordination degree also decreased slightly to 0.927 because the carbon sequestration system and landscape pattern were disturbed by man-made factors. From 2010 to 2020, Ordos gradually implemented the policies of building green mines and improving the ecological restoration policies, such as returning farmland to forest and grass after the large-scale coal mining, and the landscape pattern index increased. However, as a large industrial city, Ordos has a large number of industrial enterprises above the scale of the city’s landscape pattern index. In addition to mines, coupled with a long history of mining development, the area of industrial mines is expanding and tends to be fragmented, which decreases carbon storage and the coupling coordination degree to 0.859 in 2020, which is a good coordination stage. Overall, the coupling coordination degree of industrial mining land, landscape pattern and carbon storage in Ordos is diminishing, and the high quality coordination in 2000 deteriorates to satisfactory coordination in 2020.
The coupling coordination degree was calculated for each of the three development scenarios, and the results indicate that the coupling coordination degree for Q1 was 0.667, which was primary coordination, and that the coupling coordination degrees for Q2 and Q3 were 0.813 and 0.815, respectively, which were both good coordination. With a greater decline in the landscape pattern index and a reduction in the coupling coordination degree to primary coordination under Q1 scenario, the coupling coordination degree continues the development of 2000–2020. In contrast, after ecological protection or anthropogenic interventions under economic development in the research area, the coupling coordination degree of industrial mining land, landscape pattern and carbon storage in Ordos declines less relative to the overall 2000–2020 timeframe. This is primarily because, in the Q2 and Q3 scenarios, there is an increase in carbon storage, a slow growth in industrial mining land, and stabilization of the landscape pattern, which suggests that policy factors like ecological protection or economic development will have a positive impact on regional development. Cities should coordinate economic priority scenarios with ecological conservation in the future to achieve balanced growth.
4. Discussion
4.1. Analysis of the relationship between carbon storage and eco-efficiency
The analysis of ESV in Ordos from 2000 to 2020 found that the ESV in 2000 was 17,439,200 Yuan, the ESV in 2010 was 16,925,000 Yuan, and the 2020 ESV is 17,268,000 Yuan, showing a trend of first decreasing and then increasing, which is contrary to the trend of carbon storage. This is because, according to the results of the previous study, the analysis obtained that the carbon storage in Ordos from 2000 to 2020 first rose and then fell. fast changes in land usage have taken place in the context of fast industrialization and urbanization in China between 2000 and 2020, which have had progressively negative ecological and environmental effects. Particularly, previous land use and development operations have overly prioritized commercial goals while ignoring ecological effects, which has caused a sharp drop in the value of regional ecosystem services.
Between 2002 and 2012, China’s coal industry experienced a ‘golden decade’ (Song et al. Citation2017). Throughout this decade, Ordos has been rapidly expanding its industrial companies and coal mining operations, which have resulted in a constant drop in ESV due to the encroachment of forest, grassland and arid terrain. This suggests that the trend of coal production is moving in the opposite direction of Ordos’ change in ESV. In the meantime, in 2000, the city proposed the development idea of ‘green city and strong city in animal husbandry’ and implemented the strategy of ‘shrinkage and transfer, concentrated development’ to shrink and adjust the traditional industrial development route and the production of agriculture and animal husbandry. As a result, when compared to 2000, carbon storage increased in 2010. With the building of agricultural conversion to forests and green mines between 2010 and 2020, the area of high ecological value forests will grow, increasing the amount of carbon stored. Although ESV increased, the barren land and bare rocky gravel land are widely distributed in Ordos, and the encroachment of industrial mining land on barren land and grassland caused the conversion of carbon sink land class into carbon source land class, the scale of ecological reconstruction and restoration in China’s coal industrial and mining land is much less than the ecological damage caused by coal mining, and the compensation capacity of ecological carbon sink is much lower than the level of carbon source emission (Donggan et al. Citation2011), which made the carbon storage in Ordos decrease again.
Changes in carbon storage are primarily caused by changes in carbon source/sink properties and carbon density of the corresponding land classes, and the InVEST model used in this research estimates changes in land classes at larger scales by applying the determined acquired carbon density values. Additionally, the carbon storage module disregards the changes in carbon storage values caused by vegetation growth and other alterations to the internal structure of land use, making the changes in carbon storage ambiguous. In addition, this research analyzed only the carbon sequestration effect of land use change, but did not investigate the impact of mining on the carbon cycle. The next stage may involve a more in-depth examination of the relationship between carbon emissions and mining activities, such as the carbon sequestration mechanism. While the study of carbon storage in Ordos is based on an urban scale, the next step is to narrow the scope of the study to the inner region of industrial and mining land, investigate the effects of coal mining, vegetation enhancement and land reclamation on carbon storage and landscape pattern, study the internal relationships of the mining ecosystem, and to investigate the influence of land type change on carbon sequestration capacity on industrial and mining land.
The calculation of ESV is a combination of several secondary indicators, which can comprehensively analyse the ecological value of different land types. However, the complexity of the ecosystem itself, which is influenced by environmental and biological conditions, has significant differences in the size and type of its service functions, rendering the ESV evaluation inaccurate, and objectively requiring the finest distinction possible between ecosystem types and service function. Globally, the correlation between carbon storage and ESV is not a simple linear relationship, but rather a differentiated interrelationship resulting from a combination of policy guidance, development strategies and regional environmental characteristics. A comparative analysis of the two indicators can more accurately reflect the ecological issues brought on by changes in land types in the study region.
4.2. Multi-scenario land use prediction
In order to compensate for the limitations of a single model, the forecasting section of this research combines the MOP and PLUS models, allowing full utilization of the PLUS model’s quantitative and spatial simulation of future land changes and the MOP model’s multi-scenario forecasting. Due to the volatility of actual development and policy implementation, coupled MOP-PLUS model constraints are insufficiently comprehensive and may deviate from the actual development situation. Nevertheless, regardless of whether the conditions are based on policies or subjective factors, it is an attempt to provide alternative development patterns for Ordos, which can help decision-makers manage future land use patterns in accordance with different development goals and is essential for studying the region’s future development.
In this study, the MOP-PLUS model is used to simulate three different future land use scenarios based on policy and planning guidelines; however, these three alternatives cannot represent all possible land use scenarios, and the future development of Ordos should find a balance point under the natural development scenario, ecological protection scenario and economic development scenario in order to coordinate the contradiction between economic development and ecological protection to achieve sustainable development.
4.3. Landscape pattern and coupling coordination analysis
There is a close relationship between ecosystem services and landscape pattern evolution (Wang et al. Citation2022), and human activities alter the landscape pattern of land use through various land use strategies, thereby altering ecological processes and ultimately affecting the provision of ecosystem services. A series of disturbances such as ‘vegetation removal, topsoil stripping, mining, transportation and disposal’ induced by coal mining on urban ecosystems have resulted in a decrease in urban carbon sink area, landscape fragmentation and carbon sequestration capacity. Continuous expansion of industrial and mining land has resulted in encroachment on high-carbon land types, devastation of landscape patterns and deterioration of carbon storage services.
By analyzing the coupling coordination degree of industrial mining land, landscape pattern and carbon storage for the past 20 years and the projected scenarios, this research reveals the reciprocal feedback of carbon storage with urban landscape pattern and industrial mining land in Ordos, and the trend of continuous decrease in the coordination of the three should be positively regulated. According to the analysis of the prediction results, under the ecological priority and economic development scenarios, coupling coordination increases, indicating the applicability of the coupling coordination model for guiding future policies. The two scenarios of ecological protection and economic priority should be coordinated in the future by balancing the mining activities, landscape pattern and carbon storage, paying more attention to the impact of land use changes on carbon storage in vegetation, increasing the proportion of land types with high carbon sequestration capacity, continuing the strategy of ‘returning farmland to forest and grass’, and concentrating on the mining activities. Focus should be placed on preserving forest resources and implementing ecological compensation mechanisms to reduce or eliminate negative externalities associated with regional economic growth (Chen et al. Citation2020).
In this research, a more macroscopic coupling coordination analysis is conducted at the scale of the city of Ordos, utilizing industrial mining land and landscape pattern index to infer the intensity of urban mining activities and as a reference for policy formulation at the macro level of the city. Ordos should modify its development policy accordingly, focusing on enhancing the construction of green mines, increasing the proportion of renewable energy, and decreasing coal mining. Substituting fossil fuel energy with renewable energy will not only help to assure energy supply for economic growth, but it will also reduce carbon emissions and alleviate environmental stress.
In terms of landscape pattern optimization, we can begin with the landscape succession process, coordinate the relationship between ecological environment and economic development, ecological services and social services and ecological construction and engineering construction, such as increasing the proportion of grassland, decreasing the distance between forest and grassland patches, increasing connectivity to optimize the landscape pattern and boosting carbon sequestration.
Currently, ‘carbon peak’ and ‘carbon neutral’ have been incorporated into the overall blueprint for China’s ecological civilization construction, and the requirement of accelerating the establishment of a solid green low-carbon cycle development economic system has been posed (Dong et al. Citation2021). The evolution of mining cities is historically and intricately entangled, and the proliferation of their cities and industrial mines is a significant factor in the transformation of landscape patterns and ecological processes. In the future, the coupling coordination analysis of industrial mining land, landscape pattern and carbon storage in mining cities will be able to further refine the area of mining activities in cities, combine urban scale with industrial mining scale to conduct research, and integrate the two research perspectives of time and space, thereby enabling management and decision-making institutions to present more targeted opinions. For example, for larger scales, policy-making institutions should vigorously promote the combination of ecological protection and restoration, promote the efficient use of resources and low-carbon development, improve the comprehensive spatial carrying capacity of the country, make use of spatially coupling and coordination differences, and optimize the spatial layout of industries taking into account specific socio-ecological conditions (Zhou et al. Citation2017); for smaller scales, local governments should concentrate on sorting out local ecological environmental resource characteristics, making localized and integrated arrangements, determining the direction and objectives of industrial and mining development and regional development, and minimizing the environmental disturbance caused by industrial development.
5. Conclusions
This research provides a more comprehensive research methodology for analyzing the development of mining cities, discusses the interrelationships between carbon storage and LULC and landscape patterns, and offers a more comprehensive strategy for the future development of policy in mining cities. This research examines the case of Ordos, analyzing the carbon storage of the region from 2000 to 2020. Additionally, it predicts the spatial-temporal changes in carbon storage for the year 2030 under three different scenarios of LULC. The InVEST model and MOP-PLUS model are utilized for this analysis. Furthermore, a coupling coordination degree model is constructed to assess the coordination degree of development between industrial mining land, landscape pattern and carbon storage. This analysis is conducted for both past and future scenarios. The findings of this study are as follows:
From 2000 to 2020, the predominant land type in Ordos is grassland, industrial mining land continues to grow with an increase of 916.95km2, cropland and grassland show a trend of increasing and then decreasing, decreasing by 80.88km2 and 1,087.44km2 respectively, the area of water in 2020 decreases by 54.13km2, barren land decreased by 302.98km2, and forest and urban rural land area grew by 477.3km2 and 128.79km2, meanwhile the carbon storage of Ordos decreased by 2.64 × 10⁶t in 20 years. The aforementioned findings suggest that over the past two decades, the mining city has experienced significant growth in mining activities, resulting in the expansion of industrial mining land at the expense of forest and grassland. This change of LULC has had a direct impact on the reduction of high carbon storage land, consequently leading to a decline in carbon storage capacity. Nevertheless, it should be noted that Ordos has undertaken ecological conservation initiatives, such as the reforestation of farmland, over the past twenty years. These efforts have resulted in an augmentation of forest areas and a comparatively decelerated reduction in urban carbon storage. The adoption of this ecological protection strategy has proven highly advantageous for the city’s sustainable development and warrants enthusiastic promotion.
Projections of future developments: in the natural development scenario, the area of cropland and grassland continues to decrease, while the area of forest, water, industrial mining land and barren land increases, and the carbon storage decreases by 4.87 × 10⁶t relative to the carbon storage in 2020; Under the ecological protection scenario, compared to 2020, the area of forest, grassland, water and urban rural land continues to increase, the area of cropland and barren land decreases, and the area of industrial mining land remains unchanged, and carbon storage increases by 8.45 × 10⁶t; In the economic development scenario, the area of forest, urban rural land and industrial mining land significantly increases, the area of water and grassland remains unchanged, and the area of barren land and cropland decreases, while the carbon storage increases by 8.55 × 10⁶t compared to 2020. Based on the analysis of the three scenarios, it can be found that under the carbon peaking and carbon neutrality strategy, the ecological priority strategy should be adhered to, the implementation of ecological restoration initiatives should be promoted, and the development of different land types should be rationally regulated. On this basis, the implementation of ‘green mining’, and then take into account the balanced development of ecology and economy, and ultimately realize the sustainable development of mining cities under ecological environment protection.
The analysis of Ordos between 2000 and 2020 reveals an increase in landscape fragmentation, landscape richness and landscape complexity at the landscape scale; at the patch scale, cropland develops in a good direction, while other land types develop in a fragmented and disordered manner; the coupling coordination degree of industrial mining land, landscape pattern and carbon storage decreases from high quality coordination in 2000 to good coordination in 2020. In addition, the degree of coupling coordination increases under the scenario of future ecological protection and economic development compared to the scenario of natural development. In the future, a balance should be sought between ecological protection and economic development in order to achieve green, low-carbon and sustainable development of mining cities.The findings demonstrate the effectiveness of the coupling coordination model in informing future policy decisions. It is recommended that, going forward, the two scenarios of ecological protection and economic priority should be harmonized to achieve a balanced landscape pattern, carbon storage and mining activities. Additionally, greater emphasis should be placed on understanding the impact of LULC changes on carbon storage in vegetation. Efforts should be made to increase the proportion of land types with high carbon sequestration capacity, and the strategy of converting cropland to forest and grassland should be continued to promote the environmentally-friendly, low-carbon and sustainable development of mining cities.
This study focuses on analyzing Ordos as a single-site instance and aims to establish a coupling coordination model that integrates industrial and mining land, landscape pattern and carbon storage. This novel approach has promise in providing guidance for the future development of mining cities. Nevertheless, in the context of other mining cities, it is imperative to develop the MOP model and design prediction scenarios for the PLUS model, taking into account the specific local conditions. local conditions. Additionally, it is crucial to incorporate and rectify the carbon density data from the InVEST model to enhance the accuracy of the research findings.
Author contributions
Conceptualization, Yindi Zhao; methodology, Junjie Dong and Ziqi Guo; software, Junjie Dong and Ziqi Guo; validation, Junjie Dong; formal analysis, Junjie Dong; investigation, Ziqi Guo and Junjie Dong; resources, Yindi Zhao; data curation, Mengfan Hu and Jiaxing Li; writing-original draft preparation, Junjie Dong; writing-review and editing, Junjie Dong, Yindi Zhao, Ziqi Guo, Mengfan Hu and Jiaxing Li; visualization, Ziqi Guo; supervision, Yindi Zhao; project administration, Yindi Zhao; funding acquisition, Yindi Zhao. All authors have read and agreed to the published version of the manuscript.
Data availability statement
The data is available from the authors upon reasonable request.
Disclosure statement
No potential conflict of interest was reported by the authors.
Additional information
Funding
References
- Aneseyee AB, Soromessa T, Elias E, Noszczyk T, Hernik J, Benti NE. 2022. Expressing carbon storage in economic terms: the case of the upper Omo Gibe Basin in Ethiopia. Sci Total Environ. 808:152166. doi:10.1016/j.scitotenv.2021.152166.
- Cetin M, Onac AK, Sevik H, Canturk U, Akpinar H. 2018. Chronicles and geoheritage of the ancient Roman city of Pompeiopolis: a landscape plan. Arab J Geosci. 11(24):798. doi:10.1007/s12517-018-4170-6.
- Cetin M. 2016. Sustainability of urban coastal area management: a case study on Cide. J Sustainable For. 35(7):527–541. doi:10.1080/10549811.2016.1228072.
- Cetin M. 2019. The effect of urban planning on urban formations determining bioclimatic comfort area’s effect using satellitia imagines on air quality: a case study of Bursa city. Air Qual Atmos Health. 12(10):1237–1249. doi:10.1007/s11869-019-00742-4.
- Chen J, Li Z, Dong Y, Song M, Shahbaz M, Xie Q. 2020. Coupling coordination between carbon emissions and the eco-environment in China. J Clean Prod. 276:123848. doi:10.1016/j.jclepro.2020.123848.
- Chen W, Zeng J, Chu Y, Liang J. 2021. Impacts of landscape patterns on ecosystem services value: a multiscale buffer gradient analysis approach. Remote Sens. 13(13):2551. doi:10.3390/rs13132551.
- Chen X, Zhou F, Hu D, Yi G, Cao W. 2022. An improved evaluation method to assess the coordination between mineral resource exploitation, economic development, and environmental protection. Ecol Indic. 138:108808. doi:10.1016/j.ecolind.2022.108808.
- Costanza R, d’Arge R, De Groot R, Farber S, Grasso M, Hannon B, Limburg K, Naeem S, O’Neill RV, Paruelo J, et al. 1998. The value of ecosystem services: putting the issues in perspective. Ecol Econ. 25(1):67–72. doi:10.1016/S0921-8009(98)00019-6.
- Cusack M, Saderne V, Arias-Ortiz A, Masqué P, Krishnakumar PK, Rabaoui L, Qurban MA, Qasem AM, Prihartato P, Loughland RA, et al. 2018. Organic carbon sequestration and storage in vegetated coastal habitats along the western coast of the Arabian Gulf. Environ Res Lett. 13(7):074007. doi:10.1088/1748-9326/aac899.
- DeFries RS, Field CB, Fung I, Collatz GJ, Bounoua L. 1999. Combining satellite data and biogeochemical models to estimate global effects of human-induced land cover change on carbon emissions and primary productivity. Glob Biogeochem Cycles. 13(3):803–815. doi:10.1029/1999GB900037.
- Dong L, Miao G, Wen W. 2021. China’s carbon neutrality policy: objectives, impacts and paths. East Asian Policy. 13(01):5–18. doi:10.1142/S1793930521000015.
- Donggan G, Zhongke B, Tieliang S, Hongbo S, Wen Q. 2011. Impacts of coal mining on the aboveground vegetation and soil quality: a case study of Qinxin coal mine in Shanxi Province, China. CLEAN Soil Air Water. 39(3):219–225. doi:10.1002/clen.201000236.
- Fang C, Liu H, Li G. 2016. International progress and evaluation on interactive coupling effects between urbanization and the eco-environment. J Geogr Sci. 26(8):1081–1116. doi:10.1007/s11442-016-1317-9.
- González-García A, Arias M, García-Tiscar S, Alcorlo P, Santos-Martín F. 2022. National blue carbon assessment in Spain using InVEST: current state and future perspectives. Ecosyst Serv. 53:101397. doi:10.1016/j.ecoser.2021.101397.
- Guan D, Zhao Z, Tan J. 2019. Dynamic simulation of land use change based on logistic-CA-Markov and WLC-CA-Markov models: a case study in three gorges reservoir area of Chongqing, China. Environ Sci Pollut Res Int. 26(20):20669–20688. doi:10.1007/s11356-019-05127-9.
- Guo W, Teng Y, Yan Y, Zhao C, Zhang W, Ji X. 2022. Simulation of land use and carbon storage evolution in multi-scenario: a case study in Beijing-Tianjin-Hebei Urban Agglomeration, China. Sustainability. 14(20):13436. doi:10.3390/su142013436.
- He C, Zhang D, Huang Q, Zhao Y. 2016. Assessing the potential impacts of urban expansion on regional carbon storage by linking the LUSD-urban and InVEST models. Environ Modell Softw. 75:44–58. doi:10.1016/j.envsoft.2015.09.015.
- Hou J, Yu H, Mou S, Bian Z. 2020. Spatial–temporal characteristics of land degradation and its influencing factors in coal mine areas in western China. Coal Sci Tech. 48:206–216. doi:10.13199/j.cnki.cst.2020.11.026.(In.Chinese)
- Houghton RA. 2003. Revised estimates of the annual net flux of carbon to the atmosphere from changes in land use and land management 1850–2000. Tellus B Chem Phys Meteorol. 55(2):378. doi:10.3402/tellusb.v55i2.16764.
- Hu Z, Yang X, Yang J, Yuan J, Zhang Z. 2021. Linking landscape pattern, ecosystem service value, and human well-being in Xishuangbanna, southwest China: insights from a coupling coordination model. Glob Ecol Conserv. 27:e01583. doi:10.1016/j.gecco.2021.e01583.
- Islam I, Cui S, Hoque MZ, Abdullah HM, Tonny KF, Ahmed M, Ferdush J, Xu L, Ding S. 2022. Dynamics of tree outside forest land cover development and ecosystem carbon storage change in eastern coastal zone, Bangladesh. Land. 11(1):76. doi:10.3390/land11010076.
- Jiang W, Deng Y, Tang Z, Lei X, Chen Z. 2017. Modelling the potential impacts of urban ecosystem changes on carbon storage under different scenarios by linking the CLUE-S and the InVEST models. Ecol Model. 345:30–40. doi:10.1016/j.ecolmodel.2016.12.002.
- Jiao W, Zhang X, Li C, Guo J. 2021. Sustainable transition of mining cities in China: literature review and policy analysis. Resour Policy. 74:101867. doi:10.1016/j.resourpol.2020.101867.
- Kelong C, Yanli H, Shengkui C, Jin M, Guangchao C, Hui L. 2011. The study of vegetation carbon storage in Qinghai Lake Valley based on remote sensing and CASA model. Proc Environ Sci. 10:1568–1574. doi:10.1016/j.proenv.2011.09.249.
- Krogh L, Noergaard A, Hermansen M, Greve MH, Balstroem T, Breuning-Madsen H. 2003. Preliminary estimates of contemporary soil organic carbon stocks in Denmark using multiple datasets and four scaling-up methods. Agric Ecosyst Environ. 96(1–3):19–28. doi:10.1016/S0167-8809(03)00016-1.
- Kumar M, Kumar A, Thakur TK, Sahoo UK, Kumar R, Konsam B, Pandey R. 2022. Soil organic carbon estimation along an altitudinal gradient of chir pine forests in the Garhwal Himalaya, India: a field inventory to remote sensing approach. Land Degrad Dev. 33(17):3387–3400. doi:10.1002/ldr.4393.
- Li H, Pei JB, Wang JK, Li SY, Gao GW. 2013. Organic carbon density and storage of the major black soil regions in Northeast China. J Soil Sci Plant Nutr. 13(4):883–893. doi:10.4067/S0718-95162013005000070.
- Li K, Cao J, Adamowski JF, Biswas A, Zhou J, Liu Y, Zhang Y, Liu C, Dong X, Qin Y. 2021. Assessing the effects of ecological engineering on spatiotemporal dynamics of carbon storage from 2000 to 2016 in the Loess Plateau area using the InVEST model: a case study in Huining County, China. Environ Dev. 39:100641. doi:10.1016/j.envdev.2021.100641.
- Li Y, Li Y, Zhou Y, Shi Y, Zhu X. 2012. Investigation of a coupling model of coordination between urbanization and the environment. J Environ Manage. 98:127–133. doi:10.1016/j.jenvman.2011.12.025.
- Li Y, Yao S, Jiang H, Wang H, Ran Q, Gao X, Ding X, Ge D. 2022. Spatial-temporal evolution and prediction of carbon storage: an integrated framework based on the MOP–PLUS–InVEST model and an applied case study in Hangzhou, East China. Land. 11(12):2213. doi:10.3390/land11122213.
- Liang X, Guan Q, Clarke KC, Liu S, Wang B, Yao Y. 2021. Understanding the drivers of sustainable land expansion using a patch-generating land use simulation (PLUS) model: a case study in Wuhan, China. Comput Environ Urban Syst. 85:101569. doi:10.1016/j.compenvurbsys.2020.101569.
- Liu K, Ni Z, Ren M, Zhang X. 2022. Spatial differences and influential factors of urban carbon emissions in China under the target of carbon neutrality. Int J Environ Res Public Health. 19(11):6427. doi:10.3390/ijerph19116427.
- Liu Q, Yang D, Cao L, Anderson B. 2022. Assessment and prediction of carbon storage based on land use/land cover dynamics in the tropics: a case study of Hainan Island, China. Land. 11(2):244. doi:10.3390/land11020244.
- Liu X, Liang X, Li X, Xu X, Ou J, Chen Y, Li S, Wang S, Pei F. 2017. A future land use simulation model (FLUS) for simulating multiple land use scenarios by coupling human and natural effects. Landsc Urban Plan. 168:94–116. doi:10.1016/j.landurbplan.2017.09.019.
- Liu Y, Wei J, Bi Y, Peng S, Yue H, He X. 2021. Spatiotemporal dynamic change analysis of carbon storage in desertification open-pit mine. J China Coal Soc. 47(S1):214–224. doi:10.13225/j.cnki.jccs.XR21.1562.(In.Chinese)
- Liu Y, Wei J, Bi Y, Yue H, He X. 2021. Evaluation of ecosystem service function in Shendong mining area. J China Coal Soc. 46(05):1599–1613. doi:10.13225/j.cnki.jccs.ST21.0188. (In.Chinese)
- Long R, Ren Y, Wu M. 2022. Differential decomposition of total-factor energy efficiency in Chinese coal mining cities considering environmental constraints: a dynamic and static perspective. Resour Policy. 79:102993. doi:10.1016/j.resourpol.2022.102993.
- Ma J, Shugart HH, Yan X, Cao C, Wu S, Fang J. 2017. Evaluating carbon fluxes of global forest ecosystems by using an individual tree-based model FORCCHN. Sci Total Environ. 586:939–951. doi:10.1016/j.scitotenv.2017.02.073.
- Martinez-Fernandez C, Wu C-T, Schatz LK, Taira N, Vargas-Hernández JG. 2012. The shrinking mining city: urban dynamics and contested territory. Int J Urban Reg Res. 36(2):245–260. doi:10.1111/j.1468-2427.2011.01094.x.
- Mishra A, Swamy SL, Thakur TK, Kumar A, Pandey M. 2022. Impact of coal mining on land use changes, deforestation, biomass, and C losses in Central India: implications for offsetting CO 2 emissions. Land Degrad Dev. 33(18):3731–3747. doi:10.1002/ldr.4419.
- Pan Y, Birdsey RA, Fang J, Houghton R, Kauppi PE, Kurz WA, Phillips OL, Shvidenko A, Lewis SL, Canadell JG, et al. 2011. A large and persistent carbon sink in the world’s forests. Science. 333(6045):988–993. doi:10.1126/science.1201609.
- Piao S, Fang J, Ciais P, Peylin P, Huang Y, Sitch S, Wang T. 2009. The carbon balance of terrestrial ecosystems in China. Nature. 458(7241):1009–1013. doi:10.1038/nature07944.
- Qi S, Chen S, Long X, An X, Zhang M. 2023. Quantitative contribution of climate change and anthropological activities to vegetation carbon storage in the Dongting Lake basin in the last two decades. Adv Space Res. 71(1):845–868. doi:10.1016/j.asr.2022.07.068.
- Sang L, Zhang C, Yang J, Zhu D, Yun W. 2011. Simulation of land use spatial pattern of towns and villages based on CA–Markov model. Math Comput Model. 54(3–4):938–943. doi:10.1016/j.mcm.2010.11.019.
- Shi Q, Gu C-J, Xiao C. 2023. Multiple scenarios analysis on land use simulation by coupling socioeconomic and ecological sustainability in Shanghai, China. Sustainable Cities Soc. 95:104578. doi:10.1016/j.scs.2023.104578.
- Song Z, Niu D, Xiao X. 2017. Focus on the current competitiveness of coal industry in China: has the depression time gone? Resour Policy. 51:172–182. doi:10.1016/j.resourpol.2016.11.011.
- Strohbach MW, Haase D. 2012. Above-ground carbon storage by urban trees in Leipzig, Germany: analysis of patterns in a European city. Landsc Urban Plan. 104(1):95–104. doi:10.1016/j.landurbplan.2011.10.001.
- Su S, Xiao R, Jiang Z, Zhang Y. 2012. Characterizing landscape pattern and ecosystem service value changes for urbanization impacts at an eco-regional scale. Appl Geogr. 34:295–305. doi:10.1016/j.apgeog.2011.12.001.
- Tao Y, Li F, Wang R, Zhao D. 2015. Effects of land use and cover change on terrestrial carbon stocks in urbanized areas: a study from Changzhou, China. J Clean Prod. 103:651–657. doi:10.1016/j.jclepro.2014.07.055.
- Thakur TK, Dutta J, Upadhyay P, Patel DK, Thakur A, Kumar M, Kumar A. 2022. Assessment of land degradation and restoration in coal mines of central India: a time series analysis. Ecol Eng. 175:106493. doi:10.1016/j.ecoleng.2021.106493.
- Tian L, Tao Y, Fu W, Li T, Ren F, Li M. 2022. Dynamic simulation of land use/cover change and assessment of forest ecosystem carbon storage under climate change scenarios in Guangdong Province, China. Remote Sens. 14(10):2330. doi:10.3390/rs14102330.
- Vizcaíno-Bravo Q, Williams-Linera G, Asbjornsen H. 2020. Biodiversity and carbon storage are correlated along a land use intensity gradient in a tropical montane forest watershed, Mexico. Basic Appl Ecol. 44:24–34. doi:10.1016/j.baae.2019.12.004.
- Wang C, Guo X, Guo L, Bai L, Xia L, Wang C, Li T. 2022. Land use change and its impact on carbon storage in northwest China based on FLUS-Invest: a case study of Hu-Bao-Er-Yu urban agglomeration. Ecol Environ Sci. 31(08):1667–1679. doi:10.16258/j.cnki.1674-5906.2022.08.019.(In.Chinese)
- Wang H, Zhang M, Wang C, Wang K, Wang C, Li Y, Bai X, Zhou Y. 2022. Spatial and temporal changes of landscape patterns and their effects on ecosystem services in the Huaihe River Basin, China. Land. 11(4):513. doi:10.3390/land11040513.
- Wang K, Li X, Lyu X, Dang D, Dou H, Li M, Liu S, Cao W. 2022. Optimizing the land use and land cover pattern to increase its contribution to carbon neutrality. Remote Sens. 14(19):4751. doi:10.3390/rs14194751.
- Wang Q, Wang H. 2022. Spatiotemporal dynamics and evolution relationships between land-use/land cover change and landscape pattern in response to rapid urban sprawl process: a case study in Wuhan, China. Ecol Eng. 182:106716. doi:10.1016/j.ecoleng.2022.106716.
- Wang R, Cheng J, Zhu Y, Lu P. 2017. Evaluation on the coupling coordination of resources and environment carrying capacity in Chinese mining economic zones. Resour Policy. 53:20–25. doi:10.1016/j.resourpol.2017.05.012.
- Wang Y, Chao B, Dong P, Zhang D, Yu W, Hu W, Ma Z, Chen G, Liu Z, Chen B. 2021. Simulating spatial change of mangrove habitat under the impact of coastal land use: coupling MaxEnt and Dyna-CLUE models. Sci Total Environ. 788:147914. doi:10.1016/j.scitotenv.2021.147914.
- Wang Y, Liu J, Zhao Z, Ren J, Chen X. 2023. Research on carbon emission reduction effect of China’s regional digital trade under the “double carbon” target– combination of the regulatory role of industrial agglomeration and carbon emissions trading mechanism. J Clean Prod. 405:137049. doi:10.1016/j.jclepro.2023.137049.
- Wang Y, Sarkar A, Li M, Chen Z, Hasan AK, Meng Q, Hossain MS, Rahman MA. 2022. Evaluating the impact of forest tenure reform on farmers’ investment in public welfare forest areas: a case study of Gansu Province, China. Land. 11(5):708. doi:10.3390/land11050708.
- Wei Q, Abudureheman M, Halike A, Yao K, Yao L, Tang H, Tuheti B. 2022. Temporal and spatial variation analysis of habitat quality on the PLUS-InVEST model for Ebinur Lake Basin, China. Ecol Indic. 145:109632. doi:10.1016/j.ecolind.2022.109632.
- Wei Y-M, Chen K, Kang J-N, Chen W, Wang X-Y, Zhang X. 2022. Policy and management of carbon peaking and carbon neutrality: a literature review. Engineering. 14:52–63. doi:10.1016/j.eng.2021.12.018.
- Xie G, Lu C, Leng Y, Zheng D, Li S. 2003. Ecological assets valuation of the Tibetan Plateau. J Nat Resour. 18(2):189–196. doi:10.11849/zrzyxb.2003.02.010.(In.Chinese)
- Xie G, Zhang C, Zhang L, Chen W, Li S. 2015. Improvement of the evaluation method for ecosystem service value based on per unit area. J Nat Resour. 30(8):1243–1254. doi:10.11849/zrzyxb.2015.08.001.(In.Chinese)
- Xu L, He N, Yu G. 2019. A dataset of carbon density in Chinese terrestrial ecosystems (2010s). China Sci Data. 4(1):90–96. doi:10.11922/sciencedb.603.
- Xu Q, Yang R, Dong Y-X, Liu Y-X, Qiu L-R. 2016. The influence of rapid urbanization and land use changes on terrestrial carbon sources/sinks in Guangzhou, China. Ecol Indic. 70:304–316. doi:10.1016/j.ecolind.2016.05.052.
- Xu X, Liu J, Zhang S, Li R, Yan C, Wu S. 2018. Data From: multi-period land use remote sensing monitoring dataset in China (CNLUCC). Resource and Environment Science Data Registration and Publication System. http://www.resdc.cn/DOI. doi:10.12078/2018070201.
- Yang J, Dong J, Xiao X, Dai J, Wu C, Xia J, Zhao G, Zhao M, Li Z, Zhang Y, et al. 2019. Divergent shifts in peak photosynthesis timing of temperate and alpine grasslands in China. Remote Sens Environ. 233:111395. doi:10.1016/j.rse.2019.111395.
- Yang P, Peng S, Benani N, Dong L, Li X, Liu R, Mao G. 2022. An integrated evaluation on China’s provincial carbon peak and carbon neutrality. J Clean Prod. 377:134497. doi:10.1016/j.jclepro.2022.134497.
- Yang Y, Bao W, Liu Y. 2020. Coupling coordination analysis of rural production-living-ecological space in the Beijing-Tianjin-Hebei region. Ecol Indic. 117:106512. doi:10.1016/j.ecolind.2020.106512.
- Yao Y, Liu X, Li X, Liu P, Hong Y, Zhang Y, Mai K. 2017. Simulating urban land-use changes at a large scale by integrating dynamic land parcel subdivision and vector-based cellular automata. Int J Geogr Inf Sci. 31(12):2452–2479. doi:10.1080/13658816.2017.1360494.
- Yu G, Li X, Wang Q, Li S. 2010. Carbon storage and its spatial pattern of terrestrial ecosystem in China. J Resour Ecol. 1(2):97–109. doi:10.3969/j.issn.1674-764x.2010.02.001.
- Zaehle S, Bondeau A, Carter TR, Cramer W, Erhard M, Prentice IC, Reginster I, Rounsevell MDA, Sitch S, Smith B, et al. 2007. Projected changes in terrestrial carbon storage in Europe under climate and land-use change, 1990–2100. Ecosystems. 10(3):380–401. doi:10.1007/s10021-007-9028-9.
- Zang Z, Zou X, Zuo P, Song Q, Wang C, Wang J. 2017. Impact of landscape patterns on ecological vulnerability and ecosystem service values: An empirical analysis of Yancheng Nature Reserve in China. Ecol Indic. 72:142–152. doi:10.1016/j.ecolind.2016.08.019.
- Zhang D, Wang J, Wang Y, Xu L, Zheng L, Zhang B, Bi Y, Yang H. 2022. Is there a spatial relationship between urban landscape pattern and habitat quality? Implication for landscape planning of the yellow river basin. Int J Environ Res Public Health. 19(19):11974. doi:10.3390/ijerph191911974.
- Zhang S, Zhong Q, Cheng D, Xu C, Chang Y, Lin Y, Li B. 2022. Coupling coordination analysis and prediction of landscape ecological risks and ecosystem services in the Min River Basin. Land. 11(2):222. doi:10.3390/land11020222.
- Zhang Z, Jiang W, Peng K, Wu Z, Ling Z, Li Z. 2023. Assessment of the impact of wetland changes on carbon storage in coastal urban agglomerations from 1990 to 2035 in support of SDG15.1. Sci Total Environ. 877:162824. doi:10.1016/j.scitotenv.2023.162824.
- Zhao N, Liu Y, Cao G, Samson EL, Zhang J. 2017. Forecasting China’s GDP at the pixel level using nighttime lights time series and population images. GISci Remote Sens. 54(3):407–425. doi:10.1080/15481603.2016.1276705.
- Zhou NQ, Zhao S. 2013. Urbanization process and induced environmental geological hazards in China. Nat Hazards. 67(2):797–810. doi:10.1007/s11069-013-0606-1.
- Zhou X-Y, Lei K, Meng W, Khu S-T. 2017. Industrial structural upgrading and spatial optimization based on water environment carrying capacity. J Clean Prod. 165:1462–1472. doi:10.1016/j.jclepro.2017.07.246.
- Zhou Y, Yue D, Guo J, Chen G, Wang D. 2021. Spatial correlations between landscape patterns and net primary productivity: A case study of the Shule River Basin, China. Ecol Indic. 130:108067. doi:10.1016/j.ecolind.2021.108067.
- Zhu X, Li J, Cheng H, Zheng L, Huang W, Yan Y, Liu H, Yang X. 2022. Assessing the impacts of ecological governance on carbon storage in an urban coal mining subsidence area. Ecol Inform. 72:101901. doi:10.1016/j.ecoinf.2022.101901.