
 ?Mathematical formulae have been encoded as MathML and are displayed in this HTML version using MathJax in order to improve their display. Uncheck the box to turn MathJax off. This feature requires Javascript. Click on a formula to zoom.
Abstract
The digital twin of an earthquake disaster city constructed using digital twin technology can reflect the data of different stages of the earthquake disaster in the virtual space and can ensure high synchronisation and simulation of the two to effectively improve the safety of emergency rescue personnel and the scientific decision-making ability of decision makers. Oblique photogrammetry matched the Light Detection and Ranging (LiDAR) data to complete a high-precision three-dimensional real-scene model. The urban digital twin model was established as a module with the three-dimensional base model generated by the two-dimensional frame data with a fast update speed. Based on the shortest-fault-distance intensity-attenuation model, the seismic intensity was calculated using a known active fault and aftershock sequence, and the applicability of this method was verified. The elastic-plastic time history analysis method was used to calculate the seismic response of the building, and the seismic damage level was visualised using a three-dimensional model. The dynamic changes of earthquake disasters are monitored by sensors in real time and analysed in a digital twin model to provide an optimal scheme for earthquake emergency rescue and accurate evaluation results of earthquake disasters.
1. Introduction
China has frequent natural disasters, and the characteristics of various natural disaster agglomerations and chains have become increasingly prominent. Earthquakes are sudden disasters characterised by instantaneous occurrence, severe damage, and serious secondary disasters. The first serious disaster can cause severe casualties, economic losses, and incalculable social impacts (Chen et al. Citation2021; Wang et al. Citation2021; Guo et al. Citation2023). At the traditional cognitive level, the unpredictability of earthquake disasters often leads to increased destruction. As a digital application, digital twin technology can provide effective solutions such as coordinated real-time synchronisation, comprehensive and accurate rescue, and iterative optimisation of decision-making processes in the entire earthquake disaster management process. Simultaneously, digital twin technology plays an important role in the landing and iterative upgrading of scene application construction (Pantoja-Rosero et al. Citation2023a, Citation2023b). Scene application improves the visibility of the interaction between earthquake disasters and emergency management, is conducive to risk-informed decision-making and coordination among stakeholders, and realises the transformation and upgrading from passive to active emergencies (Qiu and Chen Citation2022).
A digital twin refers to the integration technology of real-time interaction between the virtual and the real by constructing a digital model equivalent to a physical entity based on the concept of a digital physical entity. In 2021, Bauer et al. (Citation2021) introduced digital twin technology to solve the problem of observation and model fusion in Earth Science research. Digital twin technology involves mapping the physical world and is key for the future digital and intelligent development of cities and villages. It is a cloud-network fusion system based on integrating Heaven, Earth, and air. Relying on a technical ecosystem composed of communication networks, the IoT, and Internet integration, digital twin is the perception of the full-time global space. Its application in earthquake disaster assessment can realise the interaction between regional earthquake disaster monitoring and emergency decision-making and improve earthquake disaster prevention and control (Tao and Zhang Citation2017a; Tao et al. Citation2018; Tao et al. Citation2019a).
Digital twin essentially uses real-world data to create virtual images. (Xiao et al. Citation2023). Recently, scholars have used digital twin technology to predict product or process performance (Rasheed et al. Citation2020; Raj Citation2021), industrial product process design (Tao et al. Citation2017b; Tao et al. Citation2019b), the life cycle of simulated products (Chryssolouris et al. Citation2009; Liu et al. Citation2022), urban flood disaster assessment and early warning (Li Citation2022), and emergency management process integration (Liu et al. Citation2022). Many studies have been conducted(Li and Tang 2022), and fruitful results have been achieved. Regarding earthquakes, Hoskere et al. (Citation2022) used drones to obtain post-earthquake images to synthesise three-dimensional scenes and evaluate the loss of buildings. Kusakabe et al. (Citation2021) developed the urban high-fidelity model based on the bulk data exploiting capability computing system that performs multi-physical seismic simulation in the digital twin model. Lin et al. (Citation2021) used a finite element model and digital twin technology to evaluate the seismic collapse probability of long-span cable-stayed bridges. Levine and Spencer (Citation2022) used uncrewed aerial vehicle (UAV) images, three-dimensional point cloud change monitoring, and other technologies to identify the post-earthquake safety of buildings. However, Pantoja-Rosero et al. (Citation2023a) used image-based automation methods to generate accurate finite models for masonry buildings to estimate their structural responses, which is valuable in post-earthquake assessment. Few studies have been conducted on digital twin technology for emergency rescue management of earthquake disasters. This study uses satellite remote sensing, real-time sensors, big data, and artificial intelligence algorithms to construct digital twins from two aspects: earthquake disaster monitoring and resource data provision. By simulating earthquake disasters, the conversion relationship between ground motion parameters and seismic intensity was used to estimate the range of seismic intensity and evaluate the loss of earthquake disasters. Sensors then send real-time information back, and the earthquake disaster and its digital image in the entire life cycle are mapped using a three-dimensional digital model. Based on the physical model, a scene application is added, which is expected to realise synchronisation and unification between the virtual and real scenes of an earthquake disaster. Realising the digitisation, visualisation, and intelligence of the entire process from data to scene provides a scientific information basis for earthquake emergency rescue management and effective entry points for the government to handle earthquake emergency events. It improves the agility of earthquake emergency management. Establishing an effective digital twin city for earthquake emergency management and a timely understanding of the actual vulnerable city links (Rodgers et al. Citation2020) can help urban decision-makers analyse the current potential earthquake disaster risks, conduct data-based emergency management, and apply digital twin technology to improve the efficiency of disaster prevention, mitigation, and relief response.
Digital twin was first proposed by Grieves and Vickers (Citation2017) in product life cycle management at the University of Michigan in 2003. Then, it gradually evolved into the ‘mirror space model’ and ‘information mirror model’. In 2012, the National Aeronautics and Space Administration issued a report titled ‘Modelling, Simulation, Information Technology, and Processing Roadmap’ and formally proposed the concept of a digital twin. Glaessgen and Stargel (Citation2012) proposed a three-dimensional digital twin model that was upgraded from a relatively single GIS data group to a fusion of multi-source, heterogeneous, and multi-temporal spatial data to reconstruct the ever-changing real-time spatial three-dimensional model data of the city. Twin mapping of the urban physical space to the virtual digital space was realised, and a virtual scene digital city was generated from urban big data. Some researchers have proposed that the construction of urban digital twins can be divided into four stages (Li Citation2022): 1) accurate, comprehensive, and dynamic mapping of the current situation of the city; 2) learning, analysing, identifying, summarising, and discovering the learning twin of urban operation rules from historical data; 3) simulation twins of development scenarios under different environmental backgrounds under manual supervision; and 4) autonomous twins of real-time data access and artificial intelligence automatic decision-making. At present, digital twin cannot realise the autonomous twin of automatic decision-making and is still an analogue twin. Therefore, urban digital twin products based on urban information models have been promoted gradually (Pluciennik Citation2011; Wang et al. Citation2018).
2. Digital twin technology and digital twin model
In this study, an urban digital twin is established using a three-dimensional real scene and base model, solving the problems of a large amount of data, high cost, and slow updating of digital twin. The three-dimensional model of a building with a high degree of simulation was established using point cloud data and UAV images. The three-dimensional model established after the earthquake is compared with the three-dimensional model before the earthquake and the damage from the earthquake disaster is judged so that the digital twin technology can be applied to damaged earthquake disaster buildings.
2.1. Digital twin technology
The digital twin city can be defined as a network system that reflects the real urban system through data and models to perceive and synchronise urban activities in a full-time global space, multi-dimensionally identify important data in the whole region, and give ‘digital identity’ to urban physical world objects. Urban digital twins can converge important elements. After intelligent analysis, virtual and real interactions between the physical and virtual worlds can be conducted to simulate the dynamic changes for urban decision-making applications and analyses. shows the concept of the earthquake disaster city digital twin proposed in this study. By simulating the physical world in the data world, changes in the physical world are fed back to the data world through sensors and evaluated in the digital world. Possible situations are calculated to realise the digital twin.
Figure 1. Concept map of earthquake disaster city digital twin.
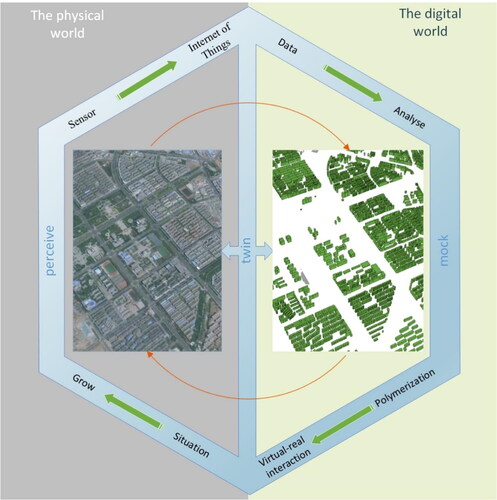
An urban digital twin comprises a physical city, a virtual city, intelligent analysis, dynamic perception, and a digital twin. A physical city is the physical world carrier of the digital twin model, and a virtual city is the geometric mapping model of the physical model. Intelligent analysis is the application and service of urban earthquake disasters, such as earthquake intensity range, loss assessment, and intelligent suggestions for emergency rescue decision-making formed by encapsulating various data, algorithms, simulations, and results required for digital twin applications. Dynamic perception involves realising the interaction between physical and virtual cities through sensors and IoT. Digital twin is the information interconnection between each component. It is necessary to ensure complete correspondence between the digital twin city and the entity unit and the high-precision fusion of multi-source heterogeneous urban spatial information (Gu et al. Citation2020) to ensure the non-tampering, traceable and credible attributes of earthquake disaster elements to realise the integration of emergency management in digital twin cities. Digital twin technology has been applied in the emergency response to urban earthquake disasters. It can simulate important disaster information in the real world, reconstruct disaster scenarios in the digital world, and simulate the urban damage caused by seismic events.
2.2. Urban digital twin construction
Constructing an urban digital twin model is a comprehensive utilisation of satellite remote sensing, UAV remote sensing, LiDAR, oblique photography, mobile measurement, and other space–sky–ground three-dimensional digital acquisition methods. Different three-dimensional spatial data are obtained based on real structures. The three-dimensional model can consider more complex and real scenes than the traditional two-dimensional model. Although the three-dimensional model is simplified to the real world, some differences exist between the simulated and measured data (Schneider et al. Citation2014). However, the real three-dimensional model collected using the space–sky–ground method is still closer to the real world (Levine and Spencer Citation2022). The three-dimensional model is necessary to build a digital twin for earthquake-stricken cities.
2.2.1. 3D real scene model
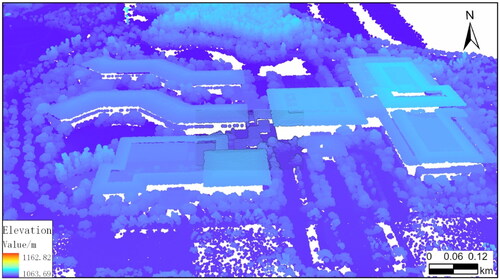
Three-dimensional urban reconstruction is mainly realised by fusion modelling of UAV remote sensing, LiDAR, ground measurements, and oblique photography. The sparse point cloud generated by the UAV image was fused with the LiDAR point cloud, and a more accurate three-dimensional model was generated after ground measurement correction, realistically reproducing the ground object shape in the physical city. First, the UAV is used to obtain urban images using oblique photogrammetry technology, and the UAV images are used to generate sparse point clouds and preliminary 3D models simultaneously. The recorded LiDAR data were then used to obtain high-density point-cloud data (). Due to the high density of the obtained point-cloud data, it must be resampled to reduce the amount of point-cloud data, and data are filtered and denoised to improve the subsequent processing efficiency. Finally, an automatic fine registration method was used to register the point-cloud coordinate system. The registered LiDAR point cloud data and UAV oblique photography images were simultaneously imported into the 3D modelling software to generate a 3D city model. The ICP point cloud matching algorithm (Pomerleau et al. Citation2015) was used to register for the point cloud coordinates. The principle is to first obtain the feature points of two point sets, match the data according to the feature points, solve the motion parameters according to their correspondence, and use these parameters for data conversion (Xie and Lv Citation2022). The objective function is minimised by the corresponding points, and the calculation formula is as follows:
(1)
(1)
where
is the number of iterations;
is the point in the reference point cloud;
is the corresponding point in the target point cloud;
and
are the rotation and translation matrices that must be calculated, respectively.
Figure 2. Local point cloud data.
2.2.2. Optimal city digital model design
Creating a fully mirrored digital twin and ensuring the integrity of its application scenarios are significant challenges for cities. Although the three-dimensional model of a real scene is the closest to the real physical world, there are many shortcomings in applying the model itself. 1) The data is too large, and the digital twin city is based on a three-dimensional real scene. By improving the resolution of the captured image, the amount of data of the three-dimensional real scene model of the general scale city can be ‘T' as a unit; 2) It is difficult to update the data, and the urban development is dynamically changing. It is necessary to update the data constantly to ensure a complete model. The amount of complete update work is excessively large, and the local update is due to the time of the dataset. Inconsistencies, different resolutions, differences in coordinate accuracy, and other issues lead to non-coincidence; 3) the modelling cost is too high. The use of oblique photogrammetry technology and LiDAR point clouds can achieve automated three-dimensional real-world modelling; however, according to the complexity and scale of the city, the cost of generating oblique photography model data is still very high.
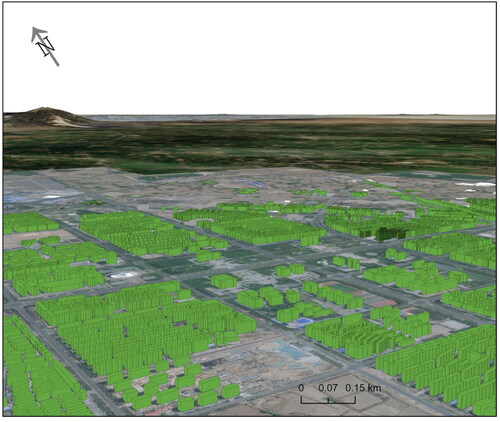
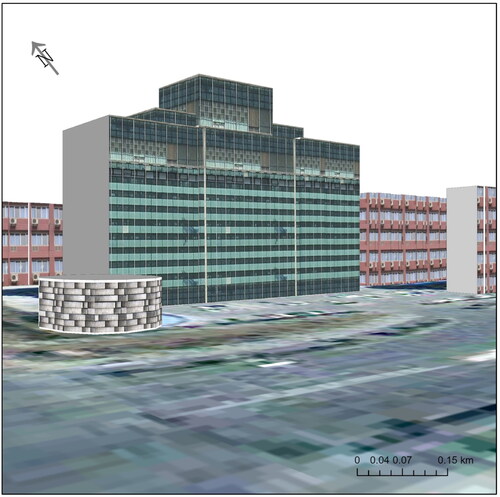
Based on the above factors, designing an optimal urban model with fast iteration speed, data accuracy, model adaptation, and low modelling cost is urgently required to solve the current digital twin cities. The three-dimensional base model is a reliable processing method. The base model was generated based on two-dimensional frame data (), and the amount of data was relatively low. According to the control plan, a three-dimensional model was automatically generated between the systems. As the framework data are readily available, the cost of generating white modules from the framework data is negligible. Simultaneously, the generated base model is a native monomer that can easily hang all attribute data types. Moreover, with the deepening of urban design, the base model can be locally refined, and the base model also provides plenty of space for visualisation, making the most detailed model based on continuous simplification and improving browsing fluency (Qiu and Chen Citation2022). The white and real three-dimensional models were combined. A three-dimensional real model was used in the key areas, and a white model was used in the non-key areas. Flexible modelling is realised modularly, solving the complex problems of urban digital models and the contradiction between simplified virtual models and complex physical objects.
Figure 3. Local 3D base model of the city.
3. Construction idea of digital twin in earthquake disaster city
Pure observations or simulations cannot solve the problem of incomplete prior knowledge; a solution to this problem requires an organic combination of the two. Digital twin provides an effective way to realise this set; the information related to the urban earthquake disaster is fed back to the virtual city in real time using the information collection terminal and information transmission medium in the physical city. The data processing and simulation analysis system in the virtual city is used to realise the evaluation and rescue guidance of earthquake disasters in the physical city to achieve accurate mapping and virtual-real interaction between the physical and virtual cities.
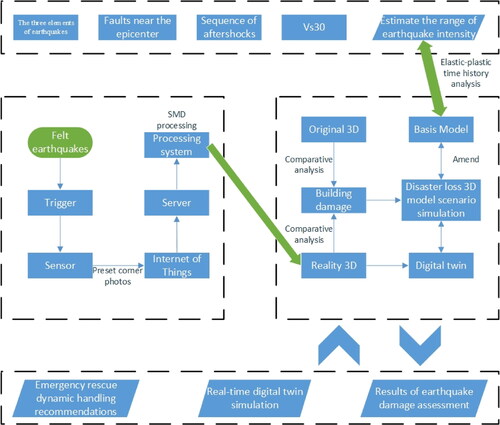
The construction of the digital twin of an earthquake disaster city makes full use of the data accumulation and observation ability of earthquake disaster assessment (disaster loss assessment and seismic intensity assessment). It integrates the rough assessment results with the observation. However, observations can be combined with the model, and the calculation results of the evaluation model can be constrained by the observation information to drive the digital twin simulation of earthquake disaster assessment in earthquake-disaster cities. Combining the two provides knowledge and training samples for studying earthquake disaster assessment algorithms, summarising and calculating the threshold for earthquake disasters, estimating the strength and equipment of rescue personnel, and proposing suggestions for emergency response situations. Algorithms for seismic intensity and disaster loss assessment are crucial. This study calculated the ground motion in each kilometre grid using the shortest fault distance model, which was applied to the building, and the ground motion response results were calculated and rendered in a three-dimensional model. The sensor returns a real-world situation to the system in pictures and performs patch processing. The differences between the original and the real-time three-dimensional scenes of the building were compared, and the actual damage caused by the earthquake was determined. The overall evaluation results have been corrected to provide suggestions for emergency rescue disposal. Simultaneously, changes in earthquake disasters were monitored in real time and processed in digital twins and proposed advice on earthquake emergency disposal. shows the technical route for digital twin construction in an earthquake disaster city.
Figure 4. Technical route of digital twin construction in earthquake disaster city.
3.1. Seismic intensity assessment
Seismic intensity reflects the ground motion intensity caused by earthquakes and their influence (Zhao et al. Citation2022). The rapid assessment of seismic intensity is an important basis for earthquake disaster loss assessment and emergency rescue. Empirical models of seismic intensity are popular research topics among seismologists. The most commonly used intensity attenuation relationship in China is based on the epicentral distance. The severe disaster area obtained using this model for large earthquakes above 7.0 differs from the actual results (Wang et al. Citation2013; Zhang et al. Citation2015). Therefore, this study used a ground motion attenuation model based on strong motion observation data from Japan combined with the source rupture process. The technical idea of using the back-projection energy point and shortest fault distance ground motion attenuation relationship is proposed to quickly obtain seismic intensity. This method has been verified for the 2021 Qinghai Maduo Mw7.3 earthquake (Zhang et al. Citation2021; Chen et al. Citation2022) and the 2023 Turkey Mw7.8 earthquake (Chen et al. Citation2023).
3.1.1. Shortest fault distance model
Based on the shortest fault distance, the ground-motion attenuation model comprehensively considers three factors: earthquake magnitude, fault type, and site characteristics (Si et al. Citation2010; Zhao et al. Citation2022; Zhao et al. Citation2023). This simple model has fewer parameters and is convenient for calculations. It is suitable for intensity assessment of moderate and strong earthquakes after testing using historical earthquake cases and actual emergency work. The main data required when using the ground motion attenuation model with the shortest fault distance are the magnitude, epicentral coordinates, focal depth, equivalent shear wave velocity, and active faults. The specific method is to grid the study area and generate the geometric centre point of each grid. Simultaneously, the seismogenic fault line is input to determine the nearest position of the grid centre point and the fault to calculate the ground motion parameters of each centre point and the corresponding grid ground motion parameters (Si et al. Citation2010). The calculation model was as follows:
(2)
(2)
(3)
(3)
(4)
(4)
(5)
(5)
(6)
(6)
(7)
(7)
The grid geometric centre point coordinates are (), and the nearest position coordinates of the grid centre point from the segment are (
);
is the thickness of the covering layer (km), with a value of 1;
is the source distance;
is the shortest distance of the fault (km);
is the seismic peak acceleration (m/s2); and
is the seismic peak velocity (m/s).
is the seismic moment magnitude, and its value in this study was 8;
is the focal depth (km), and its value was 20;
is the terrain amplification factor;
is the equivalent shear wave velocity in the depth range of 30 m below the surface.
3.1.2. Equivalent focal distance model
This study adopted an equivalent source distance model to estimate the seismic intensity. The epicentre occurs on an undiscovered active fault, or the earthquake does not cause a surface rupture. As aftershocks are distributed approximately along the rupture line, each aftershock epicentre can be regarded as a source for the solution. The model can be regarded as the intensity attenuation relationship of a line source, which requires the input of the position coordinates of each aftershock and the relative energy value released. The calculation model is as follows:
(8)
(8)
(9)
(9)
(10)
(10)
where
is the equivalent source distance (km),
is the distance between the centre point of the spatial grid and the
th aftershock point (km),
is the relative energy released by the
th aftershock point, which is a dimensionless value. The influence of topography can be calculated using Equations (6) and (7).
3.1.3. Applicability verification of seismic intensity assessment model
A historical earthquake was simulated to verify the applicability of the ground-motion attenuation model used in this study. The seismic intensity calculated using the model in this study was compared with the historical investigation intensity. The model’s applicability was verified by comparing the spatial location of seismic intensity, range, and size of the seismic intensity. The Yinchuan-Pingluo M 8 earthquake, which occurred in 1739, was used as the simulated historical earthquake. Many scholars who have made relatively clear conclusions have studied the seismogenic structure and earthquake disasters (Deng and Liao Citation1996; Bai and Jiao Citation2005; Lin et al. Citation2013; Lei et al. Citation2015). Therefore, the earthquake has applicability verification conditions for the ground motion attenuation model, which can truly reflect the model’s applicability in calculating seismic intensity. As the historical earthquake magnitude is the estimated magnitude M, this study used the M value as the Mw magnitude to facilitate the calculation. According to the intensity calculation results of the ground motion attenuation model (), the long-axis direction of the seismic intensity calculated by the model is consistent with Lei et al. (Citation2015) (black isoseismal in ). The highest historically calculated intensities reached X-X+, which is the same result. By comparing the size of each intensity range (), the range of seismic intensity calculated by the model is greater than the calculated intensity of historical earthquakes, and the maximum error rate reached −608.49%. This result was inconsistent with our expectations. After consulting the literature and comparing the intensity results of field surveys in recent years, three main reasons were identified for this result: 1) As the historical estimation of earthquake intensity is very limited, it is common to estimate the results too conservatively; 2) the earthquake occurred in the Yinchuan fault basin, and there is a basin amplification effect; 3) Helan Mountain is in the west of the epicentre, and the Ordos platform in the east, which does not live. The historical earthquake intensity VIII area calculated by Lei et al. (Citation2015) is considered a disaster-bearing body; therefore, there is a significant underestimation. The actual seismic intensity is about twice the historical intensity. According to this result, the intensity calculated using the model was very close to the real intensity, regardless of the VIII intensity anomaly area.
Figure 5. Intensity results of the ground motion attenuation model.
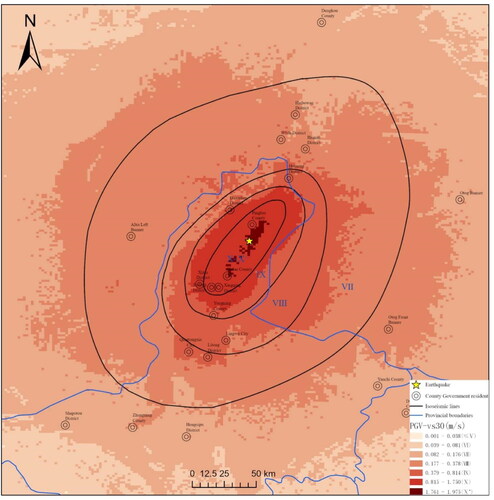
Table 1. Comparison of model calculated intensity and historical calculated intensity.
3.2. Earthquake disaster loss evaluation
As the most direct disaster-bearing body of earthquake disasters, the degree of influence of earthquake disasters on buildings directly reflects the disaster situation. To meet the rapid requirements of post-earthquake emergency rescue for disaster assessment and reduce the computational cost in the emergency stage, a method based on the refined simulation of different structural types of buildings has good applicability to ground motions with different intensities and greatly improves the calculation efficiency of earthquake disaster loss assessment (Chen et al. Citation2021; Chen et al. Citation2022; Yuan et al. Citation2023). Using detailed survey data from the first China Natural Disaster Comprehensive Risk Census Project and the three-dimensional model data established in this study, attribute assignment was performed through spatial location association (Yu et al. Citation2022). The house structure, number of layers, height, building materials, and other information of the house detailed survey data were assigned to the corresponding three-dimensional model data. According to the elastic-plastic time history analysis method, the floor response and statistical information of each building under the ground motion (Lin Citation2017; Zhang et al. Citation2022; Lu et al. Citation2023) were obtained, and the building damage index in the classification of earthquake damage to buildings and special structures was selected to define the damage level of the building. The damage index is defined based on the seismic damage index of the seismic damage investigation. The part before the corresponding point (yield point) of the nominal yield strength of the floor was defined as intact, and the corresponding seismic damage index was 0–0.1. The part between the yield and critical collapse point is defined as slight damage, moderate damage, and severe damage, and the corresponding seismic damage indexes are 0.1–0.3, 0.3–0.55 and 0.55–0.85, respectively. The part after the critical collapse point is defined as destruction and collapse, and the corresponding seismic damage index is 0.85–1.0. Assuming that the mass and stiffness of each layer of the multilayer structure are equal, the dynamic equilibrium elastic-plastic time history analysis formula of the linear structural system can be expressed as follows:
(11)
(11)
where
and
are the mass, damping, and stiffness matrices of the structural system, respectively,
and
are the acceleration, velocity, and displacement deflections of the structural system, respectively. Using the Rayleigh damping theory,
and the
and
values can be determined by calculating the period and damping ratio of the structure. Combined with the type of building structure, construction age, auxiliary fortification type and site type, the physical model of building structure is established, and the mass, damping and stiffness matrices (
) of each parameter are obtained. Among them, the structural mass
is estimated according to the area, and the parameters
and
are calculated according to the relationship between the height, the response spectrum of large earthquakes in China, the seismic shear force of large earthquakes and the bearing capacity and ductility of the structure.
4. Earthquake disaster scenario simulation
4.1. Overview of earthquake scenario simulation study area
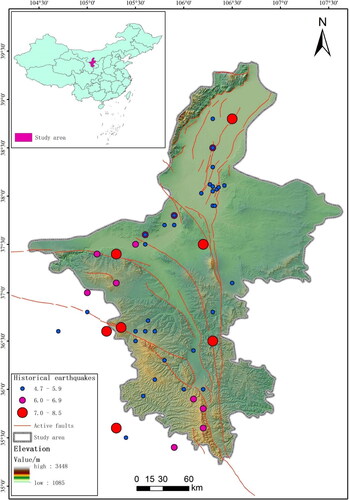
The Ningxia Hui Autonomous Region in Northwest China was selected as the research area (). The study area is located at the junction of the northeastern margin of the Qinghai-Tibet Plateau and the Ordos Block. The terrain is complex, changeable, and easily controlled by geological structures. It is one of the most severe natural disasters in China. There are many large-scale fault zones in the study area, such as the Haiyuan (Ran et al. Citation1997; Zhang et al. Citation2003; Wang et al. Citation2014), Tianjingshan (Yin et al. Citation2013), Liupanshan (Liu et al. Citation2008), Yinchuan buried faults (Li et al. Citation2014), and the seismic activity is strong. There have been many large earthquakes in modern times, among which the Haiyuan M 8.5 earthquake of 1920 is the most famous. According to the relevant requirements of the Code for Seismic Design of Special Structures, the seismic fortification level of the buildings in the study area is mostly 8 degrees, and very few are 7 degrees. The basic design seismic acceleration values of 8 degrees and 7 degrees are 0.2 and 0.15 g respectively.
Figure 6. Overview of the study area.
4.2. Building seismic damage simulation
A destructive earthquake event was simulated, and the seismic response of the building was quantitatively calculated according to the simulation parameters. This study used the 1739 Yinchuan-Pingluo M 8 earthquake as the simulated seismic event. Earthquake intensity can be calculated according to the ground motion attenuation model used in this study (). According to seismic intensity, seven cities were within the influence range of seismic intensity VII, five cities within seismic intensity VIII, five cities within seismic intensity IX, and six cities within the range of seismic intensity X-X+. Based on the seismic intensity, we observe the seismic energy at that time and its wide influence. Through a detailed understanding of recent building disasters in Pingluo County, the severity of the damage caused by this simulated earthquake disaster event is clearly understood. The ground-motion parameters were calculated, and the PGA distribution and seismic waveform matching the local design response spectrum were obtained based on the attenuation relationship. The elastic-plastic time history analysis method obtains the seismic response of each building, including the structural displacement, deformation, and damage level. The damage to the building was transformed into an earthquake damage level and visualised using a three-dimensional model (). Visual information from the simulation results can be used to understand the spatial distribution of building damage from a comprehensive perspective and to realise the seismic response results of each building under fixed ground motion conditions. There are 6466 buildings in Pingluo County, all within the seismic intensity range X-X+. After the statistical simulation of the calculated seismic response results in underground motion (), only 44 buildings remained intact, accounting for 0.68%. There were 702 buildings with minor damage (10.86%), 1322 buildings with moderate damage (20.45%), 1370 severely damaged buildings (21.18%), and 3028 destroyed and collapsed buildings (46.83%). According to the statistical results of building seismic damage, when the seismic intensity reached X-X+, only a few buildings with good seismic capacity were slightly damaged. Such buildings have taken good seismic measures, such as seismic isolation technology and other special buildings. Nearly 90% of the buildings were in moderate or above damage, and the ratio of damaged to collapsed buildings was as high as 46.83%, indicating that buildings will be severely damaged and cause great losses under such a strong earthquake. The applicability of this method can be reflected to a certain extent by simulating historically destructive earthquakes. Simultaneously, the simulation evaluation results provide empirical value in dealing with destructive earthquakes and clarify the degree and scope of earthquake damage. It has scientific reference value for earthquake emergency response decision-making.
Figure 7. Simulated seismic intensity.
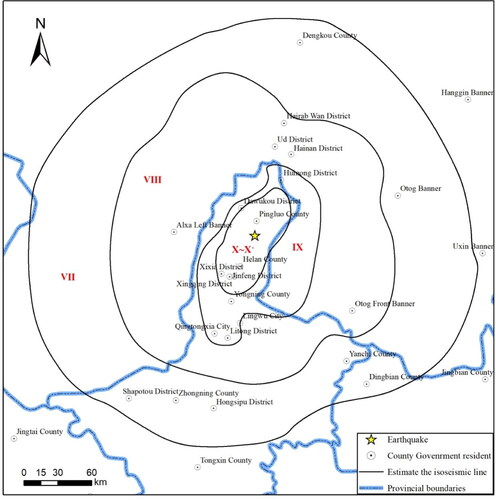
Figure 8. Earthquake damage distribution of buildings in Pingluo County.
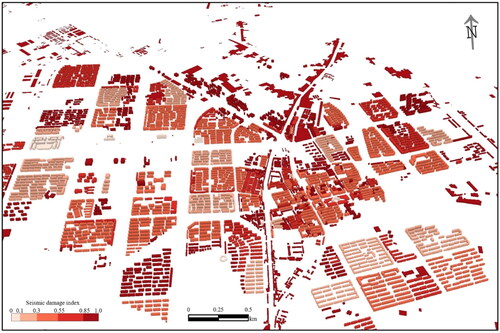
Table 2. Earthquake damage of buildings.
4.3. Earthquake disaster city digital twin
The digital twin city in an earthquake disaster differs from that of the digital twin system. It is a digital twin in physical space. The real significance is to solve practical problems in the application scenarios of earthquake disasters and smooth switching between them rather than using an ‘aesthetic model’. The GIS platform used in this study was ArcGIS Pro, a new generation of original ecological 64-bit ArcGIS desktop products launched by the ERSI. It has powerful two- and three-dimensional integration functions that inherit almost all the functions of traditional desktop products like ArcMap. It has been further optimised and improved in many aspects. This new generation of desktop GIS platforms integrates cloud integration, data science, and spatial data science.
Using the seismic waves generated by the earthquake to start the trigger, the sensor immediately starts shooting the important target building at a preset angle after receiving the signal. The pan-tilt with the sensor can rotate by 360° and shoot at multiple angles, and the pan-tilt is equipped with a fill light. Photos could also be taken at night. The sensor is also equipped with an encoder and a wireless router to transmit photos to the server through 5 G wireless transmission. After analysis and processing, the photographs are fused to the corresponding three-dimensional model by patching (). By comparing the fused three-dimensional model with the three-dimensional real scene model, it can clearly show the deformation, displacement, and other damage to the target building and continue to transmit data in real-time to the physical world changes through sensors. The information obtained by the sensor can modify the evaluation results, because the earthquake disaster is very complex, and the simple evaluation results may be different from the actual situation. According to the results of digital twin of earthquake disasters, earthquake disaster assessment loss is corrected to determine the damage to each building, and the aftershocks are monitored in a timely and dynamic manner to detect changes in disaster losses caused by earthquakes from subtle changes. Based on the changes in the monitoring results, optimal suggestions for earthquake emergency rescue disposal were determined. The deployment suggestions of rescue forces and equipment are fed back to the decision-makers, which can effectively improve decision-making effectiveness. After the main shock, it is very likely that a large aftershock will occur in the future. These aftershocks may lead to the destruction of buildings that have been seriously damaged again, which may lead to the complete collapse of buildings. From this perspective, digital twin is ubiquitous in the entire time and space domains. It can effectively monitor serious secondary disasters (e.g. fires, explosions, and harmful gas leakage caused by earthquakes), take necessary precautions and countermeasures, and propose scientific safety relief lines. To a certain extent, this can avoid threats to people’s lives and property, improve the efficiency of emergency rescue, and minimise casualties.
Figure 9. Fusion of preset angle photo and 3D model patch.
5. Conclusion and discussion
This study proposes applying digital twin technology to earthquake disaster scenarios. The urban digital model is established using a three-dimensional real-scene model and a three-dimensional white model, which provides the necessary data support for urban digital twins. The applicability of the shortest-fault-distance intensity attenuation model was analysed, and its reliability for calculating seismic intensity was determined using the simulation of historical earthquakes. The elastic-plastic time history analysis method was used to calculate the seismic response results of each building, and the damage caused by the simulated earthquake to the buildings in the study area was determined. The sensor was used to digitally twin the earthquake disaster scene and monitor dynamic changes in the earthquake disaster in real time. The main conclusions are as follows.
The key places proposed in this study use a three-dimensional real scene model, and the non-key places use three-dimensional white grinding, effectively solving the problems of much data, difficult iterative updates, and high costs.
During extreme earthquakes, seismic intensity reaches X-X+ in the city area, the seismic capacity of buildings is far from sufficient, and the damage caused by ground motion brings great disaster, causing serious losses.
The application of digital twin technology can be used to monitor the physical world, analyse and manage the periodic activities of the beginning, development, and extinction of earthquake disasters, and summarise the processing experience of the whole process, which provides experience for future earthquake disaster emergency rescue.
This study provides a scientific basis for pre-earthquake risk assessment and post-earthquake emergency rescue efforts. There is still the serious problem of insufficient seismic capacity when a building is subjected to a destructive earthquake on the opposite side. Although improving the seismic fortification level and taking effective seismic measures, such as seismic isolation, are the most effective methods, they cannot be realised quickly. If the early prevention and preparation work is insufficient, it is difficult to respond promptly when an earthquake occurs, and if these measures are ineffective and cause heavy losses, it inevitably brings greater pressure to post-disaster recovery and reconstruction tasks. Therefore, according to the simulation results, the digital twin method of earthquake disaster city can propose prevention and control suggestions for high-risk areas. After an earthquake, an efficient emergency rescue solution can be proposed based on the dynamic twin results to reduce the losses caused by earthquake disasters.
Finally, certain limitations to the method proposed in this study must be noted. The amount of three-dimensional real scene data is large, and the data reading, calculation, and rendering process is relatively slow. The real-time monitoring of an earthquake disaster is dependent on the network. In the case of an earthquake that damages the network base station, monitoring ability is lost, and a real-time digital twin cannot be realised. Therefore, in future research, we will improve the three-dimensional expression ability of the digital world while reducing the amount of data and achieving diversified real-time digital twins as the research goal.
Authors’ contributions
Conceptualisation, S. Y.; methodology, S. Y.; formal analysis, S. Y. and Q. L.; investigation, N. Z. and C. L.; resources, Q. L.; data curation, S. Y.; writing—original draft preparation, S. Y.; writing—review and editing, S. Y.; supervision, S. S. and X. Z.; and project administration, S. Y. and Q. L. All authors have read and agreed to the published version of this manuscript.
Data availability statement
Seismic and earthquake-shaking data were obtained by contacting the corresponding author on reasonable grounds.
Disclosure statement
The authors declare no competing interests.
Correction Statement
This article has been corrected with minor changes. These changes do not impact the academic content of the article.
Additional information
Funding
References
- Bai MX, Jiao DC. 2005. Historical analysis of the magnitude 8 earthquake disaster in Yinchuan-Pingluo in 1739. Northwest Seismol J. 27(2):135–140.
- Bauer P, Dueben PD, Hoefler T, Quintino T, Schulthess TC, Wedi NP. 2021. The digital revolution of Earth-system science. Nat Comput Sci. 1(2):104–113. doi:10.1038/s43588-021-00023-0.
- Chen B, Wang F, Xiao BF. 2021. The development of ‘scenario-response’ theoretical system and its application in earthquake disaster emergency management. Technol Earthquake Disaster Prev. 16(4):605–616. doi:10.11899/zzfy20210401.
- Chen WK, Rao G, Kang DJ, Wan Z, Wang D. 2023. Early report of the source characteristics, ground motions, and casualty estimates of the 2023 MW 7.8 and 7.5 Turkey earthquakes. J Earth Sci. 34(2):297–303. doi:10.1007/s12583-023-1316-6.
- Chen WK, Wang D, Zhang C, Yao Q, Si HJ. 2022. Estimating seismic intensity maps of the 2021 MW 7.3 Madoi, Qinghai and Mw 6.1 Yangbi, Yunnan, China earthquakes. J Earth Sci. 33(4):839–846. doi:10.1007/s12583-021-1586-9.
- Chen XN, Lin XC, Zhang LX, Skalomenos KA. 2022. Method for rapidly generating urban damage scenarios under non-uniform ground motion input based on matching algorithms and time history analyses. Soil Dyn Earthquake Eng. 152:107055. doi:10.1016/j.soildyn.2021.107055.
- Chen XN, Zhang LX, Lin XC, Lu XZ. 2021. Study on matching algorithm of urban seismic scenarios based on ground motion database. Earthquake Eng Eng Dyn. 41(2):76–83. doi:10.13197/j.eeev.2021.02.76.chenxn.008.
- Chryssolouris G, Mavrikios D, Papakostas N, Mourtzis D, Michalos G, Georgoulias K. 2009. Digital manufacturing: history, perspectives, and outlook. Proc Inst Mech Eng B. 223(5):451–462. doi:10.1243/09544054JEM1241.
- Ministry of Housing and Urban-rural Development of the People’s Republic of China & State Administration for market regulation. 2009. Classification of earthquake damage to buildings and special structures: GB/T24335-2009. Beijing: standards Press of China.
- Ministry of Housing and Urban-rural Development of the People’s Republic of China & State Administration for market regulation. 2010. Code for seismic design of building: GB50011-2010. 2016 ed. Beijing: China Construction Industry Press.
- Deng QD, Liao YH. 1996. Paleoseismology along the range-front fault of Helan Mountains, north central China. J Geophys Res. 101(B3):5873–5893. doi:10.1029/95JB01814.
- Glaessgen E, Stargel D. 2012. The digital twin paradigm for future NASA and U.S. Air Force vehicles. In. Proceedings of the 53rd AIAA/ASME/ASCE/AHS/ASC Stuctures, Structural Dynamics and Materials Conference. Reston: AIAA; p. 1–14. doi:10.2514/6.2012-1818.
- Grieves M, Vickers J. 2017. Digital twin: mitigating unpredictable, undesirable emergent behavior in complex systems. Cham: Springer International Publishing. p. 85–113. doi:10.1007/978-3-319-38756-7_4.
- Gu JX, Yang BS, Dong Z, Yang CH. 2020. Intelligent perfect information surveying and mapping for digital twin cities. Bull Surv Mapp. 6:134–140. doi:10.13474/j.cnki.11-2246.2020.0196.
- Guo XX, Wei BY, Su GW, Qi WH, Zhang TF. 2023. Determination of most affected areas by earthquakes based on mobile signaling data: a case study of the 2022 MW 6.6 Luding earthquake, China. Geom Nat Hazards Risk. 14(1):2221772. doi:10.1080/19475705.2023.2221772.
- Hoskere V, Narazaki Y, Spencer BF. 2022. Digital twins as test beds for vision-based post-earthquake inspections of building. European Workshop on Structural Health Monitoring. EWSHM 2022. Lecture Notes in Civil Engineering. 485–495. doi:10.1007/978-3-031-07258-1_50.
- Kusakabe R, Ichimura T, Fujita K, Hori M, Wijerathne L. 2021. Large-scale stabilized multi-physics earthquake simulation for digital twin. Computational Science. Lect Notes Comput Sci. 3–15. doi:10.1007/978-3-030-77964-1_1.
- Lei QY, Chai CZ, Du P, Yu JX, Wang Y, Xie XF. 2015. In 1739, the Pingluo magnitude 8 earthquake caused the seismic formation. Seismol Geol. 37(2):413–429. doi:10.3969/j.issn.0253-4967.2015.02.006.
- Levine NM, Spencer BF. 2022. Post-earthquake building evaluation using UAVs: a BIM-based digital twin framework. Sensors (Basel). 22(3):873. doi:10.3390/s22030873.
- Li Q. 2022. Analysis of the evaluation and prewarning system of the urban flood disaster based on the digital twin technology. J Beijing Univ Technol. 48(5):476–485. doi:10.11936/bjutxb2020090015.
- Li Q, Jiang ZS, Wu YQ, Zhao J. 2014. Inversion of locking and distribution of slip deficit in Haiyuan-Liupan fault zone using GPS data. Geom Inf Sci Wuhan Univ. 39(5):575–580. doi:10.13203/j.whugis20120161.
- Li RC, Tang Y. 2022. Digital twins traction process integration of emergency management: an ongoing exploration. Chin Public Admin. 10:30–38. doi:10.19735/j.issn.1006-0863.2022.10.03.
- Lin A, Rao G, Hu J, Gong W. 2013. Reevaluation of the offset of the Great Wall associated with the ca. M 8.0 Pingluo earthquake of 1739, Yinchuan graben, China. J Seismol. 17(4):1281–1294. doi:10.1007/s10950-013-9391-2.
- Lin KQ, Xu YL, Lu XZ, Guan ZG, Li JZ. 2021. Digital twin-based collapse fragility assessment of a long-span cable-stayed bridge under strong earthquakes. Autom Constr. 123:103547. doi:10.1016/j.autcon.2020.103547.
- Lin XC. 2017. Numerical simulation and risk control of earthquake disaster of urban buildings. City Disaster Reduc. 3:18–22.
- Liu BJ, Chai CZ, Feng SY, Zhao CB, Yuan HK. 2008. Seismic exploration method for buried fault and its up-breakpoint in Quaternary sediment area—An example of Yinchuan buried active fault. Chin J Geophys. 5:1475–1483.
- Liu CJ, Lv J, Ren ML, Chen S, Zhang XL, Song WL, Zhang DW. 2022. Research and application of digital twin intelligent flood prevention system in Huaihe River Basin. China Flood Drought Manag. 32(1):47–53. doi:10.16867/j.issn.1673-9264.2021375.
- Lu XZ, Qin SZ, Xu Z. 2023. Enlightenment to China on earthquake prevention and disaster reduction from the M7.8 earthquake in Turkey. City Disaster Reduc. (2). X(Z):1–8. doi:10.3969/j.issn.1671-0495.
- Pantoja-Rosero BG, Achanta R, Beyer K. 2023a. Automated image-based generation of finite element models for masonry buildings. Bull Earthquake Eng. 1–29. doi:10.1007/s10518-023-01726-7.
- Pantoja-Rosero BG, Achanta R, Beyer K. 2023b. Damage-augmented digital twins towards the automated inspection of buildings. Autom Constr. 150:104842. doi:10.1016/j.autcon.2023.104842.
- Pluciennik T. 2011. Generating roads structure of a virtual city for GIS systems testing. Stud Inform. 32(2B):43–54.
- Pomerleau F, Colas F, Siegwart R. 2015. A review of point cloud registration algorithms for mobile robotics. FNT in Robotics. 4(1):1–104. doi:10.1561/2300000035.
- Qiu BX, Chen M. 2022. Digital Twin Cities and its applications. Urban Dev Stud. 29(11):1–8.
- Raj P. 2021. Empowering digital twins with blockchain. Adv Comput. 121:267–283. doi:10.1016/bs.adcom.2020.08.013.
- Ran YK, Duan R, Deng QD, Jiao DC, Min W. 1997. 3-D trench excavation and paleo seismology at Gaowanzi of the Haiyuan fault. Seismol Geol. 19(2):97–107.
- Rasheed A, San O, Kvamsdal T. 2020. Digital twin: values, challenges and enablers from a modeling perspective. IEEE Access. 8:21980–22012. doi:10.1109/ACCESS.2020.2970143.
- Rodgers J, Su GW, Qi WH, Milledge D, Densmore A, Davis C, England P, Young J, Cao Y, Chakos A, et al. 2020. Creating an earthquake scenario in China: a case study in Weinan City, Shaanxi Province. Int J Disaster Risk Reduc. 42:101305. doi:10.1016/j.ijdrr.2019.101305.
- Schneider FD, Leiterer R, Morsdorf F, Gastellu-Etchegorry J, Lauret N, Pfeifer N, Schaepman ME. 2014. Simulating imaging spectrometer data: 3D forest modeling based on LiDAR and in situ data. Remote Sens Environ. 152:235–250. doi:10.1016/j.rse.2014.06.015.
- Si HJ, Haok X, Xu Y. 2010. Attenuation characteristics of peak ground motions during the Mw 7.9 Wenchuan earthquake. China/Proceedings of the 7th International Conference on Urban Earthquake Engineering (7CUEE)&. 5th International Conference on Earthquake Engineering(5ICEE).
- Tao F, Cheng J, Qi Q, Zhang M, Zhang H, Sui F. 2018. Digital twin-driven product design, manufacturing and service with big data. Int J Adv Manuf Technol. 94(9-12)9/10/11/12):3563–3576. doi:10.1007/s00170-017-0233-1.
- Tao F, Cheng Y, Cheng JF, Zhang M, Xu WJ, Qi QL. 2017b. Theories and technologies for cyber-physical fusion in digital twin shop floor. Comput Integr Manuf Syst. 23(8):1603–1611. doi:10.13196/j.cims.2017.08.001.
- Tao F, Sui F, Liu A, Qi Q, Zhang M, Song B, Guo Z, Lu SC-Y, Nee AYC. 2019b. Digital twin-driven product design framework. Int J Prod Res. 57(12):3935–3953. doi:10.1080/00207543.2018.1443229.
- Tao F, Zhang M. 2017a. Digital twin shop-floor: a new shop-floor paradigm towards smart manufacturing. IEEE Access. 5:20418–20427. doi:10.1109/ACCESS.2017.2756069.
- Tao F, Zhang M, Nee A. 2019a. Digital twin driven smart manufacturing. Amsterdam: elsevier; p. 3–28.
- Wang DC, Ni SD, Li J. 2013. Research status of rapid assessment on seismic intensity. Prog Geophys. 28(4):1772–1784. doi:10.6038/pg20130418.
- Wang DM, Chen JY, Gao J. 2021. Architecture and design of the virtual simulation system for earthquake emergency rescue drill based on earthquake catastrophe scenario construction. J Nat Disasters. 30(4):18–34. doi:10.13577/j.jnd.2021.0403.
- Wang W, Zhao W, Li Z. 2018. Design and implementation of 3D urban underground pipeline management information system based on skyline. Mine Surv. 46(4):120–123. doi:10.1088/1755-1315/283/1/012013.
- Wang WT, Zhang PZ, Zheng DW, Pang JZ. 2014. Late Cenozoic tectonic deformation of the Haiyuan fault zone in the northeastern margin of the Tibetan Plateau. Earth Sci Front. 21(4):266–274. doi:10.13745/j.esf.2014.04.027.
- Xiao Q, Huang HG, Bian ZJ, Qi JB, Du YM, Li JX, Wen JG, Xie DH, Bai JH, Cao B, et al. 2023. Digital twin of remote sensing experiment field: theory and key technology. National Remote Sensing Bulletin. 27(3):584–598. doi:10.11834/jrs.20232247.
- Xie YP, Lv KJ. 2022. City 3D real-world modeling based on multi-source data fusion. J Chongqing Univ. 45(4):143–154. doi:10.11835/j.issn.1000-582X.2020.276.
- Yin GM, Jiang YF, Yu G, Han F, Liu CR. 2013. The study of left-lateral displacement on the Xiangshan-Tianjingshan fault in late Quaternary. Seismol Geol. 35(3):472–479. doi:10.3969/j.issn.0253-4967.2013.03.002.
- Yu S, Xie X, Du P, Wang X, Yang S, Liu C. 2022. A method for rapidly determining the seismic performance of buildings based on remote-sensing imagery and its application. Adv Civ Eng. 2022. 2022article ID 5760913, :1–15. pages doi:10.1155/2022/5760913.
- Yuan XX, Lin XC, Dou AX, Wang SM, Zhang XH, Xiao BF, Liu Z. 2023. Rapid assessment of building seismic damage based on pre-earthquake high-resolution images and seismic simulation, taking the Luding M6.8 earthquake in Sichuan as an example. Chin J Geophys. 66(4):1438–1447. doi:10.6038/cjg2023Q0761.
- Zhang C, Chen WK, Lin XC. 2022. Earthquake damage simulation of urban buildings based on ground motion parameters: a case study of Chengguan District in Lanzhou City. J Earth Sci. 44(1):172–182. doi:10.20000/j.1000-0844.20210514001.
- Zhang C, Chen WK, Si HJ, Zhao HQ. 2021. Intensity rapid evaluation of Maduo M7.4 earthquake in Qinghai Province. China Earthquake Eng J. 43(4):876–882. doi:10.3969/j.issn.1000-0844.2021.04.876.
- Zhang PX, Min W, Deng QD, Mao FY. 2003. Recurrence of paleoearthquakes and strong earthquakes in the active fault zone of Haiyuan. Sci China Ser D Earth Sci. 833(8):705–713. doi:10.1360/zd2003-33-8-705.
- Zhang SP, Chen WK, Zhou ZH, He SL, Cai HT, Sun YZ. 2015. Improvement of intensity attenuation relationship of large earthquake (MS ≥ 7) in the western area of China. J Nat Disasters. 24(1):104–113. doi:10.13577/j.jnd.2015.0114.
- Zhao HQ, Chen WK, Zhang C, Kang DJ. 2022. Study on the new method for estimating the intensity of historical large earthquakes. J Catastrophology. 37(2):212–217. doi:10.3969/j.issn.1000-811X.2022.02.033.
- Zhao HQ, He SL, Chen WK, Si HJ, Yin XX, Zhang C. 2022. A rapid evaluation method of earthquake intensity based on the aftershock sequence: a case study of Menyuan M6.9 earthquake in Qinghai Province. China Earthquake Eng J. 44(2):432–439. doi:10.20000/j.1000-0844.20220128002.
- Zhao HQ, Jia YJ, Chen WK, Kang DJ, Zhang C. 2023. Rapid mapping of seismic intensity assessment using ground motion data calculated from early aftershocks selected by GIS spatial analysis. Geom Nat Hazards Risk. 14(1):1–21. doi:10.1080/19475705.2022.2160663.