
 ?Mathematical formulae have been encoded as MathML and are displayed in this HTML version using MathJax in order to improve their display. Uncheck the box to turn MathJax off. This feature requires Javascript. Click on a formula to zoom.
Abstract
Himalayan region is prone to landslides and every year many landslides occur. Some of these events are reported while, many of these landslides are not reported due to their remote location of occurrence, or nature of impact, and its date of occurrence is also unknown. This study tries to find a method to estimate the probable dates of landslide occurrences using time-series deformation analysis applying advanced DInSAR approach by adopting a short temporal baseline graph. We used 118 Sentinel 1-A SLC images to identify the nature, pattern, and trends of landslide deformation. Based on the time series cumulative deformation values, we found a ‘V’-shaped kink that matches with the landslide events. Such kinks were observed around 12 June 2015, 25 May 2016, 05 August 2016, 23 June 2017, 15 September 2019, 27 May 2018, 08 June 2018, and 15 July 2020. The majority of these kinks are visible during monsoon season which is expected. High-resolution Planet satellite data around these time ranges were used to verify the existence of new landslides. Moreover, the performance is evaluated using AUC-ROC, precision, recall; and F-Score. This approach has good prediction capabilities with the precision of 87%, AUC-ROC of 77% and F-score of 74%.
1. Introduction
Landslides are one of the world’s most common natural disasters, so identification of landslide has been carried out since the dawn of aerial photography. Aerial photography and satellite images are used to identify landslides using a variety of image interpretation elements such as colour, tone, surface roughness, and texture (Van Westen et al. Citation2008; Guzzetti et al. Citation2012; Gupta and Shukla Citation2018; Niraj et al. Citation2023). Because the landslide limits are usually distinct based on the idea that ‘new landslides have little vegetation’, it is relatively simple to identify and map the landslide. But as time goes on, flora begins to hide the landslides, thus diminishing the landslide boundary. Since 1986, Landsat TM, ETM, OLI; ASTER; Sentinel-2; IRS P-VI; Cartosat; and other optical remote sensing images have been primarily used to create a landslide inventory and analysis (Kumar et al. Citation2017; Gupta and Shukla Citation2018; Gupta et al. Citation2018; Zhao and Lu Citation2018; Niraj et al. Citation2023; Singh A, Ashuli, et al. Citation2023), however they fail to capture the details during monsoon season due to cloud cover. Synthetic Aperture Radar (SAR) remote sensing datasets can function in all weather conditions, which overcomes the problem of cloud cover as faced in optical remote sensing datasets. SAR methods using archived Sentinel-1; ERS (European Remote Sensing); Envisat ASAR; and ALOS PALSAR datasets have been extensively used in landslide research because of their wide-ranging and high spatial resolution, as well as their ability to function in all weather conditions (Massonnet and Feigl Citation1998; Lanari et al. Citation2004; Wasowski and Bovenga Citation2014; Niraj et al. Citation2021; Kim et al. Citation2023). Presently, Sentinel-1A −1 A SAR datasets are being used for many of the InSAR-based landslide deformation analyses due to their better temporal and spatial resolutions (Crosetto et al. Citation2015; Fiaschi et al. Citation2018; Tzouvaras et al. Citation2020; Niraj et al. Citation2021; Kim et al. Citation2023).
Mostly abrupt and large-scale deformation between two SAR acquisitions can be mapped and characterized using only one differential interferogram (Sica et al. Citation2019; Meng et al. Citation2021). However interpreting deformation results could become problematic if the atmospheric phase component cannot be excluded, which may require precise weather models (Doin et al. Citation2009; Jung J et al. Citation2014). There may be significant atmospheric distortions in the interferograms since atmospheric conditions can vary greatly across time and space. The complexity of the atmospheric behaviour in the research area is typically correlated with the spatial baseline of SAR geometry (Jolivet et al. Citation2011). Thus, considering the huge advancements made by InSAR techniques, estimating deformation rates in regions where deformation and topography are coupled is still challenging, mostly because of atmospheric influences related to topography (Jolivet et al. Citation2011). For long-term deformation monitoring, differential interferogram stacking techniques such as traditional DInSAR (Differential Interferometric Synthetic Aperture Radar), improved DInSAR, PSInSAR (Persistent Scatterer-InSAR), and DSInSAR (Distributed Scatterer-InSAR) have been utilized (Wang et al. Citation2013; Jianjun et al. Citation2017; Liu et al. Citation2018; Rosi et al. Citation2018; Niraj et al. Citation2021). The DInSAR approach is the most straightforward method for creating interferograms from two SAR images (Crosetto et al. Citation2015). It is similar to single-pass DInSAR techniques where only a single pair of SAR images are used for deformation studies before and after landslide events (Reigber et al. 2012; Wang et al. Citation2013; Tzouvaras et al. Citation2020; Niraj et al. Citation2021). Single-pass DInSAR methods use two complex SAR images collected from two antennas on the same space platform spaced perpendicularly to the flight direction (azimuth direction). Improved DInSAR, on the other hand, uses SAR images of the same area taken across time intervals ranging from days to years to leverage differences in the earth topography (Jianjun et al. Citation2017; Rosi et al. Citation2018; Pawluszek-Filipiak and Borkowski Citation2020; Niraj et al. Citation2021; Kim et al. Citation2023). The phase difference between the two image periods can be determined using the interferogram. The surface deformation that occurred throughout that period is responsible for the phase difference of the same area at different time intervals, and thus the amount of surface LOS vertical deformation may be quantified (Niraj et al. Citation2021). Millimetre–centimetre ground deformations can be estimated using this DInSAR technique, giving an important concept for identifying and monitoring landslide deformations as well as researching the trends of development of deformation phenomena associated with landslides (Wasowski and Bovenga Citation2014; Jianjun et al. Citation2017; Rosi et al. Citation2018; Niraj et al. Citation2021). Sentinel-1A SAR datasets could improve the temporal and spatial resolutions for detecting active landslides and tracking slope instabilities at regional and local scales (Wasowski and Bovenga Citation2014; Fiaschi et al. Citation2018; Aslan et al. Citation2020; Kim et al. Citation2023). Additionally, multi-temporal landslide deformation studies are being carried out using Sentinel-1A SAR datasets for detecting landslides, estimating multi-temporal landslide displacement rates, and analysing the trends and patterns of landslide deformation evolution across time (Fiaschi et al. Citation2018; Niraj et al. Citation2021).
Depending on how fast the land surface changes, the period between the two SAR images recorded can range from 0.1 s to years (Zhou et al. Citation2009). Using single-pass interferometry, the two-phase images from which an interferogram is created can be acquired in a very short time interval (0.1 s) or at two different times (up to years) using repeat-pass interferometry (Zhou et al. Citation2009). The single-pass DInSAR method is appropriate for fast-changing Land surfaces, whereas the repeat-pass DInSAR is appropriate for slowly changing land surfaces (Zhou et al. Citation2009; Reigber et al. 2012; Tzouvaras et al. Citation2020). For interferogram generation, landslide deformation comparison before and after the landslide event, generation of DEM (Digital Elevation Model), and comparison of elevation variations before and after the landslide event, the two SAR interferometry approaches (DInSAR, MTInSAR: Multi-Temporal InSAR) were used (Niraj et al. Citation2021). Standard DInSAR and MTInSAR have both shown promising results in evaluating landslide deformation in the Kotrupi landslide (Niraj et al. Citation2021). A comprehensive system is developed for a time-series InSAR study for estimating landslides deformation rates using ascending and descending Sentinel-1 images acquired from March 2017 to May 2019 in the Xiaojiang River Basin, Eastern Yunnan, China (Jia et al. Citation2022). Sentinel 1-A/B SAR images between 2015 and 2021 along ascending and descending modes were processed using the PSInSAR method to identify potentially active, landslide-prone areas in certain regions in Sikkim state, India (Bhasin et al. Citation2023).
We found that very less work is done to evaluate whether SAR can be used to identify probable dates of landslide events based on time-series landslide deformation analysis in the Indian Himalayan region. Thus, this study focuses on utilizing SAR deformation data for the estimation of tentative occurrence of landslides that mostly occur during monsoon season. Since, standard DInSAR algorithms suffer from insufficient coherence and potential decorrelation due to the small number of SAR interferograms, fixed temporal baseline, and variable spatial baseline. We modified the standard DInSAR method by using a short temporal baseline graph (STBG) to minimize the temporal and spatial baseline effects in Sentinel-1A SAR images. Thus, we could enhance the quality of the interferometric pairs and achieve good interferometric pair coherence. Hence, we choose 118 SAR images from 2014 to 2020 with a small perpendicular and temporal baseline to reduce the impact of the atmospheric and topographic effects and to obtain a modelled coherence of >0.75.
The novelty of this research, therefore, focuses specifically on a few landslide events that happened close to the Kotrupi landslide area for estimating their time-series (2014–2020) landslide deformation pattern and trends using the advanced DInSAR method. This is further studied in detail for identifying the probable dates of these landslide events. Furthermore, the deformation pattern was verified with several previously unidentified landslide scars using high-resolution Planet satellite images. The results derived from observing the pattern of temporal deformation rates provide a convincing method for several additional landslide events dates in nearby areas.
2. Study area
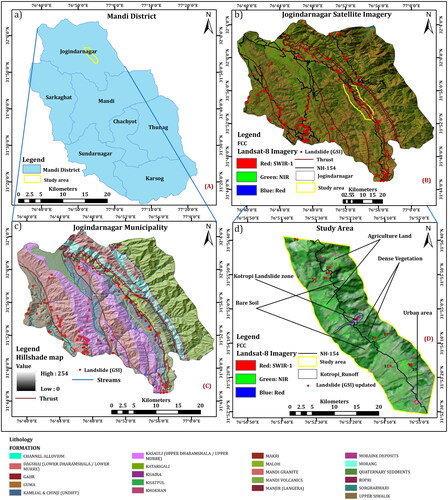
This study is conducted in the Joginder Nagar municipality in the Mandi district near National Highway (NH-154) with a spatial extent ranging from 31.25° N to 32.05° N and longitude ranging from 76.63° E to 77.37° E (). The elevation of Joginder Nagar ranges from 800 m in the valley to 3000 m on the mountains with an average elevation of 1220 m (Pradhan et al. Citation2019; Niraj et al. Citation2023; Singh A, Chhetri, et al. Citation2023). Its landscape is surrounded by dense vegetation and high mountains that are mostly made up of steep and rough slopes. It is located in a high-risk seismic zone V (Singh N et al. Citation2020). In 1905, the area was hit by a strong earthquake, the consequences of which can still be seen in the nearby Karanpur Fort (Pradhan et al. Citation2019; Singh N et al. Citation2020). It has an average annual temperature of 19.6 °C and an average annual rainfall of 1851 mm (Sharma et al. Citation2019). In the higher elevations, the climate is frigid all year round. During the winter, snowfall is common at elevations as low as 1500 m above mean sea level (MSL). The administrative map of the Mandi district is shown on the FCC (False-colour composite) of the Landsat-8 satellite image along with the prominent thrusts/faults and the known landslide points ().
Figure 1. The study area location map is shown in four sections. The study area is depicted in Section (A) over the administrative boundaries of the Himachal Pradesh Mandi district. The radiometrically and atmospherically corrected False colour composite (FCC) Landsat 8 datasets of Joginder Nagar, thrust, GSI landslide points, and National highway were utilized to represent the study region landscape, as mentioned in Section (B). Section (C) depicts the geology draped over hillshade map, as well as thrust, GSI landslide locations, and stream data for the research area. Section (D) depicts the research area’s surface features in FCC imagery, landslide incidents, and National highway.
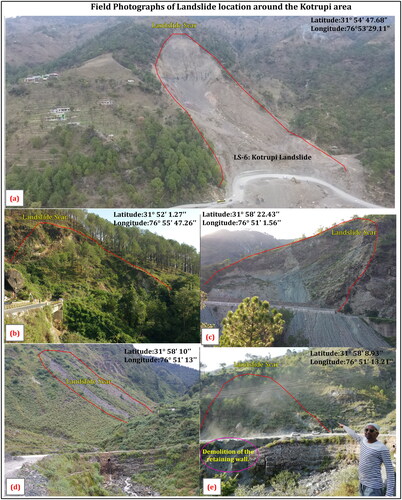
Landslides have been a major concern in this area for a long time. Most of the landslides in this region occur along roads mainly NH-154, which connect numerous rural mountainous areas in Joginder Nagar (Niraj et al. Citation2021). Major roads in Joginder Nagar are routinely obstructed and closed for long periods due to landslides. Every year during the monsoon season, notably near the NH-154, a large number of slope failures have occurred in this location (Singh N et al. Citation2020; Niraj et al. Citation2021). The most prominent and well-known landslide occurred in Kotrupi village of Joginder Nagar near NH-154 at about 00:15 h midnight on 8 August 2017 (Pradhan et al. Citation2019; Singh N et al. Citation2020; Niraj et al. Citation2021). More than 60 people died as a result of this landslide, and the road was closed for many days. The SAR analysis was carried out on a buffer area of 1 km on either side of NH 154. The NH-154 links Joginder Nagar to the Himachal Pradesh districts of Mandi and Palampur. It is connected to Dharampur by the government highway Joginder Nagar-Sarkaghat-Ghumarwin (Niraj et al. Citation2023). Field photographs of the landslide location in the Kotrupi area are shown in . The Kotrupi Landslide, which was reactivating, is shown in . Similar to , shows more Landslide photos that occurred adjacent to the Kotrupi Landslide area and along NH-154 with their corresponding geographic Latitude and Longitude.
Figure 2. Field photos taken around Joginder Nagar Municipality of Mandi district along the National Highway (NH-154) near to the Kotrupi landslide area.
2.1. Geology of the study area
Joginder Nagar is a subdivision of district Mandi in Himachal Pradesh, which forms part of the drainage basin of river Beas with its main tributary as the Uhl River which follows the Kullu thrust and drains in the eastern part of the tehsil. Rivers and channels flowing between different ranges and valleys mark the Trellis pattern in higher-order streams while the young phase of rivulets shows a dendritic drainage pattern. This area falls in the lesser Himalayan zone which is covered by the Dhauladhar range in the Northeastern part. Overall topography of the Joginder Nagar subdivision is rugged and displays high ridges and valleys which show a trend in the NW-SE direction. The minimum elevation of this subdivision is 700 m at Sidhpur, where the river Beas exits, while the maximum elevation is 3488 m at Jangal Tilla which lies on the NE margin of the tehsil (Singh N et al. Citation2020).
At the Regional scale, the Jogidernagar tehsil consists of rocks ranging from the Palaeo Proterozoic era (2500 to 1600 Ma) to the Holocene age which is a younger rock type (Singh N et al. Citation2020; Niraj et al. Citation2021). The Palaeo Proterozoic rocks comprise of Kullu, Vaikrita, and Sundernagar Groups, while the Shali group is from the Meso Proterozoic age, and Manjir, Katarigali, and Guma formations are from the Neo Proterozoic age (Pradhan et al. Citation2019; Singh N et al. Citation2020). This area consists of the Sirmaur and Siwalik Groups which are from the Palaeogene and Neogene ages respectively (Singh N et al. Citation2020). All other alluvium groups are younger than the Holocene age and represented by Quaternary, particularly in the area.
In the study area, all the major Himalayan Thrust zones traverse with an almost parallel trend with the orientation of NW-SE direction, showing increasing metamorphic grade from SW to NE direction. These Thrust zones are the Himalayan Frontal Thrust (HFT), Main Boundary Thrust (MBT), and Main Central Thrust (MCT) dipping in the northeast direction. Between these major thrusts, minor thrust also exists like Jawalamukhi Thrust (JT) between HFT and MBT and Chail Thrust (CT) between MBT and MCT (Pradhan et al. Citation2019; Singh N et al. Citation2020), which orients 206 in the same parallel way. HFT marks the boundary where the foothills of the Himalayan range start, northward of this thrust a major sedimentary lithological sequence is marked by Siwalik Groups. Siwalik group shows a normal grading sequence from north to south, the rocks in the top north are boulder conglomerates which change gradationally to sandstone and then to finer-grained in the southern direction. Ultimately the lowermost layer of rock is very fine-grained siltstone and claystone rocks which are sharply delineated by MFT in the south. Jawalamukhi thrust is a small lineament that traverses within the Siwalik group of age Pleistocene- Miocene (11–7 Ma) which gets deposited firstly in shallow marine which later changed to the continental depositional environment (Choubey et al. Citation2007). Shali Formation consists of grey slate, Phyllite in the lowermost part, white-to-purple Quartzite, grey, olive green to purple Shale. Slate and Phyllite which appears grey were collectively deposited during Miocene (20–13 Ma) in a continental setting (Singh N et al. Citation2020). Kotrupi landslide site is located on top of MBT () which marks the boundary between Siwaliks and other tertiary rocks to that of the Shali Formation (Singh N et al. Citation2020; Niraj et al. Citation2021). North of this Shali Group is marked by the Chail thrust which runs parallel to the MBT. Shali Group comes in lesser Himalayan rocks that are mainly autochthonous to para-autochthonous Proterozoic unfossiliferous low-grade meta-sedimentary sequence zone. These rocks are overlain by lesser Himalayan crystalline (LHC) rocks which are low to medium-grade crystalline rocks of the Jutogh group. The rocks of the Jutogh group are comprised of biotite chlorite schist, mica schist, and gneisses which are intruded by granites of Proterozoic to Palaeozoic ages (1.8–0.5 Ga). The contact between Jutogh and Chail formation is tectonic contact which is a hidden continuation of MCT. Further in the North, the Jutogh group is thrusted by high-grade metamorphic and migmatite rocks of the Vaikrita group having greenschist to amphibolite grade metamorphism. Vaikrita group rock evolved due to ductile extrusion during the early Miocene since ∼23 Ma along a broad northeast dipping intracontinental ductile shear zone.
3. Data and software used
The European Space Agency (ESA) Copernicus Open Access Hub made Sentinel-1A available to the general public on 3 April 2014 (ESA). Sentinel-1A Single Look Complex (SLC) SAR C-band datasets having a wavelength of 5.6 cm were used to assess multi-temporal landslide deformation in the Joginder Nagar area for this study. We used 118 Sentinel-1A images from 10 October 2014 to 30 December 2020 (Annexure 1 in Supplementary Material) having an Interferometric Wide (IW) swath with a small perpendicular and temporal baseline to reduce the impact of phase decorrelation in the area covered by dense vegetation and tropical environment. All descending mode Sentinel-1A images used in this work have an azimuth of 13.96 m and a range of 2.33 m. Also, the path and row for all the SLC datasets are 136 and 486, respectively. Details of these Sentinel-1A SLC SAR image pairs are presented in Annexure 1 (Supplementary Material). In addition, in this study, vertical LOS deformation rates were calculated only using a 39° satellite incidence angle.
Hence, using these 118 SAR images, two consecutive images were taken to make the pair. Thus, 117 interferometric SAR pairs were formed between 10 October 2014 and 30 December 2020. These pairs were processed and analysed in SARproZ (version 2021.0) InSAR processing software (Perissin et al. Citation2011). ArcGIS 10.6 was used to prepare the final multi-temporal deformation maps. Additionally, Landsat-8 and Planet satellite images were also used in this work. Landsat-8 datasets at 30 m spatial resolution are used to calculate the Normalized Difference Vegetation Index (NDVI) for masking the vegetation areas from the Landslide analysis. Because Sentinel-1 A C-band SAR datasets are highly affected by temporal decorrelation effects (Wasowski and Bovenga Citation2014; Jung J et al. Citation2016; Niraj et al. Citation2021). So, to remove such areas we did vegetation masking with NDVI using Landsat-8 datasets. The findings of this work were verified using Planet satellite images at 3–4 m spatial resolution for specific dates. Furthermore, this study validates the advanced DInSAR model outcomes using various accuracy assessment parameters: AUC-ROC curve, recall, accuracy, precision, and F-score in the Python 3.11.3 environment.
The location of landslide points was initially taken from GSI (Geological Survey of India) and then cross-checked using the Planet satellite and Google Earth images. Many of these landslides that occurred in the vicinity of the Kotrupi landslide were checked in the field and their locations were verified. We have selected 11 landslide points that have occurred in the vicinity of the Kotrupi landslide for further deformation studies using time series D-InSAR analysis. The details of these 11 landslides are given in and are shown in . Additionally, the Kotrupi Landslide (LS-6) and the other primary five landslide locations, together with their corresponding geographic latitudes and longitudes, are shown in . The pre and post-date occurrence of these 11 landslides were obtained from Planet satellite and Google Earth images.
Table 1. Updated GSI landslide points updated from Google Earth and field visits.
4. Methodology
In this study, we estimated the cumulative landslide deformation rates and used that to obtain the tentative date of occurrence of a few landslides from 15 October 2015 to 06 December 2020 and verified with the high spatial resolution planet satellite images. The AUC-ROC curve, recall, accuracy, precision, and F-score were estimated to evaluate the outcomes of the advanced DInSAR method.
4.1. Estimation of time-series interferometric coherence and landslide deformation rates
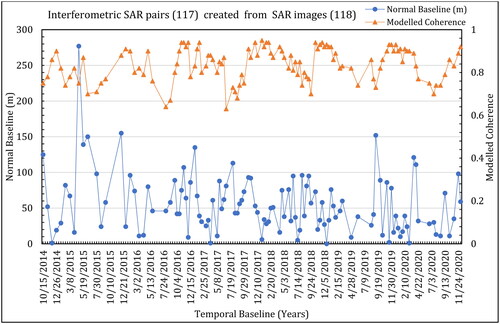
We created an STBG geometry to estimate time-series coherence and landslide deformation rates with standard DInSAR methods using 118 SAR images (). In this study, we have designed our STBG network so that the modelled coherence we acquire will be greater than 0.7, and the temporal baseline between the succeeding time-series SAR pairs will be as small as possible (Annexure 1 in Supplementary Material, ). Moreover, we mainly used the STBG geometry to lessen the temporal phase decorrelation effects in the time-series SAR-generated interferograms, which is one of the limitations of the traditional DInSAR technique. These pairs of SAR images are linked to topography and ground surface movement, which are then used to produce ground deformation values. The selected DInSAR algorithm with STBG transforms phase differences between two complex conjugate SAR images. The difference in phases between the reference and secondary Sentinel-1A SAR images is a function of the ranges between the object point and the sensors. Also, a variety of information about the ground surface and the atmosphere, such as curvature of the Earth, topography, surface deformation, atmospheric delays, and phase noise is included in the interferometric phase (Ferretti et al. Citation2007; Hu et al. Citation2010; Fárová et al. Citation2019; Niraj et al. Citation2021; Kim et al. Citation2023):
(1)
(1)
Figure 3. The variation of normal baseline and coherence with respect to various dates (temporal baseline) for the short temporal baseline graph (STBG) method where 117 SAR pairs are used in this work.
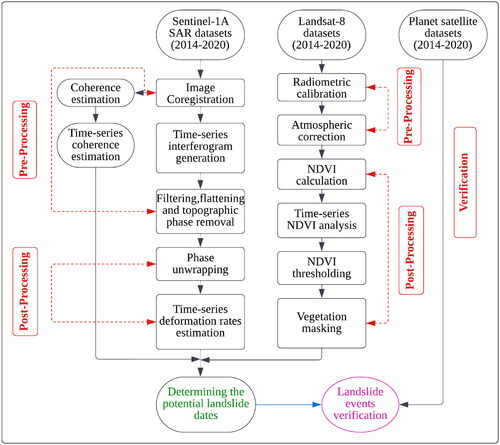
However, the phase components associated with the spatial baseline were eliminated from the resulting interferogram using an existing SRTM (Shuttle RADAR topography mission) DEM and precise orbital data. Other errors such as Topographic errors, Filtering and Flattening errors, and noise errors also need to be minimized. The stages involved in the processing and geocoding of Sentinel-1A repeat-pass interferometry are shown in the flowchart (). A sequence of pairs of complex-valued Sentinel-1A SAR images containing intensity and phases, as well as orbit data specifying the sensor positions and flight directions, are used in this study. Co-registration, the initial stage of DInSAR processing for estimating the deformation values, is carried out using precise orbital information and amplitude cross-correlation. In this study, we used both methods to correct the orbital changes in the images (Niraj et al. Citation2021). When precise orbital data is known then the orbital information could be valuable. In the amplitude cross-correlation method, the reference and secondary images are cross-correlated to identify the relative shifts in the image pair. This ensures that each ground target is attributed to the same (range, azimuth) pixel in both the reference and secondary image. Therefore, the interferogram and coherence are efficiently calculated once the pairs of SAR pictures have been co-registered. The pixel-to-pixel computation of the cross-product of the complex conjugate of two co-registered SLC images is required for the generation of the interferogram, (Rott and Nagler Citation2006; Hu et al. Citation2010) as shown below:
(2)
(2)
Figure 4. The research procedure includes evaluating 118 Sentinel-1 SLC images and determining multi-temporal coherence and landslide deformation values inside the Kotrupi landslide run-off area shown in Flowchart 1. The flowchart also shows how to calculate NDVI and vegetation masking using deformation maps, as well as how to verify the deformation results with time series Planet satellite images.
Where S1 is the reference SLC image and S2* is the conjugate complex of the secondary co-registered SLC image. Their product i.e. Ifg results in the complex interferogram. The interferogram is calculated in the same (range, azimuth) pixel as that of the reference image, and its phase is the difference between the reference and secondary image. Thus, the resultant interferogram shows fringes with a phase component resulting from variations in the slant range distance as well as a component from variations in the incidence angle, perpendicular baseline, and Earth curvature. Moreover, interferometric fringes must be flat to obtain topographic height, as phase discrepancies are primarily responsible for these variations. Interferometric coherence, which is produced from the quantity of complex SAR conjugates images, can be used to evaluate the generated interferogram quality (Blanco-Sánchez et al. Citation2008). Therefore, the coherence reveals how precise the phase data is i.e. fringe visibility (Blanco-Sánchez et al. Citation2008). Higher coherence values generally indicate built-up areas, barren areas, and vegetation-devoid areas. These are observed to be inversely correlated to NDVI, making them complementary data sources for interpreting landslide deformation patterns. The associated interferometric coherence values fluctuate dynamically over time as a result of numerous factors affecting the physical characteristics of the ground surface. The roles of the vegetation and its temporal fluctuation among these elements are yet unknown at this point. So in this study, the optimal coherence threshold (>0.7) is chosen, for the time-series landslide deformation investigation in densely vegetated areas. On the other hand, the temporal baseline and the spatial baseline also have an impact on coherence. Therefore, in this study, multi-look filtering and the modified Goldstein filter method were used to reduce the effects of speckles in the generated interferograms (Lanari et al. Citation2004; Jung HS et al. Citation2009). Furthermore, the residual noise phase information is obtained to calculate the alpha parameter of the modified Goldstein filter (Li et al. Citation2008; Niraj et al. Citation2021). The alpha parameter (α = 0.5) is considered the best optimal value for a 15 × 15 adaptive window size filter (Li et al. Citation2008; Niraj et al. Citation2021). Different phase filtering approaches were used in this study to lessen the effects of the phase decorrelation, which maintains the interferogram with minimal residues and increases the accuracy of phase unwrapping for estimating temporal deformation rates in hilly and dense vegetated terrain. The DInSAR phase contains values ranging from 0 to 2π, indicating that the phase is wrapped within this range. The interferometric phase varies in cycles of modulo-2π values, so to estimate the topographical variation, an unwrapping procedure is carried out. Interferometric phase unwrapping is the process of converting phase to displacement after all of the various phase contributions have been adjusted (Niraj et al. Citation2021). Therefore, the interferometric phase is converted to surface displacement once the phase contribution brought on by a flat Earth has been accurately calculated and adjusted. Finally, a time-series landslide deformation map is prepared using Sarproz software, and range-Doppler terrain correction is applied.
4.2. Estimation of time-series NDVI
The time-series NDVI is computed using LANDSAT-8 images to identify the time-series landslide scars and mask the vegetation regions from the generated multi-temporal landslide deformation maps. However, Sentinel-1A SAR datasets struggle with temporal and geographic decorrelation due to their C-band wavelength, although landslides are less frequent in vegetated areas. Thus, before calculating time-series NDVI, Landsat 8 images are radiometrically and atmospherically calibrated. Radiometric and atmospheric calibration is the process of conversion of digital numbers (DN) images to radiance images and estimation of surface reflectance images (Chavez Citation1996; Niraj et al. Citation2022). Therefore, in this study, the surface reflectance is calculated using the FLAASH (Fast Line-of-Sight Atmospheric Analysis of Spectral Hypercubes) radiative atmospheric transfer model (Niraj et al. Citation2022). As a result, the ratio of the difference in reflectance in the Near Infrared (NIR) and Red bands to the sum of these two bands is used to calculate the time-series NDVI using an atmospherically corrected Landsat 8 image (Crippen Citation1990; Niraj et al. Citation2022).
A threshold of >0.4 NDVI value is used to mask vegetative regions as these regions represent dense vegetation. After removing the vegetated areas, the temporal effect of the resulting landslide deformation was compared with the Planet satellite images to verify the results for those specific dates. Moreover, differences in the deformation between landslide and non-landslide points were observed. As indicated in Annexure 2 in Supplementary Material, we selected 15 stable points (non-landslide points) mainly from the top of the buildings and extracted the deformation values from the multi-temporal DInSAR analysis. Thus, the non-landslide locations were primarily on roads and houses. Additionally, the average value of the deformation obtained for landslide points was compared with the values of the cumulative landslide deformation results estimated as previously described.
4.3. Accuracy assessment
The advanced DInSAR technique was used to create time-series landslide deformation maps in this study, which were then averaged, and normalized between 0–1. We considered landslide points as having a value of ‘1’ and non-landslide points as having a value of ‘0’. The effectiveness of the advanced DInSAR technique in this study was evaluated using several validation methods: ROC-AUC curve, precision, recall, accuracy, and F-Score (Niraj et al. Citation2023; Singh A, Ashuli, et al. Citation2023; Singh A, Chhetri, et al. Citation2023). It shows the relationship between true positive rate (TPR) (sensitivity) and false positive rate (FPR) (specificity). The following mathematical equations are used (Fawcett Citation2006; Constantin et al. Citation2011; Niraj et al. Citation2023; Singh A, Ashuli, et al. Citation2023; Singh A, Chhetri, et al. Citation2023) in a Python environment to estimate these values
(3)
(3)
(4)
(4)
(5)
(5)
(6)
(6)
(7)
(7)
(8)
(8)
where TP is true positive, TN is true negative, FP is false positive, and FN is false negative.
5. Result
5.1. Time-series analysis of historical landslide deformation
The main objective of this study is to determine the probable dates when the landslide might have occurred. Hence for that, we obtained 117 deformation maps from SLC images from 2017 to 2020, based on the methods explained previously. We used the updated GSI landslide locations () to extract the deformation values at these landslide locations, and then for each location, the cumulative deformation was calculated. We took 11 landslide locations that have occurred in the past, adjacent to the Kotrupi landslide area, and whose tentative dates of occurrence are to be obtained from the time series deformation values obtained using advanced D-InSAR analysis. The cumulative deformation analysis of these 11 landslide locations shows that there is a similarity in the behaviour of the deformation pattern of landslides. For all these landslide locations, the cumulative deformation value shows a negative value in all produced multi-temporal landslide deformation maps i.e. cumulative deformation value is very low up to −190 mm in certain cases ( and ). However, this value does not represent the exact amount of deformation that happened at these sites but is a general trend. Thus, this study area may be experiencing a slow, continuous landslide motion, according to the time-series deformation study from 2017 to 2020.
Figure 5. The time-series landslide deformation analysis of six updated landslide GSI points is shown in .
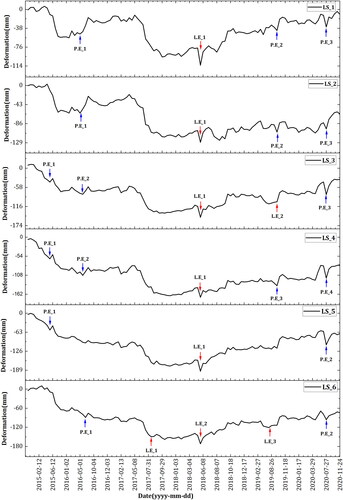
Figure 6. The multi-temporal landslide deformation analysis of five updated landslide GSI points is shown in .
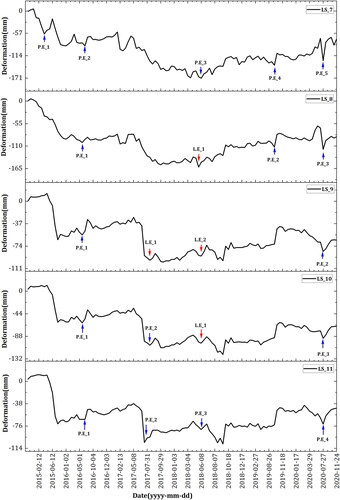
These landslide events including small and big landslides were tabulated from reports, local news, and earlier field visits in this region. When dates of these events were marked on this time series deformation map as reported/known landslide event (LE) and probable event (PE) in and , some relation in the deformation is seen. The LE are marked as red arrows while PE are marked as black arrows in and . At most of the places where we find ‘V’ shaped kinks, there was some deformation. These kinks show a sudden drop in the land deformation (−ve value) just before the event. After the event when the same pixel is observed, there is an uplift in the value (+ve value) which creates the ‘V’ shape pattern.
We can see from for landslide point (LS_1) that a landslide event (L.E_1) that happened on 27 May 2018 had a deformation value of −112.56 mm, whereas, after landslides on 02 July 2018, 07 August 2018, and 12 September 2018 had deformation values of −73.30 mm, −85.93 mm, and 65.25 mm, respectively. Similarly, for LS_6 i.e. Kotrupi Landslide that occurred on 13 August 2017, the deformation value was observed to be −125.46 mm on 12 August 2017 before the landslide but increased to −162.68 mm on 17 September 2017 forming a ‘V’ shape pattern (). It was also noted that the deformation value slowly increased after the Kotrupi landslide, reaching −151.34 mm on 23 October 2017, which shows that the deformation values increased or decreased slowly after the landslide. Similar patterns were observed for all the landslides where a landside event (LE) was reported. Based on this we have marked some PE events that were verified using the high-resolution Planet data as discussed later. Once a landslide happens, the deformation values do not abruptly or suddenly change for all landslide locations ( and ) as many of these locations are undergoing deformation and landslides move slowly. As a result, the deformation values did not significantly rise or decrease following the landslide.
Hence, we found a ‘V’ shaped kink at different times from the time series deformation pattern i.e. around 12 June 2015; 05 August 2016; 27 May 2018; 17 September 2017; and 15 July 2020, as shown in , while around 19 May 2015; 25 May 2016; 17 September 2017; 08 June 2018; 15 July 2020 as shown in . On further analysis, we observed that most of the landslides in this region happen during monsoon time which starts from mid-June and goes up to September. Most of these kinks are also seen during monsoon time and not during other times, indicating that certain sliding must have happened during this period. Interestingly, this ‘V’ shaped kink is mostly seen in smaller and medium-sized landslides and not in bigger landslides like Kotrupi as observed at LE_1 at LS_6 (). In the case of large landslides, an event of this magnitude occurs after a prolonged period of slow continuous landslide deformation rate. Also, after a substantial large-scale event for the season, gradual, less significant deformation might not allow for the formation of a V-shaped deformation pattern. Furthermore, during the monsoon season, we saw slow surface movement in our study, which may have been caused by soil crawling up the steep slope caused by weak geological components.
5.2. Comparison of multi-temporal landslide deformation with non-landslide points
The average cumulative landslide deformation rates for non-landslide points are shown in the green colour line while the red colour line represents the average cumulative deformation rates for landslide points as shown in . However, in this study, the relationship between satellite incidence angle and topography is not taken into consideration for comparing the average cumulative deformation rates at non-landslide points with the average cumulative deformation rates at landslide points. The resulting deformation value for non-landslide points remained above the cumulative deformation for landslide points. Due to the complex relationship between the SAR incidence angle and topography, surface roughness has a higher influence in areas with greater incidence angles, whereas changes in soil humidity have a larger influence in areas with small incidence angles (Verhoest et al. Citation2008; Álvarez-Mozos et al. Citation2009). Additionally, when a landslide occurs, it shifts the surface material and clears away vegetation, which significantly changes the surrounding topography and also changes the satellite incidence angle, which in turn alters the surface dielectric characteristics and surface roughness (Mondini Citation2017). Due to this, landslides can cause a SAR amplitude to rise or fall. In reality, different SAR pixel deformation rates may change during a single landslide event (Mondini Citation2017).
Figure 7. The average time series analysis between landslide and non-landslide points is depicted in the diagram.
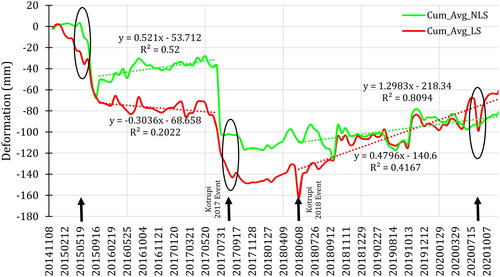
The slope of average deformation rates for non-landslide points is +0.52 while that for landslide points is −0.30 from 2015 to 2017 (). This indicates that the average value of deformation for landslide points is decreasing while that for non-landslide points is increasing. However, from 2018 to 2020, there is an increasing trend in the cumulative for both the landslide and non-landslide points. The slope for the non-landslide point is +0.48 which is around the same as that during 2015–2017. Thus, the changes happening in the non-landslide points are comparable. But during 2015–2017, the slope of cumulative deformation for landslide points is around +1.30 which is significantly steeper. One reason could be that after the massive Kotrupi landslide, the deformation is not occurring at such an enhanced rate, rather most of the landslide points (11 as per modified GSI) are becoming stable. The mitigation efforts carried out by local and state governments to keep the road clear of debris; construction of retaining walls; and taking adequate measures to mitigate the risks are showing the + ve deformation values in the SLC pairs. Thus, the average cumulative deformation is becoming positive. This overall positive slope needs to be addressed in-depth and a more detailed analysis is required to ascertain these changes.
However, in the time-series landslide deformation graph (), there is a sudden drop in the deformation values for both landslide and non-landslide points between July 2015 and July 2017. Moreover, for non-landslide points on the graph as well, there is a distinct sinusoidal sign with a period that is almost exactly two years. Since, the non-landslide points in this study relate to hard rocks, electric poles, bridge centres, road intersections, etc. Thus, the causes of the time-series landslide deformation patterns of those non-Landslide locations have both been anticipated: (a) the thermal expansion and contraction of a metallic or concrete top, (b) the seasonal bulge of clayey soil beneath the building foundations (Crosetto et al. Citation2011; Normand and Heggy Citation2015). Furthermore, due to influences of the C band wavelength and phase decorrelation during the seven-year study period, the quality of Sentinel-1A SAR datasets changes dramatically, which could be related to these variations Therefore, advanced DInSAR time-series deformation analysis in steep and hilly areas, like Joginder Nagar Municipality, is frequently influenced by noise brought on SAR images by rainfall, vegetation, and atmospheric scattering. We observe that between July 2015 and July 2017, there was a significant increase in SAR phase noise in the time series deformation rates for both landslide and non-landslide areas. This is probably due to vegetation progress and movements in the surface materials during the monsoon (June–September). As a result, mostly in this study, this sudden drop in non-landslide points seems to be happening during monsoon time. When we cross-checked these dates, we found that during this period, there was thick cloud cover in this study area. We obtained the cloud cover data from MODIS and we found that nearly 80% of the study area during this period was under a thick blanket of cloud cover (). Furthermore, during the monsoon season, we saw slow surface movement in our study, which may have been caused by soil crawling up the steep slope caused by weak geological components. The majority of the geological elements present in the Joginder Nagar region include dolomites, shale, sandstones, purple clay, and mudstones, which are found in a thrust contact between the Siwaliks and the Shali group of rocks. As a result, these components are vulnerable to thrust displacement because they are regarded as weak. However, microwaves do penetrate through the clouds, but the presence of water droplets in thick clouds attenuates the signal (Carey et al. Citation2000; Molini et al. Citation2008; Bechini et al. Citation2013). Also, the change in the dielectric properties of the atmosphere and thick water-laden clouds hinders the proper receiving of the signal at the sensor (Molini et al. Citation2008; Bechini et al. Citation2013). This is also one of the reasons why we get disturbances in mobile connectivity, TV channels, etc., (which also work in the microwave region of the EM spectrum), during monsoon time (Singh D et al. Citation2008; Zubair et al. Citation2011).
Table 2. Temporal baseline, perpendicular baseline modelled coherence and also cloud cover percentage taken from MODIS for those times when a sudden dip appears in non-landslide points.
Nevertheless, while comparing these two graphs ( and ), we could see a certain time range when there is a clear ‘V’ shaped kink in the landslide line which is not seen for the non-landslide points. Some of these kinks are shown by the black arrow () where we expect the sliding to occur and at the same time, there is no kink in non-landslide points as indicated by the black ellipses. We can see the perfect ‘V’ shaped kinks around 19 May 2015; 17 September 2017; 08 June 2018; and 15 July 2020 in the average cumulative graph for landslide points. As a result, we can speculate that certain landslides must have occurred during that time. The kink for 17 September 2017 is self-evident for the Kotrupi landslide event and the kink around 08 June 2018 is evidence of another landslide in the Kotrupi region when the road was expanded in 2018. Thus, with confidence, we can state that the presence of such kinks in the cumulative deformation graph shows the presence of certain landslide activity.
5.3. Verification of landslide events
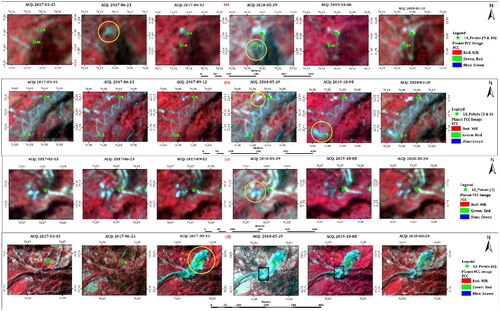
We mainly observed ‘V’ shaped kinks in the cumulative deformation map around June 2015; June & August 2016; June & September 2017; June 2018; September 2019; and July 2020 ( and ). Those kinks were for 11 landslide locations, so for verification purposes, we took the high-resolution planet satellite image during the same period. During the certain time when we could not get the cloud-free image, we took the best available image of the next date. Thus, we used planet images of mid-March 2017; end of June 2017; mid-September 2017; end of May 2018; mid-October 2019, and March 2020. The planet image of March 2017 depicted only the presence of some landslides that were taken for deformation graph calculation. Not much activity is seen during this time. However, at the end of the June 2017 image, a landslide near LS_9 is seen which was not present earlier (). Furthermore, near LS_10, another landslide seemed to have occurred which is visible in the planet image of May 2018 which was not present earlier (). This matches very well with the ‘V’ shaped kinks observed around 23 June 2017 and 08 June 2018 as stated earlier. A similar existence of newer landslides is visible around LS_3 and LS_4 during May 2018 and October 2019 in the planet images (). These match well with the kinks observed around 08 June 2018 and 15 September 2019 in and . In the planet image of 29 May 2018, LS_5 is observed sliding as shown in . The Kotrupi landslide, which showed tremendous movement on 12 September 2017 after a catastrophic landslide in Kotrupi on 13 August 2017, is LS_6. Similarly, some construction in highway extent was seen as a result of the expansion of NH-154 on the image of 30 July 2018, as represented by the black rectangular box in . The road near Kotrupi in the earlier images was at a different alignment, but after the event, the alignment was changed and was constructed a little curvilinear in 2018 as seen in . After that, another slide happened that washed away the road and so later the road was constructed in its original alignment. Both these events i.e. Kotrupi sliding and the sliding due to road expansion are also seen as kinks in the deformation graph. Thus, with the help of high temporal, finer spatial resolution optical satellite data, we can successfully verify our DInSAR results and give confidence to our work.
Figure 8. The use of multi-temporal planet surface reflectance satellite imagery to verify updated GSI landslide points.
5.4. Landslide deformation maps
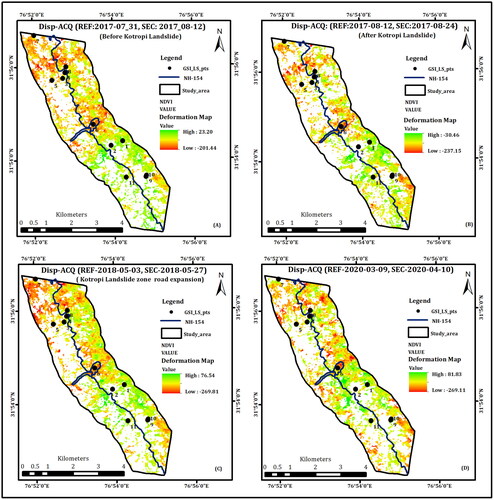
Finally, we prepared the landslide deformation map of the study area for different periods. The before and after deformation patterns of catastrophic landslide events (LS_6), i.e. Kotrupi Landslide event are shown in . The probable dates of occurrences are: 21 July 2017 & 12 August 2017;12 August 2017 & 24 August 2017; 03 May 2018 & 27 May 2018; and 09 March 2020 & 10 April 2020. The deformation maps are for four different dates: before the Kotrupi landslide, in July 2017 (), after the Kotrupi landslide, in August 2017 (), following the road expansion, in August 2018 () and another deformation rate is the most recent one, in April 2020 (). These deformation maps are vegetation-masked and show the tentative areas that are undergoing deformation in this study area. These deformation maps could be used as a layer for the preparation of landslide hazard maps in future studies.
Figure 9. A multi-temporal landslide deformation map after vegetation masking. The deformation map (REF: 31 July 2017, SEC: 12 August 2017) before the Kotrupi landslide is presented in section (a). The deformation map (REF: 12 August 2017, SEC: 24 August 2017) following the Kotrupi landslide is displayed in Section (B). Similarly, the deformation map (REF: 03 May 2018, SEC: 27 May 2018) after a road expansion is presented in Section (C). The landslide deformation map between (REF: 09 March 2020, SEC: 10 April 2020) is shown in Section (D).
5.5. Validation of results
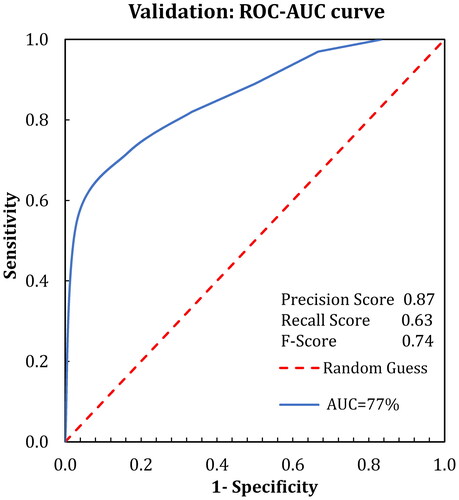
The advanced DInSAR method performance was initially accessed in this study using the ROC-AUC curve and confusion matrix. In this study, the values of landslide and non-landslide points are extracted from an averaged normalized deformation map for generating the ROC-AUC curve. The ROC-AUC curve provides a quick and insightful graphical representation for evaluating the performance of the binary classification model; the curve with the largest AUC represents the best result (Fentahun et al. Citation2021; Shirani and Pasandi Citation2021). The estimation score for the ROC-AUC curve ranges from 0.5 to 1.0 and is as follows: 0.9–1 (excellent), 0.8–0.9 (very good), 0.7–0.8 (good), 0.6–0.7 (moderate), and 0.5–0.6 (poor) (Fawcett Citation2006; Shirani and Pasandi Citation2021; Niraj et al. Citation2023). Additionally, an AUC value of around 0.5 signifies that the validation was made at random (Fentahun et al. Citation2021). We obtained an AUC accuracy of 0.77, the precision of 0.87, which is quite good, while the recall value was 0.63 and the F-score was 0.74 as shown in , which indicates good validation results for our study. The Sibling-Based Coherence approach, Absolute Coherence, and NASA's Advanced Rapid Imaging and Analysis (ARIA) method are used for landslide deformation studies in Nepal and the AUC accuracy ranges between 0.56 and 0.77 (Burrows et al. Citation2019). An accuracy of 0.85 was observed for calculating landslide deformation maps using the DInSAR method (Fentahun et al. Citation2021). The performance of the time-series INSAR landslide deformation rates using a convolution neural network (CNN) model was assessed using precision, recall, and F-score (Mirmazloumi et al. Citation2022), where they obtained the F-Score (0.84), recall (0.76), and precision score (0.95) indicating the good ability of the model to measure ground deformation (Mirmazloumi et al. Citation2022).
Figure 10. The ROC-AUC curve on 0.77 obtained in this study along with the precision, recall and F score values estimated on the averaged normalized landslide deformation map.
6. Discussion
Advanced or multi-temporal DInSAR are more effective approaches for surface deformation studies (Ma et al. Citation2016; Mantovani et al. Citation2019). Still, it is difficult to apply these methods for landslide studies in the wooded and mountainous regions, even though it has been shown that they are ideal for the investigation of the vast majority of ground surface dynamic events (Antonielli et al. Citation2019; Mantovani et al. Citation2019). Landslide movement happens very fast, decorrelates the radar signal, and many times the obtained interferometric phase becomes worthless (Mantovani et al. Citation2019). This is one of the major limiting constraints associated with the rate of displacement of the unstable slopes (Colesanti and Wasowski Citation2006; Mantovani et al. Citation2019). However, if the deformation is happening at a slower rate (a few centimetres per year) or we are interested in finding the areas undergoing deformation due to sliding, then this DInSAR method could be very useful.
This study demonstrates how the Sentinel-1 SLC datasets C-band data collected since 2014 and properly designed interferometric approaches can be used to identify the time when a land sliding event must have occurred. Hence, in this study, we used advanced DInSAR techniques to obtain deformation values in parts of the Joginder Nagar area falling in the northwest Himalayas that witnessed many landslides. One of the major landslides in this area is the Kotrupi landslide that happened in August 2017 that killed many people. Niraj et al. (Citation2021) reported that the coherence value of the Kotrupi landslide was 0.019 before the event and 0.857 after the Kotrupi landslide event. We considered the NDVI threshold of 0.40 for excluding all the vegetated areas to obtain the masked deformation maps.
After masking the deformation map with the best NDVI value, we get deformation values ranging from −269.81 mm to 76.54 mm after the Kotrupi landslide road expansion (REF: 03 May 2018, SEC: 27 May 2018). Negative values signify displacement away from the LOS (Line of sight), while positive values signify deformation in the direction of the LOS. In the time series DInSAR approach for landslide identification in mountainous areas of the Western Ghats, India, LOS displacement is found to vary from −6.11493 to 2.83838 mm (Devaraj et al. Citation2022). In a study carried out by Chatterjee et al. (Citation2015) due to decorrelation noise in the fringe centres, especially in the case of large temporal baselines, rapid motions can occasionally appear aberrant in conventional DInSAR. If an advanced DInSAR data stack had been used for a subsidence study using Sentinel 1 A scenes, this might have been largely prevented. Furthermore, there is a big contrast between landslide movements and mining-induced subsidence (Chatterjee et al. Citation2015). Using Sentinel 1 A ascending mode, surface deformation values at the Iran-Iraq border were observed to range from 183.471 to 851.823 mm (Suresh and Yarrakula Citation2020).
7. Limitation
This work is carried out in a densely forested area, hence, there is a high likelihood of decorrelation (Jung J et al. Citation2016). Insufficient coherence is the main restriction, especially when employing the C band (e.g. free Sentinel-1 data) and X band (e.g. TerraSAR-X/TanDEM-X) SAR data (Fárová et al. Citation2019). This can be minimized by using SAR stacks with a minimal temporal baseline i.e. STBG, but this is not always achievable. Mechanical changes to the surface, such as field ploughing, crop harvest, forest fires, and structural changes caused by anthropogenic activities, earthquakes, and landslides, affect surface scattering and rapid coherence loss (Wegmuller and Werner Citation1995).
Another aspect is the hilly terrain, where topographic phase error needs to be addressed (Madsen et al. Citation1993). The height-to-phase factor, elevation error, normal baseline relative to the nth image concerning the reference image, local incidence angle, carrier wavelength, and the zero-doppler distance between the target and the nth orbit acquisition make up the residual topographic phase (Ho Tong Minh et al. Citation2020). It is recommended to use a large number of SLC image pairs to work in a heavily vegetated hilly terrain, however, the path and frame of the selected area of interest (AOI) may not match well with the temporal baseline. When only a small section of the scene is coherent, phase unwrapping is useless (Chen and Zebker Citation2002). To obtain appropriate coherence, we need to construct interferograms over shorter periods and then integrate them into long-term data using some type of time-series analysis. If the temporal and spatial baselines are small, SAR interferometric performance will be effective.
In the case of non-coherent occurrences (e.g. rapid landslides), the changes are not detectable in DInSAR analysis due to temporal phase aliasing (velocity of ambiguity) for landslide monitoring (Solari et al. Citation2020). When the displacement of the examined object surpasses the threshold of 𝝀/4 between two subsequent satellite acquisitions and/or two neighbouring pixels, phase aliasing occurs. However, the inherent limits of this monitoring technique in landslide research must always be carefully considered and discussed to avoid over-generalization and over-estimation (Fárová et al. Citation2019; Solari et al. Citation2020). As previously stated, using D-InSAR techniques in heavily vegetated hilly areas is still challenging (Madsen et al. Citation1993; Jung J et al. Citation2016).
8. Conclusion
SAR remote sensing techniques have been used in mapping and monitoring landslide activities in recent years due to their extensive coverage, constant data availability even in the monsoon period, and high spatial resolution. This study examines the temporal phenomenon of landslide deformation using Sentinel-1A SAR datasets from the C-band to obtain the tentative date of occurrence of landslide events. As the study is conducted in densely forested mountain locations, the effect of the decorrelated phase, generated using C-band images, was minimized by using NDVI-based vegetation masking. Additionally, the time series D-InSAR method was used in this study to map time-series surface deformations induced by landslides around the Kotrupi area. The time-series deformation analysis from 2017 to 2020 suggests that the Kotrupi region may be experiencing a slow, continuous landslide motion. The time-series cumulative displacement values showed the presence of ‘V’ shaped kinks in the graphs that happen due to changes in the deformation caused by sliding. Such kinks were observed around 12 June 2015, 25 May 2016, 05 August 2016, 23 June 2017, 15 September 2019, 27 May 2018, 08 June 2018, and 15 July 2020, that are predominantly the monsoon season. Thus, during monsoon, the slow movement of the slides was captured in the SAR results These periods were further verified with the presence of new landslides as seen on high-resolution Planet satellite images. For the Kotrupi Landslide that occurred on 13 August 2017, the deformation value was observed to be −125.46 mm on 12 August 2017 before the landslide but increased to −162.68 mm on 17 September 2017 forming a ‘V’ shape pattern that is also seen in case of other landslides. Thus this ‘V’ shaped indicator could be used as a proxy to identify the probable period of occurrence of a landslide. Finally, in this study, various statistical accuracy assessment parameters: AUC-ROC, recall, accuracy, precision, and F-score were successively applied to test the effectiveness of the advanced DInSAR method for estimating time-series landslide deformation rates in hilly and vegetated areas.
Supplemental Material
Download Zip (45.2 KB)Acknowledgements
IIT Mandi in Kamand, Himachal Pradesh, India, provides the authors with the chance and technological facilities to undertake this study. We would also like to thank the USGS, the Land Processes Distributed Active Archive Centre (LP DAAC), and Planet Images and Archive for permitting us to use the Landsat and Planet Satellite surface reflectance datasets in this study. We would also like to express our gratitude to the European Space Agency (ESA) for allowing us to conduct this analysis using the SLC Sentinel-1 data repository. We would also like to thank the SARproZ team for providing us with tools for processing Sentinel-1 data sets.
Disclosure statement
No potential conflict of interest was reported by the author(s).
Data availability statement
The data used in this work is freely available and anyone can use it by downloading it from sources. Further data may be shared upon reasonable request.
References
- Álvarez-Mozos J, Verhoest NE, Larrañaga A, Casalí J, González-Audícana M. 2009. Influence of surface roughness spatial variability and temporal dynamics on the retrieval of soil moisture from SAR observations. Sensors. 9(1):463–489. doi: 10.3390/s90100463.
- Antonielli, B., Mazzanti, P., Rocca, A., Bozzano, F., & Dei Cas, L. (2019). A-DInSAR performance for updating landslide inventory in mountain areas: an example from Lombardy region (Italy). Geosciences, 9(9), 364. doi: 10.3390/geosciences9090364.
- Aslan G, Foumelis M, Raucoules D, De Michele M, Bernardie S, Cakir Z. 2020. Landslide mapping and monitoring using persistent scatterer interferometry (PSI) technique in the French Alps. Remote Sens. 12(8):1305. doi: 10.3390/rs12081305.
- Bechini R, Baldini L, Chandrasekar V. 2013. Polarimetric radar observations in the ice region of precipitating clouds at C-band and X-band radar frequencies. J Appl Meteorol Climatol. 52(5):1147–1169. doi: 10.1175/JAMC-D-12-055.1.
- Bhasin R, Aslan G, Dehls J. 2023. Ground investigations and detection and monitoring of landslides using SAR interferometry in Gangtok, Sikkim Himalaya. GeoHazards. 4(1):25–39. doi: 10.3390/geohazards4010003.
- Blanco-Sánchez P, Mallorquí JJ, Duque S, Monells D. 2008. The coherent pixels technique (CPT): an advanced DInSAR technique for nonlinear deformation monitoring. Pure Appl Geophys. 165(6):1167–1193. doi: 10.1007/s00024-008-0352-6.
- Burrows K, Walters RJ, Milledge D, Spaans K, Densmore AL. 2019. A new method for large-scale landslide classification from satellite radar. Remote Sens. 11(3):237. doi: 10.3390/rs11030237.
- Carey LD, Rutledge SA, Ahijevych DA, Keenan TD. 2000. Correcting propagation effects in C-band polarimetric radar observations of tropical convection using differential propagation phase. J Appl Meteor. 39(9):1405–1433. doi: 10.1175/1520-0450(2000)039<1405:CPEICB>2.0.CO;2.
- Chatterjee RS, Thapa S, Singh KB, Varunakumar G, Raju EVR. 2015. Detecting, mapping and monitoring of land subsidence in Jharia Coalfield, Jharkhand, India by spaceborne differential interferometric SAR, GPS and precision levelling techniques. J Earth Syst Sci. 124(6):1359–1376. doi: 10.1007/s12040-015-0606-5.
- Chavez PS. 1996. Image-based atmospheric corrections-revisited and improved. Photogramm Eng Remote Sens. 62(9):1025–1035.
- Chen CW, Zebker HA. 2002. Phase unwrapping for large SAR interferograms: statistical segmentation and generalized network models. IEEE Trans Geosci Remote Sensing. 40(8):1709–1719. doi: 10.1109/TGRS.2002.802453.
- Choubey VM, Mukherjee PK, Bajwa BS, Walia V. 2007. Geological and tectonic influence on water–soil–radon relationship in Mandi–Manali area, Himachal Himalaya. Environ Geol. 52(6):1163–1171. doi: 10.1007/s00254-006-0553-1.
- Colesanti C, Wasowski J. 2006. Investigating landslides with space-borne Synthetic Aperture Radar (SAR) interferometry. Eng Geol. 88(3-4):173–199. doi: 10.1016/j.enggeo.2006.09.013.
- Constantin M, Bednarik M, Jurchescu MC, Vlaicu M. 2011. Landslide susceptibility assessment using the bivariate statistical analysis and the index of entropy in the Sibiciu Basin (Romania). Environ Earth Sci. 63(2):397–406. doi: 10.1007/s12665-010-0724-y.
- Crippen RE. 1990. Calculating the vegetation index faster. Remote Sens Environ. 34(1):71–73. doi: 10.1016/0034-4257(90)90085-Z.
- Crosetto M, Monserrat O, Cuevas M, Crippa B. 2011. Spaceborne differential SAR interferometry: data analysis tools for deformation measurement. Remote Sens. 3(2):305–318. doi: 10.3390/rs3020305.
- Crosetto M, Monserrat O, Luzi G, Cuevas M, Devanthéry N. 2015. Deformation monitoring using ground-based SAR data. In: Lollino G, Manconi A, Guzzetti F, Culshaw M, Bobrowsky P, Luino F, editors. Engineering geology for society and territory-volume 5. Cham: Springer; p. 137–140. doi: 10.1007/978-3-319-09048-1_27.
- Devaraj S, Yarrakula K, Martha TR, Murugesan GP, Vaka DS, Surampudi S, Wadhwa A, Loganathan P, Budamala V. 2022. Time series SAR interferometry approach for landslide identification in mountainous areas of Western Ghats, India. J Earth Syst Sci. 131(2):1–17. doi: 10.1007/s12040-022-01876-3.
- Doin MP, Lasserre C, Peltzer G, Cavalié O, Doubre C. 2009. Corrections of stratified tropospheric delays in SAR interferometry: validation with global atmospheric models. J Appl Geophys. 69(1):35–50. doi: 10.1016/j.jappgeo.2009.03.010.
- Fárová K, Jelének J, Kopačková-Strnadová V, Kycl P. 2019. Comparing DInSAR and PSI techniques employed to Sentinel-1 data to monitor highway stability: a case study of a massive Dobkovičky landslide, Czech Republic. Remote Sens. 11(22):2670. doi: 10.3390/rs11222670.
- Fawcett T. 2006. An introduction to ROC analysis. Pattern Recog Lett. 27(8):861–874. doi: 10.1016/j.patrec.2005.10.010.
- Fentahun TM, Bagyaraj M, Melesse MA, Korme T. 2021. Seismic hazard sensitivity assessment in the Ethiopian Rift, using an integrated approach of AHP and DInSAR methods. Egypt J Remote Sens Space Sci. 24(3):735–744. doi: 10.1016/j.ejrs.2021.05.001.
- Ferretti A, Monti-Guarnieri A, Prati C, Rocca F. 2007. InSAR processing: a practical approach. InSAR principles: guidelines for SAR interferometry processing and interpretation, ser. ESA TM. ESA. [accessed 2001 Oct 21]. https://ui.adsabs.harvard.edu/abs/2007ESATM.19….F/abstract.
- Fiaschi S, Fabris M, Floris M, Achilli V. 2018. Estimation of land subsidence in deltaic areas through differential SAR interferometry: the Po River Delta case study (Northeast Italy). Int J Remote Sens. 39(23):8724–8745. doi: 10.1080/01431161.2018.1490977.
- Gupta SK, Shukla DP. 2018. Application of drone for landslide mapping, dimension estimation and its 3D reconstruction. J Indian Soc Remote Sens. 46(6):903–914. doi: 10.1007/s12524-017-0727-1.
- Gupta SK, Shukla DP, Thakur M. 2018. Selection of weightages for causative factors used in preparation of Landslide susceptibility zonation (LSZ). Geomatics Nat Hazards Risk. 9(1):471–487. doi: 10.1080/19475705.2018.1447027.
- Guzzetti F, Mondini AC, Cardinali M, Fiorucci F, Santangelo M, Chang KT. 2012. Landslide inventory maps: new tools for an old problem. Earth Sci Rev. 112(1-2):42–66. doi: 10.1016/j.earscirev.2012.02.001.
- Ho Tong Minh D, Hanssen R, Rocca F. 2020. Radar interferometry: 20 years of development in time series techniques and future perspectives. Remote Sens. 12(9):1364. doi: 10.3390/rs12091364.
- Hu J, Li Z, Zhu J, Ren X, Ding X. 2010. Inferring three-dimensional surface displacement field by combining SAR interferometric phase and amplitude information of ascending and descending orbits. Sci China Earth Sci. 53(4):550–560. doi: 10.1007/s11430-010-0023-1.
- Jia H, Wang Y, Ge D, Deng Y, Wang R. 2022. InSAR study of landslides: early detection, three-dimensional, and long-term surface displacement estimation—a case of Xiaojiang River Basin, China. Remote Sens. 14(7):1759. doi: 10.3390/rs14071759.
- Jianjun ZHU, Zhiwei LI, Jun HU. 2017. Research progress and methods of InSAR for deformation monitoring. Acta Geod Cartogr Sin. 46(10):1717. doi: 10.11947/j.AGCS.2017.20170350.
- Jolivet R, Grandin R, Lasserre C, Doin MP, Peltzer G. 2011. Systematic InSAR tropospheric phase delay corrections from global meteorological reanalysis data. Geophys Res Lett. 38(17):n/a–n/a. doi: 10.1029/2011GL048757.
- Jung HS, Won JS, Kim SW. 2009. An improvement of the performance of multiple-aperture SAR interferometry (MAI). IEEE Trans Geosci Remote Sens. 47(8):2859–2869. doi: 10.1109/TGRS.2009.2016554.
- Jung J, Kim DJ, Lavalle M, Yun SH. 2016. Coherent change detection using InSAR temporal decorrelation model: a case study for volcanic ash detection. IEEE Trans Geosci Remote Sens. 54(10):5765–5775. doi: 10.1109/TGRS.2016.2572166.
- Jung J, Kim DJ, Park SE. 2014. Correction of atmospheric phase screen in time series InSAR using WRF model for monitoring volcanic activities. IEEE Trans Geosci Remote Sens. 52(5):2678–2689. doi: 10.1109/TGRS.2013.2264532.
- Kim J, Lin SY, Singh T, Singh RP. 2023. InSAR time series analysis to evaluate subsidence risk of monumental Chandigarh City (India) and surroundings. IEEE Trans Geosci Remote Sens. 61:1–15. doi: 10.1109/TGRS.2023.3305863.
- Kumar D, Thakur M, Dubey CS, Shukla DP. 2017. Landslide susceptibility mapping & prediction using support vector machine for Mandakini River Basin, Garhwal Himalaya, India. Geomorphology. 295:115–125. doi: 10.1016/j.geomorph.2017.06.013.
- Lanari R, Mora O, Manunta M, Mallorquí JJ, Berardino P, Sansosti E. 2004. A small-baseline approach for investigating deformations on full-resolution differential SAR interferograms. IEEE Trans Geosci Remote Sens. 42(7):1377–1386. doi: 10.1109/TGRS.2004.828196.
- Li ZW, Ding XL, Huang C, Zhu JJ, Chen YL. 2008. Improved filtering parameter determination for the Goldstein radar interferogram filter. ISPRS J Photogramm Remote Sens. 63(6):621–634. doi: 10.1016/j.isprsjprs.2008.03.001.
- Liu X, Zhao C, Zhang Q, Peng J, Zhu W, Lu Z. 2018. Multitemporal loess Landslide inventory mapping with C-, X-and L-band SAR datasets—a case study of Heifangtai Loess Landslides. China. Remote Sens. 10(11):1756. doi: 10.3390/rs10111756.
- Ma C, Cheng X, Yang Y, Zhang X, Guo Z, Zou Y. 2016. Investigation on mining subsidence based on multi-temporal InSAR and time-series analysis of the small baseline subset—case study of working faces 22201-1/2 in Bu’ertai mine, Shendong coalfield, China. Remote Sens. 8(11):951. doi: 10.3390/rs8110951.
- Madsen SN, Zebker HA, Martin JANM. 1993. Topographic mapping using radar interferometry: processing techniques. IEEE Trans Geosci Remote Sens. 31(1):246–256. doi: 10.1109/36.210464.
- Mantovani M, Bossi G, Marcato G, Schenato L, Tedesco G, Titti G, Pasuto A. 2019. New perspectives in landslide displacement detection using sentinel-1 datasets. Remote Sens. 11(18):2135. doi: 10.3390/rs11182135.
- Massonnet D, Feigl KL. 1998. Radar interferometry and its application to changes in the Earth’s surface. Rev Geophys. 36(4):441–500. doi: 10.1029/97RG03139.
- Meng Q, Li W, Raspini F, Xu Q, Peng Y, Ju Y, Zheng Y, Casagli N. 2021. Time-series analysis of the evolution of large-scale loess landslides using InSAR and UAV photogrammetry techniques: a case study in Hongheyan, Gansu Province, Northwest China. Landslides. 18(1):251–265. doi: 10.1007/s10346-020-01490-8.
- Mirmazloumi SM, Gambin ÁF, Wassie Y, Barra A, Palamà R, Crosetto M, Monserrat O, Crippa B. 2022. INSAR deformation time series classification using a convolutional neural network. Int Arch Photogramm Remote Sens Spatial Inf Sci. XLIII-B3-2022:307–312. doi: 10.5194/isprs-archives-XLIII-B3-2022-307-2022.
- Molini L, Parodi A, Siccardi F. 2008. An observing system simulation experiment for the study on attenuation of C‐band radar measurements. Met Apps. 15(4):523–533. doi: 10.1002/met.102.
- Mondini AC. 2017. Measures of spatial autocorrelation changes in multitemporal SAR images for event landslides detection. Remote Sens. 9(6):554. doi: 10.3390/rs9060554.
- Niraj KC, Gupta SK, Shukla DP. 2021. Kotrupi Landslide deformation study in non-urban area using DInSAR and MTInSAR techniques on Sentinel-1 SAR data. Adv Space Res. 70(12):3878–3891. doi: 10.1016/j.asr.2021.11.042.
- Niraj KC, Gupta SK, Shukla DP. 2022. A comparison of image-based and physics-based atmospheric correction methods for extracting snow and vegetation cover in Nepal Himalayas using Landsat 8 OLI images. J Indian Soc Remote Sens. 50(12):2503–2521. doi: 10.1007/s12524-022-01616-6.
- Niraj KC, Singh A, Shukla DP. 2023. Effect of the Normalized Difference Vegetation Index (NDVI) on GIS-enabled bivariate and multivariate statistical models for landslide susceptibility mapping. J Indian Soc Remote Sens. 51(8):1739–1756. doi: 10.1007/s12524-023-01738-5.
- Normand JC, Heggy E. 2015. InSAR assessment of surface deformations in urban coastal terrains associated with groundwater dynamics. IEEE Trans Geosci Remote Sens. 53(12):6356–6371. doi: 10.1109/TGRS.2015.2437368.
- Pawluszek-Filipiak K, Borkowski A. 2020. Integration of DInSAR and SBAS Techniques to determine mining-related deformations using sentinel-1 data: the case study of Rydułtowy mine in Poland. Remote Sens. 12(2):242. doi: 10.3390/rs12020242.
- Perissin D, Wang Z, Wang T. 2011. The SARPROZ InSAR tool for urban subsidence/manmade structure stability monitoring in China. Proceedings of 34th International Symposium on Remote Sensing of Environment The GEOSS Era: Towards Operational Environmental Monitoring; Apr 10–15; Sydney, Australia. https://www.isprs.org/proceedings/2011/isrse-34/
- Pradhan SP, Panda SD, Roul AR, Thakur M. 2019. Insights into the recent Kotrupi Landslide of August 2017, India: a geological investigation and slope stability analysis. Landslides. 16(8):1529–1537. doi: 10.1007/s10346-019-01186-8.
- Prati CLAUDIO, Ferretti A, Perissin D. 2010. Recent advances on surface ground deformation measurement by means of repeated space-borne SAR observations. J Geodyn. 49(3-4):161–170. doi: 10.1016/j.jog.2009.10.011.
- Reigber A, Scheiber R, Jager M, Prats-Iraola P, Hajnsek I, Jagdhuber T, Papathanassiou KP, Nannini M, Aguilera E, Baumgartner S, et al. 2013. Very-high-resolution airborne synthetic aperture radar imaging: signal processing and applications. Proc IEEE. 101(3):759–783. doi: 10.1109/JPROC.2012.2220511.
- Rosi A, Tofani V, Tanteri L, Tacconi Stefanelli C, Agostini A, Catani F, Casagli N. 2018. The new landslide inventory of Tuscany (Italy) updated with PS-InSAR: geomorphological features and landslide distribution. Landslides. 15(1):5–19. doi: 10.1007/s10346-017-0861-4.
- Rott H, Nagler T. 2006. The contribution of radar interferometry to the assessment of landslide hazards. Adv Space Res. 37(4):710–719. doi: 10.1016/j.asr.2005.06.059.
- Sharma P, Rawat S, Gupta AK. 2019. Study and remedy of Kotropi landslide in Himachal Pradesh, India. Indian Geotech J. 49(6):603–619. doi: 10.1007/s40098-018-0343-1.
- Shirani K, Pasandi M. 2021. Landslide monitoring and the inventory map validation by ensemble DInSAR processing of ASAR and PALSAR images (case study: doab-Samsami Basin in Chaharmahal and Bakhtiari Province, Iran). Geotech Geol Eng. 39(2):1201–1222. doi: 10.1007/s10706-020-01554-5.
- Shukla DP, Dubey CS, Ningreichon AS, Singh RP, Mishra BK, Singh SK. 2014. GIS-based morpho-tectonic studies of Alaknanda river basin: a precursor for hazard zonation. Nat Hazards. 71(3):1433–1452. doi: 10.1007/s11069-013-0953-y.
- Sica F, Pulella A, Nannini M, Pinheiro M, Rizzoli P. 2019. Repeat-pass SAR interferometry for land cover classification: a methodology using Sentinel-1 Short-Time-Series. Remote Sens Environ. 232:111277. doi: 10.1016/j.rse.2019.111277.
- Singh A, Ashuli A, Niraj KC, Dhiman N, Dubey CS, Shukla DP. 2023. Evaluating causative factors for landslide susceptibility along the Imphal-Jiribam railway corridor in the North-Eastern part of India using a GIS-based statistical approach. Environ Sci Pollut Res. 1–18. doi: 10.1007/s11356-023-28966-z.
- Singh A, Chhetri NK, Nitesh, Gupta SK, Shukla DP. (2023). Strategies for sampling pseudo-absences of landslide locations for landslide susceptibility mapping in complex mountainous terrain of Northwest Himalaya.Bull Eng Geol Environ, 82(8):1–21. doi: 10.1007/s10064-023-03333-x.
- Singh D, Singh AK, Patel RP, Singh R, Singh RP, Veenadhari B, Mukherjee M. 2008. Thunderstorms, lightning, sprites and magnetospheric whistler-mode radio waves. Surv Geophys. 29(6):499–551. doi: 10.1007/s10712-008-9053-z.
- Singh N, Gupta SK, Shukla DP. 2020. Analysis of landslide reactivation using satellite data: a case study of Kotrupi Landslide, Mandi, Himachal Pradesh, India. Int Arch Photogramm Remote Sens Spatial Inf Sci. XLII-3/W11(3/W11):137–142. doi: 10.5194/isprs-archives-XLII-3-W11-137-2020.
- Solari L, Del Soldato M, Raspini F, Barra A, Bianchini S, Confuorto P, Casagli N, Crosetto M. 2020. Review of satellite interferometry for landslide detection in Italy. Remote Sens. 12(8):1351. doi: 10.3390/rs12081351.
- Suresh D, Yarrakula K. 2020. InSAR based deformation mapping of earthquake using Sentinel 1A imagery. Geocarto Int. 35(5):559–568. doi: 10.1080/10106049.2018.1544289.
- Tzouvaras M, Danezis C, Hadjimitsis DG. 2020. Small scale landslide detection using Sentinel-1 interferometric SAR coherence. Remote Sens. 12(10):1560. doi: 10.3390/rs12101560.
- Van Westen CJ, Castellanos E, Kuriakose SL. 2008. Spatial data for landslide susceptibility, hazard, and vulnerability assessment: an overview. Eng Geol. 102(3-4):112–131. doi: 10.1016/j.enggeo.2008.03.010.
- Verhoest NE, Lievens H, Wagner W, Álvarez-Mozos J, Moran MS, Mattia F. 2008. On the soil roughness parameterization problem in soil moisture retrieval of bare surfaces from synthetic aperture radar. Sensors. 8(7):4213–4248. doi: 10.3390/s8074213.
- Wang G, Xie M, Chai X, Wang L, Dong C. 2013. DInSAR-based landslide location and monitoring at Wudongde hydropower reservoir in China. Environ Earth Sci. 69(8):2763–2777. doi: 10.1007/s12665-012-2097-x.
- Wasowski J, Bovenga F. 2014. Investigating landslides and unstable slopes with satellite multi temporal interferometry: current issues and future perspectives. Eng Geol. 174:103–138. doi: 10.1016/j.enggeo.2014.03.003.
- Wegmuller U, Werner CL. 1995. SAR interferometric signatures of forest. IEEE Trans Geosci Remote Sens. 33(5):1153–1161. doi: 10.1109/36.469479.
- Zhao C, Lu Z. 2018. Remote sensing of landslides—a review. Remote Sens. 10(2):279. doi: 10.3390/rs10020279.
- Zhou X, Chang NB, Li S. 2009. Applications of SAR interferometry in earth and environmental science research. Sensors. 9(3):1876–1912. doi: 10.3390/s90301876.
- Zubair M, Haider Z, Khan SA, Nasir J. 2011. Atmospheric influences on satellite communications. Przeglad Elektrotechniczny. 87(5):261–264.