
 ?Mathematical formulae have been encoded as MathML and are displayed in this HTML version using MathJax in order to improve their display. Uncheck the box to turn MathJax off. This feature requires Javascript. Click on a formula to zoom.
Abstract
As the forefront of the northeastern margin of the Tibetan Plateau, the Liupanshan area is subjected to significant Cenozoic deformation. Considering the background of historical earthquakes and the current seismic activity, the Liupanshan fault poses a risk of strong earthquakes. This paper analyzes the evolution of Coulomb stress induced by the coseismic and postseismic viscoelastic deformation of six historical strong earthquakes that occurred around the Liupanshan area since the twentieth century. Additionally, based on the disturbance in Coulomb stress and the background seismicity rate, the probability of earthquake occurrence is quantitatively evaluated using the frictional constitutive law. The results indicate that northern section of the Liupanshan fault has higher earthquake potential than the southern section, warranting close attention. These findings serve as a reference for medium- and long-term earthquake forecast and risk assessment in the vicinity of the Liupanshan fault.
1. Introduction
The northeastern margin of the Tibetan Plateau, blocked by the Ordos block, has experienced strong compression and seismic activity throughout the Cenozoic period (Tapponnier et al. Citation2001; Yuan et al. Citation2004; Zhang et al. Citation2006). In the historical record, the northern part of the Liupanshan fault has witnessed more than three significant earthquakes. Additionally, at least six ancient earthquakes have ruptured to the surface over the past 35,000 years (Xiang et al. Citation1998). However, since the M7 Guyuan earthquake in 1622, the northern part of the Liupanshan fault has not experienced any strong earthquakes with a magnitude of M ≥ 7 for nearly 395 years, and the central and southern parts have not seen earthquakes with a magnitude of M ≥ 6.5 for at least 1000 years (Du et al. Citation2018). Given the background tectonic movement and historical occurrence of large earthquakes in this region, the medium- and long-term risk assessment for strong earthquakes in the Chinese Mainland has identified the Liupanshan fault as a seismic gap and places significant attention on the potential risk of future earthquakes (M7 Special Working Group Citation2012). Current GPS data reveals crustal shortening spanning a range of approximately 200-300km on the western side of the Liupanshan fault (Hao et al. Citation2014, Citation2021; Su et al. Citation2018). Notably, the rapid decrease in GPS velocities to the west of the fault is strikingly similar to the situation observed along the Longmenshan fault prior to the 2008 M8 Wenchuan earthquake (Du et al. Citation2009). As a result, seismic hazard assessment in the Liupanshan area is crucial, particularly for the residents living in close proximity to this region.
As destructive earthquakes typically occur along active faults with significant stress accumulation, numerous studies have unveiled the role of stress transfer in earthquake occurrence. This has been achieved by examining the relationship between changes in Coulomb stress and corresponding changes in seismicity rates (King et al. Citation1994; Stein et al. Citation1997; Ali et al. Citation2008; Catalli et al. Citation2008; Toda et al. Citation2008; Shi et al. Citation2018). Coulomb stress has become a robust tool for investigating earthquake triggering and assessing regional seismic risk. Notably, Stein et al. (Citation1997) successfully predicted high earthquake risk in the Izmit region, which was followed by the occurrence of the M7.4 Izmit earthquake two years later. Furthermore, the friction constitutive law introduced by Dieterich (Citation1994) and involving stress perturbations coupled with the rate and state dependent friction law, has been employed to quantitatively estimate seismicity rates within the fracture zone. In a similar vein, Catalli et al. (Citation2008) modified Coulomb stress variation as stress disturbances within their model. Based on the rate and state Coulomb stress transfer model, Toda et al. (Citation2008) assessed seismicity rates across three major fault systems following the 2008 Wenchuan earthquake. Chingtham et al. (Citation2017) also evaluated seismicity rates within the northwest Himalaya region using the same model, and their findings were corroborated by subsequent earthquake occurrences.
Inspired by the works above, we constructs a layered viscoelastic model to calculate the Coulomb stress changes resulting from the coseismic and postseimic deformation caused by historical significant earthquakes. Furthermore, we employ a rate and state friction model to calculate the seismicity rate perturbed by Coulomb stress changes within the Liupanshan fault zone. Ultimately, earthquake probabilities for the Liupanshan fault zone are quantitatively assessed, providing valuable support for medium- and long-term earthquake risk assessments.
2. Tectonic setting
The Liupanshan fault exhibits a distinct geomorphic contrast between its eastern and western sides. To the east of the fault lies the Ordos, characterized by the rigid Craton nature and weak tectonic activities. In stark contrast, the western side corresponds to the northeastern margin of the Tibetan Plateau, comprising compressional basins and ridges. The Liupanshan fault runs predominantly in a south-north direction, connecting to the north with the Haiyuan fault, a northwest-oriented strike-slip fault. Furthermore, its southern extent intersects with the northwest-oriented Longxian-Baoji Fracture zone (Du et al. Citation2018). The northeastward thrusting of the Tibetan Plateau encounters obstruction from the stable Ordos, resulting in horizontal compression and shortening within the vicinity of Liupanshan (Zheng et al. Citation2009; Zhang Citation2013).
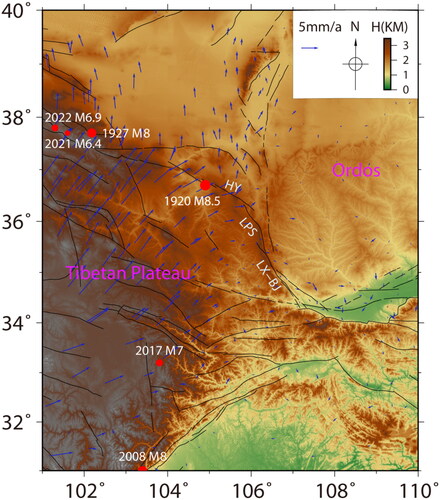
Over the twentieth century, the Liupanshan region has experienced three earthquakes of magnitude greater than M8: the M8.5 Haiyuan earthquake on December 16, 1920; the M8.0 Gulang earthquake on May 23, 1927; and the M8.0 Wenchuan earthquake on May 12, 2008. In more recent times, notable seismic events include the M7.0 Jiuzhaigou earthquake on August 8, 2017; the M6.4 Menyuan earthquake on January 21, 2016; and the M6.9 Menyuan earthquake on January 8, 2022. This paper undertakes an analysis of the temporal and spatial evolution of Coulomb stress changes brought about by these six significant earthquakes. The primary objective is to assess the seismicity probabilities within the Liupanshan fault zone ().
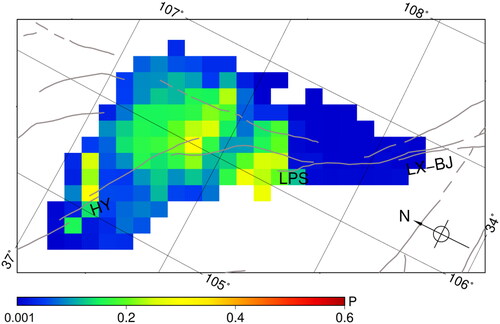
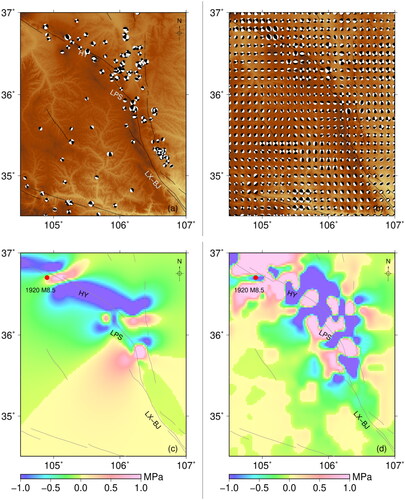
Figure 1. The tectonic map around the Liupanshan area. The red dots are six strong earthquake. The blue arrows are GPS velocities relative to the ordos block (Hao et al. Citation2021). The fault data is from Deng et al. (Citation2003). HY = Haiyuan fault; LPS = Liupanshan fault; LX-BJ = Longxian-Baoji fault.
3. Method
3.1. Coulomb failure stress change
As Coulomb failure assumptions, Coulomb stress changes are computed through widely used expression (King et al. Citation1994; Harris and Simpson Citation1998):
(1)
(1)
where
and
are the shear and effective normal stress changes, and
is the coefficient of friction.This study employs the PSGRN/PSCMP software (Wang et al. Citation2006) to compute the Coulomb stress changes from the coseismic and postseismic viscoelastic relaxation deformations associated with the six earthquakes near the Liupanshan area.
The crustal layer thickness, density, and velocity are referenced from the Crust 1.0 model (Laske et al. Citation2013). The Lithosphere is modeled using the Burgers model. For short-term deformation, the Kelvin viscosity for the short term deformation refers to the study of the postseismic deformation following the 2001 Ms8.1 Kunlun earthquake (Shao et al. Citation2008) and while the Maxwell viscosity
for the long term deformation is based on the interseismic deformation in the northeastern margin of the Tibetan Plateau (He et al. Citation2013). The source slip models for the earthquakes are sourced as follows: the 1920 M8.5 Haiyuan earthquake (Zhang et al. Citation2021), the 1927 M8.0 Gulang earthquake (Guo et al. Citation2020), the 2008 M8.0 Wenchuan earthquake (Shen et al. Citation2009), the 2017 M7.0 Jiuzhaigou earthquake (Sun et al. Citation2018), and the 2016 M6.4 and 2022 M6.9 Menyuan earthquakes (Li et al. Citation2022). The effective friction coefficient μ′ is assumed to be 0.4 (King et al. Citation1994; Toda et al. Citation2008).
3.2. Earthquake probability assessment
To account for the variation in background seismicity, this study employs the rate and state friction constitutive law to integrate Coulomb stress perturbations with the background seismicity, thus evaluating the seismicity rate and estimating earthquake probability (Toda et al. Citation2008; Shao et al. Citation2015; Xu et al. Citation2019). Following Catalli et al. (Citation2008)’s work, the seismicity rate is modeled using the following equation:
(2)
(2)
where
represents the background seismicity, Δ CFF denotes the Coulomb stress change, Aσ is the constitutive parameter with A representing the direct effect of friction in the rate- and state- dependent constitutive formulation, and σ being the effective normal stress,
signifies the duration of transient change in the rate of earthquake production, which can be expressed by the Shear stressing rate
and the constitutive parameter Aσ:
(3)
(3)
Catalli et al. (Citation2008) determined Aσ equal to 0.04 MPa from a maximum likelihood best fit of observed seismicity. In this paper, we refer to the studies (Catalli et al. Citation2008; Toda et al. Citation2008; Shao et al. Citation2015), assume the value of Aσ to be 0.04 MPa.
An approximate relationship between the background seismicity rate r and the shear stress rate of the target region is outlined as (Catalli et al. Citation2008; Shao et al. Citation2015):
(4)
(4)
here
stands for the seismogenic layer thickness, b is the parameter of the Gutenberg-Richter equation (Gutenberg and Richter Citation1954),
represents the seismic moment of
(Hanks and Kanamori Citation1979),
and
are the maximum and minimum magnitude, respectively.
Finally, the seismicity rate is converted into the standard Poisson probability of earthquake occurrence
(Shao et al. Citation2015; Xu et al. Citation2019):
(5)
(5)
4. Results
4.1. Coulomb stress changes
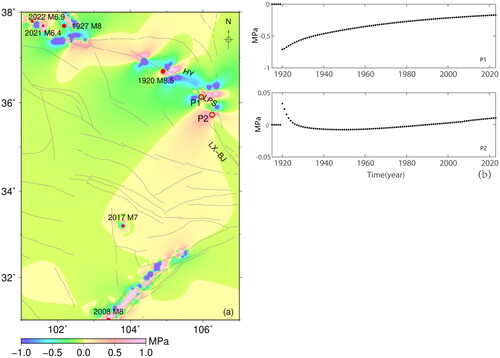
Among the six earthquakes, the 1920 Haiyuan earthquake leads to the most pronounced Coulomb stress changes in the Liupanshan region (Figures 1s–6s). The coseismic deformation due to the 1920 Haiyuan earthquake decreases the Coulomb stress in the northern part of the Liupanshan fault, reaching a maximum of approximately −0.8 MPa. Conversely, it increases the Coulomb stress in the south part, with a maximum of about 0.4 MPa. Moreover, the postseismic viscoelastic relaxation increases the Coulomb stress across the Liupanshan fault, with a maximum of about 0.6 MPa. A minor reduction is seen at the southern extremity of the fault (Figure S1). Both the coseismic and postseismic deformation due to the 1927 Gulang and 2008 Wenchuan earthquakes amplify the Coulomb stress on the Liupanshan fault zone, by the magnitudes of about 10−4–10−3MPa (Figures S2 and S3). However, the 2017 Jiuzhaigou (Figure S4), 2016 and 2022 Menyuan earthquakes (Figures S5 and S6) only cause the Coulomb stress changes on the order of about 10−5 MPa. The cumulative Coulomb stress map and temporal evolution of the Coulomb stress resulting from the six earthquakes () indicate that the Liupanshan fault is mainly influenced by the Haiyuan earthquake, with the influence of the other earthquakes being relatively negligible. Over the span of roughly 100 years, the postseismic viscoelastic relaxation attributable to the 1920 Haiyuan earthquake substantially contributes to the temporal evolution of Coulomb stress.
Figure 2. The spatial distribution and temporal evolution of the coulomb stress changes. (a). Spatial distribution of the Coulomb stress loading on the Liupanshan area associated with 6 strong earthquakes; (b). The temporal evolution of the coulomb stress associated with 6 strong earthquakes at the point P1 and P2 in the (a), respectively.
4.2. Background seismicity
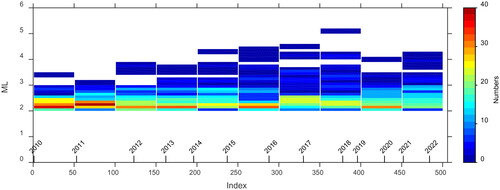
We use the Chinese earthquake catalog spanning July, 2010 to Decemter, 2022 provided by the China Earthquake Networks Center. In seismic hazard studies, the minimum magnitude of completeness determines the status assessment, thus it is necessary to assess the minimum magnitude of
to obtain reliability result. shows the minimum
magnitude over the Liupanshan fault zone and its adjacent areas. The values of
float around 2.0–2.3. Therefore, we use 2.3 as the minimum completeness magnitude
Figure 3. The sequence-number diagram for the earthquake catalog, 2010.7–2022.12.
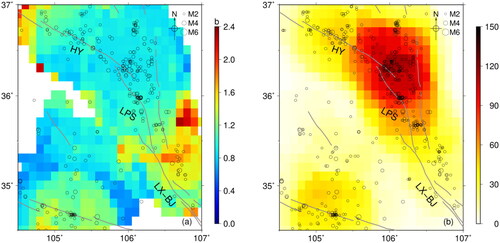
The spatial distribution of background earthquakes () demonstrates the seismic activity along the Haiyuan-Liupanshan fault zone is relatively active. Comparatively fewer earthquakes are noted on the western side of the fault, and even fewer within the Ordos Craton on the east. The background seismicity rate pertains to the count of the earthquake numbers above within a radius of 50 km (Shao et al. Citation2015), and b value is estimated through the maximum likelihood method (Aki Citation1965). The outcomes reveal a relatively modest b value for the northern Liupanshan fault section, hovering at approximately 0.9, while the southern section exhibits slight higher b value, reaching up to around 1.0 (), which is consistent with the previous study (Zhu Citation2021). It should be noted that seismic activity levels on the Liupanshan fault zone, especially in the northern end, were much higher than the surrounding area ().
Figure 4. The b value (a) and seismicity rate (b) around the Liupanshan area during 2010.7–2022.12(M ≥ 2.3). The black circles denote the earthquakes. The color represents the b value and seismicity rate, respectively.
4.3. Earthquake probability
Beginning with the background seismicity rate along the Liupanshan fault zone based on the earthquake catalog, we corporate the Coulomb stress perturbations arising from the coseismic and postseismic deformations due to the six significant earthquakes from 1920 until now and the spatial distribution of b values in the friction constitutive law model, we convert the seismicity rate per year of completeness magnitude to the seismicity rate per year of the M5 earthquake using the G–R relation, and then use EquationEquation (5)(5)
(5) to calculate the earthquake occurrence probability distribution of a M5 earthquake within the study area (). In this study, the occurrence probabilities of M5 earthquake in northern section of the Liupanshan fault zone are above 10%. The northern tip intersecting with the Haiyuan Fault and the southern part of the northern section, where the Coulomb stress changes increase, have earthquake probabilities around 20–30%. However, the southern section of the Liupanshan fault zone is less than 1%. Wallace et al. (Citation1984) categorized recurrence probability in seismic hazard into three classes: slight (0–10%), medium (11–49%), and high probability events (50–100%). The northern section of Liupanshan fault zone falls into the moderate probability category, while the south part belongs to the small probability category. Since the high earthquake risk along the Liupanshan fault zone aligns with prior risk assessments based on fault locking distribution (Li et al. Citation2017; Meng et al. Citation2019), maximum shear strain rates (Zhu Citation2021), and seismic gap analyses (Du et al. Citation2018), we cannot ignore the seismic hazard along the Liupanshan fault zone, especially in the northern section.
Figure 5. The probabilities of occurrence of M > 5 earthquakes around the Liupanshan area.
5. Discussion
5.1. The impact of effective friction coefficient on Coulomb stress changes
The effective friction coefficient μ′ introduces an element of uncertainty into Coulomb stress calculations. We delve into the effect of different μ′ values (0.1, 0.4, and 0.7) on Coulomb stress changes, employing the 1920 Haiyuan earthquake as an illustrative example (). The results demonstrate that increasing μ′ leads to a slight reduction in Coulomb stress changes. However, the essential distribution pattern of Coulomb stress changes remains unaltered, and the temporal evolution of Coulomb stress changes remains nearly synchronized. The impact of μ′ on Coulomb stress changes stems from variations in normal stress on the fault plane. When changes in normal and pore stress are relatively minor compared to shear stress, μ′ tends to exert a limited influence on Coulomb stress changes (Shen Citation2003; Pollitz et al. Citation2006; Tang et al. Citation2023). Alternatively, if normal and pore stress changes are substantial, Coulomb stress changes are more pronounced (Toda et al. Citation2008; Jia Citation2021; Jia et al. Citation2021). Given that the Haiyuan earthquake primarily entails strike-slip motion that predominantly influences shear stress, μ' has not much impact on Coulomb stress changes ().
Figure 6. Impact of effective friction coefficients of 0.1(a), 0.4(b), 0.7(c) on the Coulomb stress due to the 1920 Haiyuan earthquake; (d) The temporal evolution of the Coulomb stress at point P1 based on different friction coefficients.
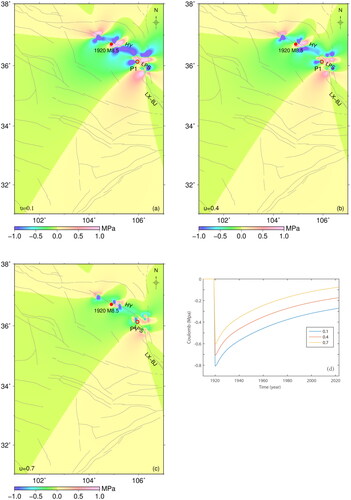
Table 1. The parameters of the lithosphere structure around the Liupanshan area.
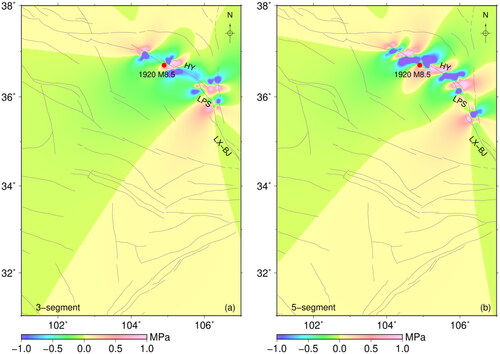
5.2. The impact of the rupture model on the Coulomb stress changes
The distribution of Coulomb stress changes closely relates to the fault rupture distribution. Considering the ambiguity rupture slip models for the Haiyuan and Gulang earthquakes, we focus on the Haiyuan earthquake to explore how different rupture models affect Coulomb stress changes. Divergent opinions exist regarding the rupture length and segmentation of these earthquakes. Some models split the rupture fault into five segments based on surface rupture analysis, while others propose a three-segment model based on geometric shape and sliding mode (Han et al. Citation2008; Xu et al. Citation2019; Ou et al. Citation2020; Zhang et al. Citation2021). Here, we compare Coulomb stress changes under the 5-segment and 3-segment rupture models (). The two models exhibit significant divergence in Coulomb stress changes within the middle section of the Haiyuan fault: the 3-segment model features predominantly decreasing Coulomb stress changes, whereas the 5-segment model showcases an alternating pattern of increase and decrease. Previous studies (Jia et al. Citation2018; Zhu et al. Citation2022; Tang et al. Citation2023) have similarly highlighted that earthquake rupture models significantly influence Coulomb stress changes within rupture zones. The Liupanshan fault lies to the southeast of the rupture zone, and the variance in Coulomb stress changes between these models remains relatively small.
Figure 7. The Coulomb stress changes based on the 3-segment (a) and 5-segment (b) rupture models for the 1920 Haiyuan earthquake, respectively.
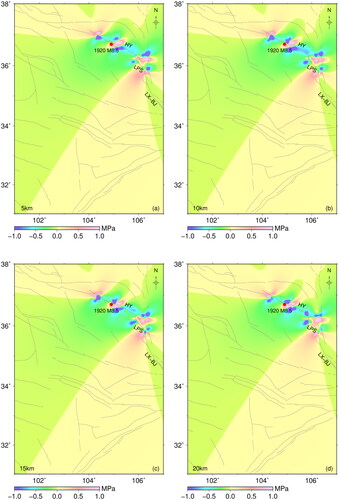
5.3. The impact of the depth on Coulomb stress changes
The depth where Coulomb stress is calculated holds significant importance (Catalli and Chan Citation2012). Coulomb stress changes tend to exhibit less variability with depth in the case of strike-slip vertical faults (Wan et al. Citation2007). However, there are differences in Coulomb stress changes at various depths for the faults with strike and dip slip (Tang et al. Citation2023). Given the primarily thrusting nature of the Liupanshan fault (Du et al. Citation2018), we further explore Coulomb stress changes at different depths. It’s worth noting that the depths of earthquakes in the study area generally range between 5 and 20 km, according to the Chinese earthquake catalog. Consequently, we have calculated the Coulomb stress changes at depths of 5, 10, 15, and 20 km (). Remarkably, the patterns of Coulomb stress changes at these different depths exhibit similarities, with alternating positive and negative changes in the vicinity of the Liupanshan fault. The best strategy was to choose the maximum stress change over the entire seismogenic depth range in order to gain the best forecasting performance (Catalli and Chan Citation2012; Wang et al. Citation2014). Thus, we have chosen to apply the maximum Coulomb stress change throughout this paper, which occurs at a depth of 10 km.
Figure 8. The coulomb stress changes due to the 1920 Haiyuan earthquake at different depths: (a) 5 km, (b) 10 km, (c) 15 km and (d) 20 km, respectively.
5.4. The impact of the receive fault on the Coulomb stress changes
The calculation of Coulomb stress changes requires the definition of the geometry and the faulting mechanism of the target faults on which stress perturbations are resolved (Cocco et al. Citation2010). In this study, we employ a uniformly receive fault constrained by geology to calculate Coulomb stress changes. Another approach involves assigning fault planes with the strike, dip, and rake as the nearest earthquake (Jia Citation2021). In the focal mechanism catalog, there are 118 earthquakes larger than 2.5 in the study area from July 2010 to December 2019 (). The maximum magnitude in the focal mechanism catalog is 4.6, with 92.4% of earthquakes smaller than 3.5. Consistent with the methodology used by Jia (Citation2021), we perform a grid search to determine the focal mechanism of each grid based on the nearest earthquakes. Subsequently, we randomly assign the strike and dip of each grid from two nodal planes and choose the rake for which shear stress is highest. A comparison between these two methods for calculating Coulomb stress changes reveals starkly different patterns, particularly near the causative faults. The variable spatial distribution of focal mechanisms amplifies the magnitude and variability of Coulomb stress changes, whereas the uniform geologic structure reduces variability (). Consequently, the choice of the receiver fault significantly influences the spatial distribution of Coulomb stress changes, aligning with findings in a previous study (Cocco et al. Citation2010). Although the uniformly receive fault is too simple, the focal plane catalog might not be a reliable proxy for existing faults as the earthquakes in the study area are sparse and small.
Figure 9. Focal mechanisms of earthquakes and the associated Coulomb stress changes. (a) Focal mechanisms of earthquakes. The black focal mechanism plots represent earthquakes catalog. (b) Smoothed faulting mechanisms of grids according to the nearest earthquakes. The Coulomb stress changes introduced by the coseismic deformation due to the 1920 Haiyuan earthquake based on the uniform fault plane (c) and variable fault planes which are assigned the strike, dip, and rake of each grid defined by the smoothed faulting mechanisms (d).
5.5. The impact of the viscosity on the Coulomb stress changes
After an earthquake occurs, immediate viscoelastic relaxation in the lower crust and upper mantle triggers changes in Coulomb stress. With the postseismic relaxation spanning hundreds of years, viscosity determines the temporal characteristics. For a viscosity of Pa s, it takes about 100 year for 90% of mantle coseismic stresses to be relaxed and transferred to the surface (Ali et al. Citation2008). The postseismic viscoelastic relaxation had a tangible effect on the seismicity (Pollitz and Cattania Citation2017), and only considering static stress change in the coulomb rate and state model may lead to bias in forecast of seismicity (Jia Citation2021b). Viscosity values for the Tibetan Plateau’s lower crust and upper mantle vary between
and
Pa • s in prevous studies (Clark and Royden Citation2000; Hilley et al. Citation2005; Shao et al. Citation2008; Ryder et al. Citation2011; He et al. Citation2013; Wang et al. Citation2021; Zhao et al. Citation2021). Using the terrain gradient method, Clark and Royden (Citation2000) estimated the viscosity of the Tibetan Plateau’s lower crust to be between
and
Pa • s. Hilley et al. (Citation2005) determined the viscosity of the lower crust of the Tibetan Plateau, based on geological and geodetic data near the Kunlun Fault, to range from
to
Pa • s. Ryder et al. (Citation2011) and Zhao et al. (Citation2021) studied the postseismic viscoelastic relaxation of the Mw 7.8 Hoh Xil earthquake in 2001, a inferring transient viscosity values of 9 ×
Pa • s and 5.0 ×
Pa • s, as well as steady-state viscosity values of
Pa • s and 4 ×
Pa • s, respectively. Wang et al. (Citation2021) estimated the transient viscosity of 5.0×
and 5.0 ×
Pa • s for the lower crust and upper mantle of the Songpan-Ganzi block, along with a steady-state viscosity of 5.0 ×
Pa • s and 1.3 ×
Pa • s based on the postseismic viscoelastic deformation following the 2008 Wenchuan earthquake. To explore the impact of viscosity on Coulomb stress changes, we examine the example of the Haiyuan earthquake, comparing four models of different rheological viscosities (), including our model, Ryder et al. (Citation2011), Zhao et al. (Citation2021), and Wang et al. (Citation2021). The results reveal the similar patterns of the Coulomb stress changes (). Our model closely aligns with Ryder et al. (Citation2011), while Zhao et al. (Citation2021) model produces smaller Coulomb stress disturbances, and Wang et al. (Citation2021) model generates larger disturbances. Overall, the viscosity within a reasonable range has minor influence on Coulomb stress changes. Moreover, Coulomb stress changes due to postseismic viscoelastic relaxation are smaller than those arising from coseismic deformation.
Figure 10. The coulomb stress changes loading on the Liupanshan fault due to the 1920 Haiyuan earthquake based on different viscosity parameters. This study (a), Ryder et al. (Citation2011) (b), Zhao et al. (Citation2021) (c) and Wang et al. (Citation2021) (d).
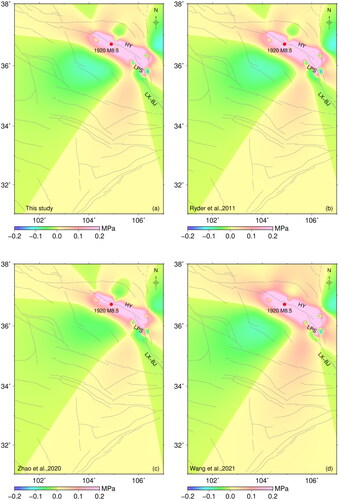
Table 2. The four models of different rheological viscosities.
5.6. The impact of constitutive parameter on earthquake probability
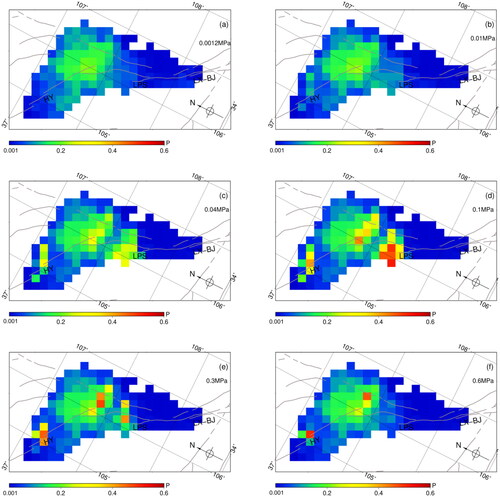
The constitutive parameter Aσ introduces uncertainty, with different case studies yielding Aσ values spanning 0.0012–0.6 MPa (Catalli et al. Citation2008; Toda et al. Citation2008). Aσ governs the seismicity rate attenuation process, with higher values yielding longer transient change durations Moreover, Aσ plays a role in influencing the rate of stress-disturbed seismicity (Catalli et al. Citation2008), which determines how strongly seismicity is enhanced by positive Coulomb stress changes or inhibited by negative Coulomb stress changes (Cattania et al. Citation2014). To explore the significance of the parameter Aσ in estimating earthquake probabilities, we assume values for Aσ in the range of 0.0012–0.6 MPa and then calculate the corresponding earthquake probabilities (). The results reveal that the constitutive parameter Aσ mainly impacts earthquake probabilities in the positive Coulomb stress changes zone, that is the northern tip intersecting with the Haiyuan Fault and the southern part of the northern section, and doesn’t much impact the other region. As the constitutive parameter Aσ increases from 0.0012 to 0.1 MPa, earthquake probabilities increase in positive Coulomb stress changes zone. However, the earthquake probabilities decrease as Aσ increases from 0. 1 to 0.6 MPa. The highest earthquake probabilities are up to around 50% at the Aσ of 0.1 MPa.
Figure 11. The earthquake occurrence probabilities associated with the different parameter (a)
is 0.0012 MPa, (b)
is 0.01 MPa, (c)
is 0.04 MPa, (d)
is 0.1 MPa, (e)
is 0.3 MPa, and (i)
is 0.6 MPa.
6. Conclusion
In conclusion, this study presents an earthquake probability assessment for the Liupanshan fault zone by combining background seismicity rates and Coulomb stress changes induced by six historical strong earthquakes. The key findings reveal that and earthquake probabilities within the northern section of Liupanshan fault zone where the Coulomb stress changes increase are estimated at approximately 20–30%, indicating a medium earthquake risk. The predicted earthquake potential will further increase if the constitutive parameter Aσ is changed. Furthermore, given the high degree of fault locking (Li et al. Citation2017; Meng et al. Citation2019) and its location in an area characterized by high shear strain (Hao et al. Citation2021; Zhu Citation2021), the earthquake risk in the northern section of the Liupanshan fault zone deserves heightened attention.
Seismicity rate changes depend on the stress perturbation, the physical constitutive properties of faults and the background seismicity rate of the study area (Cocco et al. Citation2010; Cattania et al. Citation2014; Pollitz and Cattania Citation2017; Jia Citation2021). Previous studies (Cocco et al. Citation2010; Cattania et al. Citation2014; Jia Citation2021) found that the seismic rate is very sensitive to the spatial pattern of Coulomb stress. In addition, this study delves into the impact of various factors such as rupture models, friction coefficients, viscosity coefficients, depths, rand receiver faults on Coulomb stress changes. Additionally, the background seismicity rate, based on the current earthquake catalog, might not accurately represent seismic activity over a recurrence cycle of strong earthquakes, potentially leading to underestimation of earthquake probabilities (Shao et al. Citation2015; Xu et al. Citation2019). As further advancements in ancient earthquake investigation, enhancing our understanding of earthquake probabilities through a background seismic activity evaluation based on strong earthquake recurrence cycles is anticipated.
Supplemental Material
Download MS Word (1.2 MB)Acknowledgments
We express our gratitude to Editor Ramesh Singh and the three anonymous reviewers for their valuable comments that significantly improved our manuscript. We would like to thank Hui Zhang of Gansu Earthquake Agency for providing the focal mechanisms, Professor Rongjiang Wang for sharing the PSGRN/PSCMP program, and Professor Paul Wessel (Wessel et al., Citation2019) for sharing the GMT program.
Disclosure statement
No potential conflict of interest was reported by the authors.
Data availability statement
The earthquake data utilized in this study are sourced from the National Earthquake Data Center of China (https://data.earthquake.cn/gcywfl/index.html).
Correction Statement
This article has been corrected with minor changes. These changes do not impact the academic content of the article.
Additional information
Funding
References
- Aki K. 1965. Maximum likelihood estimate of b in the formula logN = a-bN and its confidence limits. Bulletin of the Earthquake Research Institute. Univ Tokyo. 43:237–239.
- Ali ST, Freed AM, Calais E, Manaker DM, McCann WR. 2008. Coulomb stress evolution in Northeastern Caribbean over the past 250 years due to coseismic, postseismic and interseismic deformation. Geophys J Int. 174(3):904–918. doi: 10.1111/j.1365-246X.2008.03634.x.
- Catalli F, Chan CH. 2012. New insights into the application of the Coulomb model in real-time. Geophys J Int. 188(2):583–599. doi: 10.1111/j.1365-246X.2011.05276.x.
- Catalli F, Cocco M, Console R, Chiaraluce L. 2008. Modeling seismicity rate changes during the 1997 Umbria‐Marche sequence (central Italy) through a rate- and state- dependent model. J Geophys Res. 113(B11):B11301. doi: 10.1029/2007JB005356.
- Cattania C, Hainzl S, Wang L, Roth F, Enescu B. 2014. Propagation of Coulomb stress uncertainties in physics-based aftershock models. JGR Solid Earth. 119(10):7846–7864. doi: 10.1002/2014JB011183.
- Chingtham P, Prajapati SK, Gahalaut VK, Chopra S, Roy PS. 2017. Forecasting seismicity rate in the north-west Himalaya using rate and state dependent friction law. 8(2),1643–1661. doi: 10.1080/19475705.2017.1369168
- Clark MK, Royden LH. 2000. Topographic ooze: building the eastern margin of Tibet by lower crustal flow. Geol. 28(8):703–706. doi: 10.1130/0091-7613(2000)28<703:TOBTEM>2.0.CO;2.
- Cocco M, Hainzl S, Catalli F, Enescu B, Lombardi AM, Woessner J. 2010. Sensitivity study of forecasted aftershock seismicity based on Coulomb stress calculation and rate- and state dependent frictional response. J Geophys Res. 115(B5):1–15. doi: 10.1029/2009JB006838.
- Deng Q, Zhang P, Ran Y, Yang X, Min W, Chu Q. 2003. Basic characteristics of active tectonics of China. Sci China Ser D-Earth Sci. 46(4):356–372. doi: 10.1360/03yd9032.
- Dieterich J. 1994. A constitutive law for rate of earthquake production and its application to earthquake clustering. J Geophys Res. 99(B2):2601–2618. doi: 10.1029/93JB02581.
- Du F, Wen XZ, Zhang PZ, Wang QL. 2009. Interseismic deformation across the Longmenshan fault zone before the 2008 M8.0 Wenchuan earthquake. Chin J Geophys. 52(11):2729–2738 (in Chinese).
- Du F, Wen XZ, Feng JG. 2018. Seismo-tectonics and seismic potential of the Liupan shan fault zone (LPSFZ), China. Chin J Geophys. 61(2):545–559 (in Chinese).
- Guo P, Han Z, Gao F, Zhu C, Gai H. 2020. A new tectonic model for the 1927 M8.0 Gulang earthquake on the NE Tibetan Plateau. Tectonics. 39(9):e2020T–e6064T. doi: 10.1029/2020TC006064.
- Gutenberg B, Richter CF. 1954. Seismicitiy of the earth and associated phenomenon. 2nd Ed. Princeton N J: Princeton University Press: p. 17–19.
- Han ZJ, Dong SP, Xie FR, et al. 2008. Earthquake triggering by static stress: the 5 major earthquakes with M ≥ 7 (1561 ∼ 1920) in the northern section of South-north seismic zone. China. Chin J Geophys. 51(6):1776–1784 (in Chinese).
- Hanks TC, Kanamori H. 1979. A moment magnitude scale. J Geophys Res. 84(B5):2348–2350. doi: 10.1029/JB084iB05p02348.
- Hao M, Wang Q, Shen Z, Cui D, Ji L, Li Y, Qin S. 2014. Present day crustal vertical movement inferred from precise leveling data in eastern margin of Tibetan Plateau. Tectonophysics. 632:281–292. doi: 10.1016/j.tecto.2014.06.016.
- Hao M, Wang Q, Zhang P, Li Z, Li Y, Zhuang W. 2021. “Frame wobbling” causing crustal deformation around the Ordos block. Geophys Res Lett. 48(1):e2020GL091008. doi: 10.1029/2020GL091008.
- Harris RA, Simpson RW. 1998. Suppression of large earthquakes by stress shadows: a comparison of Coulomb and rate-and-state failure. J Geophys Res. 103(B10):24439–24451. doi: 10.1029/98JB00793.
- He J, Lu S, Wang W. 2013. Three-dimensional mechanical modeling of the GPS velocity field around the northeastern Tibetan Plateau and surrounding regions. Tectonophysics. 584:257–266. doi: 10.1016/j.tecto.2012.03.025.
- Hilley GE, BüRgmann R, Zhang P‐Z, Molnar P. 2005. Bayesian inference of plastosphere viscosities near the Kunlun Fault, northernTibet. Geophys Res Lett. 32(1):L01302. doi: 10.1029/2004GL021658.
- Jia K, Zhou SY, Zhuang JC, Jiang CS, Guo YC, Gao ZH, Gao SS. 2018. Did the 2008 MW7.9 Wenchuan earthquake trigger the occurrence of the 2017 MW6.5 Jiuzhaigou earthquake in Sichuan, China? JGR Solid Earth. 123(4):2965–2983. doi: 10.1002/2017JB015165.
- Jia K, Zhou SY, Zhuang JC, Jiang CS. 2021. Stress transfer along the western boundary of the Bayan Har block on the Tibet Plateau from the 2008 to 2020 Yutian earthquake sequence in China. Geophys Res Lett. 48(15):e2021G–e94125G. doi: 10.1029/2021GL094125.
- Jia K. 2021. Modeling the spatiotemporal seismicity patterns of the Longmen Shan Fault Zone based on the Coulomb rate and state model. Seismol Res Lett. 92(1):275–286. doi: 10.1785/0220200088.
- King GCP, Stein RS, Lin J. 1994. Static stress changes and the triggering of earthquakes. Bull Seismol Soc Am. 84:935–953. doi: 10.1785/0220200088.
- Laske G, Masters G, Ma Z, Pasyanos M. 2013. Update on CRUST1.0 – a 1-degree global model of earth’s crust. Geophys Res Abstracts. 15, EGU2013-2658.
- Li Y, Shan X, Qu C, Zhang Y, Song X, Jiang Y, Zhang G, Nocquet JM, Gong W, Gan W, et al. 2017. Elastic block and strain modeling of GPS data around the Haiyuan Liupanshan fault, northeastern Tibetan Plateau. J Asian Earth Sci. 150:87–97. doi: 10.1016/j.jseaes.2017.10.010.
- Li ZH, Han BQ, Liu ZJ, Zhang MM, Yu C, Chen B, Liu HH, Du J, Zhang SC, Zhu W, et al. 2022. Source parameters and slip distributions of the 2016 and 2022 Menyuan, Qinghai Earthquakes Constrained by InSAR Observations. Geomat Inform Sci Wuhan Univ. 47(6):887–897 (in Chinese).
- M7 Special Working Group. 2012. Study on the mid-to-long term potential of large earthquakes on the Chinese continent. Beijing: Seismological Press: p. 196 (in Chinese).
- Meng G, Su X, Xu W, Chen C, Cheng K, Wen S, Yeh T, Li P, Ohzono M, Takahashi H. 2019. Present-day strain accumulation in the Liupan Shan area, northeastern margin of the Tibetan Plateau by GPS observations. Terr Atmos Ocean Sci. 30(1):51–62. doi: 10.3319/TAO.2018.09.10.02.
- Ou Q, Kulikova G, Yu J, Elliott A, Parsons B, Walker R. 2020. Magnitude of the 1920 Haiyuan earthquake reestimated using seismological and geomorphological methods. JGR Solid Earth. 125(8):e2019JB019244. doi: 10.1029/2019.
- Pollitz FF, Banerjee P, Bürgmann R, Hashimoto M, Choosakul N. 2006. Stress changes along the Sunda trench following the 26 December 2004 Sumatra‐ Andaman and 28 March 2005 Nias earthquakes. Geophys Res Lett. 33(6):L06309. doi: 10.1029/2005GL024558.
- Ryder I, Bürgmann R, Pollitz F. 2011. Lower crustal relaxation beneath the Tibetan Plateau and Qaidam Basin following the 2001 Kokoxili earthquake. Geophys J Int. 187(2):613–630. doi: 10.1111/j.1365-246X.2011.05179.x.
- Pollitz FF, Cattania C. 2017. Connecting crustal seismicity and earthquake-driven stress evolution in Southern California. JGR Solid Earth. 122(8):6473–6490. doi: 10.1002/2017JB014200.
- Shao ZG, Fu RS, Xue TX, Huang JH. 2008. The numerical simulation and discussion on mechanism of postseismic deformation after Kunlun MS8.1 earthquake. Chin J Geophys. 51(3):805–816 (in Chinese).
- Shao Z, Xu J, Ma H, Zhang L. 2015. Coulomb stress evolution over the past 200 years and seismic hazard along the Xianshuihe fault zone of Sichuan, China. Tectonophysics. 670:48–65. doi: 10.1016/j.tecto.2015.12.018.
- Shen Z. 2003. Viscoelastic triggering among large earthquakes along the east Kunlun fault system. Chin J Geophys. 46(6):786–795 (in Chinese).
- Shen Z-K, Sun J, Zhang P, Wan Y, Wang M, Bürgmann R, Zeng Y, Gan W, Liao H, Wang Q, et al. 2009. Slip maxima at fault junctions and rupturing of barriers during the 2008 Wenchuan earthquake. Nature Geosci. 2(10):718–724. doi: 10.1038/ngeo636.
- Shi FQ, Shao ZG, Zhan W, Ding XG, Zhu L, Li YJ. 2018. Numerical modeling of the shear modulus and stress state of active faults in the northeastern margin of the Tibetan plateau. Chin J Geophys. 61(9):3651–3663 (in Chinese).
- Stein RS, Barka AA, Dieterich JH. 1997. Progressive failure on the North Anatolian fault since 1939 by earthquake stress triggering. Geophys JInt. 128(3):594–604. doi: 10.1111/j.1365-246X.1997.tb05321.x.
- Su X, Yao L, Wu W, Meng G, Su L, Xiong R, Hong S. 2018. Crustal deformation on the northeastern margin of the tibetan plateau from continuous GPS observations. Remote Sense. 11(1):34. doi: 10.3390/rs11010034.
- Sun J, Yue H, Shen Z, Fang L, Zhan Y, Sun X. 2018. The 2017 Jiuzhaigou Earthquake: a Complicated Event Occurred in a Young Fault System. Geophys Res Lett. 123(100):100–105.
- Tapponnier P, Zhiqin X, Roger F, Meyer B, Arnaud N, Wittlinger G, Jingsui Y. 2001. Oblique stepwise rise and growth of the Tibet Plateau. Science. 294(5547):1671–1677. doi: 10.1126/science.105978.
- Tang DW, Ge WP, Yuan DY, Zhen WJ, Hu CB. 2023. Triggering effect of historical earthquakes in the northern Tibetan Plateau on the Coulomb stress of the 2022 Menyuan MS6.9 earthquake and subsequent earthquakes. Chin J Geophys. 66(7):2772–2795. doi: 10.6038/cjg2023Q0400 (in Chinese).
- Toda S, Lin J, Meghraoui M, Stein RS. 2008. 12 May 2008 M = 7.9 Wenchuan, China,earthquake calculated to increase failure stress and seismicity rate on three major fault systems. Geophys Res Lett. 35(17):L17305. doi: 10.1029/2008GL034903.
- Wan YG, Shen ZK, Zeng YH, Sheng SZ. 2007. Evolution of cumulative Coulomb failure stress in northeastern QinghaiXizang (Tibetan) Plateau and its effect on large earthquake occurrence. Acta Seimol Sin. 20(2):117–132 (in Chinese). doi: 10.1007/s11589-007-0117-9.
- Wang JJ, Xu CJ, Freymueller JT, Li ZH, Shen W. 2014. Sensitivity of Coulomb stress change to the parameters of the Coulomb failure model: A case study using the 2008 Mw 7.9 Wenchuan earthquake. JGR Solid Earth. 119(4):3371–3392. doi: 10.1002/2012JB009860.
- Wallace RE, Davis JF, Mcnally KC. 1984. Terms for expressing earthquake potential, prediction, and probability. Bull Seismol Soc Am. 74(5):1819–1825.
- Wang M, Shen Z‐K, Wang Y‐Z, BüRgmann R, Wang F, Zhang P‐Z, Liao H, Zhang R, Wang Q, Jiang Z‐S, et al. 2021. Postseismic deformation of the 2008 Wenchuan earthquake illuminates lithospheric rheological structure and dynamics of eastern Tibet. JGR Solid Earth. 126(9):e2021JB0223. doi: 10.1029/2021JB022399.
- Wang R, Lorenzo-Martín F, Roth F. 2006. PSGRN/PSCMP-A new code for calculating co- and post-seismic deformation, geoid and gravity changes based on the viscoelastic-gravitational dislocation theory. Comput. Geosci. 32(4):527–541. doi: 10.1016/j.cageo.2005.08.006.
- Wessel P, Luis JF, Uieda L, Scharroo R, Wobbe F, Smith WHF, Tian D. 2019. The Generic Mapping Tools version 6. Geochem Geophys Geosyst. 20(11):5556–5564. doi: 10.1029/2019GC008515.
- Xiang HF, Guo SM, Zhang BL, Zhang WX, Yasutaka I, He HL. 1998. Active features of the eastern Liupanshan piedmont reverse fault zone since late Quaternary. Seismol Geol. 20(4):321–327 (in Chinese).
- Xu J, Shao ZG, Liu J, Ly J. 2019. Coulomb stress evolution and future earthquake probability along the eastern boundary of the Sichuan-Yunnan block. Chin J Geophys. 62(11):4189–4213. doi: 10.6038/cjg2019M0593 (in Chinese).
- Xu X, Zhang Z, Hu F, Chen X. 2019. Dynamic rupture simulations of the 1920 Ms 8.5 Haiyuan Earthquake in China. Bull Seismol Soc Am. 109(5):2009–2020. doi: 10.1785/0120190061.
- Yuan DY, Zhang PZ, Liu BC, Gan WJ, Mao FY, Wang ZC, Zheng WJ, Guo H. 2004. Geometrical imagery and tectonic transformation of late quaternary active tectonics in northeastern margin of Qinghai-Xizang Plateau. Acta Geol Sin. 78(2):270–278 (in Chinese).
- Zhang PZ, Zheng DW, Yin GM, Yuan DY, Zhang GL, Li CY, Wang ZC. 2006. Discussion on late Cenozoic growth and rise of northeastern margin of the Tibetan Plateau. Quat Sci. 26(1):5–13 (in Chinese).
- Zhang PZ. 2013. Beware of slowly slipping faults. Nature Geosci. 6(5):323–324. doi: 10.1038/ngeo1811.
- Zhang R, Zhang ZQ, Zheng DW, et al. 2021. Coulomb stress transfer of strong earthquakes within tectonic belts near western Ordos block. Chin J Geophys. 64(10):3576–3599. doi: 10.6038/cjg2021P0008 (in Chinese).
- Zheng WJ, Zhang PZ, Yuan DY, Zheng DW. 2009. Deformation on the northern of the Tibetan plateau from GPS measurement and geologic rates of Late Quaternary along the major fault. Geophys J (USA). 52(10):2491–2508 (in Chinese).
- Zhao D, Qu C, Bürgmann R, Gong W, Shan X. 2021. Relaxation of Tibetan lower crust and afterslip driven by the 2001 Mw7. 8 Kokoxili, China, earthquake constrained by a decade of geodetic measurements. JGR Solid Earth. 126(4):e2020JB021314. doi: 10.1029/2020JB021314.
- Zhu S. 2021. Estimation of seismic hazard around the Ordos Block of China based on spatial and temporal variations of b-values. Geomatics Nat Hazards Risk. 12(1):2048–2069. doi: 10.1080/19475705.2021.1949394.
- Zhu L, Dai Y, Shi FQ, Shao HC. 2022. Coulomb stress evolution and seismic hazards along the Qilian-Haiyuan fault zone. Acta Seismol Sin. 44(2):223–236 (in Chinese).