
 ?Mathematical formulae have been encoded as MathML and are displayed in this HTML version using MathJax in order to improve their display. Uncheck the box to turn MathJax off. This feature requires Javascript. Click on a formula to zoom.
Abstract
This study, conducted in the Banarli district of Tekirdag Province, Turkey, focuses on soil reaction analysis and liquefaction potential in an area where a landfill and an associated power plant are planned. The research was examined with a one-dimensional ground response analysis to understand seismic behaviour, revealing the varied responses of soil categories to seismic waves. Soft soil layers were found to lengthen the dominant period of oscillation rather than significantly enhancing peak acceleration during seismic events. Earthquake records specific to the region were crucial for accurate assessments. The study comprehensively assessed liquefaction potential using various estimation methods, including the probability of liquefaction (PL), liquefaction potential index (LPI), and liquefaction risk index (IR). Moreover, this study examined liquefaction potential based on Standard Penetration Test (SPT) results, identifying susceptibility in the clayey sand layer at a depth of 3 to 12 meters. Recommendations for soil improvement measures are made to mitigate the risk. This research highlights the need for “customized seismic protocols” and emphasizes the importance of “site-specific assessments” in construction projects. By addressing susceptibility to liquefaction and proposing targeted ground improvement strategies, we contribute to safer and more resilient infrastructure development.
1. Introduction
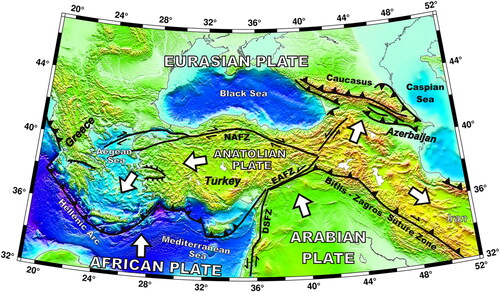
Natural earthquakes have resulted in the deaths of millions of people and widespread property damage over centuries. The Turkey earthquake territory is recognized as one of the most geo-dynamically active territories in the world, situated amidst the Eurasian, African, and Arabian plates, which have caused it to deform over time as depicted in .
Figure 1. Simplified tectonic map of the Turkey earthquake region and surroundings (compiled from Tan Citation2021).
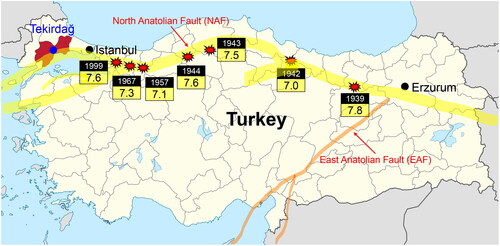
Recently, the Turkey-Syria border region experienced two back-to-back powerful earthquakes on February 6th, 2023. At 01:17 UTC, the initial earthquake of a magnitude of 7.8 occurred, followed by the next earthquake of magnitude 7.5 at 10:24 UTC (Naddaf Citation2023). A rapid damage assessment report by the World Bank released on February 27, 2023, announced that direct physical damages were estimated at around 34.2 billion dollars (Gunasekera et al. Citation2023). According to seismologists, it is inevitable that another earthquake will occur in the near future. In particular, the recent earthquake has increased the incidence of other strong earthquakes around the North Anatolian Fault Zone (NAFZ). illustrates the record of severe earthquakes that have taken place along the North Anatolian Fault (NAF) in Turkey. The diagram reveals that after the 1939 earthquake located east of the NAF, powerful earthquakes continued to strike towards the west along the fault line. In 1999, a strong earthquake measuring a magnitude of 7.6 occurred at Izmit, Istanbul the region close to the research area of this study. Due to the incident of a significant earthquake in the research area back in 1912, it is crucial to make arrangements for the potential destruction caused by earthquakes before constructing any buildings in proximity to the NAFZ.
Figure 2. Record of severe earthquakes along the NAF in Turkey.
Ground motions can be destructive and dangerous in seismically active regions depending on their magnitude, which has been the case since the formation of Earth. Ground motion refers to the ground vibration that occurs during an earthquake. Soil liquefaction is the primary factor that may cause significant damage during an earthquake and immediately afterward. This phenomenon occurs when loose soils are saturated and lose their strength as a result of dynamic loads caused by an earthquake and behave almost like a viscous liquid. This can occur in loose, water-saturated granular soils, like sand or silts when the pressure of the groundwater within the soil exceeds the effective stress holding the soil particles together. Thus, the soil loses its ability to support structures, leading to settlements, tilting, or even the collapse of buildings and infrastructure. Determining the soil liquefaction potential in advance, particularly in high earthquake-risk regions, is a crucial step in planning the construction of structures in such areas.
Over the past half-century, various methods for liquefaction analysis have emerged, combining laboratory and in-situ tests to evaluate the possibility of soil liquefaction. First, Seed and Idriss (Citation1967, Citation1971) emphasized the importance of analysing time-dependent variations in shear stress at different depths when assessing soil liquefaction possibility. Their study identified influential factors such as ground motion duration, soil strength, initial confining pressure, relative density or void ratio, and even soil type. Moreover, empirical techniques that depend on field tests are employed to predict soil liquefaction. Standard Penetration Test (SPT) is widely employed due to its simplicity and cost-effectiveness (Seed and Idriss Citation1981; Seed et al. Citation1983, Citation1985; Tokimatsu and Yoshimi Citation1983; Tokimatsu et al. Citation1994; Trifunac Citation1995; Kayabali Citation1996; Youd and Idriss Citation2001; Cetin et al. Citation2004; Boulanger and Idriss Citation2012; Tang et al. Citation2018; Zhang et al. Citation2020, Citation2021). SPT entails installing a split-spoon sampler into the subgrade and tallying the blow numbers required to penetrate to a specific depth. These counts are related to soil density, strength, and stiffness, allowing for liquefaction potential estimation. Another method, Cone Penetration Test (CPT), offers a more precise assessment but requires advanced equipment and can be costlier (Robertson and Wride Citation1998; Moss et al. Citation2006; Maurer et al. Citation2015; Shen et al. Citation2019). CPT entails inserting a cone-shaped penetrometer into the ground, gauging the resistance to penetration, and delivering continuous measurements of soil properties. Moreover, a geophysical method, shear wave velocity (Vs), measures soil stiffness by assessing shear wave velocity via the soil (Dobry et al. Citation1981; Andrus and Stokoe Citation2000; Zhou and Chen Citation2007; Kayen et al. Citation2013). Vs is associated with the elastic modulus of soils, aiding in estimating liquefaction potential.
The strength and attributes of ground shaking induced by earthquakes are shaped by an intricate interplay of various factors. These factors involve various characteristics of earthquake cause, such as its strength, depth, and type. Additionally, the propagation path, encompassing the distance and geological medium through which seismic waves move, plays a crucial role. Local site conditions further contribute significantly, encompassing the presence of soft soil deposits that can amplify ground shaking, basin structures that trap and reflect seismic waves, and surface topography that redirects and concentrates seismic energy. These factors collectively determine the severity and type of earthquake-induced ground shaking, playing a critical role in geotechnical engineering, especially in the context of liquefaction studies.
Çelebi (Citation1987) investigated topological amplification associated with the 1985 Chilean earthquake, providing a comprehensive examination of damage patterns observed in structures situated on both soft soil and ridges. The investigation concluded that surface flaws caused frequency-dependent amplification, which in turn caused non-traditional structural damage. Additionally, Çelebi (Citation1991) synthesized and analyzed case study results from three earthquakes, providing evidence supporting topographic amplification at specific frequencies. Furthermore, Poursartip et al. (Citation2017) examined the influence of topographic indiscretions on ground motion and local site response through parametric experiments in the frequency domain, utilizing standard two-dimensional features. Their work differs in that it evaluates the impact of idealized topographic features on surface mobility and compares it with reactions on flat surfaces. The study illustrates models representing both motion amplification and de-amplification. The effects of liquefiable soil on the seismic behaviour of the ground were examined by Huded and Dash (Citation2020), with a focus on acceleration, displacement, and spectral acceleration attenuation. These studies consider the impact of soil stratification on foundation design for liquefiable sites.
The literature extensively covers site response analysis and liquefaction sensitivity across diverse geological settings. Insights from these studies enhance our understanding of site-specific soil behaviour, seismic response, and liquefaction sensitivity, informing seismic hazard assessment and mitigation strategies in various geological contexts (Mase et al. Citation2018, Citation2019, Citation2022, Citation2023; Likitlersuang et al. Citation2020; Qodri et al. Citation2021). Furthermore, the progress of liquefaction studies has been propelled by the incorporation of artificial intelligence (AI), notably leveraging genetic programming algorithms (Muduli et al. Citation2014; Muduli and Das Citation2014, Citation2015a, Citation2015b; Zhou et al. Citation2022). The AI methods have the potential to offer several advantages in liquefaction analysis, such as improved prediction accuracy and efficiency. However, AI methods require large datasets for training, and the quality and availability of such data can be a limitation, especially for specific soil types or regions. Thus, traditional methods may rely on simpler data inputs and empirical correlations, showing more accurate reliability under specific conditions.
The primary objective of this research is to analyse soil liquefaction susceptibility and subsequent ground response in the Banarli district of Tekirdag province, Turkey. This investigation is particularly relevant due to the planned construction of a landfill and an associated energy generation power plant in the area. The study aims to identify potential hazards associated with soil liquefaction and propose effective soil enhancement techniques to mitigate these risks. Furthermore, this study seeks to examine soil behaviour during seismic events and recommends using a specific acceleration spectrum to accurately account for soil amplification. A crucial of this research involves advocating for the use of region-specific earthquake data in future construction projects or investigations, in line with prior research efforts. The insights gained from the liquefaction susceptibility assessments conducted in this study will provide valuable guidance for making informed design choices that address the inherent risks in the specified area.
2. Research area
2.1. Characteristics of the research area
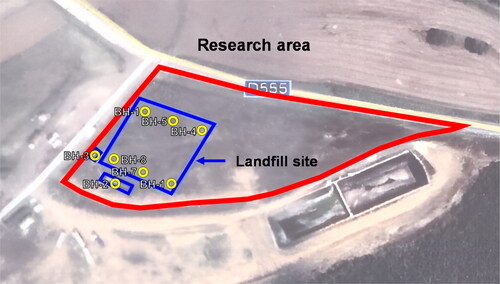
Banarli region was chosen as a research area to assess the potential and destructive effects of an expected Marmara earthquake in Tekirdag, Turkey. presents the satellite photo of the research area. This area is located within the boundaries of Banarli quarter, Suleymanpasa district, Tekirdag province, Turkey, approximately 22 km away from Suleymanpasa. It is situated at a latitude and longitude of 400 07′and 270 34′, and an altitude of 116 m. The extension of the North Anatolian Fault (NAF) region passing through the Western Marmara is where the most common earthquake activity occurs in the Sea of Marmara. The Marmara Sea and the surrounding area are placed within the 1st-degree earthquake region, and the Banarli region is very close to the NAF line. The research area is the proposed site for the Banarli landfill, and it is crucial to evaluate the risk of ground liquefaction in this area. By determining the liquefaction risk, potential material damages at the landfill can be prevented in advance.
Figure 3. Satellite photo of the research area-Banarli landfill site.
In the research area, the Miocene-aged Ergene formation and current alluvial deposit units are found predominantly. The Ergene formation consists of sand-silt-clay materials in various proportions (Okten and Yazicigil Citation2005). In addition, there are alluvial deposits with small thicknesses that consist of gravel, sand, clay, and silt materials in various proportions (Suleymanpasa Bld Citation2020). More detailed geological conditions of the research area will be presented in a further section.
2.2. Seismotectonic of the research area
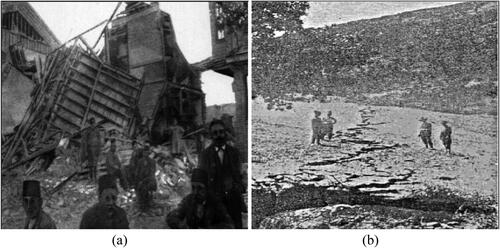
The NAF line is approximately 1,500 km long and contains a massive fracture caused by an earthquake in history. As shown in , this fault line was ruptured by the Murefte earthquake in 1912 and the Izmit earthquake in 1999 in the Marmara Sea region. The 1912 Murefte earthquake, also known as the Murefte-Sarkoy earthquake, was one of the major seismic incidents in the Thrace area in the twentieth century. This earthquake occurred on August 9, 1912, at the epicentre around Murefte village, Tekirdag in Turkey, and had an estimated magnitude of Ms 7.3. It was estimated that 2,800 people died, and 7,000 people were injured in this earthquake (Ambraseys and Finkel Citation1987; Ambraseys and Jackson Citation2000). shows photos of structural damage and surface rupture in the Murefte earthquake. Besides, another earthquake measuring a magnitude of Ms 6.8 took place at the epicentre located near Saros Gulf, further west of Murefte village on September 13, 1912, and it may indicate a 20–40 km long rupture (Aksoy et al. Citation2010).
Figure 4. Historical earthquakes (between 1912 and today) in the Marmara Sea region (compiled from Aksoy et al. Citation2010).
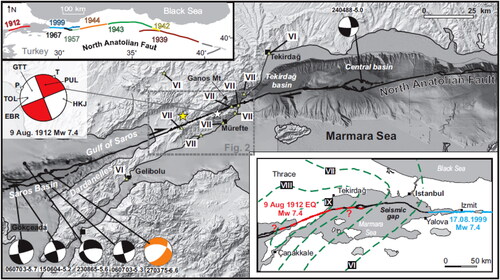
Figure 5. (a) Structural damages (compiled from Sadi Citation1912) and (b) surface ruptures (compiled from Ambraseys and Finkel Citation1987) in the murefte earthquake.
3. Local soil conditions
The most significant challenge in structural design is the precise calculation and consideration of the potential dynamic impacts of earthquakes on the ground. To realistically assess the effects of a future earthquake, one must consider properties of the ground surface in seismic events, in addition to probable soil behaviours. The engineering properties of the soil layers are altered by earthquake waves as they travel from the base rock layer to the surface. These alterations depend on the thickness and properties of the soil, resulting in changes to the amplitude of ground acceleration, length, and frequency characteristics of acceleration time recordings. This phenomenon amplifies the primary vibration periods, the layered soil acceleration amplitude, and the earthquake waves. "Soil amplification" is the term used to describe the event that amplifies earthquake waves, layered soil acceleration amplitude, and predominant vibration periods, having the potential to cause significant damage by triggering a semi-resonance event. This phenomenon significantly influences how structures are designed (Kramer Citation1996).
In the event of a potential earthquake, accurately estimating the behaviours of the strata that make up the ground beneath the structure foundations in the research region is imperative. Understanding the shear deformations that can occur in soil layers is crucial for a comprehensive analysis of the adverse effects of an earthquake and devising a strategy to reduce those consequences.
3.1. Influence of Local soil conditions on seismic response
During earthquake events, local soil conditions are important in influencing variations in the seismic wave intensity, contributing to potential ground shaking that can be highly destructive. The stiffness and thickness of soil conditions, varying from the bedrock to the surface at specific locations, significantly impact the severity of this destructiveness. The study of liquefaction, a topic in geotechnical engineering, is greatly affected by the interplay between ground motion parameters and dynamic soil properties. Increased soil movement is anticipated with rising intensity of ground motion, particularly evident in the upper soil layers composed of loose sediments with low shear resistance and a higher likelihood of liquefaction. The frequency, amount, and duration of ground shaking in seismic events can also be influenced by the surrounding terrain. The presence of features such as slopes, ridges, hills, cliffs, or canyons can affect the strength and incidence of shaking. Observations have shown that local ground conditions can impact the amount, frequency, and duration of shaking in numerous cases. The alteration of seismic waves as they pass through the ground, known as "ground amplification," may intensify or de-amplify certain wave components dependent on the natural frequencies of the soil bed. Seismic waves are attenuated as they approach the surface due to an increase in damping caused by tensions in soil deposits. Loose, soft soils, particularly prone to liquefaction, are more likely to experience this dampening effect.
During earthquakes, seismic waves passing via the earth’s crust can trigger ground tremors. The attenuation, or reduction in amplitude or strength of these waves as they pass through the ground, occurs due to the high stresses induced by cyclic loading. This process involves soil deformation, compression, and a decrease in volume, leading to increased pore water pressure in the soil, making the soil more resistant to further deformation. Seismic waves undergo attenuation due in part to significant hysteretic damping, a type of damping that dissipates energy during cyclic loading. This damping, influenced by factors such as ground type, frequency, and amplitude of seismic waves, is crucial to understanding the interactions between dynamic soil features, ground motion parameters, wave attenuation, and ground displacement.
It is essential to comprehend how these factors interact to anticipate and minimize the impacts of liquefaction. In geotechnical engineering, knowledge derived from this understanding can impact the development of more successful risk management strategies. It is important to note that this is a general description, and real mechanics may vary due to unique soil conditions and seismic activity features. Further investigation and experimental study are required to fully comprehend these intricate connections.
3.2. Site investigation
A representative soil profile for the research area was established through exploratory drilling procedures in the surrounding region (Suleymanpasa Bld Citation2020). In addition, the SPT-based method has the advantage of investigating liquefaction potential over other methods; therefore, SPT-based liquefaction analysis was used to assess soil behaviour in the research area under seismic load, and the latest the Turkish Building Earthquake Code (TBEC Citation2018) was applied to evaluate soil liquefaction potential identification. A total of 8 SPT tests were performed, but only 6 SPT results from the site where the landfill will be constructed were utilized for the liquefaction analysis. The outcomes of Standard Penetration Testing (NSPT) conducted in the field across six boreholes were subjected to a two-step calibration process. Initially, an energy correction (Er = 45%) was applied to account for variations in energy delivery. Subsequently, an overburden pressure correction factor (CN) was employed to further refine the results (Liao and Whitman Citation1986).
4. Methodology of seismicity assessment
4.1. Ground response analysis
In the context of this study, one-dimensional (1D) site response investigations were conducted in the Banarli region, Tekirdag province, designated as the primary research zone. Based on the results of exploratory drilling procedures and the subsequent development of an idealized soil profile, an analysis of the soil’s dynamic characteristics was carried out using the STRATA software program. This program employs a nonlinear analysis methodology outlined by Kottke and Rathje (Citation2008). These assessments explored the relationships between modulus reduction and damping, contingent upon the initial effective confining stress. The correlations proposed by Darendeli (Citation2001) were utilized to derive the normalized shear modulus (G/Go) and damping ratios (D) of the layers employed in the analyses, considering cyclic shear strains (γc). The significant influence of the initial effective confining tension on the strata is considered in this derivation.
4.2. Liquefaction analysis
The research integrated findings regarding the geology and seismic response of the landfill site, distances to earthquake epicentre, peak ground acceleration (PGA) during seismic events, the impact of fines content (FC), and the results of SPT tests performed at the landfill site into the liquefaction analyses. The SPT N value (NSPT) was utilized to assess soil behaviour and liquefaction potential under seismic loads in the research area. To determine the shear wave velocity (Vs) and maximum shear modulus (G0) of soil layers, SPT measurements were corrected using correction factors (Imai and Tonouchi Citation1982). Furthermore, the cyclic resistance ratio (CRR) was determined using the corrected NSPT value, followed by an analysis of the soil layer’s vulnerability to liquefaction.
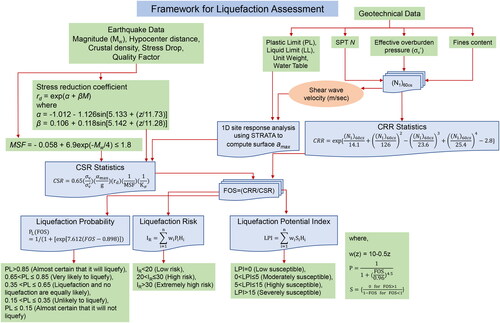
As specific guidelines for determining the magnitude of the design earthquake moment for liquefaction analysis are not available in Turkey, references and documents (BSSC Citation2009; ASCE Citation2013) were consulted to address this gap. These references highlighted the importance of aligning seismic magnitude with the severity level considered in seismic hazard assessment. Although deaggregation analysis was recommended in these guidelines, Turkey had not conducted such analyses, leading to the use of a deterministic approach. This involved examining earthquake catalogues for the Marmara upper region to identify the largest earthquake contributing to the seismic hazard. For the liquefaction analysis, an earthquake magnitude (Mw) and a maximum acceleration were determined and applied as 7.5 and 0.4 g, respectively. These values were based on the DD-2 Seismic Ground Motion category, as defined in accordance with TBEC (Citation2018). This category characterizes sparse seismic ground motion with a recurrence period of 475 years and a 10% possibility of exceeding peak ground accelerations over 50 years. The liquefaction potential assessment process is detailed in (Nath et al. Citation2018). The latest TBEC (Citation2018), which includes the new earthquake-resistant construction regulations, was applied for the liquefaction analysis of the landfill site.
Figure 6. Flowchart for the assessment of liquefaction potential (modified from Nath et al. Citation2018).
4.3. Probability of liquefaction (PL)
The safety factor functions as a tool for categorizing soil layers into safe or unsafe categories concerning soil liquefaction. However, in order to comprehensively understand this phenomenon, it is essential to estimate the liquefaction probability for each in-situ soil, considering the provided peak ground acceleration (PGA) and moment magnitude (Mw) (Nath et al. Citation2018). This estimation is accomplished by utilizing FS values derived from the formula proposed by Idriss and Boulanger (Citation2010), further refined by Juang et al. (Citation2012, Citation2013).
Juang et al. (Citation2012) conducted an extended series of maximum possibility evaluations, including 227 cases provided by Boulanger and Idriss (Citation2012). Juang et al. (Citation2012) integrated all input variables in their maximum possibility analysis, in contrast to the methodology of Boulanger and Idriss (Citation2012). As a result, the cyclic resistance ratio (CRR) and cyclic stress ratio (CSR) were both employed for calculating the safety factor. Their analysis comprised 20 models, with the optimal model, determined according to the Bayesian criterion (Schwarz Citation1978) and usability, evaluated as follows (Juang et al. Citation2012, Citation2013).
(1)
(1)
The assessed values were subsequently organized into categories using the classification system introduced by Chen and Juang (Citation2000), which can aid in interpreting the calculated liquefaction probability (Juang et al. Citation2013). The liquefaction categories, determined by liquefaction probability data from Chen and Juang (Citation2000), are presented in .
Table 1. Classification of liquefaction potential based on liquefaction probability (Juang et al. Citation2013).
4.4. Liquefaction potential index (LPI)
The liquefaction potential index (LPI) was initially proposed to evaluate the degree of liquefaction within the uppermost 20 m of a soil deposit at the location of a specific borehole (Iwasaki et al. Citation1978, Citation1982; Iwasaki Citation1986). Since liquefaction-induced surface effects are seldom documented beyond this depth, the computation of LPI has been limited accordingly (Toprak and Holzer Citation2003).
The extent of liquefaction correlates directly with the liquefied layer thickness, its distance from the surface, and the extent to which the safety factor falls below 1 (Nath et al. Citation2018). As a result, they defined LPI as a weighted integral of the product of these variables (Iwasaki et al. Citation1978, Citation1982).
(2)
(2)
where ‘n’ represents the layer number within the top 20 m of the soil deposit, while ‘w’ denotes the introduced weighting function employed to consider the degree of liquefaction concerning depth (Iwasaki et al. Citation1978, Citation1982; Iwasaki Citation1986).
(3)
(3)
where ‘z’ is the layer depth, ‘H’ denotes the thickness of layers, and ‘S’ is evaluated as follows.
(4)
(4)
Iwasaki et al. (Citation1982) established a scale for investigating the extent of damages caused by liquefaction as follows: an LPI value of 0 signifies no susceptibility to liquefaction, while values between 0 and 2 indicate low susceptibility, 2 to 5 suggest moderate susceptibility, 5 to 15 denote high susceptibility, and an LPI exceeding 15 indicates very high liquefaction possibility.
4.5. Liquefaction risk index (IR)
Lee et al. (Citation2004) introduced the concept of the liquefaction risk index (IR). The index was designed to map the risk of liquefaction, specifically focusing on the potential for induced ground failure in sediment layers located in the upper 20 m of the soil layer (Nath et al. Citation2018). The equation used to calculate the IR is as follows.
(5)
(5)
where,
(6)
(6)
In this equation, ‘n' represents the layer number within the 20 m depth of the subgrade, and ‘w' denotes the weighting function employed earlier in the calculation of the LPI. The ground failure potential is classified as minimal for an IR below 20, significant for an IR ranging between 20 and 30, and exceptionally high for an IR exceeding 30.
5. Result and discussion
5.1. Result of ground response analysis
Seismic input data, comprising acceleration records from seismic stations near the epicentres of the Kocaeli and Kobe earthquakes, were meticulously selected to ensure compatibility with the estimated earthquake magnitude, distance from the epicentre, and fault mechanism. Acceleration records of the Kocaeli and Kobe earthquakes, chosen from the literature and matching the estimated earthquake magnitude, distance, and faulting mechanism, were utilized as earthquake records. These records were gathered from the website of the Centre for Engineering Strong Motion Data (CESMD Citation2021) and the Regional Earthquake-Tsunami Monitoring and Evaluation Centre (RETMC) of Bogazici University Kandilli Observatory and Earthquake Research Institute (KOERI) (RETMC Citation2021). They serve as a valuable source for characterizing ground motion during earthquakes, crucial for engineering applications like seismic hazard analysis, building design, and earthquake-resistant design.
It’s essential to note that the proper selection of earthquake records, accurately reflecting the seismic hazard characteristics of a specific area, is crucial for effective seismic risk assessment and mitigation strategies. Utilizing seismic input data that precisely captures ground motion characteristics enables engineers and scientists to assess seismic hazards more accurately, making informed decisions in designing and constructing buildings and critical infrastructure. Therefore, the careful selection and utilization of appropriate earthquake records for seismic analysis are vital to ensuring the safety and resilience of communities in earthquake-prone regions. The acceleration and earthquake records related to the Kocaeli and Kobe earthquakes used in the analyses are presented in .
Table 2. Summary of acceleration and earthquake records of Kocaeli and Kobe earthquakes.
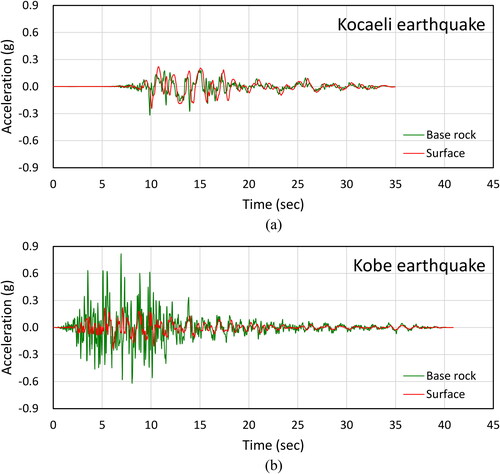
These earthquakes were applied to the soil profile at the base rock level to examine changes in the dynamic performances of the soils. Variations in the acceleration values calculated on the ground surface over time are presented comparatively in . Soil categories responded uniquely to seismic waves based on regional geology. The acceleration of the surface did not consistently increase peak acceleration in seismic motion; instead, it seemed to amplify the dominant vibration period, carrying significant implications. The 1D ground response analysis yielded findings about the seismic behaviour of structures, identifying key factors such as soil properties (e.g. shear resistance, seismic velocity, and amplification effects) and the vibration characteristics of structures.
Figure 7. Acceleration of (a) the Kocaeli and (b) Kobe earthquakes at base rock and surface.
In earthquake studies, one of the key aspects researchers focus on is the spectral behaviour of seismic events. Spectral behaviour refers to the distribution of energy in an earthquake across various frequencies. This distribution can offer valuable insights into the earthquake’s characteristics, such as its magnitude, depth, and the geological features of the area where it occurred. The primary purpose of the figures presented is to illustrate the differences in spectral behaviours among earthquakes. These differences are crucial for understanding the potential for liquefaction in various types of soils and under different seismic conditions. Spectral accelerations, calculated for a 5% damping ratio for each earthquake record applied to the soil profile at the base rock level, show the spectral characteristics of the system in . These figures aim to demonstrate the differences in spectral behaviours of earthquakes, with variations in peak ground accelerations, peak spectral accelerations, and predominant periods. As shown in , the influence of the frequency and characteristic features of the Kocaeli earthquake on soil performance is much greater compared to the Kobe earthquake. Predominant periods in earthquakes reflect the geotechnical behaviour of soft soil in the Kocaeli earthquake and stiff soil in the Kobe earthquake.
Figure 8. Spectral acceleration of (a) the Kocaeli and (b) Kobe earthquakes at base rock and surface.
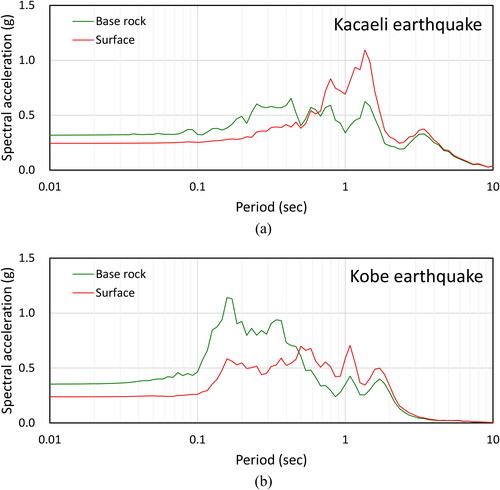
In the realm of civil and geotechnical earthquake engineering, the study of seismic waves and their interaction with soil layers is of paramount importance. The spectral acceleration graphs for the Kocaeli and Kobe earthquakes at the base rock and surface levels provide a compelling illustration of this interaction. The dynamic characteristics of soil layers, particularly their density, stiffness, and stratification, have an effect on the way that earthquake waves transmit from the bedrock to the surface. For both the Kocaeli and Kobe earthquakes, it is evident that spectral accelerations are considerably amplified at the surface compared to the base rock. This amplification is a direct consequence of the soil’s dynamic properties and their effect on earthquake waves. The frequency content and magnitude of these waves are influenced by factors such as soil stiffness, density, and layering. Each earthquake generates a unique set of stress waves that interact with the soil layers differently. These interactions lead to varied amplification patterns observable in their respective spectral acceleration graphs. The disparities in spectral accelerations for the Kocaeli and Kobe earthquakes, despite identical soil conditions, can be attributed to their unique frequency contents and magnitudes. The frequency content of the soil is notably influenced by these seismic records. Higher-frequency waves typically undergo greater damping and dispersion as they propagate upwards through the soil layers, resulting in the dominance of lower-frequency waves at the surface. These lower-frequency waves often possess larger amplitudes, thereby leading to higher spectral acceleration values. The frequency content of soils is crucial because it directly impacts the structural response during an earthquake. Different structures resonate with different frequencies, so varying frequency contents can lead to diverse damage patterns even under similar seismic intensities. Understanding this interaction helps engineers design structures that are resilient against specific seismic threats characteristic of their locations.
In conclusion, the observed phenomenon pertains to the modification and amplification of seismic waves as they traverse through soil layers from the bedrock to the surface. Consequently, the same seismic data can yield different spectral acceleration values under different soil conditions. This highlights the consequence of site-specific analyses and the need for a comprehensive understanding of soil behaviour under seismic activities for effective earthquake engineering. The transformation and amplification of seismic waves by soil is a critical aspect of earthquake engineering. This understanding enables engineers to more accurately predict how structures will respond to specific seismic threats.
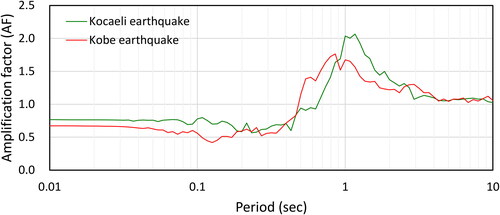
Amplification Factor (AF) charts were drawn for base rock and ground motions, and amplifications (ground surface spectrum/base rock spectrum) were obtained using the ratios given in these charts. The amplification spectra provided by the STRATA program (Kottke and Rathje Citation2008), computed as the ratios of Fourier modulus spectra of ground motion and base rock motion, are depicted comparatively in for each earthquake. Additionally, spectral acceleration amplification ratios confirm these cases, showing that the maximum amplification spectrum for the Kocaeli and Kobe earthquakes is around 2.0 and 1.7, respectively.
Figure 9. Amplification factor of the Kocaeli and Kobe earthquakes.
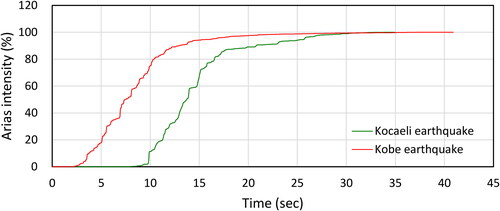
Arias intensities of the Kocaeli and Kobe earthquakes were determined and displayed in . The duration of 95% energy dissipation (td) was about 17.5 s for the Kobe earthquake, while this duration was about 22.5 s for the Kocaeli earthquake.
Figure 10. Arias intensity of the Kocaeli and Kobe earthquakes.
The seismic behaviour of the waste disposal site in the urban area of Tekirdag-Banarli is impacted by a confluence of factors, such as geological conditions and soil properties. These elements collectively influence the reaction of buildings and infrastructure to seismic events. The outcomes of the 1D ground response analysis have elucidated the impact of these factors on structures’ seismic performance within the Tekirdag-Banarli urban region. Moreover, this analysis has not only delineated zones with elevated potential for ground amplification but has also yielded valuable insights into how structures within a specific operational domain respond to seismic activity.
5.2. Site geology and liquefaction potential
The exploratory drilling in the research area aimed to determine the soil profile as part of the geotechnical study. Laboratory tests on one of the drillings identified the following soil types: topsoil between 0 m and 0.5 m, sandy clay (CL) between 0.5 m and 3 m, clayey sand (SC) between 3 m and 12 m, gravelly sand (GC) between 12 m and 13.5 m, and stiff clay (CL) between 13.5 m and 15 m, according to the Unified Soil Classification System (USCS). The unit weights of CL, SC, and GC were 18.7 kN/m³, 18.9 kN/m³, and 20.7 kN/m³, respectively. At a depth of 5 m, the groundwater level was revealed. Groundwater level measurements were taken for just one week, and seasonal changes (e.g. summer and winter) were not considered due to the short measurement period. provides a detailed soil profile of the research area.
Figure 11. Results of SPT test, shear wave velocity (Vs), and maximum shear modulus (G0) in consequence of soil profile.
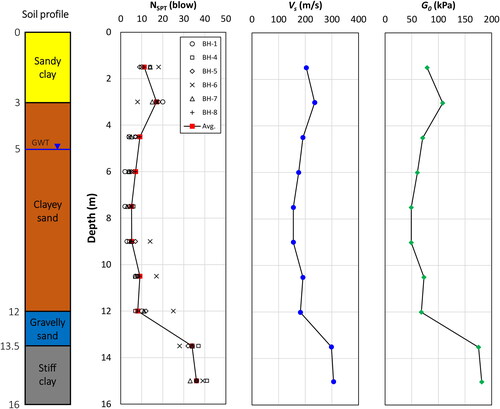
Since there was no significant variation in the unit weights in the clayey sand layers both above and below the groundwater level, a unit weight of 19 kN/m³ was applied for liquefaction calculations for both layers. As previously described, the results of six SPT tests were used, and the NSPT values were averaged. Through the utilization of correction factors, the Vs and G0 of soil layers were ascertained using the NSPT values. presents uncorrected and averaged NSPT values, as well as the results of Vs and G0 with respect to depths, which were utilized in the ground response analysis.
To assess the risk of liquefaction, the probability of liquefaction (PL), the liquefaction potential index (LPI), and the liquefaction risk index (IR) were evaluated. illustrates liquefaction probability relative to soil depth in the Banarli area, including soils with liquefaction potential. Further analyses revealed that soil layers classified as unsafe also possess liquefaction potential. presents the result of the liquefaction potential index, showing soil layers with potential for liquefaction in the Banarli region. Those classified as unsafe exhibit a high LPI. Additionally, displays liquefaction risk index results, suggesting soil layers with potential for liquefaction. Soil layers previously classified as unsafe are identified as high-risk according to the liquefaction risk index. Finally, the liquefaction analysis results were driven by the fundamental objective of adhering to the seismic safety principles and considerations stipulated in the regulations, all the while intricately navigating the multifaceted dynamics inherent in the process of liquefaction analysis. The CRR was estimated with the corrected NSPT values; by incorporating the latest provisions outlined in the Turkish Building Earthquake Code (TBEC Citation2018), the factor of safety (FS) against liquefaction susceptibility was meticulously evaluated across various depths, visually represented in .
Figure 12. Results of (a) the probability of liquefaction (PL), (b) liquefaction potential index (LPI), and (c) liquefaction risk index (IR) in the Banarli area.
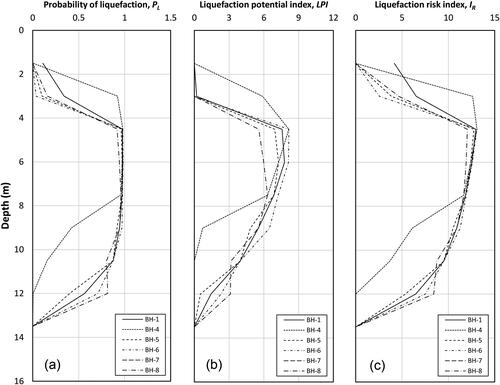
Figure 13. Cyclic resistance ratio results and factor of safety found by using liquefaction analysis by soil profile.
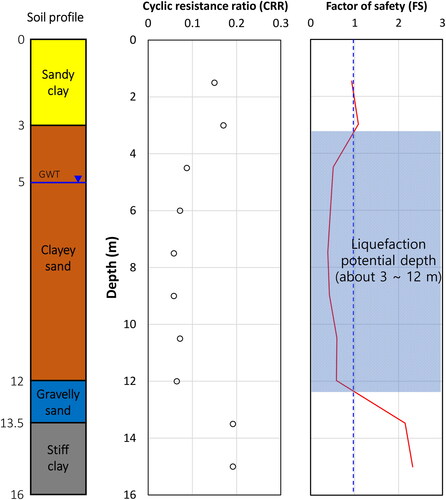
In alignment with the relevant regulatory norms, FS values exceeding “1” present a reduced probability of soil experiencing liquefaction. Conversely, when the FS value drops below 1, the potential for soil liquefaction under the influence of seismic forces becomes more conceivable. As a result, within the specific context under scrutiny, the clayey sand layer extending from a depth range of 3 m to 12 m is projected to exhibit conditions conducive to soil liquefaction occurrence. Given this inherent vulnerability, it becomes imperative to institute ground improvement measures to ameliorate the potential for liquefaction within this geological stratum.
5. Conclusions
Understanding earthquake effects on the ground surface and soil behaviours is essential for accurate earthquake impact assessment. Precisely addressing dynamic earthquake effects is a key challenge in structural design. Earthquake waves traveling from base rock to the surface alter soil properties, causing amplification or de-amplification of ground acceleration and shifts in acceleration time record characteristics. This soil amplification, including layered soil acceleration and predominant vibration period amplification, can trigger significant damage. Thus, comprehending soil behaviours during earthquakes and resulting shear deformations under a structure’s foundations aids in assessing seismic impacts and devising effective mitigation strategies. Our comprehensive investigation into soil liquefaction and ground response analysis within the Banarli district of Tekirdag province, Turkey, has yielded significant insights into the seismic susceptibility of the region. The key findings and observations presented herein substantiate the significance of our research.
First, the soil profile was established through field and laboratory examinations. In doing so, the quantitative characterization of granulometric attributes and soil particle distribution, facilitated by sieve analysis, has unveiled the specific particle size distributions inherent within the various soil layers under investigation. This granulometric analysis has played an instrumental role in the assessment of volumetric mutability and initial compaction-induced water permeability of the soil, lending critical insights into its geotechnical properties. Also, the exploration of groundwater table depth in the Banarli district has revealed a noteworthy geological feature, the subsurface positioning of the groundwater table, which consistently lies beneath the ground surface. This hydrogeological characteristic assumes pivotal importance in elucidating the diminished effective stress within the soil, thereby accentuating its predisposition to liquefaction.
A 1D ground response analysis was conducted to investigate the soil behaviour of the site and surrounding structures in a possible earthquake. The analysis relied on earthquake records to examine the soil structure response, investigating the dynamic behaviour of soils located within the soil profile at the base rock level. During seismic events, the intricate interplay between soil types and structures emerged. Soil categories exhibited distinct responses to seismic waves contingent upon factors such as wave propagation speed, reflection, and absorption characteristics. This behavioural variability was influenced not solely by the geological conditions unique to a specific region but was also intricately tied to the structural design and composition of the underlying ground. The empirical observation that soft soil layers did not uniformly lead to a consistent increase in peak acceleration during seismic motion, but rather contributed to the amplification of the dominant vibration period within the acceleration spectrum, held significant implications. This observation provides valuable insight into the intricate behaviour demonstrated by soil classifications within the context of the Banarli landfill site, which is currently being investigated for its liquefaction susceptibility, and its responsive characteristics when subjected to the dynamic forces of earthquakes. The maximum amplification spectrum of the Kocaeli earthquake was 15% greater than that of the Kobe earthquake. In addition, for the Kobe earthquake, the 95% energy dissipation duration (td) lasted approximately 17.5 s, whereas it extended to about 22.5 s during the Kocaeli earthquake.
In addition to the ground response analysis. The risk of liquefaction was also investigated by estimating the probability of liquefaction, liquefaction potential index, and liquefaction risk index were estimated. In addition, the SPT-based liquefaction analysis was conducted to determine the earthquake behaviour of soil conditions. The results unequivocally demonstrated that the safety factor against liquefaction pertaining to the clayey sand layer under scrutiny points to a substantial risk of liquefaction occurrence. Especially, FS values consistently fell below the critical threshold, unequivocally underscoring the pronounced vulnerability of this specific geological stratum. The liquefaction susceptibility of the clayey sand stratum across the depth of 3 meters to 12 meters surpassed the critical threshold of 1.0, thereby underscoring the extensive vulnerability inherent within this geological layer.
In geotechnical engineering, the factor of safety has long been regarded as an essential statistic for assessing the susceptibility of liquefaction. However, new avenues for a more nuanced understanding of liquefaction investigations have emerged with the introduction of novel metrics (e.g. liquefaction potential index, liquefaction severity number). Future liquefaction research stands to benefit significantly from the incorporation of these parameters, as they will enhance the depth of analysis and improve the comparative validity of findings, thus advancing liquefaction interpretation techniques. This study not only revealed the significance of using earthquake data that is appropriate for the region in future research but also emphasized the importance of doing so. It highlights the importance of utilizing earthquake records suitable for the region in future investigations or constructions. This finding is consistent with our study, which also underscored the significance of using the earthquake record appropriate for the region in future studies. Soil properties and seismic activity impact earthquake mechanics; further research and experimental work are required to fully understand these complex relationships. Nevertheless, the liquefaction potential analyses gathered from this study will be valuable for making design decisions that align with the awareness of risks in the area. In summary, the ongoing progress in understanding soil characteristics, seismic events, and the mechanics of earthquakes is leading toward communities that are safer and more robust. By incorporating this understanding into civil engineering practices, we can effectively reduce the risks associated with earthquakes and bolster the safety and resilience of our built environment. This article aims to highlight the significance of continued research in this domain and its potential to shape future communities.
Data availability statement
The research data of this study can be obtained by requesting the corresponding author.
Disclosure statement
The authors report there are no competing interests to declare.
Additional information
Funding
References
- Aksoy ME, Meghraoui M, Vallée M, Çakır Z. 2010. Rupture characteristics of the AD 1912 Murefte (Ganos) earthquake segment of the North Anatolian fault (Western Turkey). Geology. 38(11):991–994. doi: 10.1130/G31447.1.
- Ambraseys N, Finkel C. 1987. The Saros-Marmara earthquake of 9 August 1912. Earthq Engng Struct Dyn. 15(2):189–211. doi: 10.1002/eqe.4290150204.
- Ambraseys N, Jackson J. 2000. Seismicity of the Sea of Marmara (Turkey) since 1500. Geophy J Int. 141(3):F1–F6. doi: 10.1046/j.1365-246x.2000.00137.x.
- Andrus RD, Stokoe KH. 2000. Liquefaction resistance of soils from shear-wave velocity. J Geotech Geoenviron Eng. 126(11):1015–1025. doi: 10.1061/(ASCE)1090-0241(2000)126:11(1015).
- American Society of Civil Engineers (ASCE). 2013. Minimum Design Loads for Buildings and Other Structures. Reston, VA, USA: ASCE/SEI, p. 7–10.
- Boulanger RW, Idriss I. 2012. Probabilistic standard penetration test-based liquefaction-triggering procedure. J Geotech Geoenviron Eng. 138(10):1185–1195. doi: 10.1061/(ASCE)GT.1943-5606.0000700.
- Building Seismic Safety Council (BSSC). 2009. NEHRP recommended seismic provisions for new buildings and other structures, Part 3 Resource papers. Washington, D.C., USA.: FEMA, p. 341–363
- Çelebi M. 1987. Topographical and geological amplifications determined from strong-motion and aftershock records of the 3 March 1985 Chile earthquake. B Seismol Soc Am. 77(4):1147–1167. doi: 10.1785/BSSA0770041147.
- Çelebi M. 1991. Topographical and geological amplification: case studies and engineering implications. Struct Saf. 10(1-3):199–217. doi: 10.1016/0167-4730(91)90015-2.
- CESMD. 2021. Centre of engineering strong motion data. https://www.strongmotioncenter.org/cgi-bin/CESMD/search_options.pl. Accessed on 1 Mar 2021.
- Cetin KO, Seed RB, Der Kiureghian A, Tokimatsu K, Harder LF, JrKayen RE, Moss RE. 2004. Standard penetration test-based probabilistic and deterministic assessment of seismic soil liquefaction potential. J Geotech Geoenviron Eng. 130(12):1314–1340. doi: 10.1061/(ASCE)1090-0241(2004)130:12(1314).
- Chen CJ, Juang CH. 2000. Calibration of SPT-and CPT-based liquefaction evaluation methods. In: innovations and applications in geotechnical site characterization 2000, Geo-Denver 2000, Denver, Colorado, 5-8 Aug 2000. Reston, VA, USA: ASCE, p. 49–64. doi: 10.1061/9780784405055.
- Darendeli MB. 2001. Development of a new family of normalized modulus reduction and material damping curves [Ph.D. dissertation]. University of Texas at Austin.
- Dobry R, Stokoe KH, Ladd RS, Youd TL. 1981. Liquefaction susceptibility from S-wave velocity. In In-Situ Tests to Evaluate Liquefaction Susceptibility, St. Louis, Missouri: ASCE National Convention, Oct 1981, p. 26–31.
- Gunasekera R, Ishizawa E, Oscar A, Daniell JE, Pomonis A, Macabuag JLDC, Brand J, Schaefer A, Romero R, Esper S, et al. 2023. Global rapid post-disaster damage estimation (GRADE) Report: Feb 6, 2023, Kahramanmaras Earthquakes—Turkiye Report (English). World Bank Group, Washington, D.C. http://documents.worldbank.org/curated/en/099022723021250141/P1788430aeb62f08009b2302bd4074030fb.
- Huded PM, Dash SR. 2020. Seismic Wave Propagation in Layered Liquefiable Soils. In Prashant, A., Sachan, A., Desai, C. (Eds.) Advances in Computer Methods and Geomechanics, IACMAG Symposium 2019, Lecture Notes in Civil Engineering 55, p. 417–428. Singapore: Springer. doi: 10.1007/978-981-15-0886-8_34.
- Idriss IM, Boulanger RW. 2010. SPT-based liquefaction triggering procedures. Rep. UCD/CGM-10-2.
- Imai T, Tonouchi K. 1982. Correlation of N-value with S-wave velocity and shear modulus. In: The 2nd European Symposium on Penetration Testing, Balkema, Amsterdam, 24–27 May 1982, pp p. 67–72.
- Iwasaki T. 1986. Soil liquefaction studies in Japan: state-of-the-art. Soil Dyn Earthq Eng. 5(1):2–68. doi: 10.1016/0267-7261(86)90024-2.
- Iwasaki T, Tatsuoka F, Tokida K, Yasuda S. 1978. A practical method for assessing soil liquefaction potential based on case studies at various sites in Japan. In: Proc. of 2nd Int. National Conf. on Microzonation, Sanfrancisco, California, 26 Nov-1 Dec 1978, Vol. 2, p. 885–896.
- Iwasaki T, Tokida K, Tatsuoka F, Watanabe S, Yasuda S, Sato H. 1982. Microzonation for soil liquefaction potential using simplified methods. In: Proc. of the 3rd Int. Conf. on Microzonation, Seattle, Washington, 28 Jun 1982, Vol. 3(2), p. 1310–1330.
- Juang CH, Ching J, Luo Z, Ku CS. 2012. New models for probability of liquefaction using standard penetration tests based on an updated database of case histories. Eng Geol. 133-134:85–93. doi: 10.1016/j.enggeo.2012.02.015.
- Juang CH, Ching J, Luo Z. 2013. Assessing SPT-based probabilistic models for liquefaction potential evaluation: a 10-year update. Georisk. 7(3):137–150. doi: 10.1080/17499518.2013.778117.
- Kayabali K. 1996. Soil liquefaction evaluation using shear wave velocity. Eng Geol. 44(1-4):121–127. doi: 10.1016/S0013-7952(96)00063-4.
- Kayen R, Moss RES, Thompson EM, Seed RB, Cetin KO, Kiureghian AD, Tanaka Y, Tokimatsu K. 2013. Shear-wave velocity-based probabilistic and deterministic assessment of seismic soil liquefaction potential. J Geotech Geoenviron Eng. 139(3):407–419. doi: 10.1061/(ASCE)GT.1943-5606.0000743.
- Kottke AR, Rathje EM. 2008. Technical Manual for Strata (Report No. 2008/10). Berkeley: Pacific Earthquake Engineering Research Center, University of California.
- Kramer SL. 1996. Geotechnical earthquake engineering. New Delhi: Pearson Education India.
- Lee DH, Ku CS, Yuan H. 2004. A study of the liquefaction risk potential at Yuanlin, Taiwan. Eng Geol. 71(1-2):97–117. doi: 10.1016/S0013-7952(03)00128-5.
- Liao SS, Whitman RV. 1986. Overburden correction factor for SPT in Sand. J Geotech Engrg. 112(3):373–377. doi: 10.1061/(ASCE)0733-9410(1986)112:3(373).
- Likitlersuang S, Plengsiri P, Mase LZ, Tanapalungkorn W. 2020. Influence of spatial variability of ground on seismic response analysis: a case study of Bangkok subsoils. Bull Eng Geol Environ. 79(1):39–51. doi: 10.1007/s10064-019-01560-9.
- Mase, Lindung Zalbuin, Agustina, Sintia, Farid, Muchammad, Supriani, Fepy, Tanapalungkorn, Weeradecth, Likitlersuang, Suched, Hardiansyah, 2023. Application of simplified energy concept for liquefaction prediction in Bengkulu City, Indonesia. Geotech Geol Eng, 341: 1999–2021. doi: 10.1007/s10706-023-02388-7.
- Mase LZ, Likitlersuang S, Tobita T. 2018. Non-linear site response analysis of soil sites in northern Thailand during the Mw 6.8 Tarlay earthquake. EJ. 22(3):291–303. doi: 10.4186/ej.2018.22.3.291.
- Mase LZ, Likitlersuang S, Tobita T. 2019. Cyclic behaviour and liquefaction resistance of Izumio sands in Osaka, Japan. Mar Geores Geotechnol. 37(7):765–774. doi: 10.1080/1064119X.2018.1485793.
- Mase LZ, Likitlersuang S, Tobita T. 2022. Verification of liquefaction potential during the strong earthquake at the border of Thailand-Myanmar. J Earthqu Eng. 26(4):2023–2050. doi: 10.1080/13632469.2020.1751346.
- Maurer BW, Green RA, Cubrinovski M, Bradley BA. 2015. Assessment of CPT-based methods for liquefaction evaluation in a liquefaction potential index framework. Géotechnique. 65(5):328–336. doi: 10.1680/geot.SIP.15.P.007.
- Moss RE, Seed RB, Kayen RE, Stewart JP, Der Kiureghian A, Cetin KO. 2006. CPT-based probabilistic and deterministic assessment of in situ seismic soil liquefaction potential. J Geotech Geoenviron Eng. 132(8):1032–1051. doi: 10.1061/(ASCE)1090-0241(2006)132:8(1032).
- Muduli PK, Das SK, Bhattacharya S. 2014. CPT-based probabilistic evaluation of seismic soil liquefaction potential using multi-gene genetic programming. Georisk. 8(1):14–28. doi: 10.1080/17499518.2013.845720.
- Muduli PK, Das SK. 2014. Evaluation of liquefaction potential of soil based on standard penetration test using multi-gene genetic programming model. Acta Geophys. 62(3):529–543. doi: 10.2478/s11600-013-0181-6.
- Muduli PK, Das SK. 2015a. First-order reliability method for probabilistic evaluation of liquefaction potential of soil using genetic programming. Int J Geomech. 15(3):04014052. doi: 10.1061/(ASCE)GM.1943-5622.0000377.
- Muduli PK, Das SK. 2015b. Model uncertainty of SPT-based method for evaluation of seismic soil liquefaction potential using multi-gene genetic programming. Soils Found. 55(2):258–275. doi: 10.1016/j.sandf.2015.02.003.
- Naddaf M. 2023. Turkey-Syria earthquake: what scientists know. Nature. 614(7948):398–399. doi: 10.1038/d41586-023-00364-y.
- Nath SK, Srivastava N, Ghatak C, Adhikari MD, Ghosh A, Sinha Ray SP. 2018. Earthquake induced liquefaction hazard, probability and risk assessment in the city of Kolkata, India: its historical perspective and deterministic scenario. J Seismol. 22(1):35–68. doi: 10.1007/s10950-017-9691-z.
- Okten S, Yazicigil H. 2005. Investigation of safe and sustainable yields for the sandy complex aquifer system in the Ergene River Basin, Thrace Region, Turkey. Turk J Earth Sci. 14(2):209–226. https://journals.tubitak.gov.tr/earth/vol14/iss2/5.
- Poursartip B, Fathi A, Kallivokas LF. 2017. Seismic wave amplification by topographic features: a parametric study. Soil Dyn Earthq Eng. 92:503–527. doi: 10.1016/j.soildyn.2016.10.031.
- Qodri MF, Mase LZ, Likitlersuang S. 2021. Non-linear site response analysis of Bangkok subsoils due to earthquakes triggered by Three Pagodas Fault. EJ. 25(1):43–52. doi: 10.4186/ej.2021.25.1.43.
- RETMC. 2021. Regional Earthquake-Tsunami Monitoring Centre. http://www.koeri.boun.edu.tr/sismo/2/deprem-verileri/sayisal-veriler/veri-indirme-miniseed/. Accessed 1 Mar 2021.
- Robertson PK, Wride CE. 1998. Evaluating cyclic liquefaction potential using the cone penetration test. Can Geotech J. 35(3):442–459. doi: 10.1139/t98-017.
- Sadi M. 1912. Movement of the Marmara basin (Marmara Havzasýnýn 26-27 Temmuz Hareket-i Arzi 15 Eylul 1328, Resimli Kitap Mat). Bull Am Astron Soc. 1:45.
- Schwarz G. 1978. Estimating the dimension of a model. Ann Stat. 6(2):461–464. https://www.jstor.org/stable/2958889.
- Seed HB, Idriss IM. 1967. Analysis of soil liquefaction: Niigata earthquake. J Soil Mech and Found Div. 93(3):83–108. doi: 10.1061/JSFEAQ.0000981.
- Seed HB, Idriss IM. 1971. Simplified procedure for evaluating liquefaction potential. J Soil Mech and Found Div. 97(9):1249–1273. doi: 10.1061/JSFEAQ.0001662.
- Seed HB, Idriss IM. 1981. Evaluation of liquefaction potential of sand deposits based on observations of performance in previous earthquakes. ASCE, Preprint 81:544.
- Seed HB, Idriss IM, Arango I. 1983. Evaluation of liquefaction potential using field performance data. J Geotech Engrg. 109(3):458–482. doi: 10.1061/(ASCE)0733-9410(1983)109:3(458).
- Seed HB, Tokimatsu K, Harder LF, Chung RM. 1985. Influence of SPT procedures in soil liquefaction resistance evaluations. J Geotech Engrg. 111(12):1425–1445. doi: 10.1061/(ASCE)0733-9410(1985)111:12(1425).
- Shen M, Juang CH, Ku CS, Khoshnevisan S. 2019. Assessing effect of dynamic compaction on liquefaction potential using statistical methods—a case study. Georisk. 13(4):341–348. doi: 10.1080/17499518.2019.1623407.
- Suleymanpasa Bld. 2020. Geotechnical report for the energy generation power plant building (Mavi Jeoteknik) (Report No. V202006030). Suleymanpasa Belediyesi (Suleymanpasa Municipality), Turkey.
- Tan O. 2021. A homogeneous earthquake catalogue for Turkey. Nat Hazards Earth Syst Sci. 21(7):2059–2073. doi: 10.5194/nhess-21-2059-2021.
- Tang XW, Bai X, Hu JL, Qiu JN. 2018. Assessment of liquefaction-induced hazards using Bayesian networks based on standard penetration test data. Nat Hazards Earth Syst Sci. 18(5):1451–1468. doi: 10.5194/nhess-18-1451-2018.
- TBEC. 2018. Turkish Building Earthquake Code [Turkiye Bina Deprem Yonetmeligi]. Ankara: T.C. Resmi Gazete.
- Tokimatsu K, Kojima H, Kuwayama S, Abe A, Midorikawa S. 1994. Liquefaction-induced damage to buildings in 1990 Luzon earthquake. J Geotech Engrg. 120(2):290–307. doi: 10.1061/(ASCE)0733-9410(1994)120:2(290).
- Tokimatsu K, Yoshimi Y. 1983. Empirical correlation of soil liquefaction based on SPT N-value and fines content. Soils Found. 23(4):56–74. doi: 10.3208/sandf1972.23.4_56.
- Toprak S, Holzer TL. 2003. Liquefaction potential index: field assessment. J Geotech Geoenviron Eng. 129(4):315–322. doi: 10.1061/(ASCE)1090-0241(2003)129:4(315).
- Trifunac MD. 1995. Empirical criteria for liquefaction in sands via standard penetration tests and seismic wave energy. Soil Dyn Earthq Eng. 14(6):419–426. doi: 10.1016/0267-7261(95)00016-N.
- Youd TL, Idriss IM. 2001. Liquefaction resistance of soils: summary report from the 1996 NCEER and 1998 NCEER/NSF workshops on evaluation of liquefaction resistance of soils. J Geotech Geoenviron Eng. 127(4):297–313. doi: 10.1061/(ASCE)1090-0241(2001)127:4(297).
- Zhang J, Wang T, Xiao S, Gao L. 2021. Chinese code methods for liquefaction potential assessment based on standard penetration test: an extension. Soil Dyn Earthq Eng. 144:106697. doi: 10.1016/j.soildyn.2021.106697.
- Zhang J, Xiao S, Huang H, Zhou J. 2020. Calibrating a standard penetration test based method for region-specific liquefaction potential assessment. Bull Eng Geol Environ. 79(10):5185–5204. doi: 10.1007/s10064-020-01815-w.
- Zhou J, Huang S, Zhou T, Armaghani DJ, Qiu Y. 2022. Employing a genetic algorithm and grey wolf optimizer for optimizing RF models to evaluate soil liquefaction potential. Artif Intell Rev. 55(7):5673–5705. doi: 10.1007/s10462-022-10140-5.
- Zhou YG, Chen YM. 2007. Laboratory investigation on assessing liquefaction resistance of sandy soils by shear wave velocity. J Geotech Geoenviron Eng. 133(8):959–972. doi: 10.1061/(ASCE)1090-0241(2007)133:8(959).