
Abstract
Various natural and human-induced processes operating across different temporal scales contribute to the spatial and temporal evolution of shoreline alterations. Deltaic coasts, particularly dynamic geomorphic systems, experience continuous changes at various spatial and temporal dimensions. This investigation underscores the effectiveness of Sentinel-1 Synthetic Aperture Radar (SAR) data in assessing long-term shifts in shoreline positions, focusing on the Niger Delta region. Out of 255 images from 2015 to 2020, 36 were selected based on high tide conditions for each year. This study has pioneered a straightforward and systematic approach rooted in Geographic Information Systems (GIS). This approach offers an accessible pathway for evaluating coastal changes in regions with limited data availability. To better comprehend the heterogeneity of change processes along the shoreline and to pinpoint their causes and mechanisms, we divided the shoreline into distinct sediment cells. This division adheres to a convenient and well-established methodology. This study identifies prevailing erosion trends outweighing accretion, with specific areas showing distinct erosion (cells II, IV, VI, VII, and VIII) and accretion (cells I, III, and V) patterns. Furthermore, coastal areas near river mouths exhibit a higher susceptibility to change. This approach offers a pathway for evaluating coastal changes in data-limited regions and can establish an effective monitoring system benefiting coastal modellers, scientists, and government agencies. It lays the groundwork for comprehensive coastal zone frameworks, facilitating improved planning and management strategies.
1. Introduction
Coastal shorelines can be defined as the physical interfaces between land and water bodies (Boak and Turner Citation2005). Anthropogenic and natural processes acting on multiple time scales cause their spatial and temporal evolution. Long-term changes in land and sea elevations are primarily driven by changes in relative elevation. At shorter time scales, the movement of sediment caused by wave action, nearshore currents, and fluvial processes is the primary cause of change in their positions (Ashton et al. Citation2001, Antolínez et al. Citation2016). Natural variations in external forcing factors such as rainfall and wind speed and direction affect the magnitude and frequency distributions of sediment transport processes. Storm intensity and frequency fluctuations are important, and extreme events such as tsunamis or tropical cyclones can hasten sediment transport and, as a result, the evolution of shoreline morphology, causing significant change. Accelerated sea level rise could perhaps contribute to shoreline change, especially in low-lying regions, by altering the exposure to various morphodynamic forces (Nicholls Robert and Cazenave Citation2010). Shoreline trend can also be strongly influenced by anthropogenic changes in terrestrial feeder catchments that alter river water and sediment discharge, such as deforestation or the construction of dams; the construction of man-made structures at the coast, such as coastal defence structures, breakwaters, and jetties (Komar Citation2000, Del Río et al. Citation2013); and other human coastal activities like as natural resource extraction, land reclamation, and tourism (Syvitski James et al. Citation2005).
The sediment movements that determine shorter (decadal and less) time scale changes in shoreline position may be conceptualised within a framework of coastal cells, which was introduced by Bowen and Lnman (Citation1966), and has been widely used since in a research context, for example along the coasts of Florida, USA (Stapor Citation1971), England and Wales (Motyka and Brampton Citation1993, Hooke and Bray Citation1995), the Netherlands (Do et al. Citation2019), and Apulia, Italy (Armenio et al. Citation2019), Bight of Benin (Anthony et al. Citation2019) among many others, and by coastal managers in assessing coastal erosion and identifying the best mitigation strategies to deploy. Coastal cells are defined as regions of self-contained circulation of sediment along coastlines, whose sediment budget is largely isolated from neighbouring stretches of coast.
This research focuses on shoreline positional change along the Niger delta coast between the mouths of the Bonny River and Cross rivers. Deltaic coasts are exceptionally dynamic geomorphic systems in which continuous changes occur on a variety of spatial and temporal scales. Many previous studies have reported coastal change in deltas including Cox’s Bazar (Mahamud and Takewaka Citation2018), Yellow River (Wang et al. Citation2017), Ebro (Jiménez and Sánchez-Arcilla Citation1993, Jiménez et al. Citation1997), Nile (Deabes Citation2017, White and Asmar Citation1998) and delta across the world (Besset et al. Citation2019). Dada et al. (Citation2016) investigated interannual spatial and temporal change along the Niger delta coast between 2010 and 2012 using shoreline positions obtained from optical satellite imagery, wave, and hydro-meteorological data. They discovered that notable fluvial sediment decrease due to reclamation and periodic fluctuations in nearshore hydrodynamic processes were the dominant factors influencing the extensive coastal change they identified. Eludoyin et al. (Citation2012) used a GIS approach and data from Landsat TM and Niger-Sat imagery to investigate long-term coastal change near the mouth of the Bonny River. Between 1986 and 2001, 77% of the coastline underwent some form of change, according to their research.
Due to the dynamic nature of the shoreline position in this and many other regions, continuous, high-resolution monitoring is necessary for an accurate assessment of shoreline change. Monitoring of coastal shorelines uses a range of data, such as coastal maps, historical photographs, charts, satellite & aerial imagery, ground surveys and measurements (Boak and Turner Citation2005). Although conventional ground-based surveying is the most reliable method for delineating the coastline, it is time-consuming and often difficult, especially for large areas. Consequently, since the invention of satellites equipped with remote sensing systems, a number of techniques for delineating and assessing shoreline change have been developed utilising their data.
In 1972, the Landsat optical satellite mission, the first launched remote sensing satellite series, began to provide imagery. This is a valuable data resource due to the decadal and longer timescales over which coastlines can change. In addition to the length of time it spans, the Landsat imagery archive also has the advantages of being freely accessible and capturing a vast amount of coastline in a single image. Recently, a number of additional satellite-borne optical instruments, including the IKONOS, Sentinel-2 multispectral instrument (MSI), Worldview, RapidEye, and SPOT, have been used to delineate coastline position and quantify coastal change (Fearnley et al. Citation2009, Gibbs and Richmond Citation2015, Hisabayashi et al. Citation2017, Duarte et al. Citation2018). However, optical satellite data seemed to have inherent limitations, especially in tropical regions such as the delta of the Niger, where cloud cover may result in a limited dataset. Consequently, a number of studies have utilised other remote sensing data sources, including airborne unmanned aerial vehicles (UAVs), light detection and ranging (LIDAR), and video systems to delineate coastlines (Stockdonf et al. Citation2002, Shin and Kim Citation2015, Templin et al. Citation2017). These data sources can provide accurate measurements of coastal change, but they are unavailable in most developing nations due to lack of funding. Given the limitations of optical satellite imagery in tropical regions and the difficulties in obtaining LIDAR and airborne video data in developing nations, satellite-borne synthetic-aperture radar (SAR) instruments have become an invaluable source of data for delineating coastlines in developing tropical nations. SAR data can be obtained in any weather condition and at any time of day or night. Since the launch of SAR instruments on Sentinel-1A in April 2014 and Sentinel-1B in April 2016, Sentinel-1 SAR has provided a data source with a relatively high spatial and temporal resolution for this purpose. Continual acquisition of Sentinel-1 SAR imagery will provide an increasingly valuable tool for assessing the position of shorelines at the local, regional, and global scales as it expands over time.
Irrespective of the sources of data used to extract shoreline positions, a realistic evaluation of coastal change based on them requires an understanding of their inherent uncertainty. These can be classified into two types (Fletcher et al. (Citation2003), measurement and positional uncertainties. Positional uncertainty is influenced by external differences in the actual position of the land-sea boundary, which result from factors such as the phase of the tide, the frequency of storms, and the seasonal condition of the beach. Measurement uncertainty is introduced during operator-based shoreline delineation from remotely sensed imagery due to image ambiguity or operator misinterpretation.
Once a time series of delineated coastlines has been obtained, they can be used in coastal change analysis - a generic term used since the 1970s to encompass all techniques used to assess changes in shoreline position (Burningham and Fernandez-Nunez Citation2020). Several metrics for quantifying shoreline change have been developed and widely used, for instance (Genz et al. Citation2007, Oyedotun Citation2014), and have been incorporated into freely accessible GIS-based toolboxes including the Digital Shoreline Analysis System (DSAS) (Thieler et al. Citation2009, Apostolopoulos et al. Citation2022, Chrisben Sam and Gurugnanam Citation2022). These metrics are generally described for each position of interest along the coast. Some quantify shoreline change as a distance derived from comparisons between shoreline positions extracted from various images in the time series. For instance, net shoreline movement (NSM) is described as the variation between the youngest and oldest shoreline positions in the time series and does not include any information between these two dates, whereas the shoreline change envelope (SCE) is measured as the difference between the two most extreme shoreline positions. Others calculate rates of change in shoreline position by merging distance metrics, including NSM or SCE, with data on the acquisition time for each image in the time series. The end point rate (EPR) is computed by dividing the distance of shoreline position change (NSM, SCE, or another measure) by the time during which the change occurred. Foster and Savage (Citation1989) developed the average of rates (AOR) method, which calculates the rate of shoreline change from a set of EPRs calculated from all possible combinations of shoreline position derived from an imagery time series, filtered to remove those with time intervals less than a minimum threshold. This was designed to reduce the effects of measurement errors on calculated rates, but the results are dependent on how the minimum time threshold is defined. Alternately, the rate of shoreline position change can be calculated using the linear regression of shoreline position against time, also known as the linear regression rate (LRR) approach or the ordinary least squares (OLS) approach. In this regression, shoreline position values may be weighted based on their reliability or uncertainty (Dolan et al. Citation1991). The use of a linear regression approach allows for quantification of measures of uncertainty in the results, such as the correlation coefficient (R2) and Root Mean Square Error (RMSE). Maiti and Bhattacharya (Citation2009) discovered that greater uncertainty (measured as lower R2 values) was more common near sediment cell boundaries described by morphological features – for example spits, or shoals, inlets.
Quantifying shoreline position change in dynamic contexts such as those associated with deltaic coasts at both multi-annual scales (to understand the overall pattern) and shorter, sub-annual scales (to understand seasonal variations), is an important first step in deciphering the drivers of change. Ascertaining spatial heterogeneity of shoreline change processes may be carried out from: (a) 2D (plan-view) morphological changes over time, and (b) more complex 3D alongshore sediment budget studies (using notably digital elevation models (DEMs), including DEMs obtained from large-scale surveying using, for instance, LiDAR). Both of these approaches may be judiciuously used in conjunction with the definition of sediment cells, but understanding spatial and temporal patterns and gradients in shoreline mobility does not require the identification of sediment cells, although the latter may bring in an added qualitative didactic value by providing a simplified segmentation of the coast, and serving as the basis for identification of shoreline management units. Hence, the explicit objectives were to use a set of shoreline positions obtained from a time series of Sentinel-1 SAR GRD imagery data to:(i) assess the distribution pattern of coastal change over a multi-annual period of time (six years) (ii) ascertain how significant changes during the wet and dry seasons contributed to the overall changes (iii) determine the spatial variation of changes along the coast and the degree to which these correlate with local shoreline orientation.
2. Materials and methods
2.1. Study site
The studied coastline is located a few degrees north of the equator, as described in . It spans two Niger Delta states (Rivers and Akwa-Ibom) for approximately 129 kilometres, from the mouth of the Bonny River in the west to the mouth of the Cross River in the east. It is categorized into two morphological zones: the eastern flank of the major arcuate delta (which stretched eastward from the mouth of the Bonny River to the region around the mouth of the Imo River) and a section of strand coast from a little east of the Imo River mouth to the mouth of the Cross River. The delta flank has wide beach faces (>175 m in many places), which are cut by many river mouths and tidal inlets, the largest of which is the Andoni River, which lead inland to mangrove forests and complex tidal creek systems. These divide the coastline into a series of barrier islands distinguished by depositional spits (Oomkens Citation1974, Allen Citation1965). The strand coast has moderately wide (75 m) beach faces that are more consistent (the only considerable interruption being the mouth of the Qua Ibo River) and are backed by wooded land with only a few small areas of mangrove trees (Sexton and Murday Citation1994). In the absence of sediment transport data, the coastline was further subdivided into coastal cells based solely on morphological criteria. River inlets were used to define the boundaries, as is common in low-lying coastal environments (Bray et al. Citation1995). This resulted in the formation of eight coastal cells, as illustrated in .
Figure 1. Map showing (a) Africa, (b) Nigeria, (c) Niger Delta, (e) identified coastal cells.
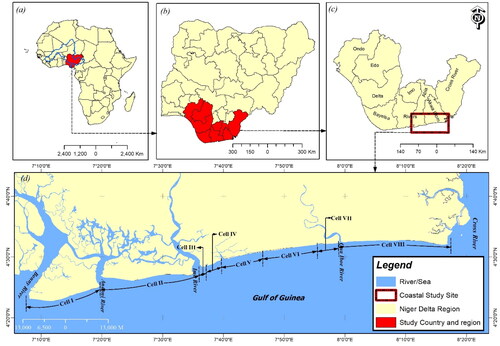
The region’s meteorology is divided into two distinct seasons: wet and dry. The wet season is eight months long, from March to October, whereas the dry season is four months long, from November to February (Joseph Citation2012). Extreme storms are uncommon, but heavy rainfall is common due to the seasonal movement of the Inter-Tropical Convergence Zone (ITCZ). Anthony et al. (Citation2019) on wave data showing both regional trade-wind generated seas and longer-period swell from the South Atlantic (the latter largely dominates the longshore transport system).
2.2. Coastal cell definition
The littoral cell is regarded as the division of the natural coast into compartments. This cell consists of a complete cycle of sedimentation, including sources, transport paths, and sinks (Inman Citation2005, Malcolm et al. 1995). In this study, littoral cells were used as a framework for identifying shoreline change. This is ascertained using fixed partial boundaries (i.e. river inlets) to divide coastal cells. The essence of the techniques is that because the study is in low-lying coastal environments, it is typically difficult to distinguish between independent and dependent coastal units (Bray et al. Citation1995). From Bonny River to Cross River, the coastline of the Niger Delta region is comprised of estuarine landforms and beaches with medium- to fine-grained sand, and also gentle slopes. (Sexton and Murday Citation1994) (). These cells were delimited alongshore as segments separated by delta tributary mouths. Given the absence of coastal cells in the study area, river inlet to river inlet was used to define the coastal cells in this instance. Typically, this criterion is used to define coastal cells in low-lying coastal environments (Bray et al. Citation1995). As shown in , along 130 kilometres of coastline, eight coastal cells were defined using GIS.
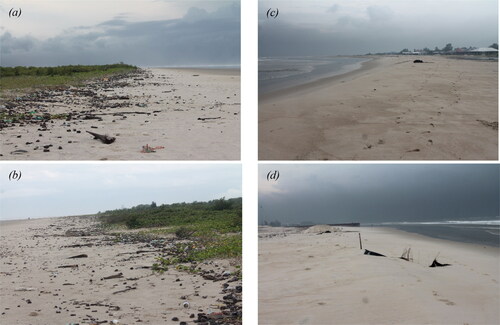
Figure 2. Picture of geomorphologic features (a–b) cells I, (c–d) cell VIII.
2.3. Data sources
Sentinel-1 SAR data products were acquired from the European Space Agency (ESA) Sentinel Scientific Data Hub as Wide Swath (IW), Ground Range Detected (GRD) imagery captured by the satellite’s C-band (5.36HGz) SAR in dual polarization (VV/VH) mode. This data is collected by Sentinel-1 in a six-day repeat cycle. The study centred on the period between 2015, when the Sentinel-1 GRD product became available for the first time, and 2020. There were a total of 255 images available for this time period from which 36 were chosen (six for each of the six years 2015–2020) based on the criterion that they were captured during a period of high tide. This criterion was met by cross-referencing the image acquisition time with predicted tidal tables for the city of Bonny, located on the western edge of the study region (https://tides.mobilegeographics.com/locations/843.html). The dates, times, and predicted tide heights for the chosen images are listed in .
Table 1. Summary of analyzed Sentinel-1 GRD data.
2.4. Methodological framework
The methodological framework for shoreline delineation from the Sentinel-1 SAR images is illustrated in . The data were initially pre-processed in accordance with the European Space Agency Sentinel Application Platform (ESA SNAP) standard procedure, which included the apply-orbit file, thermal noise removal, remove-GRD border noise, radiometric calibration, speckle filter, range-Doppler terrain correction, and linear to/from decibel (dB) routines. ArcGIS Pro Analyst, Spatial the VV and VH polarized images were then merged using cell statistics tools to reduce the impact of Bragg scattering, which is particularly pronounced in VV polarized backscatter data collected in open coastal environments. This improves the accuracy of histogram thresholding approaches to land and water body segmentation, which were then used to delineate the shoreline, which was then used to calculate the MHWL, as described by (Dike et al. Citation2023, Dike Citation2022, Dike et al. Citation2020).
Figure 3. Methodological framework flow chart for shoreline change.
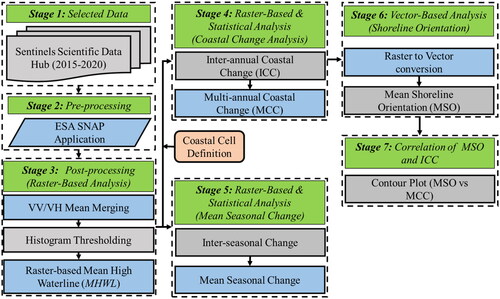
ArcGIS Pro was then used to combine the six classified images annually into a single combined image. In the merging process, the pixels in each classified image were assigned values of 0 for water and 1 for land. Consequently, each pixel in the combined image had a value between 0 (if the pixel was defined as water in all six classified images) and 6 (if the pixel was defined as land in all six of the classified images). Pixels with values of 1–5 therefore represent areas that were ambiguous, being classified as both water and land across the six images. This ambiguity was resolved by noting that the MHWL is defined as the mean of all high-water lines for a particular year, consequently all pixels with values of three and above were classified as land and those with values zero to two were defined as water and the shoreline defined as the boundary between land and water on this basis. The result of this process was a set of six continuous MHWL shorelines – one for each year from 2015 to 2020 inclusive – that were defined along the entire length of the studied coast.
2.5. Calculation of shoreline position change metrics
Interannual shoreline position changes were measured utilizing transect lines perpendicular to the baseline (Leatherman and Clow Citation1983, Del Río et al. Citation2013, Li et al. Citation2014, Jackson Citation2004), which were generated in ArcGIS Pro using the Generate Transect along Line algorithm at 50 m intervals and then converted from polylines to polygons utilizing Feature to Polygon algorithm.
Based on these transect lines, the Zonal Statistics algorithm was used to retrieve pixel information, which was then used to calculate both linear and areal measures of coastal change. The linear measures consisted of the distances through which the shoreline position changed and described either erosion (shoreline retreating into the ocean) or accretion (shoreline moving seaward). Obtained from the across-shore linear measures of erosion or accretion and the along-shore distance between transect lines, the areal measures represented the area eroded or accreted annually within each cell. Seasonal changes in shoreline position and eroded or accreted areas were estimated using the same method but applied to the variations between the first and last image from each wet or dry season in each year, instead of the mean shoreline positions for different years. All of this computation posited that the errors were two pixels (one pixel for each position, for a total error of two pixels) (2 pixels in their differences).
Following the extraction of inter-annual shoreline position change data, the shoreline position change over the entire time period (2015–2020) was estimated at each transect as total accretion (the sum of all accretional inter-annual position changes), total erosion (the sum of all erosional inter-annual position changes), and net change (total accretion minus total erosion). Descriptive statistics (sum, min, max, mean, and standard deviation) of coastal change along the entire coastline span were calculated using this whole-period data. The same procedure was followed for each season. Since the wet and dry seasons are different lengths, each value was divided by the number of days per season to allow significant comparisons of the contributions of wet and dry season processes to overall change (122 for the dry season, 241 for the wet season). The results indicate the average daily variation experienced during each season. These average values were then used to compute the average changes in the wet and dry seasons over the course of six years.
Shoreline orientation data, i.e. the compass bearing along which the shoreline is aligned locally, was derived from each year’s MHWL and converted into vector data utilizing Model-builder application in ArcGIS Pro. Using the Split Line at Vertices algorithm, the shoreline was divided into sections for which orientation calculations were performed. The bearings of the shoreline segments were then ascertained using a Pre-Loci Script method (Tucker Citation2004). In ArcGIS Pro, the result was combined with a transect polygon using the Spatial Join algorithm to produce a multi-feature shoreline orientation. The stated reason behind the multiple-feature shoreline orientation is that the transect polygons along the coastal cell are separated by 50 m. Using this method, all split shoreline orientation elements on the transect polygon were considered and averaged to produce mean shoreline orientation.
3. Results
3.1. Spatial distribution of shoreline position change
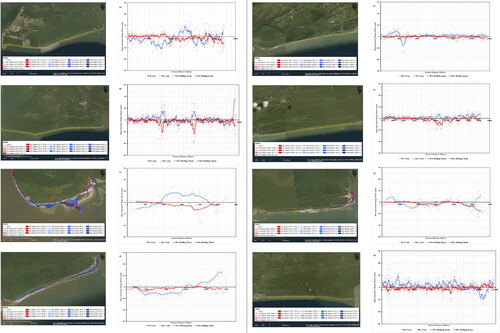
depicts the spatial variability of shoreline position change for each of the eight coastal cells defined in over the entire study period. This demonstrates the wide range of magnitude and direction of change observed. depicts the results for Cell I, which includes the ocean-facing coast of Bonny Island, a barrier island located between the mouths of the Bonny and Andoni rivers. Interspersed with areas of strong net erosion (at 5,000–10,000 m and 15,000–18,000 m) are regions of strong net accumulation (10,000–15,000 m and 18,000–22,000 m). The Andoni River end of the cell is exceptionally dynamic, with high rates of accretion and erosion during the study period.
Figure 4. Alongshore spatial distribution of total accretion, total erosion and net change for 201–2020in each of the eight coastal cells between Bonny River and Cross River (a) Cell I; (b) Cell II; (c) Cell III; (d) Cell IV; (e) Cell V; (f) Cell VI; (g) Cell VII; (h) Cell VII.
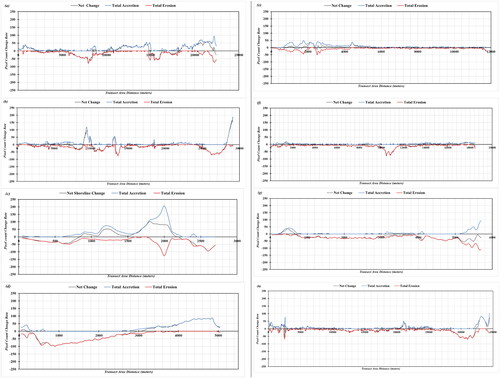
Cell II () is typically less active along most of its length, with the exception of a few less extensive stretches of coast (900–10,000 m; 1300–14,000 m) that are especially dynamic. These are the locations of cuspate forelands, which are ephemeral morphological features that develop and disintegrate over brief timescales. At the eastern end of this cell, close to the mouth of the Imo River, there is an area of strong net erosion (25,000–28,000 m) and another, smaller region of strong net accretion (28,000–29,000 m), indicating a dynamic environment with relatively rapid change.
Cell III (), which is relatively short (2.7 km), has a region of enhanced dynamism that peaks at 2000 m, indicating that this small stretch of wide beached coastline between the Imo River and the unnamed river that marks its eastern end is particularly dynamic. Cell IV () has the most distinct spatial pattern of change of all the cells, with erosional net change from 0 to 3,000 m and accretive net change from 3,000 to 5,000 m. This is discussed further in relation to shoreline orientation below. Cells I–IV are all located in the delta flank region, while Cells V–VIII are located in the strand coast region. Notable is the fact that, on average, the magnitudes of changes in the former are somewhat larger than those in the latter. This is consistent with the delta flank region being governed by complex tidal creek systems that connect to several river mouths and tidal inlets, which would be expected to result in a more dynamic sediment budget and consequently more dynamic morphological changes. In comparison, the strand coast region is only sparsely punctuated by tidal inlets or river mouths and would therefore be anticipated to have a less dynamic sediment budget overall, with relatively small areas of dynamism.
Cell V () demonstrations substantial dynamism at its western end (0–5,000 m), where substantial amount of accretion and erosion are observed, whereas the eastern end of the cell displays only low levels of change. This is consistent with the observation that the western segment of the cell is described by more tidal inlets than the eastern portion, which is a mainly uninterrupted beach front backed by terrestrial vegetation. Cell VI is also relatively stable, with the exception of a large erosional feature between 10,000 and 12,000 m in length (). This coincides with the mouth of an isolated river. In Cell VII (), there is a likelihood for erosion to predominate over accretion along most of the coast, perhaps because the magnitude of the change is small compared to cells in the delta flank region to the west. The shoreline becomes more dynamic at either end, but notably at the eastern end close to the mouth of the Qua Iboe River. In Cell VIII (), the longest cell, which extends approximately 35 km from the Qua Iboe River to the Cross River, the shoreline is reasonably stable, with relatively little accretion or erosion along its largely uninterrupted beach front, except at either end, where it becomes significantly more dynamic close to the major river mouths.
Overall, these findings reveal substantial spatial and temporal variation in the rate of shoreline change. The western cells (I–IV), which are located in the Niger delta’s eastern flank region and are characterised by multiple river mouths and tidal inlets backed by mangrove forests and complex tidal creek systems, have more dynamic shorelines, whereas the eastern cells (V–VIII), which are located in the strand coast region and have largely uninterrupted beach fronts punctuated more occasionally by river mouths, have less dynamic shorelines and only show substantial changes near those.
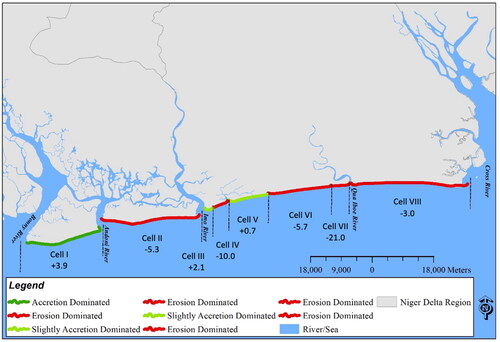
provides a summary of the coastal change along the entire coastline for the eight cells, as well as their erosion and accretion statistics. In accordance with the distinction made previously between Cells I and IV (eastern delta flank) and Cells V–VIII (strand beach), the mean values of accretion and erosion are greater in Cells I and IV than in Cells V–VIII. The only exception is the erosion of Cell VII (), which is at relatively low levels but occurs consistently along nearly the entire length of the cell. A comparison of the mean accretion and erosion values indicates that erosion is the dominant process in Cells II, IV, VI, VII, and VII, while accretion is the dominant process in the remaining cells.
Table 2. Length of coastal stretch and the overall multi-annual coastal change for each coastal cell.
3.2. Multi-annual mean seasonal change for each cell
depicts the seasonal contributions of erosion and accretion within each cell. There is a significant difference in processes and changes in shoreline position between the wet and dry seasons in general, as well as between seasons in different years. In Cell I (), the wet season is characterized by tremendous variability than the dry season. At the western end of the cell (0 to 12,000 m), immediately east of the mouth of the Bonny River, this change is primarily erosive. Between 12,000 and 15,000 m, the change continues during wet seasons, but is predominately accretive. The pattern is more variable to the east of this region, both in terms of accretion or erosion dominance and wet or dry season contributions. At the easternmost end of the cell, near the mouth of the Andoni River (between 21,750 and 22,250 m), accretion predominates during the wet seasons, whereas erosion predominates during the dry seasons.
Figure 5. Shoreline position changes disaggregated into wet and dry season contributions. Left hand panels show the seasonal contributions in each year, right hand panels show net wet and dry season contributions for 2015–2020. (a) Cell I; (b) Cell II; (c) Cell III; (d) Cell IV; (e) Cell V; (f) Cell VI; (g) Cell VII); (h) Cell VIII.
In Cell II (), there is relatively little erosion or accretion during either the wet or dry seasons, with the exception of three regions at approximately 8,000–10,000 m, 17,000–19,000 m, and near the mouth of the Imo River at the eastern end of the cell. The first two are characterized by relatively robust accretion during the wet seasons and roughly equivalent erosion during the dry seasons. Optical satellite imagery of this region indicates that the 8,000–10,000 m feature is at the blunt headland, not the coast, where a small river empties onto a broad sandy beach, while the 17,000–19,000 m feature interacts with another small river mouth where a sand extraction operation appears to be taking place. There is significant accretion near the mouth of the Imo River during wet seasons and much less erosion during dry seasons.
In Cell III (), the changes at each place in wet and dry seasons are nearly always in the opposite direction, with wet season changes typically being greater than dry season changes. The optical image reveals the formation of a distinct sand spit, which accretes mostly during the wet seasons. This may be owing to the delivery of significant quantities of sediment by the rivers discharging at each end of this cell, which are only about 3 kilometres apart. Cell IV () is also characterized by changes in the wet season, which have a distinct spatial structure within this cell. In the western 3 km of the coast, erosion predominates, while in the eastern 2 km, accretion predominates. This suggests that during the wet season, sediment is transported eastward along the coastline, resulting in a gradual accretion at the eastern end of the coastline. During the dry season, there are significantly fewer changes, and they are primarily erosive.
As seen in 's total shoreline change, Cells V–VIII (the strand cost region) have generally fewer dynamic shorelines compared to Cells I–IV (the strand cost region) (the eastern flank of the main delta). Cell V (), has is a relatively short (approximately 3 km) section at its western end that is relatively dynamic, especially in the wet seasons, during which accretion dominates in the western 2 km and erosion dominates in the eastern 1 km. This seems to be associated with the discharge from the relatively large river mouth at the western end of the cell. In wet or dry seasons, there is little activity in the remaining 9 km or so of the cell to the east, whether wet or dry. Cell VI () demonstrates relatively minor accretionary and erosive changes during the wet and dry seasons, respectively. There is a region between 10,000 and 11,500 metres with greater dynamism and stronger net erosion (as depicted in ), which primarily occurs during the dry seasons. Based on a comparison with the optical satellite image, this appears to be a tidal inlet along the otherwise mostly uninterrupted beach front.
depicts the average seasonal change for Cell VII. Again, the obtained shoreline position changes indicate that this cell is usually more active during wet seasons than dry seasons, and that during wet seasons, accretion dominates at each end of the cell, with dominant erosion in between. A particularly dynamic region exists at the eastern end of the cell, at the mouth of the Qua Iboe River, with strong erosion during dry seasons and relatively stronger deposition during wet seasons. Finally, in Cell VIII (), the largely uninterrupted beach front exhibits comparatively little dynamism, with set season accretion being substantially stronger than dry season erosion. The eastern end of this cell has a region of enhanced wet season erosion and slightly enhanced dry season deposition, reversing the pattern seen throughout the cell.
Because the mean tidal height difference between the dry and wet seasons is 0.05 m and the SAR images utilized have a spatial resolution of 10 m, the impact of tidal height and seasonal change may be insignificant in this study. Overall, these data demonstrate a clear distinction between the wet and dry season contributions to shoreline position change. In general, although by no means exclusively, accretion is preferred during wet seasons and erosion during dry seasons. Close to the mouths of rivers and tidal inlets, seasonality and variability appear to be enhanced, and the cells where these are more prevalent (Cells I-IV in the delta flank region) are more seasonally dynamic than those in the strand coast region (Cells V-VIII) where they are less prevalent. Together, these findings suggest that shoreline change is predominately governed by increased sediment delivery to the coast by rivers when they have higher water discharges due to wet season rains, and erosion of unstable and unconsolidated features resulting from this process during dry seasons.
3.3. Relationship between local shoreline orientation and net shoreline change
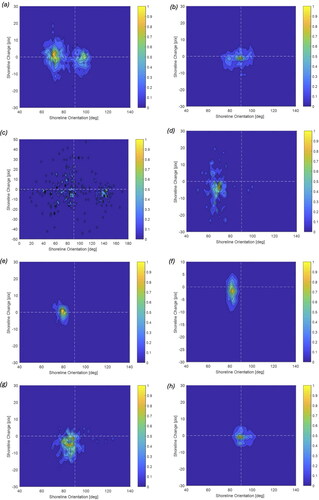
depicts the outcomes of studies into these relationships as heat maps indicating the number of observations in each joint class, with maximum contour intervals normalized to a value of 0.1. The shoreline orientation in Cell I exhibits a bimodal distribution () with peaks at 60–80 (i.e. aligned north of due east) and 90–110 (i.e. aligned south of due east) (due east and southwards). Cell II, as displayed in , has a unimodal distribution of shoreline orientations centred at approximately 90 degrees. Due to the presence of numerous headlands and geomorphic attributes along a short stretch of coastline, Cell III () has a set of local shoreline orientations that are widely dispersed. Cells IV-VIII () have unimodal local shoreline orientation distributions centred on 60-70°, 80°, 85°, 80-90° and 90°, respectively.
Figure 6. Plots of local mean shoreline orientation against net shoreline change in the period 2015–2020. (a) Cell I; (b) Cell II; (c) Cell III; (d) Cell IV; (e) Cell V; (f) Cell VI; (g) Cell VII); (h) Cell VIII.
4. Discussion
GIS-based analysis of multi-temporal Sentinel-1 SAR imagery was used to investigate the extent and spatial and temporal variation of coastal change along a section of the Niger Delta’s eastern flank and the neighbouring strand coast between 2015 and 2020. The overall net changes, and the summed magnitudes of net erosive and net accretive years are shown in and , and the overall net changes summarized in . The pattern of coastal change has varied (or remained stable) over longer time periods, as revealed by a comparison of these findings with those of previous research. Adegoke et al. (Citation2010) compared Landsat TM imagery from 1986 with Landsat ETM + data from 2003 and reported 0.995 km2 of erosion and 2.21 km2 of accretion (i.e. net accretion of 1.215 km2) in Cell I over that 17-year period, and 1.18 km2 of erosion and 1.11 km2 of accretion (i.e. net erosion of 0.07 km2) in Cell II. Multiplying the net values in pixels in by 10 (to convert to metres), multiplying by the cell lengths, converting to square kilometres, and dividing by the length of the time series in years to give comparable figures for the results presented here and those of Adegoke et al. (Citation2010) gives values for Cell I of 0.175 km2/year net accretion for the results presented here and 0.071 km2/year net accretion for Adegoke et al. (Citation2010). These are of the same order of magnitude, but Adgoke et al.’s value is approximately 40% of that found here. For Cell II, the difference is larger: 0.191 km2/year net erosion for the results presented here compared to 0.004 km2/year net erosion for Adegoke et al. (Citation2010).
Figure 7. Summary of the net changes observed in cells I–VIII over the period 2015–2020. The figures shown for each cell represent the difference between the mean accretion and erosion values in (positive indicates net accretion, negative indicates net erosion; units are 10 × 10 m pixels).
Ituen et al. (Citation2014) conducted a similar study but reported their findings in metres of erosion or accretion per year in the across-shore direction. They found that the mean accretion and erosion rates for years along the stretch of coastline defined herein as Cell V (their Zones 1–3) were 3.0 and 2.1 metres per year, respectively, implying a net accretion rate of +0.9 metres per year. This is compared to the net accretion rate found in this study for Cell V of +0.7 pixels over 5 years, or +1.4 m/year. They found that the average accretion and erosion rate for years along the stretch of coastline defined herein as Cell V (their Zones 1–3) were 3.0 and 2.1 m/year, respectively, implying a net accretion rate of +0.9 m/year.
This compares with the net accretion rate found in this work for Cell V of +0.7 pixels over 5 years, i.e. +1.4 m/year. In their Zones 4 and 5 (both of which fall into Cell VII as defined herein), Ituen et al. (Citation2014) derived mean net erosional rates of −3.2 and −7.8 m/years, respectively, which may be compared with a mean of −42.0 m/year found in this study. In their Zones 6 and 7, which fall within our Cell VIII, Ituen et al. (Citation2014) reported mean accretion of +1.1 m/year and mean erosion of −2.9 m/year respectively, compared with an overall mean erosion rate found here of −6.0 m/year. These results agree to within a factor of two for Cell V, but in Cells VII and VIII, particularly the former, the results reported here suggest much larger rates of erosion. The multi-annual erosion values in Cell VII () are consistently high (tens of metres per year) along the entire length of the cell, with larger values at the eastern end. This does not appear to be consistent with the seasonal results in , which suggest a much lower level of net erosion. The −42.0 m/year value reported above may therefore be the result of a systematic offset in the shoreline position and should be treated with caution. Overall, however, although the rates of change vary, quite strongly in some cases, between these three sets of results, the direction of change is the same in all cases. In qualitative terms, the findings presented here agree with Adegoke et al. (Citation2010) and with earlier work by Ibe (Citation1988), the this coastline is pre-dominantly erosive rather than accretional overall, and that the largest changes and most dynamic areas of shoreline are close to river mouths. They also agree with Ituen et al. (Citation2014), the changes in areas of uninterrupted sandy beaches backed by terrestrial vegetation are relatively small (). However, compared to these previous studies, which used optical imagery, the SAR images used in this study allowed more details in the morphological changes of the shoreline to be derived, in both spatial and temporal terms.
The results presented in show strong differences between changes in the shoreline during wet and dry seasons. Overall, wet season changes are predominantly, but not exclusively, accretional, while dry season changes are predominantly – but again, not exclusively – erosional. The strongest accretional changes appear to occur either near river mouths (e.g. the eastern ends of Cells II, IV and VII) or at tidal inlets (e.g. the western end of Cell V) or where distinct, transient morphological features such as sand spits are clearly visible in the satellite imagery (e.g. Cell III). These findings agree with previous studies carried out around on the western flank and the main arcuate delta coast of the Niger delta region, using graded pegs aligned perpendicular to the shoreline (Oyegun Citation1991) and Landsat TM data (Dada et al. Citation2016). These findings are consistent with the hypothesis that the shoreline change is strongly governed by river supply of sediment, which will be higher during wet seasons due the increased river flow and thus their greater erosional and transportational capacities. The sediment delivered during wet seasons appears from these results to be deposited predominantly either close to the river mouths or in the form of transient morphological features along the coast. Much, but not all of this accreted sediment is then eroded away during dry seasons when there is insufficient river flow to maintain its supply and coastal waves and currents can transport sediment away. The implication is that the sediment is unconsolidated and readily mobile.
It is uncertain whether the shoreline changes are determined by the potential for sediment transport along the coast. This variation may be due to restrictions in available sediment and disruptions caused by variations in wave refraction due to morphological feedback, such as differences in plan-view morphology, bathymetry, and river mouths, resulting in unexpected shifts in shoreline position. According to Nair et al. (Citation2015), shoreline orientation is sensitive to the net transport of sediment along the coastline. This is because the angle between the shoreline orientation and the prevailing wave direction is expected from wave theory to determine the extent to which wave action results in alongshore sediment transport (Mangor et al. Citation2017). The relationship between alongshore sediment flux and the angle between the wave crests in deep water (before nearshore shoaling and refraction) and shoreline orientation is non-linear, with maximum sediment flux occurring when that angle is 45° (Ashton et al. Citation2001, Rolf et al. Citation1988). This process tends to dampen out perturbations in steady coastlines, leading to the formation of straight shorelines. When the angle is higher than 45°, the shoreline becomes unstable, and perturbations can be magnified. However, these wave driven shoreline evolution processes are complicated by seasonal changes to both the wave fields and coastal sediment budgets (Mangor et al. Citation2017). It is well-established that wave action has had a significant morphological impact in the Niger delta region, leading to the formation of a sequence of straight to modestly curved, accreting coastal ridges supplied by river sediment (Komar Citation1973, Coleman and Wright Citation1975, Miall Citation1985, Reading and Collinson Citation1996). Ibe and Antia (Citation1983) found that the waves acting on the Niger delta and surrounding coastlines arrive from approximately the southwest and result in significant longshore currents with velocities ranging from 0.16 to 0.67 ms−1, which predominantly cause eastward drift along the coast. There is some evidence of variations in accretion and erosion with shoreline orientation in the results presented here (). For example, in Cell I () those parts of the coastline oriented around a bearing of 70°– the eastern end of Bonny Island – are shown to experience, on average, more accretion than those oriented around a bearing of 95° – the western end of the island. This suggests a pattern of eastward longshore sediment transport, consistent with theory. However, this is not borne out consistently in the other cells (), which show variously net mean erosion or accretion for different shoreline orientation bearings. The implication is that the results presented do not support a simple relationship between prevailing wave direction and shoreline orientation.
Among these are inherent shoreline plan-view variability itself (for instance, headlands and geomorphic attributes in Cell 3). In this coastal geomorphology, headlands are coastal landforms characterized by their protrusion into the sea, often composed of resistant, relatively stable beach sand or rock formations. These features play a significant role in shaping coastal morphology and influencing sediment transport patterns. Furthermore, the presence of delta distributary mouths (Anthony Citation2015), all of which can generate local changes in wave refraction (generating what may be akin to micro sediment cells) that break down the general functioning of homogeneous large sediment cells between the river mouths. River discharge jets from the various distributary mouths, and tidal creeks with strong tidal inflow and outflow refract waves and considerably perturb the longshore drift patterns, sometimes generating local counter-drift relative to the regional dominant longshore direction (sometimes materialized by opposite spit tip orientations, including in the Niger delta). This may also act as punctual sediment sources that generate local accretion. Finally, shoreline variability may also reflect tidal-creek or distributary mouth sediment bypassing (under the influence of longshore transport but where river jets (dry season discharge) or tidal flux (smaller tidal creek mouths) are weak.
In addition to the factors, the potential impact of reclamation may also be human-generated subsidence from subsurface oil and gas extraction, but probably more important are the fundamental aspects embedded in the longshore transport system itself that could generate apparently variable shoreline accretion and erosion results with respect to longshore transport gradients. Amongst the most important of these are land reclamation, most notably around Bonny by Nigeria Liquid Natural Gas Limited and the Qua Iboe Oil Refinery at the mouth of the Qua Iboe River, which has a significant impact on coastal change, which are causing extensive coastal change (Ituen et al. (Citation2014). The regions most affected by this are portions of Cells I and VII, where the coastline has receded substantially. Due to its proximity to the Qua-Iboe River and the reduced sediment discharge from the river to the coast as a result of land reclamation, the coastline in coastal cell VII is most affected by the change. Vast quantities of coastal construction in Cell VIII are also changing the position of coastal shorelines, most notably the construction of an ExxonMobil terminal.
5. Conclusion
From 2015 to 2020, the coastal sediment cells comprising this portion of the Niger delta coastal region, from the mouth of the Bonny River in the delta’s eastern flank to the mouth of the Cross River along the strand beach shoreline to the east, exhibited high levels of spatial and temporal variability at multiple scales, according to this study. SAR imagery analysis over the entire 5-year timescale reveals that the coastline is generally eroding more than accreting, but that there are areas of both net erosion and accretion over this timescale. Previous studies that have reported on this coastline as far back as the 1980s are in general agreement with these changes in terms of the direction and order of magnitude of change. However, these changes identify a large degree of variation in the rates estimated and recommend, if anything, an acceleration in the rate of erosion between the time periods of the previous studies and 2015–2020. What is unclear from the analysis and comparison with previous research is the extent to which the variations observed are due to inaccuracies in the reported rates or to actual changes in the shoreline positional change. It is highly likely that both of these factors are contributing to their occurrence.
The areas of coastlines near river mouths are more prone to change compared to those further from river mouths and on uninterrupted strand coasts, as shown by analysis of the imagery at both the multi-annual scale and considering seasonal variations. The latter provide a complete perspective of wet seasons being dominated by accretion – leading to increased sedimentation at river mouths and the formation of transient morphological coastal characteristics such as sand spits – and dry seasons being dominated by erosion, presumably primarily of the unconsolidated sediment and transient morphology created during the wet seasons. The general trend of erosion being the dominant process along this stretch of coastline is contradicted by the fact that wet season accretion near river mouths is larger than dry season erosion.
However, shoreline orientation analysis and shoreline position change provide some localized indications of a relationship that could be interpreted as evidence of the influence of wave action on shoreline position change, this does not hold true when data from the entire set of coastal cells studied are considered. Therefore, this influence is not supported by the data presented here. This research shows that Sentinel-1 SAR data and a raster-based method can be used to effectively evaluate coastal change. Coastal change assessment in data-poor countries can now move forward with the help of Sentinel-1 data, which is freely available, and a simple and systematic approach developed in this study. This method has the potential to provide coastal modellers, scientists, and government agencies with an effective coastal change monitoring capability, allowing them to create a coastal zone framework for efficient planning and management.
Disclosure statement
No potential conflict of interest was reported by the author(s).
Data availability statement
The data utilized in this research can be utilized to publish additional paper; therefore, they can be available upon request.
Additional information
Funding
References
- Adegoke J, Fageja M, James G, Agbaje G, Ologunorisa T. 2010. An assessment of recent changes in the Niger Delta coastline using satellite imagery. JSD. 3(4):277–296. doi: 10.5539/jsd.v3n4p277.
- Allen JRL. 1965. Coastal geomorphology of Eastern Nigeria: beach ridge barrier islands and vegetated tidal flats. Geol Mijnbouw. 44:1–21.
- Anthony EJ. 2015. Wave influence in the construction, shaping and destruction of river deltas: a review. Mar Geol. 361:53–78. doi: 10.1016/j.margeo.2014.12.004.
- Anthony EJ, Almar R, Besset M, Reyns J, Laibi R, Ranasinghe R, Abessolo Ondoa G, Vacchi M. 2019. Response of the Bight of Benin (Gulf of Guinea, West Africa) coastline to anthropogenic and natural forcing, Part 2: sources and patterns of sediment supply, sediment cells, and recent shoreline change. Cont Shelf Res. 173:93–103. doi: 10.1016/j.csr.2018.12.006.
- Antolínez JaA, Méndez FJ, Camus P, Vitousek S, González EM, Ruggiero P, Barnard P. 2016. A multiscale climate emulator for long‐term morphodynamics (MUSCLE‐morpho). JGR Oceans. 121(1):775–791. doi: 10.1002/2015JC011107.
- Apostolopoulos DN, Avramidis P, Nikolakopoulos KG. 2022. Estimating quantitative morphometric parameters and spatiotemporal evolution of the Prokopos lagoon using remote sensing techniques. JMSE. 10(7):931. doi: 10.3390/jmse10070931.
- Armenio E, De Serio F, Mossa M, Petrillo AF. 2019. Coastline evolution based on statistical analysis and modeling. Nat Hazards Earth Syst Sci. 19(9):1937–1953. doi: 10.5194/nhess-19-1937-2019.
- Ashton A, Murray AB, Arnault O. 2001. Formation of coastline features by large-scale instabilities induced by high-angle waves. Nature. 414(6861):296–300. doi: 10.1038/35104541.
- Besset M, Anthony EJ, Bouchette F. 2019. Multi-decadal variations in delta shorelines and their relationship to river sediment supply: an assessment and review. Earth Sci Rev. 193:199–219. doi: 10.1016/j.earscirev.2019.04.018.
- Boak EH, Turner IL. 2005. Shoreline definition and detection: a review. J Coast Res. 214:688–703. doi: 10.2112/03-0071.1.
- Bowen AJ, Lnman DL. 1966. Budget of littoral sands in the vicinity of point. Arguello, California (No 19): U.S. Army Coastal engineering Research Centre.
- Bray MJ, Carter DJ, Hooke JM. 1995. Littoral cell definition and budgets for Central Southern England. J Coast Res. 11:381–400.
- Burningham H, Fernandez-Nunez M. 2020. Shoreline change analysis. In Sandy Beach Morphodynamics; p. 439–460.
- Chrisben Sam S, Gurugnanam B. 2022. Coastal transgression and regression from 1980 to 2020 and shoreline forecasting for 2030 and 2040, using DSAS along the southern coastal tip of peninsular India. Geod Geodyn. 13(6):585–594. doi: 10.1016/j.geog.2022.04.004.
- Coleman JM, Wright LD. 1975. Modern river deltas: variability of processes and sand bodies.
- Dada OA, Li G, Qiao L, Ding D, Ma Y, Xu J. 2016. Seasonal shoreline behaviours along the arcuate Niger Delta coast: complex interaction between fluvial and marine processes. Cont Shelf Res. 122:51–67. doi: 10.1016/j.csr.2016.03.002.
- Deabes EaM. 2017. Applying ArcGIS to estimate the rates of shoreline and back-shore area changes along the Nile Delta Coast, Egypt. IJG. 08(03):332–348. doi: 10.4236/ijg.2017.83017.
- Del Río L, Gracia FJ, Benavente J. 2013. Shoreline change patterns in sandy coasts. A case study in SW Spain. Geomorphology. 196:252–266. doi: 10.1016/j.geomorph.2012.07.027.
- Dike EC. 2022. Deriving shorelines from SAR images to assess coastal vulnerability in data poor regions [PhD]. Lancaster University.
- Dike EC, Ilic S, Whyatt D, Folkard A. 2020. Shoreline delineation in complex intertidal environments using Sentinel-1 SAR imagery. Lancaster University.
- Dike EC, Oyetunji AK, Amaechi CV. 2023. Shoreline delineation from synthetic aperture radar (SAR) imagery for high and low tidal states in data-deficient Niger Delta region. JMSE. 11(8):1528. doi: 10.3390/jmse11081528.
- Do ATK, Vries SD, Stive MJF. 2019. The estimation and evaluation of shoreline locations, shoreline-change rates, and coastal volume changes derived from Landsat images. J Coast Res. 35(1):56. doi: 10.2112/JCOASTRES-D-18-00021.1.
- Dolan R, Fenster MS, Holme SJ. 1991. Temporal analysis of shoreline recession and accretion. J Coast Res. 7:723–744.
- Duarte CR, De Miranda FP, Landau L, Souto MVS, Sabadia JaB, Neto CÂDS, Rodrigues LIDC, Damasceno AM. 2018. Short-time analysis of shoreline based on RapidEye satellite images in the terminal area of Pecém Port, Ceará, Brazil. Int J Remote Sens. 39(13):4376–4389. doi: 10.1080/01431161.2018.1457229.
- Eludoyin OS, Oduore T, Obafemi AA. 2012. Spatio-temporal analysis of shoreline changes in Bonny Island, Nigeria. Ethiop J Env Stud & Manag, 5(2), 123–130.doi: 10.4314/ejesm.v5i2.2.
- Fearnley SM, Miner MD, Kulp M, Bohling C, Penland S. 2009. Hurricane impact and recovery shoreline change analysis of the Chandeleur Islands, Louisiana, USA: 1855–2005. Geo-Mar Lett. 29(6):455–466. doi: 10.1007/s00367-009-0155-5.
- Fletcher C, Rooney J, Barbee M, Lim S-C, Richmond B. 2003. Mapping shoreline change using digital orthophotogrammetry on Maui, Hawaii. J Coast Res. 106–124.
- Foster ER, Savage RJ. 1989. Methods of historical shoreline analysis. In: Magoon OT, Coverse H, Miner D, Tobin LT, Clark D, editors. Coastal Zone '89, American Society of Civil Engineer; p. 4434–4448.
- Genz AS, Fletcher CH, Dunn RA, Frazer LN, Rooney JJ. 2007. The predictive accuracy of shoreline change rate methods and alongshore beach variation on Maui, Hawaii. J Coast Res. 231:87–105. doi: 10.2112/05-0521.1.
- Gibbs AE, Richmond BM. 2015. National assessment of shoreline change:Historical shoreline change along the north coast of Alaska, U.S.–Canadian border to Icy Cape (No 2015-1048). US Geological Survey.
- Hisabayashi M, Rogan J, Elmes A. 2017. Quantifying shoreline change in Funafuti Atoll, Tuvalu using a time series of Quickbird, Worldview and Landsat data. GIScience Remot Sens. 55(3):307–330. doi: 10.1080/15481603.2017.1367157.
- Hooke JM, Bray MJ. 1995. Coastal groups, littoral cells, policies and plans in the UK. vol. 27. The Royal Geographical Society (with the Institute of British Geographers); p. 358–368.
- Ibe, A. C. 1988. Coastline erosion in Nigeria, Lagos, Nigeria Nigerian Institute for Oceanography and Marine Research.
- Ibe AC, Antia EE. 1983. Preliminary assessment of the impact of erosion along the Nigerian shoreline. Lagos: Nigerian Institute for Oceanography and Marine Research.
- Inman DL. 2005. Littoral cells. In: Schwartz ML, editor. Encyclopedia of coastal science. Dordrecht: Springer Netherlands.
- Ituen UJ, Johnson IU, Njoku JC. 2014. Shoreline change detection in the Niger Delta. A case study of Ibeno shoreline in Akwa Ibom State, Nigeria. Global J Human Soc Sci. Res. 14(6):25–34
- Jackson CW. 2004. Quantitative shoreline change analysis of an inlet-influenced transgressive barrier system Figure Eight Island, North Carolina [Master of Science]. University of North Carolina.
- Jiménez JA, Sánchez-Arcilla A. 1993. Medium-term coastal response at the Ebro delta, Spain. Mar Geol. 114(1–2):105–118. doi: 10.1016/0025-3227(93)90042-T.
- Jiménez JA, Sánchez-Arcilla A, Bou J, Ortiz MA. 1997. Analysing short-term shoreline changes along the Ebro Delta (Spain) using aerial photographs. J Coast Res. 13:1256–1266.
- Joseph OA. 2012. Rainfall seasonality in the Niger Delta Belt, Nigeria. J Geogr Reg Plan. 5.
- Komar PD. 1973. Computer models of delta growth due to sediment input from rivers and longshore transport. Geol Soc America Bull. 84(7):2217–2226. doi: 10.1130/0016-7606(1973)84<2217:CMODGD>2.0.CO;2.
- Komar PD. 2000. Coastal erosion - underlying factors and human impacts. Shore Beach. 68:3–16.
- Leatherman SP, Clow B. 1983.UMD shoreline mapping project. IEEE Geosci Remot Sens Soc Newslett. 22(3):5–8.
- Li X, Zhou Y, Zhang L, Kuang R. 2014. Shoreline change of Chongming Dongtan and response to river sediment load: a remote sensing assessment. J Hydrol. 511:432–442. doi: 10.1016/j.jhydrol.2014.02.013.
- Mahamud U, Takewaka S. 2018. Shoreline change around a river delta on the Cox’s Bazar Coast of Bangladesh. JMSE. 6(3):80. doi: 10.3390/jmse6030080.
- Maiti S, Bhattacharya AK. 2009. Shoreline change analysis and its application to prediction: a remote sensing and statistics based approach. Mar Geol. 257(1–4):11–23. doi: 10.1016/j.margeo.2008.10.006.
- Mangor K, Drønen NK, Kærgaard KH, Kristensen SE. 2017. Shoreline management guidelines. Danish Coastal Authority and Aart Kroon, Geographical Institute, University of Copenhagen, DHI.
- Miall AD. 1985. Architectural-element analysis: A new method of facies analysis applied to fluvial deposits. Earth Sci Rev. 22(4):261–308. doi: 10.1016/0012-8252(85)90001-7.
- Motyka JM, Brampton AH. 1993. Coastal management – mapping of littoral cells. HR Wallingford: Ministry of Agricuhure, Fisheries and Food.
- Nair LS, Sundar V, Kurian NP. 2015. Longshore sediment transport along the coast of Kerala in Southwest India. Procedia Eng. 116:40–46. doi: 10.1016/j.proeng.2015.08.262.
- Nicholls Robert J, Cazenave A. 2010. Sea-level rise and its impact on coastal zones. Science. 328(5985):1517–1520. doi: 10.1126/science.1185782.
- Oomkens E. 1974. Lithofacies relations in the late quaternary Niger Delta complex. Sedimentology. 21(2):195–222. doi: 10.1111/j.1365-3091.1974.tb02056.x.
- Oyedotun TDT. 2014. Shoreline geometry: DSAS as a tool for historical trend analysis. British Society for Geomorphology.
- Oyegun CU. 1991. Spatial and seasonal aspects of shoreline changes at Forcados Beach, Nigeria. Earth Surf Processes Landf. 16(4):293–305. doi: 10.1002/esp.3290160404.
- Reading HG, Collinson JD. 1996. Clastic coasts. sedimentary environments: processes, facies and stratigraphy. Blackwells, Cornwall.
- Rolf D, Jorgen F, Broker HI, Zyserman Julio A, Holst AO. 1988. Littoral drift model for natural environments. Coast Eng Proc. 1.
- Sexton WJ, Murday M. 1994. The morphology and sediment character of the coastline of Nigeria: the Niger Delta. J Coast Res. 10:959–977.
- Shin B, Kim K. 2015. Estimation of shoreline change using high resolution images. Procedia Eng. 116:994–1001. doi: 10.1016/j.proeng.2015.08.391.
- Stapor FW. 1971. Sediment budgets on a compartmented low-to-moderate energy coast in northwest Florida. Marine Geol. 10(2):1–7. doi: 10.1016/0025-3227(71)90047-8.
- Stockdonf HF, Sallenger AH, List JH, Holman RA. 2002. Estimation of shoreline position and change using airborne topographic Lidar data. J Coast Res. 18:502–513.
- Syvitski James PM, Vörösmarty Charles J, Kettner Albert J, Green P. 2005. Impact of humans on the flux of terrestrial sediment to the global coastal ocean. Science. 308(5720):376–380. doi: 10.1126/science.1109454.
- Templin T, Popielarczyk D, Kosecki R. 2017. Application of low-cost fixed-wing UAV for inland lakes shoreline investigation. Pure Appl Geophys. 175(9):3263–3283. doi: 10.1007/s00024-017-1707-7.
- Thieler ER, Himmelstoss EA, Zichichi JL, Ergul A. 2009. The Digital Shoreline Analysis System (DSAS) version 4.0 – an ArcGIS extension for calculating shoreline change (No. 2008-1278). US Geological Survey.
- Tucker, C. 2004. ArcGIS 9: writing geoprocessing scripts with ArcGIS. ESRI.
- Wang C, Zhao Y, Zou X, Xu X, Ge C. 2017. Recent changing patterns of the Changjiang (Yangtze River) Estuary caused by human activities. Acta Oceanol Sin. 36(4):87–96. doi: 10.1007/s13131-017-1017-z.
- White K, Asmar HME. 1998. Monitoring changing position of coastlines using thematic mapper imagery, an example from the Nile Delta. Geomorphology. 29(1–2):93–105. doi: 10.1016/S0169-555X(99)00008-2.