
 ?Mathematical formulae have been encoded as MathML and are displayed in this HTML version using MathJax in order to improve their display. Uncheck the box to turn MathJax off. This feature requires Javascript. Click on a formula to zoom.
Abstract
This study proposed an interpretable model that combines Random Forest (RF), Optuna hyperparameter optimization, and SHapley Additive exPlanations (SHAP) to achieve optimal landslide susceptibility evaluation and provide explanations in the northwest region of Yunnan Province in China. First, an inventory of 4447 landslides and 23 related factors was considered for the landslide susceptibility assessment. Subsequently, a hyperparameter-optimized RF model was developed using the Optuna framework and the training dataset to generate landslide susceptibility maps. The performance of the models were evaluated using accuracy (ACC), precision (PPV), recall (TPR), F1-score (F1), and the Area Under the Curve (AUC) based on the Receiver Operating Characteristic. Furthermore, the interpretability of the model was enhanced through the implementation of SHAP. The proposed model demonstrated outstanding performance on the test set, achieving an ACC of 0.7792, PPV of 0.7448, TPR of 0.8769, F1 of 0.8055, and an AUC of 0.8387. The interpretability analysis revealed that elevation, population density, distance from roads, and normalized difference vegetation index were the primary factors influencing landslide occurrences in the study area. This study provides a comprehensive framework for evaluating landslide susceptibility in specific regions and offers invaluable insights for the prevention and management of landslide disasters.
1. Introduction
Landslides, a prevalent type of geological disaster, are characterized by unpredictability, extensive distribution, and destructive power, often posing significant threats and causing substantial losses to human lives and the natural environment (Xu et al. Citation2013; Froude and Petley Citation2018). Between 1998 and 2017, 378 major landslides occurred globally, resulting in the deaths of 18,414 individuals, injuries to 4.8 million people, and approximately 8 billion dollars in economic damages (Liao et al. Citation2022). Therefore, the precise assessment of regional landslide susceptibility is of critical importance for mitigating disaster risks, safeguarding public safety and property, and guiding the rational utilization of regional land resources.
In recent years, landslide susceptibility research has emerged as a focal point of the study, being widely recognized as one of the most effective methods to mitigate landslide disasters (Saha et al. Citation2021). Various methodologies have been employed for landslide susceptibility analysis, broadly categorized as follows: (1) traditional statistical methods, including frequency ratio model (Li et al. Citation2016; Zhang et al. Citation2020), weight of evidence (Ilia and Tsangaratos Citation2016), and analytic hierarchy process (Wei et al. Citation2021); (2) index-based methods, such as entropy index and statistical index (Wang et al. Citation2016; Wu et al. Citation2016; Shirani et al. Citation2018); (3) machine learning models, including Random Forest (RF) (Stumpf and Kerle Citation2011), Boosted Regression Trees (Saha et al. Citation2021), Support Vector Machine (SVM) (Chen et al. Citation2022), Logistic Regression (Zhao et al. Citation2019), and eXtreme Gradient Boosting (XGBoost) (Zhou et al. Citation2022). Although numerous approaches have demonstrated viability in assessing landslide susceptibility, the optimal method remains undetermined. Machine learning techniques have exhibited distinct advantages when dealing with large datasets and nonlinear relationship (Prodhan et al. Citation2022), and has gained widespread application in landslide susceptibility assessment (Liu et al. Citation2023; Long et al. Citation2023; Ma et al. Citation2023). In comparative studies of various machine learning methods, RF has found widespread adoption in the field of geological hazard susceptibility assessment. This is due to its strengths in handling high-dimensional data, evaluating variable importance, and its accuracy and stability in model construction (Trigila et al. Citation2015; Hong et al. Citation2017; Wang et al. Citation2020).
The accuracy of machine learning models is not solely determined by the algorithms themselves but is also significantly influenced by a predetermined set of hyperparameters before model training (Wang et al. Citation2021). Complex machine learning models often involve a multitude of hyperparameters, and optimizing them is a critical step in the model-tuning process. However, due to the laborious nature of hyperparameter optimization during model development, researchers consider various alternatives to manual tuning. Techniques such as random search, grid search, and genetic algorithms have been employed for hyperparameter optimization (Li and Kong Citation2014; Ribeiro da Silva et al. Citation2019; Tang et al. Citation2019). Nevertheless, random and grid search suffer from low optimization efficiency and high computational costs, while genetic algorithms tend to converge to local optima, potentially overlooking global performance. In recent years, traditional Bayesian algorithms have been increasingly utilized for hyperparameter optimization in machine learning models. For example, Xie et al. (Citation2021) employed Bayesian optimization with SVM to assess landslide hazards in Nanping City, China. Sun et al. (Citation2020) applied Bayesian optimization to RF model for assessing landslide susceptibility in Fengjie, China. However, traditional Bayesian algorithms, which employ Gaussian processes for the optimization process of their probabilistic models, are computationally intensive and better suited to continuous hyperparameters, making them less efficient for discrete ones. Optuna, a novel hyperparameter optimization framework, utilizes Tree-structured Parzen Estimator (TPE) approaches to model the objective function, providing more flexibility and efficiency than traditional Gaussian Process Bayesian optimization (Akiba et al. Citation2019). Its suitability for various types of hyperparameters (Lin et al. Citation2023). However, limited research has been conducted on the application of Optuna in the field of landslide susceptibility to date.
While machine learning models have demonstrated substantial advantages in handling complex data and exhibited commendable performance, the non-interpretability of the majority of these models remains a challenging issue. This lack of interpretability hinders a comprehensive assessment or trust in these models based on a single metric (Chen and Fan Citation2023a; Youssef et al. Citation2023). In recent times, the advent of a post-hoc explanatory method called SHapley Additive exPlanations (SHAP) has presented a novel approach to interpreting the outcomes of landslide susceptibility assessments. By iteratively hypothesizing and testing, SHAP illuminates how data influences model functioning, attracting the attention of researchers from various disciplines. For instance, Guliyev and Mustafayev (Citation2022) utilized SHAP in conjunction with RF and XGBoost to interpret factors influencing the dynamics of crude oil price. Abdollahi and Pradhan (Citation2023) utilized SHAP to interpret the influencing factors in wildfire susceptibility prediction models. Dikshit and Pradhan (Citation2021) applied SHAP to investigate how deep-learning models arrive at specific outcomes under various drought conditions. In summary, SHAP has the potential to clarify model predictions and provide transparency to ‘black-box’ models; however, research specifically focusing on the application of SHAP in the domain of landslide susceptibility is still limited.
To tackle the aforementioned issues, an innovative interpretable model is proposed in this study by combining RF, Optuna hyperparameter optimization, and SHAP. This amalgamation aims to achieve an optimal assessment of landslide susceptibility while providing transparent explanations. The main objectives of this study are twofold: first, to develop a hyperparameter-optimized RF model utilizing the Optuna framework for the identification of landslide susceptibility; and second, to employ the SHAP method to interpret the model and further evaluate the factors influencing landslide susceptibility. This study will bridge the existing gap in machine learning for landslide susceptibility research and provide a more reliable foundation for practical applications in related fields.
2. Study area and data
2.1. Study area
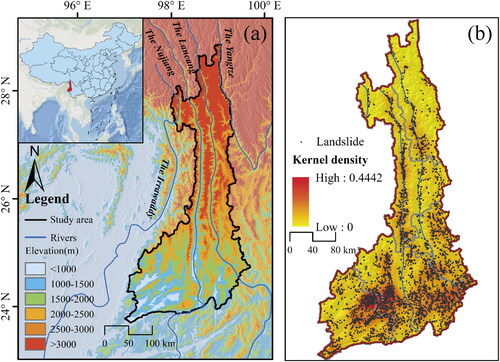
Yunnan Province is situated on the edge of southwestern China, encompassing approximately 394,100 km2 of land area. Its topography is characterized by highlands and mountains, featuring steep peaks and deep river valleys in the western regions. Influenced by a subtropical monsoon climate, Yunnan experiences distinct dry and wet seasons, with abundant and concentrated precipitation during May to October (Wang and Yu Citation2021). These complex topographical conditions and diverse climatic patterns render Yunnan as one of the provinces in China most susceptible to landslides. Notably, the northwestern part of Yunnan (23°77′ − 29°15′N, 97°31′ − 99°83′E, covering an area of about 63,478 km2) is marked by densely distributed mountain ranges and valleys () (Li et al. Citation2015). The area is traversed by the Lancang river and the Nujiang river, both of which are characterized as typical mountain rivers known for their rapid flow and significant drop (Liu et al. Citation2023). The river valley slopes on either side are relatively steep (He et al. Citation2022). The turbulent runoff within the area, coupled with concentrated rainfall, provides favourable hydrodynamic conditions for the frequent occurrence of landslides. Combined with the formidable topography, these factors make the area a focal point for landslide prevention and control efforts.
Figure 1. Location of the study area (a) and kernel density map of landslides (b).
2.2. Data
2.2.1. Landslide inventory
In this study, a landslide inventory was compiled using survey database, consisting of 4447 landslides that occurred in the northwestern part of Yunnan Province. These landslides were derived from spatial distribution data of geological hazard points in China, provided by the Resources and Environmental Science Data Center (RESDC) (http://www.resdc.cn), as well as detailed survey database on geological landslide disasters in Yunnan Province. The kernel density map of landslide events is presented in . The density of landslides reflects the number of occurrences within a unit area. Overall, landslide events are primarily concentrated in the southern part of the study area, with a maximum density of 0.4442 events/km2. Fewer events are distributed in the northern part, with most clusters observed around river valleys.
2.2.2. Conditioning factors
This study, building upon previous studies and the characteristics of landslide development in the study area, collected foundational data for landslide factors from three aspects: precipitation, surface environment, and human activities. Detailed data used in this study can be found in . Daily precipitation data from 1986 to 2018 were obtained from the Yunnan Provincial Climate Center, comprising records from 125 meteorological stations. For the surface environment category, the digital elevation model (DEM) was obtained from the Shuttle Radar Topography Mission (SRTM) (Rodríguez et al. Citation2006). Soil types (Soiltype) and land use/land cover (LULC) data were obtained from RESDC. Geological lithology data with a spatial resolution of 250 m were sourced from Sayre et al. (Citation2014). To calculate the Normalized Difference Vegetation Index (NDVI), Landsat 5/8 satellite imagery spanning from 1986 to 2020 was retrieved from the Google Earth Engine platform (https://earthengine.google.com). River data were obtained from the National Catalogue Service for Geographic Information (https://www.webmap.cn/), while fault zone data were sourced from the Comprehensive karst hydrogeological map of Yunnan Province. Within the human activities category, population density (POP) data were selected from the widely used WorldPop dataset (Tatem Citation2017) (https://hub.worldpop.org/). Roads data, available in shapefile format, were obtained from the National Catalogue Service for Geographic Information.
Table 1. Detailed information of the data.
3. Methodology
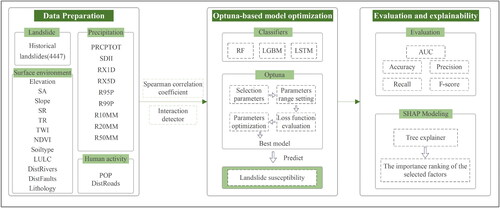
depicts the methodological roadmap employed in this study for the assessment of landslide susceptibility. The assessment process comprises multiple steps. First, an extensive inventory consisting of 4447 landslides and 23 associated factors was prepared for the evaluation of landslide susceptibility. Next, three models were developed: RF, Light Gradient Boosting Machine (LGBM), and Long Short-Term Memory (LSTM), each optimized with hyperparameters using the Optuna framework. The models’ performance was assessed using accuracy (ACC), precision (PPV), recall (TPR), F1-score (F1), and Area Under the Curve (AUC) based on the Receiver Operating Characteristic (ROC). Additionally, RF model utilized a training dataset to generate maps depicting the susceptibility of landslides. Finally, the interpretability of RF model was enhanced through the implementation of SHAP.
Figure 2. Methodological framework of this study.
3.1. Selection and data processing of landslide influencing factors
3.1.1. Precipitation factors
Precipitation is a particularly crucial factor in the analysis of landslide susceptibility due to its significant impact on slope stability and soil cohesion. In this study, we selected nine key precipitation index () as factors that influence landslides (Zhang et al. Citation2011). Indices such as annual total wet-day precipitation (PRCPTOT) and simple daily intensity index (SDII) were specifically chosen to reflect the spatial distribution characteristics of precipitation. To accurately compute these precipitation indices, we employed the RClimDex software. Subsequently, we conducted spatial interpolation of the nine precipitation indices, collected from 125 meteorological sites, using the ordinary Kriging interpolation method in ArcGIS 10.4, at a spatial resolution of 1 km (). This step aimed to generate raster data for precipitation factors, thereby providing spatial continuity and detailed richness for our landslide analysis.
Figure 3. Spatial distribution of precipitation factors. (a) PRCPTOT; (b) SDII; (c) RX1D; (d) RX5D; (e) R95P; (f) R99P; (g) R10MM; (h) R20MM; (i) R50MM.
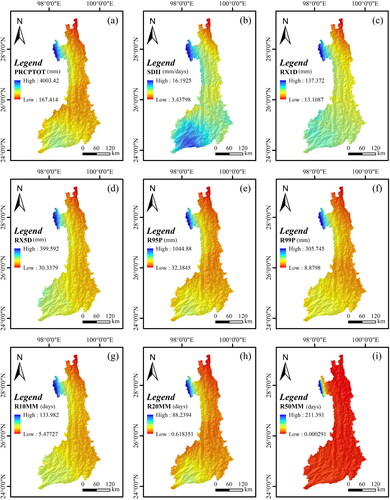
Table 2. Definition of precipitation index.
3.1.2. Surface environment factors
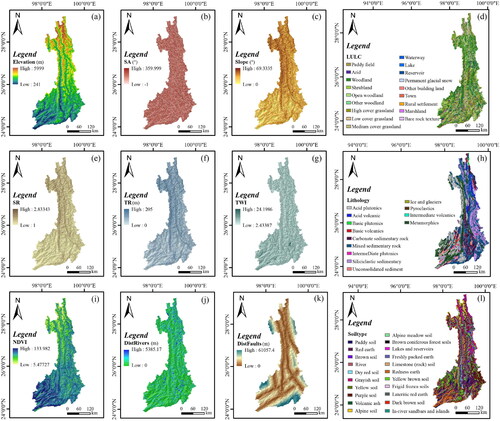
In the study of landslide environmental impacts, the role of topography and land surface characteristics is pivotal. Elevation has consistently been identified as one of the most common influencing factors in landslide research (Reichenbach et al. Citation2018). Terrain parameters derived from the DEM, such as Slope and Aspect (SA), directly impact surface water flow and soil permeability. An increase in slope gradient signifies reduced soil infiltration and increased surface runoff, thereby contributing to landslide occurrence. SA influences precipitation and sunlight exposure, subsequently affecting soil moisture and landslide risk (Van den Eeckhaut et al. Citation2006). The Topographic Wetness Index (TWI) highlights the influence of terrain on the process of moisture accumulation, while Surface Roughness (SR) reflects the irregularity of the terrain (Hong et al. Citation2018). Topographic Relief (TR) indicates the elevation difference between the highest and lowest points within a specified area, establishing a direct correlation between landform morphology and potential landslide occurrence (Schmidt and Montgomery Citation1995; Qiu et al. Citation2018). Soiltype impacts water discharge based on its texture, permeability, and structure, while Lithology controls the water percolation process, both exerting direct effects on landslide occurrence (Trigila et al. Citation2015; Mojaddadi et al. Citation2017). LULC modify topsoil properties, affecting water storage and surface runoff, thereby indirectly influencing landslide susceptibility (Shu et al. Citation2019). Distance from rivers (DistRivers) influences landslide occurrence as water bodies can undermine slope stability through erosion and increased saturation, which weakens soil and rock strength near riverbanks (Gokceoglu et al. Citation2005). Distance from faults (DistFaults) is a critical factor in landslide susceptibility, as seismic activities associated with faults can trigger landslides by inducing ground shaking and fracturing the earth’s surface. Lastly, NDVI reflects the area’s plant biomass, indicating vegetation coverage’s role in regulating runoff processes and indirectly influencing landslide risk (Chu et al. Citation2009; Khosravi et al. Citation2016). All the aforementioned data were resampled to a spatial resolution of 1 km, and the spatial distribution of all factors is depicted in .
Figure 4. Spatial distribution of the surface environment factors. (a) Elevation; (b) SA; (c) Slope; (d) LULC; (e) SR; (f) TR; (g) TWI; (h) Lithology; (i) NDVI; (j) DistRivers; (k) DistFaults; (l) Soiltype.
3.1.3. Human activity factors
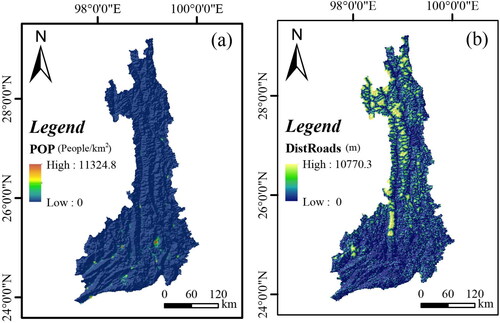
Human activities play a pivotal role in influencing landslide occurrences, as they often significantly alter the natural landscape and its stability. In this study, we examined two critical human activity factors: POP and distance from roads (DistRoads). These factors were used to assess the intensity and extent of human activities. POP indicates the degree of population concentration within the area, while DistRoads demonstrates the development of the transportation network. Together, they contribute to landslide risk. The spatial distribution of these factors is meticulously illustrated in .
Figure 5. Spatial distribution of human activity factors. (a) POP; (b) DistRoads.
3.2. Methods
3.2.1. Spearman correlation coefficient
In this study, the Spearman correlation coefficient (SCC) was used to assess the relationship between various landslide-contributing factors and landslide occurrences. Introduced by Charles Spearman in 1904 (de Winter et al. Citation2016), the SCC is a nonparametric measure of dependency, suitable for evaluating the correlation between rank-based variables. Its application allows for the precise quantification of the association between these influencing factors and landslide events. The SCC is defined as follows:
(1)
(1)
where
represents the 23 landslide-contributing factors, and
denotes the total number of landslide occurrences within the corresponding grid cells.
3.2.2. Interaction detector
The geodetector, a spatial analysis method designed to detect spatial heterogeneity and its driving forces, was proposed by Wang in 2010 (Wang et al. Citation2010). It consists of four primary types of detectors: factor detector, interaction detector, risk detector, and ecological detector. In this study, the interaction detector is predominantly utilized to examine the interplay between two factors in relation to landslides, and the extent of their relationship is presented in . This degree of relationship is measured by the q-value, calculated using following formula:
(2)
(2)
(3)
(3)
(4)
(4)
Table 3. Types of interaction between two covariates.
In formula Equation(2)(2)
(2) :
= 1,…, L is the stratum of variable Y or factor X;
and
are the number of units in layer
and the whole area respectively;
and
are the variances of the Y value of layer h and the whole area respectively.
and
are within the sum of squares and the total sum of squares.
3.2.3. Model
3.2.3.1. Random Forest
The RF algorithm, initially proposed by Breiman (Citation2001), is an ensemble machine-learning approach that operates based on multiple decision trees for both data training and prediction. The core components of a RF consist of individual decision trees and the bagging technique. As a hierarchically structured classifier, a decision tree classifies data through its levels. Bagging contributes by randomly drawing subsets from the training data to construct each tree, while the remaining data (out-of-bag data) are utilized for cross-validation to assess the performance of the RF classifier. RF is known for its superior performance compared to other machine learning algorithms in aspects such as parameter tuning, training speed, noise reduction, and overfitting prevention. Moreover, it efficiently manages and processes large-scale and high-dimensional data, making the RF an ideal choice for handling remote sensing information.
3.2.3.2. Light Gradient Boosting Machine
LGBM is an efficient algorithm based on Gradient Boosting Decision Tree frameworks, employing gradient-based one-sided sampling, histogram algorithms, exclusive feature bundling, and leaf-wise tree growth strategies to enhance training speed, computational efficiency, and reduce memory consumption (Song et al. Citation2024). The histogram algorithm discretizes continuous feature values and constructs histograms to identify optimal split points, while the leaf-wise growth strategy, which allows splitting only for the leaf with the maximum information gain, reduces the number of tree nodes. This strategy not only boosts splitting efficiency but also prevents overfitting, offering LGBM a distinct advantage in processing large-scale data.
3.2.3.3. Long Short-Term Memory
LSTM networks represent a specialized subclass of Recurrent Neural Networks (RNNs) that are designed to learn long-term dependencies within data sequences. Distinct from conventional RNNs, LSTMs are equipped with integrated mechanisms that facilitate the selective retention and discarding of information during the learning process. This architecture enhances the model’s ability to manage data over extended time intervals, thereby mitigating issues related to vanishing or exploding gradients commonly encountered in standard RNNs (Chen and Fan Citation2023b).
3.2.4. Optuna-based hyperparameter optimization framework
To enhance the performance of the RF model in landslide identification applications, the Optuna optimization framework for hyperparameter tuning was adopted in this study. Optuna (Akiba et al. Citation2019) is an advanced hyperparameter optimization framework that selects the optimal combination of hyperparameters by optimizing a predefined objective function. The framework’s core components include the objective function, individual trials, and the optimization process. In contrast to traditional grid search methods, Optuna employs sampling-based approaches and pruning strategies to select hyperparameters, effectively shortening the model fitting time while improving performance. Integration of the Optuna framework with the RF algorithm enabled more precise and efficient identification of landslides in this study. The process for optimizing hyperparameters with Optuna involves four main steps: (1) define the objective function, which is to maximize the F1 score, and specify the range of hyperparameters for the classification model; (2) in each trial, train the classification model using the given hyperparameters, predict on the validation data, and calculate the F1 score; (3) perform multiple trials to find the hyperparameters that yield the highest F1 score, thus optimizing the classifier’s performance; (4) output the best set of hyperparameters and the corresponding F1 score. The hyperparameters search spaces for all classifier models and the best parameters will be displayed in .
Table 4. Hyperparameter search spaces of three models.
3.2.5. Model evaluation
Landslide susceptibility models are commonly evaluated using confusion matrices and ROC curves. The ROC curve, which plots false positive rates (1-specificity) on the x-axis and true positive rates (sensitivity) on the y-axis, provides a visualization of the model’s performance. The AUC serves as a critical indicator of the predictive capabilities of the model (Fawcett Citation2006). Confusion matrices offer an intuitive understanding of model predictions, including instances of misclassification. Key metrics such as ACC, PPV, TPR, and F1 are used to assess the overall model performance. These metrics are defined as follows:
(5)
(5)
(6)
(6)
(7)
(7)
(8)
(8)
where means that the actual value and predicted value are both positive;
means that the actual value is negative and the predicted value is positive;
means that the actual value is positive and the predicted value is negative;
means that both the actual value and the predicted value are negative.
3.2.6. SHAP interpreter
SHAP is a game-theoretic approach used to interpret machine learning models, as described by Lundberg and Lee (Citation2017). Its primary advantage lies in the ability to quantify the contribution of each feature to every individual prediction, including the direction of these contributions, whether positive or negative. This holistic approach quantifies feature importance and also accounts for the complex interactions that underlie model predictions. The essence of the SHAP method involves calculating the marginal contribution of each feature to the model’s output, known as Shapley values. These values facilitate explanations of the model’s ‘black box’, both globally and locally. The mathematical representation for computing these marginal contributions is as follows:
(9)
(9)
where
is the contribution of feature
is the set containing all features,
is the number of features in
is the subset of
that contains feature
and
denote the model results with or without the feature
respectively (Lundberg et al. Citation2019).
SHAP quantifies the contribution of each feature to model predictions and interprets the predictions as the sum of Shapley values assigned to each input feature:
(10)
(10)
where
is the value of the model,
is the constant that explains the model (i.e. the predicted mean of all training samples), and
is the imputed value (Shapley value) of each feature.
SHAP provides a quantitative measure of each feature’s contribution to the model’s predictions, revealing not only the significance of each feature but also how these features interact to influence the prediction outcomes. This insight is invaluable for decision-makers, offering a clear understanding of which features are pivotal and how they shape the predictive results. Such knowledge is crucial for developing targeted, data-informed strategies, enhancing the decision-making process.
3.2.7. Computational efficiency
The duration of model training is significantly influenced by their complexity and the extent of their hyperparameter search space. In this investigation, the RF model necessitates the construction of numerous decision trees to attain optimal performance, resulting in a training time of approximately 40 min. Conversely, the LGBM demonstrates enhanced efficiency in processing large datasets, requiring merely 2 min for training. Both models underwent training on a CPU. Given the substantial computational demands associated with deep learning models, the LSTM’s training was facilitated using a GPU, culminating in a duration of roughly 6 min. All models in this study were developed using Python 3.9. The RF was implemented with the scikit-learn 1.2.1 library, LGBM was facilitated using the lightgbm 4.3.0 library, and LSTM was constructed with the torch 1.7.1 library, utilizing the PyCharm Community Edition 2022.3.2 as the integrated development environment. Computations were performed on a system equipped with an Intel(R) Xeon(R) W-2295 CPU @ 3.00 GHz, 64.0 GB of RAM, and an NVIDIA Quadro RTX 4000 GPU.
4. Results
4.1. Correlation analysis between influencing factors and landslides
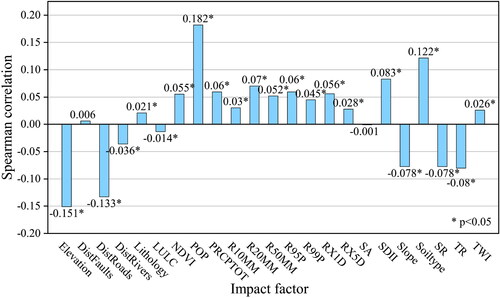
Rational selection of influencing factors is of paramount importance in constructing geological disaster models. Regional landslides result from the combined effects of various influencing factors, which often exhibit a certain degree of correlation. This study focuses on three major aspects: precipitation, human activities, and surface environment. A total of 23 key influencing factors were selected, and their correlations were analyzed using the SCC. The results, depicted in , revealed negative correlations between landslides and factors such as Elevation, DistRoads, DistRivers, LULC, Slope, SR, and TR. Other influencing factors showed positive correlations. It is noteworthy that POP demonstrated the most significant correlation with landslide events, with a SCC of 0.182, emphasizing the substantial impact of human activities on landslide occurrence. Furthermore, Elevation exhibited a SCC of −0.151, suggesting that landslides are more likely to occur at lower elevations. DistRoads, with a SCC of −0.133, was also a significant factor that cannot be overlooked. Among these 23 influencing factors, all except DistFaults and SA reached a significance level of 0.05 for their SCC, indicating their important connections to the occurrence of landslides.
Figure 6. Spearman correlation coefficient between landslides and influence factors.
4.2. Bivariate interaction effects
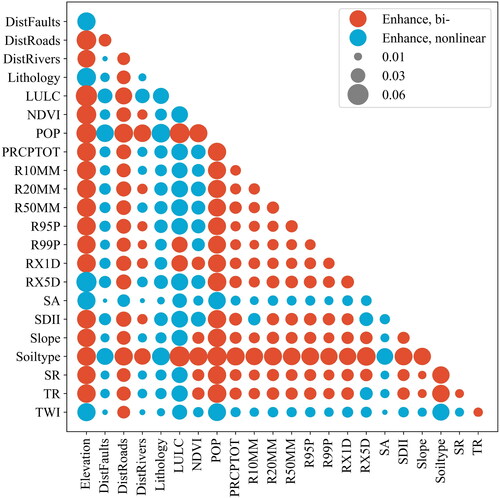
The occurrence of landslides results from the combined influence of multiple factors. To investigate the interrelationships among these factors, the interaction detector from the geodetector toolkit was utilized (Song et al. Citation2020). Analysis of revealed two primary interaction modes between pairs of factors: bivariate enhancement and nonlinear enhancement. This discovery suggests that the interpretive power of landslides is amplified when considering the combined effects of multiple factors. In other words, the interaction between two factors has a more substantial impact on landslides than their independent effects. Larger points in represent higher degrees of landslide impact by the two interacting factors. Among all the bivariate interactions, the most significant influences on landslide occurrence were identified as the interaction between Elevation and LULC, LULC with Soiltype, and Elevation and RX5D. In summary, the cumulative effect of multiple factors increases the likelihood of landslide occurrence. Moreover, Elevation, POP, and Soiltype exhibited strong explanatory power for landslides when combined with various other factors. The combinations involving DistFaults and SA with other factors resulted in a nonlinear enhancement of the explanatory power for landslides.
Figure 7. Interaction effects of influence factors of landslide based on geodetector (red indicates enhanced, bi; blue indicates enhanced, nonlinear).
4.3. Landslide susceptibility assessment
4.3.1. Model construction and evaluation
In this study, a significant dataset imbalance was observed, with the number of non-landslide instances far exceeding the number of landslide instances. To address this issue, all landslide samples were initially extracted, followed by the extraction of an equal number of non-landslide samples from the study area. This process adhered to two primary principles: ensuring a uniform distribution of the non-landslide samples throughout the study area, and halting sampling when a 1:1 ratio of landslide to non-landslide samples was achieved to attain sample balance. As a result, the dataset comprised a total of 7378 records, with an equal representation of landslide and non-landslide data, which were then divided into a training set and a test set in an 8:2 ratio.
The model training and refinement process involved the integration of RF, LGBM, and LSTM models with the Optuna framework for hyperparameter optimization. Optimal hyperparameters were searched within the predefined hyperparameter space. The F1 score was utilized as the benchmark for performance valuation, while the TPE was adopted as the searching technique within the realm of hyperparameter optimization. As shown in , RF model excelled during the training phase, registering laudable outcomes on various evaluative metrics, including ACC, PPV, TPR, and the F1, which were recorded at 0.9615, 0.9278, 1, and 0.9625, respectively. These metrics substantiate the model’s exceptional fidelity to the data. On the test dataset, the model sustained commendable performance, with an ACC of 0.7792 and an F1 of 0.8055. While the LGBM and LSTM were marginally outperformed by the RF model in the training dataset, the LGBM showcased superior PPV on the test set, and the LSTM model was notably distinguished by a TPR of 0.9124 on the same dataset. delineates the AUC for the trio of models across both training and test datasets, with the RF model achieving AUC values of 0.9997 and 0.8387, respectively, thereby outperforming the LGBM and LSTM models. In conclusion, the RF model stands out for its paramount overall performance, underlining its potent predictive capacity for real-world applications, characterized by a high degree of predictive accuracy and reliability.
Figure 8. (a) Receiver operating characteristic curves for the training set; (b) Receiver operating characteristic curves for the test set.
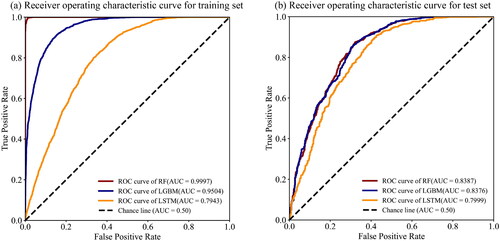
Table 5. Results of model accuracy evaluation.
4.3.2. Distribution pattern of landslide susceptibility
In this study, landslide susceptibility was predicted using the hyperparameter-optimized RF model implemented with the Optuna framework. The susceptibility levels were classified into five categories: very low (0–0.2), low (0.2–0.4), moderate (0.4–0.6), high (0.6–0.8), and very high (0.8–1) (He et al. Citation2021). Analysis of the susceptibility map () reveals that landslide-prone areas are predominantly concentrated in the southern part of the study area, showing a patchy distribution pattern. It is preliminarily inferred that this distribution pattern may be significantly influenced by human activities. Additionally, in the northern part of the region, particularly around the Nujiang and Lancang Rivers, areas prone to landslides display noticeable signs of development along river courses, presenting a linear and densely populated distribution that could be attributed to topography.
Figure 9. Landslide susceptibility map.
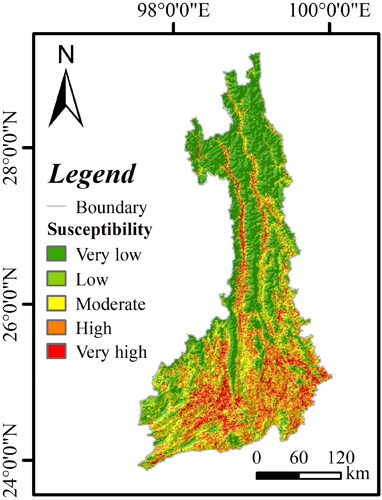
A detailed statistical analysis of the landslide susceptibility zones () revealed that very low risk areas constitute 35.23% of the total study area, yet historically, only 0.24% of landslide events occurred in these zones. In contrast, despite the high and very high-risk zones collectively occupying just 28.17% of the study area, they accounted for 93.79% of the landslide occurrences, with densities of 0.0913/km2 and 0.5329/km2 respectively in these areas. Additionally, the results indicate a correlation between the level of landslide susceptibility and the density of landslide occurrences, consistent with typical characteristics of geohazard-prone areas. Importantly, the model’s predictions demonstrated a high degree of alignment with observed data, thus affirming the model’s accuracy and practical utility.
Table 6. Landslide susceptibility zoning statistics.
4.4. Interpretability analysis of landslide influence factors
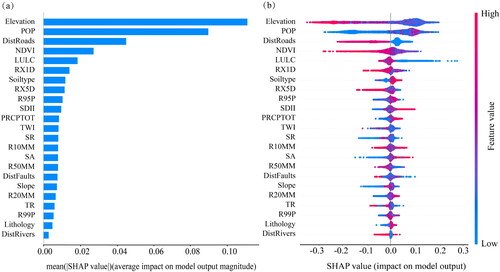
In this study, we employed the SHAP interpreter to provide a detailed interpretation of the RF model for investigating the influence mechanisms of different factors on the spatial distribution of landslides. presents the ranking of factor importance obtained from the mean absolute SHAP values for each sample, highlighting Elevation, POP, DistRoads, NDVI, and LULC as the most significant factors contributing to landslides. In , each feature is represented by a separate row, with the horizontal axis reflecting SHAP values. Each point corresponds to a sample, and the color scale ranging from redder to bluer represents higher to lower feature values, respectively. The analysis reveals a significant negative correlation between Elevation and landslide occurrence within the study area, indicating that lower elevations have a more pronounced positive impact on the occurrence of landslides. Higher NDVI values, reflecting greater vegetation cover, are associated with a reduced probability of landslide events. As anticipated, factors strongly associated with human activities, namely POP and DistRoads, have been found to significantly amplify the risk of landslide incidents. Additionally, LULC types comprising water bodies, urban areas, rural settlements, and other constructed areas have been identified as playing a crucial role in landslide risk. These observations further validate the prominence of human activities as essential factors influencing landslide occurrences within the study area.
Figure 10. SHAP-based feature importance. (a) Factor importance plot; (b) summary plot of SHAP.
5. Discussion
5.1. Advantages of the proposed model
This study presents an interpretable model that integrates RF, Optuna framework, and SHAP. This unified model demonstrates significant advantages in optimal landslide susceptibility assessment and explanatory capabilities. First, the RF model, as an ensemble classifier using decision trees as base models, has been widely utilized in various domains, including landslide susceptibility analysis, due to its noise reduction capability, ability to address overfitting, and apt handling of large, high-dimensional datasets (Kim et al. Citation2018; Liu et al. Citation2018; Wu et al. Citation2023). Furthermore, Optuna is acknowledged as a leading hyperparameter optimization framework tailored for machine and deep learning applications, offering seamless integration with the RF model (Imani and Arabnia Citation2023). Lastly, SHAP, a machine learning explanation method rooted in game theory and local interpretability, is employed to elucidate model outputs, with a particular focus on the well-established application of its tree-based models to the RF model (Lundberg et al. Citation2020; Sun et al. Citation2023). The application of the proposed model in landslide susceptibility assessment, as evidenced in and , demonstrates remarkable performance on both training (ACC = 0.9615, PPV = 0.9278, TPR = 1, F1 = 0.9625, AUC = 0.9997) and test datasets (ACC = 0.7792, PPV = 0.7448, TPR = 0.8769, F1 = 0.8055, AUC = 0.8387).
The effects of hyperparameter optimization on RF were compared using different methods: manual tuning, random search, grid search, Bayesian optimization, and the Optuna framework. presents the performance metrics for RF model under different hyperparameter optimization methods. Regardless of dataset, the utilization of the Optuna framework for hyperparameter optimization yielded improved model performance for the RF model. Furthermore, previous research has demonstrated the effectiveness of the Optuna framework in mitigating model overfitting (Zhang et al. Citation2023).
Table 7. Performance metrics for RF model under different hyperparameter optimization methods.
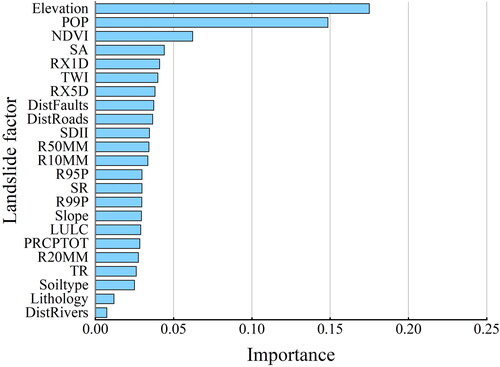
The importance of features in RF model is determined by averaging the contributions of features in splits (), while SHAP values calculate the impact of features on the predictive outcome. When and are compared, the rankings of most features remain consistent across both methods, especially for factors that significantly influence the model, such as Elevation, POP and NDVI. However, discrepancies exist in the ranking of less important features between the two methods, such as LULC, Soiltype, SA, and TWI. These inconsistencies may arise from the fact that the average contributions of features evaluated by RF model do not entirely correspond to the marginal contributions measured by SHAP values. The SHAP offers a more detailed perspective for elucidating model decisions, beyond solely ranking the importance of features; it also reveals the positive and negative effects of features and their distribution, providing a more comprehensive and stable explanation for the model’s predictive outputs.
Figure 11. Importance of features built into the RF model.
5.2. Impacts of input drought factors on model results
To assess the model’s robustness to input data variability and potential biases, the leave-one-out method was utilized in this study for a systematic sensitivity analysis involving 23 landslide factors (Xiao et al. Citation2024), as shown in . Each factor was sequentially excluded from the model, which then utilized the remaining 22 factors to forecast landslides, allowing for an evaluation of each factor’s impact on the prediction outcomes. It was observed that model performance consistently declined upon the exclusion of any factor. Notably, sensitivity was highest with respect to the POP factor; absence of POP resulted in the lowest values across all performance indicators. Nonetheless, while the omission of any factor invariably reduced performance, the magnitude of decline was generally modest. Performance metrics such as ACC, PPV, and F1 remained above 0.72, with TPR and AUC exceeding 0.83. These results highlight the critical role of all input landslide factors in sustaining model performance and demonstrate that the model effectively maintains data sensitivity without compromising predictive accuracy.
Table 8. Model prediction accuracy of the RF model using 22 or 23 drought factors.
5.3. Uncertainty in this study
The number of factors influencing landslide susceptibility is extensive, and the primary factors vary by region (Carrara et al. Citation2008; Xie et al. Citation2017; Wang et al. Citation2020; Berhane et al. Citation2021; Sun et al. Citation2021). Although this study has considered 23 landslide factors, whether these factors are sufficient to meet the needs for landslide susceptibility prediction in all regions remains a question worth considering.
Additionally, considering the diversity and varying spatial scales of the data used in this study, resampling was employed to standardize the spatial scales for computational convenience. However, this resampling process may inadvertently omit critical information corresponding to actual landslide factors, potentially diminishing the model’s predictive accuracy.
Furthermore, previous research indicates that the selection of sampling areas and the ratios of non-landslide to landslide samples significantly impact susceptibility assessment results (Hong et al. Citation2019). In this study, non-landslide and landslide samples were randomly sampled at a 1:1 ratio, which might adversely affect the evaluation outcomes. There is a potential risk during the random sampling process of misclassifying areas prone to landslides as non-landslide samples, possibly leading to a misinterpretation of their true susceptibility. Additionally, the 1:1 ratio may not reflect the actual proportion in the real world, potentially affecting the model’s accuracy and sensitivity.
In light of these considerations, future work will focus on developing a method that both unifies the scale of landslide factors and minimizes information loss, as well as identifying the optimal sampling regions and proportions for non-landslide samples to enhance the model’s predictive accuracy.
5.4. Model generalizability
The model proposed in this study has been applied to the northwestern Yunnan region, demonstrating potential for generalizability across areas with diverse geological and environmental characteristics. Despite robust performance in the specified region (F1 = 0.8055 and AUC = 0.8387), the model’s generalizability may require adjustments when deployed in varying environments. High-quality meteorological, terrestrial, and human activity data are crucial for model construction. In regions where such data are lacking, the model may not achieve the expected results. This study identified 23 landslide factors from precipitation, surface environments, and human activities, insufficient to meet the landslide susceptibility forecasting needs of all regions. However, for areas heavily influenced by specific conditions, it may be necessary to incorporate additional landslide factors to enhance the predictive adaptability and accuracy.
6. Conclusions
This study presents an interpretable model that integrates RF model, Optuna hyperparameter optimization, and SHAP to achieve optimal evaluation of landslide susceptibility and provide explanations in Northwest Yunnan Province, China. An inventory of 4447 landslides and 23 related factors was used for the landslide susceptibility assessment. The relevance of these landslide factors was ensured through the utilization of the SCC and geodetector. The results indicated that 21 out of the 23 landslide factors exhibited a significant correlation with landslides, and the interaction of any two different factors enhanced the explanatory power for landslides. By leveraging the hyperparameter-optimized RF model using the Optuna framework, in conjunction with landslide factors and historical landslides, spatial distribution maps of landslide susceptibility were generated. The model’s performance analysis revealed outstanding results on the test set, with an ACC of 0.7792, F1 of 0.8055, and an AUC of 0.8387. Furthermore, the interpretation of the model was facilitated through the utilization of SHAP. The results emphasized the paramount importance of factors such as Elevation, POP, DistRoads, NDVI, and LULC in determining landslide susceptibility. Areas at lower elevations, especially those that are aquatic, heavily impacted by human activities, or characterized by sparse vegetation coverage, are more susceptible to landslides. The proposed new interpretable model offers a fresh perspective for evaluating landslide susceptibility at a regional scale. Moving forward, further exploration of advanced machine learning models and comprehensive landslide factors holds promise for advancing this field.
Data availability statement
The data presented in this study are available on request from the corresponding author.
Disclosure statement
No potential conflict of interest was reported by the authors.
Additional information
Funding
References
- Abdollahi A, Pradhan B. 2023. Explainable artificial intelligence (XAI) for interpreting the contributing factors feed into the wildfire susceptibility prediction model. Sci Total Environ. 879:163004. doi: 10.1016/j.scitotenv.2023.163004.
- Akiba T, Sano S, Yanase T, Ohta T, Koyama M. 2019. Optuna: a next-generation hyperparameter optimization framework. KDD '19: Proceedings of the 25th ACM SIGKDD International Conference on Knowledge Discovery & Data; p. 2623–2631. doi: 10.1145/3292500.3330701.
- Berhane G, Kebede M, Alfarrah N. 2021. Landslide susceptibility mapping and rock slope stability assessment using frequency ratio and kinematic analysis in the mountains of Mgulat area, Northern Ethiopia. Bull Eng Geol Environ. 80(1):285–301. doi: 10.1007/s10064-020-01905-9.
- Breiman L. 2001. Random forests. Mach Learn. 45(1):5–32. doi: 10.1023/A:1010933404324.
- Carrara A, Crosta G, Frattini P. 2008. Comparing models of debris-flow susceptibility in the alpine environment. Geomorphology. 94(3–4):353–378. doi: 10.1016/j.geomorph.2006.10.033.
- Chen C, Fan L. 2023a. An attribution deep learning interpretation model for landslide susceptibility mapping in the Three Gorges Reservoir area. IEEE Trans Geosci Remote Sensing. 61:1–15. doi: 10.1109/TGRS.2023.3323668.
- Chen C, Fan L. 2023b. Selection of contributing factors for predicting landslide susceptibility using machine learning and deep learning models. Stoch Environ Res Risk Assess.1–26. doi: 10.1007/s00477-023-02556-4.
- Chen Z, Zhou H, Ye F, Liu B, Fu W. 2022. Landslide susceptibility mapping along the Anninghe fault zone in China using SVM and ACO-PSO-SVM models. Lithosphere. 2022(1):5216125. doi: 10.2113/2022/5216125.
- Chu H-J, Lin Y-P, Huang Y-L, Wang Y-C. 2009. Detecting the land-cover changes induced by large-physical disturbances using landscape metrics, spatial sampling, simulation and spatial analysis. Sensors (Basel). 9(9):6670–6700. doi: 10.3390/s90906670.
- Dikshit A, Pradhan B. 2021. Interpretable and explainable AI (XAI) model for spatial drought prediction. Sci Total Environ. 801:149797. doi: 10.1016/j.scitotenv.2021.149797.
- Fawcett T. 2006. An introduction to ROC analysis. Pattern Recognit Lett. 27(8):861–874. doi: 10.1016/j.patrec.2005.10.010.
- Froude MJ, Petley DN. 2018. Global fatal landslide occurrence from 2004 to 2016. Nat Hazards Earth Syst Sci. 18(8):2161–2181. doi: 10.5194/nhess-18-2161-2018.
- Gokceoglu C, Sonmez H, Nefeslioglu HA, Duman TY, Can T. 2005. The 17 March 2005 Kuzulu landslide (Sivas, Turkey) and landslide-susceptibility map of its near vicinity. Eng Geol. 81(1):65–83. doi: 10.1016/j.enggeo.2005.07.011.
- Guliyev H, Mustafayev E. 2022. Predicting the changes in the WTI crude oil price dynamics using machine learning models. Resour Policy. 77:102664. doi: 10.1016/j.resourpol.2022.102664.
- He F, Tan S, Liu H. 2022. Mechanism of rainfall induced landslides in Yunnan Province using multi-scale spatiotemporal analysis and remote sensing interpretation. Microprocess Microsyst. 90:104502. doi: 10.1016/j.micpro.2022.104502.
- He Q, Wang M, Liu K. 2021. Rapidly assessing earthquake-induced landslide susceptibility on a global scale using random forest. Geomorphology. 391:107889. doi: 10.1016/j.geomorph.2021.107889.
- Hong H, Miao Y, Liu J, Zhu AX. 2019. Exploring the effects of the design and quantity of absence data on the performance of random forest-based landslide susceptibility mapping. Catena. 176:45–64. doi: 10.1016/j.catena.2018.12.035.
- Hong H, Tsangaratos P, Ilia I, Chen W, Xu C. 2017. Comparing the performance of a logistic regression and a random forest model in landslide susceptibility assessments. The Case of Wuyaun Area, China. In: Mikos M, Tiwari B, Yin Y, and Sassa K, editors. Advancing culture of living with landslides. Cham: Springer International Publishing; p. 1043–1050. doi: 10.1007/978-3-319-53498-5_118.
- Hong H, Tsangaratos P, Ilia I, Liu J, Zhu AX, Chen W. 2018. Application of fuzzy weight of evidence and data mining techniques in construction of flood susceptibility map of Poyang County, China. Sci Total Environ. 625:575–588. doi: 10.1016/j.scitotenv.2017.12.256.
- Ilia I, Tsangaratos P. 2016. Applying weight of evidence method and sensitivity analysis to produce a landslide susceptibility map. Landslides. 13(2):379–397. doi: 10.1007/s10346-015-0576-3.
- Imani M, Arabnia HR. 2023. Hyperparameter optimization and combined data sampling techniques in machine learning for customer churn prediction: a comparative analysis. Technologies. 11(6):167. doi: 10.3390/technologies11060167.
- Khosravi K, Nohani E, Maroufinia E, Pourghasemi HR. 2016. A GIS-based flood susceptibility assessment and its mapping in Iran: a comparison between frequency ratio and weights-of-evidence bivariate statistical models with multi-criteria decision-making technique. Nat Hazards. 83(2):947–987. doi: 10.1007/s11069-016-2357-2.
- Kim J-C, Lee S, Jung H-S, Lee S. 2018. Landslide susceptibility mapping using random forest and boosted tree models in Pyeong-Chang, Korea. Geocarto Int. 33(9):1000–1015. doi: 10.1080/10106049.2017.1323964.
- Li L, Lan H, Guo C, Zhang Y, Li Q, Wu Y. 2016. A modified frequency ratio method for landslide susceptibility assessment. Landslides. 14(2):727–741. doi: 10.1007/s10346-016-0771-x.
- Li XZ, Kong JM. 2014. Application of GA–SVM method with parameter optimization for landslide development prediction. Nat Hazards Earth Syst Sci. 14(3):525–533. doi: 10.5194/nhess-14-525-2014.
- Li Y-G, He D, Hu J-M, Cao J. 2015. Variability of extreme precipitation over Yunnan Province, China 1960–2012. Intl J Climatol. 35(2):245–258. doi: 10.1002/joc.3977.
- Liao M, Wen H, Yang L. 2022. Identifying the essential conditioning factors of landslide susceptibility models under different grid resolutions using hybrid machine learning: a case of Wushan and Wuxi counties, China. Catena. 217:106428. doi: 10.1016/j.catena.2022.106428.
- Lin N, Zhang D, Feng S, Ding K, Tan L, Wang B, Chen T, Li W, Dai X, Pan J, et al. 2023. Rapid landslide extraction from high-resolution remote sensing images using SHAP-OPT-XGBoost. Remote Sens. 15(15):3901. doi: 10.3390/rs15153901.
- Liu J, Li S, Chen T. 2018. Landslide susceptibility assesment based on optimized random forest model. Geomatics Inf Sci Wuhan Univ. 43(7):1085–1091. doi: 10.13203/j.whugis20160515.
- Liu M, Xu B, Li Z, Mao W, Zhu Y, Hou J, Liu W. 2023. Landslide susceptibility zoning in Yunnan Province based on SBAS-InSAR technology and a random forest model. Remote Sens. 15(11):2864. doi: 10.3390/rs15112864.
- Liu Z, Ma J, Xia D, Jiang S, Ren Z, Tan C, Lei D, Guo H. 2023. Toward the reliable prediction of reservoir landslide displacement using earthworm optimization algorithm-optimized support vector regression (EOA-SVR). Nat Hazards. 120(4):3165–3188. doi: 10.1007/s11069-023-06322-1.
- Long Y, Li W, Huang R, Xu Q, Yu B, Liu G. 2023. A comparative study of supervised classification methods for investigating landslide evolution in the Mianyuan River Basin, China. J Earth Sci. 34(2):316–329. doi: 10.1007/s12583-021-1525-9.
- Lundberg SM, Erion G, Chen H, DeGrave A, Prutkin JM, Nair B, Katz R, Himmelfarb J, Bansal N, Lee S-I. 2020. From local explanations to global understanding with explainable AI for trees. Nat Mach Intell. 2(1):56–67. doi: 10.1038/s42256-019-0138-9.
- Lundberg SM, Lee S-I. 2017. A unified approach to interpreting model predictions. 31st Annual Conference on Neural Information Processing Systems (NIPS); Dec 4–9; Long Beach, CA; p. 30.
- Lundberg SM, Erion GG, Lee S-I. 2019. Consistent individualized feature attribution for tree ensembles. arXiv:1802.03888v3. doi: 10.48550/arXiv.1802.03888.
- Ma J, Lei D, Ren Z, Tan C, Xia D, Guo H. 2023. Automated machine learning-based landslide susceptibility mapping for the Three Gorges Reservoir area, China. Math Geosci. 55:1–36. doi: 10.1007/s11004-023-10116-3.
- Mojaddadi H, Pradhan B, Nampak H, Ahmad N, bin Ghazali AH. 2017. Ensemble machine-learning-based geospatial approach for flood risk assessment using multi-sensor remote-sensing data and GIS. Geomatics Nat Hazards Risk. 8(2):1080–1102. doi: 10.1080/19475705.2017.1294113.
- Prodhan FA, Zhang J, Hasan SS, Sharma TPP, Mohana HP. 2022. A review of machine learning methods for drought hazard monitoring and forecasting: current research trends, challenges, and future research directions. Environ Model Softw. 149:105327. doi: 10.1016/j.envsoft.2022.105327.
- Qiu H, Cui P, Regmi AD, Hu S, Zhang Y, He Y. 2018. Landslide distribution and size versus relative relief (Shaanxi Province, China). Bull Eng Geol Environ. 77(4):1331–1342. doi: 10.1007/s10064-017-1121-5.
- Reichenbach P, Rossi M, Malamud BD, Mihir M, Guzzetti F. 2018. A review of statistically-based landslide susceptibility models. Earth Sci Rev. 180:60–91. doi: 10.1016/j.earscirev.2018.03.001.
- Ribeiro da Silva C, Luo X, Lin F, Zhu S, Yu M, Zhang Z, Meng L, Peng J. 2019. Mine landslide susceptibility assessment using IVM, ANN and SVM models considering the contribution of affecting factors. PLoS One. 14(4):e0215134. doi: 10.1371/journal.pone.0215134.
- Rodríguez E, Morris CS, Belz JE. 2006. A global assessment of the SRTM performance. Photogramm Eng Remote Sensing. 72(3):249–260. doi: 10.14358/PERS.72.3.249.
- Saha S, Arabameri A, Saha A, Blaschke T, Ngo PTT, Nhu VH, Band SS. 2021. Prediction of landslide susceptibility in Rudraprayag, India using novel ensemble of conditional probability and boosted regression tree-based on cross-validation method. Sci Total Environ. 764:142928. doi: 10.1016/j.scitotenv.2020.142928.
- Sayre R, Dangermond J, Frye C, Vaughan R, Aniello P, Breyer S, Cribbs D, Hopkins D, Naumann R, Derrenbacher B. 2014. A new map of global ecological land units—an ecophysiographic stratification approach. Washington, DC: Association of American Geographers. doi: 10.13140/2.1.2167.8887.
- Schmidt KM, Montgomery DR. 1995. Limits to relief. Science. 270(5236):617–620. doi: 10.1126/science.270.5236.617.
- Shirani K, Pasandi M, Arabameri A. 2018. Landslide susceptibility assessment by Dempster-Shafer and Index of Entropy models, Sarkhoun basin, Southwestern Iran. Nat Hazards. 93(3):1379–1418. doi: 10.1007/s11069-018-3356-2.
- Shu H, Hürlimann M, Molowny-Horas R, González M, Pinyol J, Abancó C, Ma J. 2019. Relation between land cover and landslide susceptibility in Val d‘Aran, Pyrenees (Spain): historical aspects, present situation and forward prediction. Sci Total Environ. 693:133557. doi: 10.1016/j.scitotenv.2019.07.363.
- Song Y, Li Y, Zou Y, Wang R, Liang Y, Xu S, He Y, Yu X, Wu W. 2024. Synergizing multiple machine learning techniques and remote sensing for advanced landslide susceptibility assessment: a case study in the Three Gorges Reservoir Area. Environ Earth Sci. 83(8):227. doi: 10.1007/s12665-024-11521-5.
- Song Y, Wang J, Ge Y, Xu C. 2020. An optimal parameters-based geographical detector model enhances geographic characteristics of explanatory variables for spatial heterogeneity analysis: cases with different types of spatial data. GIsci Remote Sens. 57(5):593–610. doi: 10.1080/15481603.2020.1760434.
- Stumpf A, Kerle N. 2011. Object-oriented mapping of landslides using Random Forests. Remote Sens Environ. 115(10):2564–2577. doi: 10.1016/j.rse.2011.05.013.
- Sun D, Shi S, Wen H, Xu J, Zhou X, Wu J. 2021. A hybrid optimization method of factor screening predicated on GeoDetector and Random Forest for Landslide Susceptibility Mapping. Geomorphology. 379:107623. doi: 10.1016/j.geomorph.2021.107623.
- Sun D, Wen H, Wang D, Xu J. 2020. A random forest model of landslide susceptibility mapping based on hyperparameter optimization using Bayes algorithm. Geomorphology. 362:107201. doi: 10.1016/j.geomorph.2020.107201.
- Sun Z, Wang D, Gu X, Abdel-Aty M, Xing Y, Wang J, Lu H, Chen Y. 2023. A hybrid approach of random forest and random parameters logit model of injury severity modeling of vulnerable road users involved crashes. Accid Anal Prev. 192:107235. doi: 10.1016/j.aap.2023.107235.
- Tang X, Hong H, Shu Y, Tang H, Li J, Liu W. 2019. Urban waterlogging susceptibility assessment based on a PSO-SVM method using a novel repeatedly random sampling idea to select negative samples. J Hydrol. 576:583–595. doi: 10.1016/j.jhydrol.2019.06.058.
- Tatem AJ. 2017. WorldPop, open data for spatial demography. Sci Data. 4(1):170004. doi: 10.1038/sdata.2017.4.
- Trigila A, Iadanza C, Esposito C, Scarascia-Mugnozza G. 2015. Comparison of Logistic Regression and Random Forests techniques for shallow landslide susceptibility assessment in Giampilieri (NE Sicily, Italy). Geomorphology. 249:119–136. doi: 10.1016/j.geomorph.2015.06.001.
- Van den Eeckhaut M, Vanwalleghem T, Poesen J, Govers G, Verstraeten G, Vandekerckhove L. 2006. Prediction of landslide susceptibility using rare events logistic regression: a case-study in the Flemish Ardennes (Belgium). Geomorphology. 76(3-4):392–410. doi: 10.1016/j.geomorph.2005.12.003.
- Wang J-F, Li X-H, Christakos G, Liao Y-L, Zhang T, Gu X, Zheng X-Y. 2010. Geographical detectors-based health risk assessment and its application in the Neural Tube Defects Study of the Heshun Region, China. Int J Geogr Inf Sci. 24(1):107–127. doi: 10.1080/13658810802443457.
- Wang J-l, Yu Y-h 2021. Comprehensive drought monitoring in Yunnan Province, China using multisource remote sensing data. J Mt Sci. 18(6):1537–1549. doi: 10.1007/s11629-020-6333-7.
- Wang Q, Li W, Wu Y, Pei Y, Xie P. 2016. Application of statistical index and index of entropy methods to landslide susceptibility assessment in Gongliu (Xinjiang, China). Environ Earth Sci. 75(7):599. doi: 10.1007/s12665-016-5400-4.
- Wang S, Zhuang J, Zheng J, Fan H, Kong J, Zhan J. 2021. Application of Bayesian hyperparameter optimized Random Forest and XGBoost model for landslide susceptibility mapping. Front Earth Sci. 9:712240. doi: 10.3389/feart.2021.712240.
- Wang Y, Sun D, Wen H, Zhang H, Zhang F. 2020. Comparison of random forest model and frequency ratio model for landslide susceptibility mapping (LSM) in Yunyang County (Chongqing, China). Int J Environ Res Public Health. 17(12):4206. doi: 10.3390/ijerph17124206.
- Wei A, Li D, Zhou Y, Deng Q, Yan L. 2021. A novel combination approach for karst collapse susceptibility assessment using the analytic hierarchy process, catastrophe, and entropy model. Nat Hazards. 105(1):405–430. doi: 10.1007/s11069-020-04317-w.
- de Winter JCF, Gosling SD, Potter J. 2016. Comparing the Pearson and Spearman correlation coefficients across distributions and sample sizes: a tutorial using simulations and empirical data. Psychol Methods. 21(3):273–290. doi: 10.1037/met0000079.
- Wu X, Song Y, Chen W, Kang G, Qu R, Wang Z, Wang J, Lv P, Chen H. 2023. Analysis of geological hazard susceptibility of landslides in Muli County based on random forest algorithm. Sustainability. 15(5):4328. doi: 10.3390/su15054328.
- Wu Y, Li W, Wang Q, Liu Q, Yang D, Xing M, Pei Y, Yan S. 2016. Landslide susceptibility assessment using frequency ratio, statistical index and certainty factor models for the Gangu County, China. Arab J Geosci. 9(2):84. doi: 10.1007/s12517-015-2112-0.
- Xiao X, Ming W, Luo X, Yang L, Li M, Yang P, Ji X, Li Y. 2024. Leveraging multisource data for accurate agricultural drought monitoring: a hybrid deep learning model. Agric Water Manag. 293:108692. doi: 10.1016/j.agwat.2024.108692.
- Xie W, Nie W, Saffari P, Robledo LF, Descote P-Y, Jian W. 2021. Landslide hazard assessment based on Bayesian optimization-support vector machine in Nanping City, China. Nat Hazards. 109(1):931–948. doi: 10.1007/s11069-021-04862-y.
- Xie Z, Chen G, Meng X, Zhang Y, Qiao L, Tan L. 2017. A comparative study of landslide susceptibility mapping using weight of evidence, logistic regression and support vector machine and evaluated by SBAS-InSAR monitoring: Zhouqu to Wudu segment in Bailong River Basin, China. Environ Earth Sci. 76(8):313. doi: 10.1007/s12665-017-6640-7.
- Xu C, Xu X, Yao X, Dai F. 2013. Three (nearly) complete inventories of landslides triggered by the May 12, 2008 Wenchuan Mw 7.9 earthquake of China and their spatial distribution statistical analysis. Landslides. 11(3):441–461. doi: 10.1007/s10346-013-0404-6.
- Youssef K, Shao K, Moon S, Bouchard LS. 2023. Landslide susceptibility modeling by interpretable neural network. Commun Earth Environ. 4(1):162. doi: 10.1038/s43247-023-00806-5.
- Zhang J, Ma X, Zhang J, Sun D, Zhou X, Mi C, Wen H. 2023. Insights into geospatial heterogeneity of landslide susceptibility based on the SHAP-XGBoost model. J Environ Manage. 332:117357. doi: 10.1016/j.jenvman.2023.117357.
- Zhang XB, Alexander L, Hegerl GC, Jones P, Tank AK, Peterson TC, Trewin B, Zwiers FW. 2011. Indices for monitoring changes in extremes based on daily temperature and precipitation data. Wiley Interdiscip Rev Clim Change. 2(6):851–870. doi: 10.1002/wcc.147.
- Zhang Y, Lan H, Li L, Wu Y, Chen J, Tian N. 2020. Optimizing the frequency ratio method for landslide susceptibility assessment: a case study of the Caiyuan Basin in the southeast mountainous area of China. J Mt Sci. 17(2):340–357. doi: 10.1007/s11629-019-5702-6.
- Zhao Y, Wang R, Jiang Y, Liu H, Wei Z. 2019. GIS-based logistic regression for rainfall-induced landslide susceptibility mapping under different grid sizes in Yueqing, Southeastern China. Eng Geol. 259:105147. doi: 10.1016/j.enggeo.2019.105147.
- Zhou X, Wen H, Li Z, Zhang H, Zhang W. 2022. An interpretable model for the susceptibility of rainfall-induced shallow landslides based on SHAP and XGBoost. Geocarto Int. 37(26):13419–13450. doi: 10.1080/10106049.2022.2076928.