
ABSTRACT
Alcohol use disorder (AUD) is a chronic relapsing disease associated with malnutrition, metabolic disturbances, and gut microbiota alterations that are correlated with the severity of psychological symptoms. This study aims at supplementing AUD patients with prebiotic fiber during alcohol withdrawal, in order to modulate the gut microbiota composition and to evaluate its effect on gastrointestinal tolerance, metabolism, and patient’s behavior. A randomized, double-blind, placebo-controlled study included 50 AUD patients assigned to inulin versus maltodextrin daily supplementation for 17 days. Biological measurements (fecal microbial 16S rDNA sequencing, serum biology), dietary intake, validated psychological questionnaires, and gastrointestinal tolerance assessment were performed before and after the intervention. Inulin significantly decreased the richness and evenness and induced changes of 8 genera (q < 0.1) including Bifidobacterium and Bacteroides. Prebiotic had minor effects on gastrointestinal symptoms and nutritional intakes compared to placebo. All patients showed an improvement in depression, anxiety, and craving scores during alcohol withdrawal regardless of the intervention group. Interestingly, only patients treated with inulin significantly improved the sociability score and had an increased serum level of brain-derived neurotrophic factor. This pilot study shows that inulin is well tolerated and modulates the gut microbiota and the social behavior in AUD patients, without further improving other psychological and biological parameters as compared to placebo. Gut2Brain study, clinicaltrial.gov: NCT03803709, https://clinicaltrials.gov/ct2/show/NCT03803709
Introduction
Alcohol use disorder (AUD) is a major public health problem affecting 5–10% of the population in developed countries. AUD is associated with metabolic disturbances, nutritional imbalance and has deleterious effects on mental health.Citation1,Citation2 AUD patients are prone to develop emotional and cognitive symptoms that contribute to the persistence of addictive behavior and to the risk of relapse.Citation2 Chronic alcohol consumption induces alterations in neurotransmission and it has been shown that alcohol consumption and appetite regulation share common neurobiological mechanisms with hormones (leptin, ghrelin) and neuromodulators (dopaminergic, opioidergic system) being involved in both eating and addictive behaviors.Citation3–6 However, chronic ethanol exposure impacts other systems that could interact with the brain and therefore also influence behavior. Indeed, chronic alcohol consumption is associated with alterations in the composition and function of the gut microbiota.Citation7–9 These changes include increased abundance of Lachnospiraceae while there is a decrease of some specific bacteria like Bifidobacterium and Faecalibacterium prausnitzii.Citation7,Citation10,Citation11 Several studies demonstrated that alterations of gut function could have an impact on cognition, mood and behavior.Citation12–15 We have previously established a link between gut dysbiosis, intestinal permeability and the severity of psychological symptoms, such as depression, anxiety, alcohol craving but also social impairments, suggesting the involvement of the gut-brain axis in the etiology of AUD.Citation7,Citation16
Diet is one of the main modulators of the gut microbiota composition and function.Citation17 AUD patients have reduced carbohydrate, protein and fat intakes, and their dietary fiber (DF) intake is also well below the recommended value.Citation18–20 Among DF, inulin-type fructans are interesting as they go along with the definition of prebiotics: “substrates that are selectively used by host microorganisms conferring a health benefit” meaning that they promote the growth of some specific bacteria.Citation21 Inulin-type fructans are natural components present in several fruits and vegetables including wheat, onion, banana, garlic, jerusalem artichoke, chirory and leek.Citation22 Inulin is fermented in the colon and has been shown to promote the growth of Bifidobacterium and Faecalibacterium prausnitzii.Citation23,Citation24 The effects of inulin on gut health and metabolism have been widely studied in the context of obesity and metabolic disorders. For instance, fructan supplementation improves gut barrier function, decreases serum lipopolysaccharides (LPS) and inflammatory cytokines in preclinical and clinical studies.Citation23,Citation25,Citation26 We have also shown that DF deficiency in AUD patients is associated with gastrointestinal discomfort and psychological alterations.Citation18 Therefore, inulin supplementation could be an interesting approach to increase dietary fiber intake and to modulate the gut microbiota in order to improve psychological symptoms of AUD patients.
The objective of the study was to test in a randomized, placebo-controlled design the effect of enhanced dietary fiber intake, through inulin supplementation, on gut microbiota composition gastrointestinal tolerance, mood, alcohol craving and biological markers of satiety, lipid and glucose homeostasis.
Results
Study population
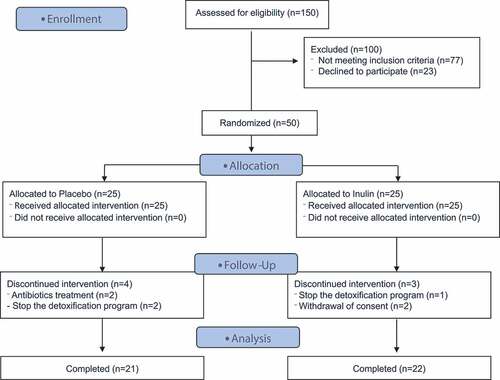
Among the 50 enrolled patients, 4 dropped out of the study in the placebo group and 3 in the inulin group (). The population therefore consisted of 21 patients with complete data in the placebo group and 22 in the inulin group at T2. Compliance with the study treatment was 96% in placebo and 98% in inulin group. The sociodemographic and clinical comparisons of the two groups are presented in . Patients from both groups were similar except for the DSM-5 score (p = .01) and the number of alcohol withdrawal cures (p = .04). The inulin group had on average 1 more criteria in the DSM-5 classification and underwent less previous alcohol withdrawal cures (2.6 ± 2.4 in placebo vs 1.4 ± 0.80 in inulin group). The patients in both groups were characterized by severe AUD (DSM-5 ≥ 6 criteria) and no difference was found in terms of alcohol consumption, duration of drinking habits and age of loss of control. A gender imbalance was observed between the groups although it did not reach significance (24% of women in placebo group vs 50% in inulin group; p = .11). Eight patients relapsed during the second week of the program (at home) in placebo group vs 12 in inulin group (32% vs 48% respectively p = .25). The subjects who relapsed had consumed alcohol on 3 out of 7 days (2.8 ± 2.1 in placebo vs 3.4 ± 1.9 in inulin group, p = .45). Patients who relapsed in the placebo group consumed 79 g/d of ethanol on average vs 76 g/d in the inulin group (p = .96).
Table 1. Baseline characteristics of study participants
Figure 1. Flow chart of the Gut2Brain study
Inulin supplementation is well tolerated by AUD patients
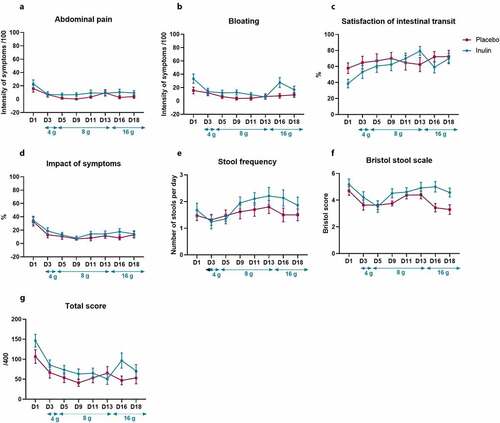
It has been shown that fermentable DF intake, such as inulin, could lead to bloating and discomfort in some individuals.Citation27,Citation28 We therefore carefully monitored the gastrointestinal tolerance of patients throughout the intervention. Gastrointestinal pain was assessed from the first day of hospitalization and then every other day from the beginning of treatment (day 3 to day 18). The results are presented in . There was no difference for abdominal pain, bloating, satisfaction of transit or the impact of the symptoms on daily life between placebo and inulin groups (). The frequency and the consistency of stools were comparable between both groups of treatment (). Because it has been shown that functional gastrointestinal disorders are more prevalent in women than in men, we also took into account the gender.Citation29 Gender adjustment did not affect the results (Supplementary Table S1).
Figure 2. Changes in gastrointestinal symptoms after inulin supplementation in AUD patients. Values are mean ± SEM. Gastrointestinal symptoms including abdominal pain (a), bloating (b) and satisfaction of intestinal transit (c), impact of the symptoms on daily life (d), stool frequency (e), Bristol stool form scale (f) and (g) total tolerance score. Linear mixed models were performed for detecting the treatment effect throughout the study. D1 represents the baseline score before the supplementation. D3 represents the first day of inulin or placebo treatment
Inulin supplementation induces changes in gut microbiota composition at phylum, family, and genus level in AUD patients
Fecal samples were collected in 24 patients at T1 and in 19 at T2 for the placebo group and 22 patients at T1 and 19 at T2 for the inulin group. MANOVA with 9999 permutations performed on 4 beta-diversity indices (Bray-Curtis, Jaccard, Unweighted UniFrac and Weighted UniFrac) returned a non-significant p-value (). However, the α-diversity indexes highlighted that inulin induced a decrease in richness and evenness. Indeed, inulin supplementation decreased significantly the number of observed species as well as Chao1 and Shannon indexes (). The total bacteria amount, measured by qPCR, was not impacted by inulin supplementation (). Phylum and family levels of bacteria revealed changes in the inulin group (). Indeed, in this group, we observed a significant increase in Actinobacteriota phylum (q < 0.05) and Bifidobacteriaceae family (q < 0.05). We also observed a significant decrease in the Bacteroidaceae family in the inulin group. At the genus level, prebiotic treatment largely increased Bifidobacterium and decreased Bacteroides, Dorea and Ruminococcus torques group (q < 0.05; ). We also observed a trend toward an increase in Faecalibacterium relative abundance (4.8 ± 3.2% at T1 vs 6.3 ± 4.4% at T2; p = .055; data not shown) after inulin supplementation. Inulin supplementation induced a significant increase in the abundance of Bifidobacterium adolescentis and Bifidobacterium longum (Supplementary Figure S1).
Figure 3. Effect of inulin supplementation on gut microbiota composition in alcohol use disorder patients. (a) Principal coordinate analysis (PCoA) of the Bray Curtis index (b) Changes in alpha-diversity indexes: Number of observed species, Chao-1 and Shannon. *p < .05, **p < .01,***p < .001 (c) Changes in total bacteria measured by qPCR. (d) Relative abundances of bacterial taxa accounting for more than 1%, at the phylum and family levels, assessed using Illumina 16S rRNA gene sequencing in AUD patients supplemented with placebo (n = 19) or inulin (n = 19). Wilcoxon paired tests were performed to compare the evolution from baseline in each group. P-values were adjusted to control for the false discovery rate for multiple testing according to the Benjamini and Hochberg procedure *q < 0.10 in inulin group, † q < 0.10 in placebo group. (e) Relative abundances of genera that were significantly change between T1 and T2 in inulin group. Wilcoxon paired tests were performed and p-values were adjusted to control for the false discovery rate for multiple testing according to the Benjamini and Hochberg procedure *q < 0.1 (f) Spearman correlation between the change in sociability score (T2-T1) and the change of Bifidobacterium levels (T2-T1) measured by qPCR in inulin group
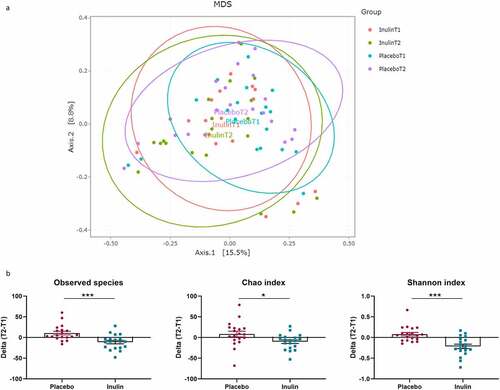
Figure 3. Continued
Table 2. Significant changes in relative abundance of gut bacteria at the genus level in AUD patient receiving inulin or placebo for 3 weeks*
In the placebo group, some changes occurred (none of them at the q value), with a decrease of Acidaminococcus, Sutterella, Oscillibacter, Escherichia-Shigella, Flavonifractor and Bifidobacterium and an increase in Lachnospiraceae ND3007 group, Lachnospiraceae NK4A136 group, Gordonibacter, Monoglobus, Oscillospiraceae_UCG-002 and Oscillospiraceae_UCG-003 (p < .05 and q > 0.1; ).
Inulin treatment marginally modulates food and drink intakes upon alcohol withdrawal in AUD patients
Globally, inulin supplementation had only a minor effect on food intake (Table S2). Inulin reduced the consumption of roots and tubers despite a lack of significance in the within group comparison (β = −33.2, p = .02; β = −34.4, p = .03 in model 1 and 2 respectively; Table S2). Patients in inulin group increased their fruit or vegetable juice consumption compared to placebo (β = 185.8, p = .03; β = 202.5, p = .03 in model 1 and 2 respectively; Table S2). The placebo group increased bread (p = .001), biscuit and cakes (p = .02) and cheese (p = .009) consumption while the inulin group increased dairy products (excluded cheese) consumption (p = .03). Both groups significantly increased sweets and soda intake (+170 g/d, p = .001 for the placebo group and +254 g/d, p = .04 for the inulin group), the difference between groups was not significant (Table S2). The consumption of raw fruits and coffee also increased, independently of the treatment group, during the withdrawal period (fruits: +48 g/d, p = .03 for placebo group and +42 g/d, p = .02 for inulin group; Coffee: +0.18 L/d, p = .006 for placebo group and +0.16 L/d, p = .008 for inulin group; Table S2).
The Supplementary Table S3 presents the total energy and macronutrient intake of AUD patients. During the second week of the program, at home, 20 patients relapsed (8 in placebo group vs 12 in inulin group) but ethanol consumption was comparable between the two groups. Inulin had no significant effect on food related-energy intake that increased in both groups during the withdrawal period (by 61% in placebo group and by 34% in inulin group; Table S3).
Protein and fat intakes (in grams per day) significantly increased by 24% and 50%, respectively, in the placebo group, whereas those changes were not significant in the inulin group (Table S3). The detailed fat intake is presented in Table S4. Subjects in the inulin group consumed significantly less monounsaturated fatty acids (MUFAs) and polyunsaturated fatty acids (PUFAs) than patients in the placebo group when expressed in g/d (Model 1). Only the effect on PUFAs was maintained when we adjusted for the quantity of ethanol consumed during the second week of the program (Model 2; Table S4). When the results were expressed in % of fatty acids, the intake of saturated fatty acids (SFA) increased significantly in the inulin group compared to placebo while MUFA intake decreased regardless of the model considered for the analysis (Table S4).
We have already shown in a previous study that fiber intake was very low in actively drinking AUD patients.Citation18 During the second week of the program, at home, the two groups increased significantly their TDF intake to reach, on average, 19 g per day (Table S3). Twenty-eight percent of patients in the placebo group had an intake of more than 25 g/d during the second week of the program (Figure S2 A-B). The supplementation with 8 g of inulin was not sufficient to reach the recommended 25 g of fiber per day since only 38% of the patients in the inulin group had an intake higher than 25 g when the supplementation was taken into account (Figure S2B).
Fructan, FOS and GOS intakes (in g/d) increased significantly in the placebo group and fructan and FOS intakes tend to be lower in the inulin group than in placebo (β = −0.97, p = .08 and β = −0.76, p = .06, respectively, in model 2; Table S3). This observation is consistent with the fact that inulin-treated AUD patients ate less roots and tubers than the placebo (Table S2). Taking into account the inulin supplementation, the total amount of fructan intake averaged 9.4 g per day (1.4 g from food and 8 g from supplementation) in the inulin group and 2.1 g per day in the placebo group during the second week of the program.
The effect of inulin supplementation on micronutrient intakes is presented in supplementary table S5. Zinc was differentially modulated by inulin supplementation when we take into account the gender and the quantity of ethanol consumed during the second week of the program (Model 2). Indeed, zinc intake decreased significantly in the inulin group (β = −2.7, p = .03, Table S5). Inulin supplementation had no impact on the intake of other micronutrients.
Biological outcomes, except BDNF, are not modulated by inulin supplementation
It has been shown that inulin supplementation could affect lipid and glucose homeostasis.Citation30,Citation31 We did not observe any difference between the placebo and the inulin group concerning the change (T2-T1) in plasma levels of glucose, cholesterol, triglycerides, and non-esterified fatty acids ().
Table 3. Effect of inulin supplementation on biological parameters
Gut hormones are known to be regulated by DF intake including inulin.Citation32 Moreover, it has been shown that AUD patients display altered levels of some gut hormones that could be related to psychological symptoms.Citation33–35 We therefore investigated the effect of inulin on the levels of gut hormones and gut peptides. Inulin supplementation did not affect the levels of gut peptides and gut hormones (). We did not observe any effect of prebiotic treatment on glucose metabolism as glucagon levels were not modified by the supplementation ().
We next studied the effect of inulin supplementation on BDNF, a neurotrophic factor that has been associated with various neuropsychiatric disorders.Citation36 Inulin increased the serum BDNF level (Model 2: β = 12.7, p = .04; ). Negative correlations between the BDNF level at T2 and the alcohol craving score (presented below) were observed in the global population and in the inulin group (r = −0.37, p = .02 in global AUD population and r = −0.67, p < .001 in inulin group; data not shown).
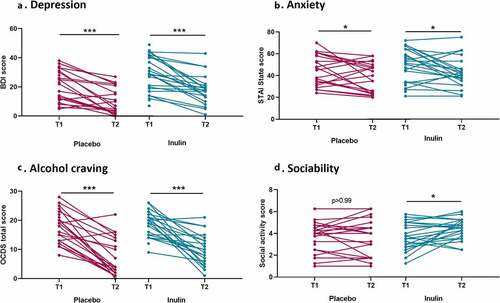
Inulin can modulate social behavior but does not impact mood and alcohol craving in AUD patients
shows the evolution of psychological symptoms between baseline and the end of the study. Depression, anxiety, and alcohol craving scores decreased during alcohol withdrawal regardless of the group. The linear regression models revealed that there were no differences in changes from baseline between the placebo and the inulin group for depression, anxiety andcraving (). While the sociability score remained stable during alcohol withdrawal in the placebo group, the patients in the inulin group had an increase in the medium pleasant social activity score (p < .05) which remained significant after adjustment for potential confounders (β = 0.68, p = .039 in model 1 and β = 0.71, p = .03 in model 2; ). A significant positive correlation was observed between the change of Bifidobacterium and the change of sociability score (). Inulin supplementation had no effect on fatigue (Table S6).
Table 4. Effect of inulin supplementation on psychological parameters
Figure 4. Effect of inulin supplementation on psychological parameters in Alcohol use disorder patients. (a) Score of depression measured by the Beck Depression Inventory. (b) Anxiety measured by the State-Trait Anxiety Inventory (form YA). (c) Alcohol craving (total score) measured by the Obsessive-Compulsive Drinking Scale. (d) Sociability score (social medium pleasant activity score) measure by the social activity test. Wilcoxon signed ranks tests or paired T-tests were performed to analyze changes from baseline according to the distribution *p < .05, **p < .01,***p < .001
Discussion
The aim of the present study was to promote dietary fiber intake, prone to modulate the gut microbiota in AUD patients, by an intervention of inulin versus placebo performed during alcohol withdrawal period. Indeed, from our previous studies, we know that AUD patients are characterized by gut microbial dysbiosis, and, among nutritional disorders, by an intake of DF below the recommendation of the European Food Safety Authority and of the Belgian Health Council (25–30 g per day for health).Citation19,Citation20
The results obtained with the food survey, carried out during the second week of withdrawal, showed that 8 g of inulin were not sufficient to reach the recommended 25 g/day, which reinforces the coherence of the study design that gradually increased the amount of inulin up to 16 g per day. Sixteen grams of inulin supplementation were achieved without significant gastrointestinal side effects. Indeed we showed that inulin was well tolerated by AUD patients with no significant differences compared with placebo concerning abdominal pain, bloating or stool frequency. It has been shown in healthy individuals that inulin increased softening of feces and flatulence episodes.Citation28,Citation37 In our study, AUD patients supplemented with inulin had a mean Bristol score between 4 and 5 at day 18, which corresponds to a normal score.Citation38 Flatulence episodes were not measured in our study.
Seventeen days of inulin supplementation lead to selective modifications of the gut microbiota in AUD patients. First, we observed a decreased in α-diversity in inulin subjects compared to placebo. While several observational studies showed a positive correlation between dietary fiber intake and microbial diversity,Citation39,Citation40 a meta-analysis reported that dietary fiber supplementation had no effect on α-diversity,Citation41 likely due to the short duration of the trials (between 3 and 4 weeks). By contrast, a small number of studies have reported a decrease in species richness with inulin supplementation.Citation42,Citation43 In our study, we also found a decrease in microbial diversity upon inulin exposure in AUD patients. We can conclude that supplementation with only one type of fiber in AUD patients with a poorly varied diet induces a loss of diversity. Since dietary diversity has been shown to correlate positively with microbiota diversity,Citation44 it is likely that long-term adherence to a varied diet is more important in determining microbial diversity than supplementation with an isolated nutrient for a short period. Future long-term studies should be conducted with a combination of different fibers to expect a beneficial effect on microbial diversity.Citation43 We also observed a significant increase in the relative abundance of Actinobacteria, Bifidobacteriaceae and Bifidobacterium, especially B. adolescentis and B. longum. The other Bifidobacterium species were either absent or marginally present, in our AUD population. Bacteroidaceae and Bacteroides decreased significantly after 17 days of inulin supplementation. These results are in line with a recent systematic review that highlights a modification of these two genera with inulin supplementation in human studies, and is in accordance with our previous data of intervention study performed in obese patients.Citation24,Citation45 As Healey et al, upon inulin intervention, we found a trend toward an increase in Faecalibacterium and a significant decrease in Dorea.Citation46 Ruminococcus torques was decreased with inulin supplementation in our study. This bacterium, known to be more abundant in intestinal bowel disease (IBD) patients, is a potent mucus degrader and has been associated with a decrease in gut barrier integrity in previous studies.Citation47 In the placebo group, we observed changes but none of them reached the q value (q > 0.10) meaning that 17 days of abstinence alone was not able to induce strong alterations of the gut microbiota composition. This is in line with our previous work showing a relative stability of the gut microbiota after 3 weeks of withdrawal.Citation48,Citation49
Inulin supplementation had no strong impact on nutrient intake. This is probably due to the duration of the supplementation which was barely 1 week at the time of the nutritional survey. Abstinence alone induces an increase of all macronutrients regardless of the group. However, patients in placebo group increased their fructans, FOS and GOS intake while there were no significant changes in inulin group. Subjects in the placebo group increased their consumption of roots and tuber and bread during week 2, which could explain this result. Patients in the placebo group significantly increased their lipid intake without an increase in a specific type of lipid when looking at the intake as a percentage of total FA.
We also observed a decrease in zinc intake in the inulin group, which could be explained by a decrease in meat intake in the inulin group even if this later result was not significant.
How prebiotics might affect food preferences is still unclear but it has been hypothesized that DF with prebiotic properties could act on the microbiota causing the growth of some specific bacteriaCitation23,Citation50 which can in turn affect eating behavior. Indeed, it has been suggested that bacteria are submitted to selective and evolutionary pressure and are therefore capable of inducing preferences for certain foods to promote their own growth.Citation51 Daud et al. found that oligofructose supplementation had an impact on the desire to eat fatty, sweet and salty foods in overweight and obese population.Citation52 We showed the same effects on food-related behavior upon an inulin-rich diet intervention for 2 weeks in healthy volunteers.Citation28 It is well known that AUD patients have a craving for sweetie food during the withdrawal.Citation53,Citation54 However, in the present study, inulin supplementation did not reveal any impact on sweet intake in AUD patients since we observed an increase in the consumption of sweets and soda in both groups of patients. It is likely that inulin supplementation or the duration of the supplementation are not sufficient to counteract disturbances in the sensory and reward systems that control both alcohol and palatable food craving.Citation55
We hypothesized that the altered gut–microbiota–brain axis in AUD patients can be improved by modulating the gut microbiota composition with inulin known to promote beneficial bacteria, like Bifidobacteria. The scores of depression, anxiety, and craving decreased significantly in the two groups of treatment. We did not observe any additional effect of inulin supplementation. It is well known that ethanol has a direct effect on the brain and on negative reinforcement processes.Citation56 Therefore, stopping alcohol has a beneficial effect on negative emotions, but we have previously shown that the recovery could also be affected by gut dysbiosis.Citation49 Although inulin increased the level of Bifidobacterium, it was not associated with further improvement in psychological symptoms. No study has investigated yet the effect of inulin on cognitive symptoms or mental health of AUD patients, but it has been studied in other contexts. Smith and colleagues highlighted that the acute administration of 5 g of oligofructose-enriched inulin improved wellbeing and episodic memory in healthy volunteers.Citation57 In obese patients, 3 months of inulin supplementation improved emotional competence and cognitive flexibility.Citation58 A recent study in patients suffering from coronary artery diseases has shown that the co-supplementation with 15 g of inulin and Lactobacillus rhamnosus GG during 2 months decreased significantly depression and anxiety scores as well as lipopolysaccharide and inflammatory markers.Citation59
Interestingly, the subjects had an increase in serum BDNF levels when supplemented with inulin compared to placebo. An impact of prebiotics on BDNF levels has already been demonstrated in several mouse studies.Citation60,Citation61 BDNF is an important neurotrophin involved in brain plasticity, the levels of which are decreased in anxiety and depressionCitation62 and preclinical studies have highlighted that the gut microbiota could directly modulate the brain expression of BDNF.Citation63,Citation64 Even though we did not measure BDNF levels in the brain, it has been shown that peripheral blood BDNF levels are positively correlated with BDNF in the brain.Citation65,Citation66
Despite the change in BDNF, we did not observe further positive effects of inulin as compared to placebo on psychological symptoms in our AUD population. This can be attributed to several factors. First, the duration of the supplementation, 17 days of supplementation may not be sufficient to observe a significant effect on behavior. Furthermore, in this study, two factors likely modulate the behavior of the patients: inulin supplementation and alcohol withdrawal. We have seen that abstinence alone has a strong impact on depressive symptoms, anxiety and craving, and therefore could mask an additional positive effect of prebiotics. It is also possible that the sample size was not large enough to observe a significant effect of inulin on psychological symptoms, as the study was designed to observe a bifidogenic effect. Other studies with a larger sample size are needed to confirm these results.
However, we observed an increase in the sociability subscore (social medium pleasant score) in the inulin group compared to placebo. A 6-week randomized, double-blind placebo-controlled study demonstrated that a combination of Bimuno® galactooligosaccharide with a casein/gluten-free diet, which increased B. longum, improved behavioral symptoms including sociability score in autistic children.Citation67 Interestingly, in our study the improvement of the sociability score was correlated with the increased Bifidobacterium level. The link between the gut microbiota and sociability has been demonstrated in preclinical studiesCitation15 and we have previously shown a link between leaky gut and social impairment in AUD patients.Citation16 It remains unclear how microbial changes may induce some of the behavioral effects, but it has been shown that Bifidobacterium longum NCC3001 restores anxiety-like behavior through the vagus nerve in mice.Citation63 However, our results should be interpreted with caution as only one out of the six sociability sub-scores was significantly modified by inulin supplementation.
One of the limitations of our study that may have hidden changes related to the prebiotic intervention, was the higher severity of the AUD DSM-5 scores observed at baseline in the treatment group as well as the higher proportion of females. Gender is known to influence the biological parameters but also the recovery from psychological symptoms during abstinence that are usually less rapid in female than male patients.Citation68 Furthermore, almost half of the patients relapsed during the intermediate week. This parameter may also modify the trajectory of symptom recovery as well as changes in the gut microbiota composition. It would have been interesting to stratify the population according to these two parameters that was impossible with our small sample size. However, fitting linear models on these two variables limited bias. Finally, the time point of the dietary data collection did not match perfectly with the fecal sample collection at T2. This makes it more difficult to interpret microbial changes in relation to nutritional intake.
In conclusion, our pilot work is the first showing that inulin supplementation is able to modulate the gut microbiota of AUD patients, although it had only a limited impact on biological outcomes or mental health. Inulin supplementation did not promote the expected effects on depression, anxiety and craving probably due to 1) the small sample size, 2) the short duration of supplementation, and 3) the fact that alcohol withdrawal already has a strong impact on psychological symptoms. However, we have shown that bacteria modulated with inulin supplementation could potentially be involved in sociability. Other studies involving longer treatment and larger sample size are needed to investigate whether inulin could be an appropriate nutritional approach to improve psychological symptoms and the biological outcomes of patients with alcohol use disorder.
Methods
Study design
This randomized, double-blind, placebo-controlled study was conducted from October 2018 to December 2019. Each subject was randomly assigned to daily intake of inulin (Inulin group) or maltodextrin (Placebo group) using the method of randomly permuted blocks (50 subjects randomized into 5 blocks). The randomization was performed via the website http://www.randomization.com by a person not involved in the study in order to ensure the double blind.
Compliance was assessed by counting the bags that were returned by subjects. Participants with a compliance of less than 80% were considered to be non-compliant.
Participant selection
A total of 50 AUD patients hospitalized for a 3-week highly standardized alcohol-detoxification program in St-Luc academic hospital, Brussels, Belgium, were enrolled on voluntary basis. This program consists in 2 weeks at the hospital (weeks 1 and 3), separated by 1-week outpatient care (week 2). The severity of AUD was checked by a psychiatrist using the criteria of the Diagnostic and Statistical Manual of Mental Disorders, Fifth Edition (DSM-5).
Inclusion criteria were as follows: male or female, 18–65 years old, French speaking, and active alcohol consumption until at least 48 hours prior to admission. Patients suffering from another addiction (except tobacco), with inflammatory bowel disease or other chronic inflammatory diseases (such as rheumatoid arthritis), cancer, metabolic diseases such as obesity (BMI ≥ 30 kg/m2), diabetes, bariatric surgery, and severe cognitive impairment (MMSE < 24) were excluded from the study. Patients with known cirrhosis or significant hepatic fibrosis (≥F2) detected by Fibroscan (>7.6 kPa) at admission were also excluded from the study. Other exclusion criteria were the following: the use of antibiotics, probiotics or prebiotics within 2 months prior to enrollment and the use of non-steroidal anti-inflammatory drugs or glucocorticoids within one month prior to enrollment.
The trial protocol was published on protocols.io (dx.doi.org/10.17504/protocols.io.bvs2n6ge). The study was approved by the institutional ethics committee (N°2017/04JUL/354). All participants signed informed consent prior to inclusion and the trial was registered in the clinicaltrials.gov registry (ClinicalTrials.gov identifier: NCT03803709).
The primary outcome of this trial was the effect of the prebiotic intervention on the gut microbiota composition. The secondary outcomes were the effect of inulin supplementation on gastrointestinal tolerance, nutritional intake, biological markers of satiety, lipid and glucose homeostasis and psychological parameters.
Dietary intervention
Inulin (Fibruline®) and maltodextrin (placebo) were kindly provided in similar opaque packaging by Cosucra (Warcoing, Belgium) to ensure the double-blind procedure. The patients were asked to dilute the powder in a hot drink (tea, coffee) or yogurt. According to previous studies on the effect of inulin and knowing that is a digestible nonfermentable carbohydrate, maltodextrin has been selected as placebo.Citation23,Citation45 Inulin and maltodextrin had the same taste, odor and texture.
In order to reduce the gastrointestinal side effects, the dose of inulin or maltodextrin increased gradually from 4 to 16 g per day during the treatment (4 g from Day 3 to Day 4; 8 g from Day 5 to Day 14 and 16 g from Day 15 to Day 19 of the detoxification program). Indeed we have previously shown that 16 g of inulin per day was well tolerated and had a bifidogenic effect in obese patients.Citation23,Citation45
Outcomes
Gut microbiota composition
Stool samples were collected at Day 2 (T1) and at the end of the intervention (Day 19 – T2). They were collected in a sterile container and stored immediately at −20°C and then transferred to −80°C within 5 to 10 hours. Genomic DNA was extracted from the feces using a QIAamp DNA Stool Mini Kit (Qiagen, Germany), including a bead‐beating step and following the protocol Q.Citation69 After extraction, dsDNA concentration was measured using the NanoPhotometer® Spectrophotometer (Implen, CA, USA). The composition of the gut microbiota was analyzed by Illumina sequencing of the 16S rRNA gene. The V3-V4 region of the 16S rRNA gene was PCR-enriched using the primer pairs V3F_Nextera (CCTACGGGAGGCAGCAG) and Meta_V4_806 R (GGACTACHVGGGTWTCTAAT). The amplicons were purified, quantified and sequenced using an Illumina Miseq to produce 2x300-bp sequencing products at the University of Minnesota Genomics Center. During the sequencing run, a quality score is assigned to each base call, using the Illumina’s quality scoring methodology. The mean quality score for each sample was > 33.8. Then, the sequence reads are converted automatically to FASTQ using a bcl2fastq converter. 16S rDNA amplicon sequences were analyzed using FROGS pipeline.Citation70 Amplicons were filtered according to their size then clustered into OTUs using Swarm (aggregation parameter d = 1 + d = 3). Chimera were removed using VSEARCH combined with an innovative chimera cross-validation and OTUs were kept when representing more than 0.005% of the total number of sequences.Citation71 OTUs were classified using the reference database Silva138 16S with a pintail quality of 100.Citation72 Relative abundance of each OTU was calculated after data normalization using a threshold of 33133 reads per sample.
qPCR of 16S rDNA was used to quantify the abundance of total bacteria (F: ACT-CCT-ACG-GGA-GGC-AGC-AG, R: ATT-ACC-GCG-GCT-GCT-GG) and Bifidobacterium spp (F: GAT-TCT-GGC-TCA-GGA-TGA-ACG-C, R:CTG-ATA-GGA-CGC-GAC-CCC-AT). PCR amplification was carried out as follows: 10 min at 95°C, followed by 45 cycles of 3 s at 95°C, 26 s at 58°C or 60°C, and 10 s at 72°C. Detection was achieved with the QuantStudio3 instrument and software (Applied Biosystems) using the GoTaq qPCR MasterMix Plus for SYBR Assay (Promega). BSA was added to samples. Each assay was performed in duplicate in the same run. For construction of standard curves, fivefold dilution series from target species genomic DNA preparations (DSMZ, Braunshweig, Germany) were applied to the PCR.
Gastrointestinal tolerance
Gastrointestinal symptoms were measured using a French version of a self-reported questionnaire initially used to evaluate the symptoms of irritable bowel syndrome developed by gastroenterologists at the St-Luc hospital as described before.Citation18,Citation73 Patients completed this questionnaire at baseline and then every other day after the beginning of supplementation.
Dietary intake
On Day 2 of alcohol withdrawal, all participants were interviewed using three nonconsecutive 24-h dietary recall (related to the week before hospitalization: week 0) by a trained dietician as previously described.Citation18 During the second week of the program (week 2: at home) patients were asked to complete a food diary in which they registered all the food and drinks consumed during 3 defined days (two weekdays and one weekend day). The participants were instructed to specify all ingredients per eating moment: breakfast, morning snack, lunch, afternoon snack, dinner, and evening snack. Detailed guidance notes, including ingredients most often omitted (e.g. fats, added sugars, beverages) and their unit of measurement (weight and household units), were provided in the diary. To avoid bias, participants did not receive any advice from the dietician regarding their eating habits. Advice was provided “on demand” at the end of study. At the beginning of week 3, careful analysis of the food diary was performed by the dietician during a face-to-face interview with the patient. Energy and nutrient intakes were evaluated using the Nubel Pro program (Nubel asbl, Belgium) and the French food composition database (CIQUAL 2017). Dietary fibers including soluble fibers, insoluble fibers, fructans, fructo-oligosaccharides (FOS) and galacto-oligosaccharides (GOS) were evaluated using a specific database from the FiberTAG project.Citation74 The results were expressed in quantities and in proportion of total energy intake (EI). The lipid intakes were also expressed in proportion of total fatty acids (FA).
Blood parameters
Fasting blood samples were collected at T1 and T2. Blood samples were centrifuged at 1000 g for 15 min at 4°C and the plasma was frozen at −80°C in a biobank. Plasma concentrations of gut hormones (GLP-1, leptin, ghrelin and PYY) and growth factors (Brain derived neurotrophic factor [BDNF]) were determined using the Meso Scale Discovery (MSD) U-PLEX assay (Rockville, MD, USA). Plasma triglycerides, total cholesterol, and glucose were dosed by enzymatic colorimetric test (Diasys Diagnostic and System, Holzheim, Germany). Plasma non-esterified fatty acid levels were assessed using a commercially available enzymatic assay (Randox Laboratories, Crumlin, UK).
Psychological symptoms assessment
At baseline (T1: day 1–2) and at the end of the supplementation (T2: day 19) all patients were tested for anxiety, depression and alcohol craving with self-reported questionnaires (French versions): the State-Trait Anxiety Inventory [STAI form YA], the Beck Depression Inventory [BDI] and the Obsessive-Compulsive Drinking Scale modified version [OCDS] as described previously.Citation75 The OCDS can be divided into two subscales, an ‘obsessive’ subscale and a ‘compulsive’ subscale. We used a modified version adapted to withdrawal that excluded items related to drinking. Fatigue was assessed using the Multidimensional Fatigue Inventory-20Citation76 and sociability using the social situation test.Citation77 All these questionnaires have been described previously.Citation18
Statistical analysis
Statistical analyses were performed using SAS version 9.4, R studio version 3.5.1 and Graphpad Prism 8.0.
Data were presented as mean ± standard error of the mean (SEM) or mean ± standard error deviation (SD). Normality was assessed by the Shapiro–Wilk test. According to data distribution, Mann–Whitney U-test or t-test were performed to compare the baseline characteristics of placebo and inulin groups.
We calculated the total dietary fiber intake for each patient and we added the 8 g of inulin in the inulin group at week 2. The evolution between T1 and week 2 in each group was assessed using a paired t-test or a Wilcoxon signed-rank test. Then we calculated the proportion of patients who achieved a fiber intake of at least 25 g per day using a Fisher test.
The effect of inulin supplementation on gastrointestinal symptoms was studied using a linear mixed model with time and treatment as fixed effects and patient as random effect. A second model adjusting for gender was performed. The gastrointestinal scores at day 1 and day 18 were then compared in each group in order to study the evolution of the symptoms between baseline and the end of the supplementation. To do so, we used paired t-test or Wilcoxon signed-rank test. Finally, the changes from baseline (D18-D1) were compared between groups using the Mann–Whitney U test or t-test.
For gut microbiota analysis, phyla, families and genus with an average relative abundance superior to 0.1% were analyzed. We used a Mann–Whitney U test in R to compare the relative abundance between the placebo and inulin group and the within group analyses were evaluated using a Wilcoxon paired test. The p‐values were adjusted to control for the false discovery rate for multiple testing according to the Benjamini and Hochberg procedure. q < 0.10 was considered statistically significant.
For each psychological and biological outcome, a change variable was calculated as the difference between end-of-study (T2) and baseline measurements (T1). For nutritional data the changes variables were calculated as the difference between week 2 and week 0. As there was an imbalance between genders (24% of women in placebo group vs 50% in the inulin group) and knowing that gender can influence the evolution of psychological symptoms,Citation68 we adjusted the linear regression models for gender and/or alcohol consumption to avoid potential bias. In order to study the effect of the withdrawal period alone, within group analyses were evaluated using a Wilcoxon signed-rank test. P values <.05 were considered statistically significant.
Sample size was estimated using G*Power based on the bifidogenic effect of inulin.Citation23,Citation78 Therefore, we estimated that a total sample size of 50 participants, with a 20% drop out during the study and 20 patients in each group completing the study provides 80% power to observe an effect size of 0.34 for the relative abundance of Bifidobacterium genus using a 0.05 two-sided significance level.
Authors’ contributions
Conceptualization & design: SL, NMD, PdT, PS, AMN.
Data curation: CA, SL, NMD, AMN, PdT, PS.
Formal analysis: CA, VT, SL, VC, QL, NMD, AMN.
Funding acquisition: NMD, PdT, PS.
Investigation: CA, SL, PS.
Methodology: SL, NMD, PdT, PS, AMN, HP, LBB.
Project administration: SL, AMN, NMD, PdT, PS.
Resources: NMD, PdT, PS.
Software: CA, VT, VC.
Supervision: NMD, PdT, SL, PS.
Validation: SL, NMD, AMN, PdT, PS, LBB.
Writing original draft: CA, SL
Writing review & editing: CA, SL, NMD, PdT, PS, AMN,QL, LBB, HP.
All authors read and approved the final manuscript.
Supplemental Material
Download Zip (169.3 KB)Acknowledgments
We are grateful to the study participants for their participation in the study. We thank Alejandra Ruiz Moreno, as well as the nurses of the Unité Intégrée d’Hépatologie of Saint-luc Hospital for their technical help. We also thank Isabelle Blave, Bouazza Es Saadi, Coralie Frenay and Madeline Vanden Brande for their excellent technical and experimental assistance in this study. We are grateful to the INRAE MIGALE bioinformatics facility (MIGALE, INRAE, 2020. Migale bioinformatics Facility, doi: 10.15454/1.5572390655343293E12) for providing help and computing and storage resources. We thank Cosucra for kindly providing the inulin. Finally, we thank Ana Beloqui for her help with the gut hormone/peptide assays.
Disclosure statement
No potential conflict of interest was reported by the author(s).
Data availability statement
The datasets used and/or analysed during the current study are available from the corresponding author on reasonable request. The accession number for the raw data generated with the 16S rRNA gene sequencing reported in this paper is BioProject PRJNA745947 (SRA) and are available here https://www.ncbi.nlm.nih.gov/bioproject/PRJNA745947/.
Supplementary material
Supplemental data for this article can be accessed on the publisher’s website.
Additional information
Funding
References
- Baj J, Flieger W, Teresiński G, Buszewicz G, Sitarz E, Forma A, Karakuła K, Maciejewski R. Magnesium, calcium, potassium, sodium, phosphorus, selenium, zinc, and chromium levels in alcohol use disorder: a review. J Clin Med. 2020;9(6):1901. doi:10.3390/jcm9061901.
- Carvalho AF, Heilig M, Perez A, Probst C, Rehm J. Alcohol use disorders. Lancet. 2019;394:781–20. doi:10.1016/S0140-6736(19)31775-1.
- Addolorato G, Leggio L, Abenavoli L, Gasbarrini G, Alcoholism Treatment Study Group. Neurobiochemical and clinical aspects of craving in alcohol addiction: a review. Addict Behav. 2005;30:1209–1224. doi:10.1016/j.addbeh.2004.12.011.
- Yeomans MR, Caton S, Hetherington MM. Alcohol and food intake. Curr Opin Clin Nutr Metab Care. 2003;6:639–644. doi:10.1097/00075197-200311000-00006.
- Bach P, Koopmann A, and Kiefer F . The impact of appetite-regulating neuropeptide leptin on alcohol use, alcohol craving and addictive behavior: a systematic review of preclinical and clinical data. Alcohol Alcohol. 2021;56(2):149–165.
- Temko JE, Bouhlal S, Farokhnia M, Lee MR, Cryan JF, Leggio L. The microbiota, the gut and the brain in eating and alcohol use disorders: a ‘Ménage à Trois’? Alcohol Alcohol. 2017;52:403–413. doi:10.1093/alcalc/agx024.
- Leclercq S, De Saeger C, Delzenne N, de Timary P, Stärkel P. Role of inflammatory pathways, blood mononuclear cells, and gut-derived bacterial products in alcohol dependence. Biol Psychiatry. 2014;76:725–733. doi:10.1016/j.biopsych.2014.02.003.
- Bajaj JS. Alcohol, liver disease and the gut microbiota. Nat Rev Gastroenterol Hepatol. 2019;16:235–246. doi:10.1038/s41575-018-0099-1.
- Maccioni L, Gao B, Leclercq S, Pirlot B, Horsmans Y, De Timary P, Leclercq I, Fouts D, Schnabl B, Stärkel P. Intestinal permeability, microbial translocation, changes in duodenal and fecal microbiota, and their associations with alcoholic liver disease progression in humans. Gut Microbes. 2020;12:1782157. doi:10.1080/19490976.2020.1782157.
- Chen Y, Yang F, Lu H, Wang B, Chen Y, Lei D, Wang Y, Zhu B, Li L. Characterization of fecal microbial communities in patients with liver cirrhosis. Hepatology. 2011;54(2):562–572. doi:10.1002/hep.24423.
- Bjørkhaug ST, Aanes H, Neupane SP, Bramness JG, Malvik S, Henriksen C, Skar V, Medhus AW, Valeur J. Characterization of gut microbiota composition and functions in patients with chronic alcohol overconsumption. Gut Microbes. 2019;10(6):663–675. doi:10.1080/19490976.2019.1580097.
- Valles-Colomer M, Falony G, Darzi Y, Tigchelaar EF, Wang J, Tito RY, Schiweck C, Kurilshikov A, Joossens M, and Wijmenga C, et al. The neuroactive potential of the human gut microbiota in quality of life and depression. Nat Microbiol. 2019;4:623–632 .
- Sharon G, Cruz NJ, Kang D-W, Gandal MJ, Wang B, Kim Y-M, Zink EM, Casey CP, Taylor BC, Lane CJ, et al. Human gut microbiota from autism spectrum disorder promote behavioral symptoms in mice. Cell. 2019;177(6):1600–1618.e17. doi:10.1016/j.cell.2019.05.004.
- Cryan JF, O’Riordan KJ, Sandhu K, Peterson V, Dinan TG. The gut microbiome in neurological disorders. Lancet Neurol. 2020;19(2):179–194. doi:10.1016/S1474-4422(19)30356-4.
- Sherwin E, Bordenstein SR, Quinn JL, Dinan TG, Cryan JF. Microbiota and the social brain. Science. 2019;366(6465):eaar2016. doi:10.1126/science.aar2016.
- Leclercq S, Le Roy T, Furgiuele S, Coste V, Bindels LB, Leyrolle Q, Neyrinck AM, Quoilin C, Amadieu C, Petit G, et al. Gut microbiota-induced changes in β-hydroxybutyrate metabolism are linked to altered sociability and depression in alcohol use disorder. Cell Rep. 2020;33:108238. doi:10.1016/j.celrep.2020.108238.
- Rothschild D, Weissbrod O, Barkan E, Kurilshikov A, Korem T, Zeevi D, Costea PI, Godneva A, Kalka IN, Bar N, et al. Environment dominates over host genetics in shaping human gut microbiota. Nature. 2018;555:210–215. doi:10.1038/nature25973.
- Amadieu C, Leclercq S, Coste V, Thijssen V, Neyrinck AM, Bindels LB, Cani PD, Piessevaux H, Stärkel P, de Timary P, et al. Dietary fiber deficiency as a component of malnutrition associated with psychological alterations in alcohol use disorder. Clin Nutr. 2021;40:2673–2682. doi:10.1016/j.clnu.2021.03.029.
- Stephen AM, Champ MM-J, Cloran SJ, Fleith M, van Lieshout L, Mejborn H, Burley VJ. Dietary fibre in Europe: current state of knowledge on definitions, sources, recommendations, intakes and relationships to health. Nutr Res Rev. 2017;30:149–190. doi:10.1017/S095442241700004X.
- Delzenne NM, Olivares M, Neyrinck AM, Beaumont M, Kjølbæk L, Larsen TM, Benítez-Páez A, Romaní-Pérez M, Garcia-Campayo V, Bosscher D, et al. Nutritional interest of dietary fiber and prebiotics in obesity: lessons from the MyNewGut consortium. Clin Nutr [Internet]. 2020[cited 2019 Aug 14];39:414–424. doi:10.1016/j.clnu.2019.03.002.
- Gibson GR, Hutkins R, Sanders ME, Prescott SL, Reimer RA, Salminen SJ, Scott K, Stanton C, Swanson KS, Cani PD, et al. Expert consensus document: the International Scientific Association for Probiotics and Prebiotics (ISAPP) consensus statement on the definition and scope of prebiotics. Nat Rev Gastroenterol Hepatol. 2017;14:491–502. doi:10.1038/nrgastro.2017.75.
- Roberfroid MB. Introducing inulin-type fructans. Br J Nutr. 2005;93:S13–25. doi:10.1079/BJN20041350.
- Dewulf EM, Cani PD, Claus SP, Fuentes S, Puylaert PGB, Neyrinck AM, Bindels LB, de Vos WM, Gibson GR, Thissen J-P, et al. Insight into the prebiotic concept: lessons from an exploratory, double blind intervention study with inulin-type fructans in obese women. Gut. 2013;62:1112–1121. doi:10.1136/gutjnl-2012-303304.
- Le Bastard Q, Chapelet G, Javaudin F, Lepelletier D, Batard E, Montassier E. The effects of inulin on gut microbial composition: a systematic review of evidence from human studies. Eur J Clin Microbiol Infect Dis. 2020;39:403–413. doi:10.1007/s10096-019-03721-w.
- Chambers ES, Byrne CS, Morrison DJ, Murphy KG, Preston T, Tedford C, Garcia-Perez I, Fountana S, Serrano-Contreras JI, Holmes E, et al. Dietary supplementation with inulin-propionate ester or inulin improves insulin sensitivity in adults with overweight and obesity with distinct effects on the gut microbiota, plasma metabolome and systemic inflammatory responses: a randomised cross-over trial. Gut. 2019;68:1430–1438. doi:10.1136/gutjnl-2019-318424.
- Guarner F. Studies with Inulin-type fructans on intestinal infections, permeability, and inflammation. J Nutr. 2007;137:2568S–2571S. doi:10.1093/jn/137.11.2568S.
- Bonnema AL, Kolberg LW, Thomas W, Slavin JL. Gastrointestinal tolerance of chicory inulin products. J Am Diet Assoc. 2010;110:865–868. doi:10.1016/j.jada.2010.03.025.
- Hiel S, Bindels LB, Pachikian BD, Kalala G, Broers V, Zamariola G, Chang BPI, Kambashi B, Rodriguez J, Cani PD, et al. Effects of a diet based on inulin-rich vegetables on gut health and nutritional behavior in healthy humans. Am J Clin Nutr. 2019;109:1683–1695. doi:10.1093/ajcn/nqz001.
- Cain KC, Jarrett ME, Burr RL, Rosen S, Hertig VL, Heitkemper MM. Gender differences in gastrointestinal, psychological, and somatic symptoms in irritable bowel syndrome. Dig Dis Sci. 2009;54:1542–1549. doi:10.1007/s10620-008-0516-3.
- Wang L, Yang H, Huang H, Zhang C, Zuo H-X, Xu P, Niu Y-M, Wu -S-S. Inulin-type fructans supplementation improves glycemic control for the prediabetes and type 2 diabetes populations: results from a GRADE-assessed systematic review and dose–response meta-analysis of 33 randomized controlled trials. J Transl Med. 2019;17:410. doi:10.1186/s12967-019-02159-0.
- Ojo O, Ojo OO, Zand N, Wang X. The effect of dietary fibre on gut microbiota, lipid profile, and inflammatory markers in patients with type 2 diabetes: a systematic review and meta-analysis of randomised controlled trials. Nutrients. 2021;13:1805. doi:10.3390/nu13061805.
- Delzenne NM, Cani PD, Daubioul C, Neyrinck AM. Impact of inulin and oligofructose on gastrointestinal peptides. Br J Nutr. 2005;93:S157–61. doi:10.1079/BJN20041342.
- Morris LS, Voon V, Leggio L. Stress, motivation, and the gut-brain axis: a focus on the ghrelin system and alcohol use disorder. Alcohol Clin Exp Res. 2018;42:1378–1389. doi:10.1111/acer.13781.
- Farokhnia M, Faulkner ML, Piacentino D, Lee MR, Leggio L. Ghrelin: from a gut hormone to a potential therapeutic target for alcohol use disorder. Physiol Behav. 2019;204:49–57. doi:10.1016/j.physbeh.2019.02.008.
- de Timary P, Cani PD, Duchemin J, Neyrinck AM, Gihousse D, Laterre P-F, Badaoui A, Leclercq S, Delzenne NM, Stärkel P. The loss of metabolic control on alcohol drinking in heavy drinking alcohol-dependent subjects. PLoS One [Internet]. 2012 [cited 2020 Jun 25];7. Available from: https://www.ncbi.nlm.nih.gov/pmc/articles/PMC3392266/.
- Autry AE, Monteggia LM. Brain-derived neurotrophic factor and neuropsychiatric disorders. Pharmacol Rev. 2012;64:238–258. doi:10.1124/pr.111.005108.
- Micka A, Siepelmeyer A, Holz A, Theis S, Schön C. Effect of consumption of chicory inulin on bowel function in healthy subjects with constipation: a randomized, double-blind, placebo-controlled trial. Int J Food Sci Nutr. 2017;68:82–89. doi:10.1080/09637486.2016.1212819.
- Blake MR, Raker JM, Whelan K. Validity and reliability of the bristol stool form scale in healthy adults and patients with diarrhoea-predominant irritable bowel syndrome. Aliment Pharmacol Ther. 2016;44:693–703. doi:10.1111/apt.13746.
- Menni C, Jackson MA, Pallister T, Steves CJ, Spector TD, Valdes AM. Gut microbiome diversity and high-fibre intake are related to lower long-term weight gain. Int J Obes (Lond). 2017;41:1099–1105. doi:10.1038/ijo.2017.66.
- Lin D, Peters BA, Friedlander C, Freiman HJ, Goedert JJ, Sinha R, Miller G, Bernstein MA, Hayes RB, Ahn J. Association of dietary fibre intake and gut microbiota in adults. Br J Nutr. 2018;120:1014–1022. doi:10.1017/S0007114518002465.
- So D, Whelan K, Rossi M, Morrison M, Holtmann G, Kelly JT, Shanahan ER, Staudacher HM, Campbell KL. Dietary fiber intervention on gut microbiota composition in healthy adults: a systematic review and meta-analysis. Am J Clin Nutr. 2018;107:965–983. doi:10.1093/ajcn/nqy041.
- Vandeputte D, Falony G, Vieira-Silva S, Wang J, Sailer M, Theis S, Verbeke K, Raes J. Prebiotic inulin-type fructans induce specific changes in the human gut microbiota. Gut. 2017;66:1968–1974. doi:10.1136/gutjnl-2016-313271.
- Reimer RA, Willis HJ, Tunnicliffe JM, Park H, Madsen KL, Soto-Vaca A. Inulin-type fructans and whey protein both modulate appetite but only fructans alter gut microbiota in adults with overweight/obesity: a randomized controlled trial. Mol Nutr Food Res. 2017;61:1700484. doi:10.1002/mnfr.201700484.
- Claesson MJ, Jeffery IB, Conde S, Power SE, O’Connor EM, Cusack S, Harris HMB, Coakley M, Lakshminarayanan B, O’Sullivan O, et al. Gut microbiota composition correlates with diet and health in the elderly. Nature. 2012;488:178–184. doi:10.1038/nature11319.
- Hiel S, Gianfrancesco MA, Rodriguez J, Portheault D, Leyrolle Q, Bindels LB, Gomes Da Silveira Cauduro C, Mulders MDGH, Zamariola G, and Azzi A-S, et al. Link between gut microbiota and health outcomes in inulin -treated obese patients: lessons from the Food4Gut multicenter randomized placebo-controlled trial. Clin Nutr . 2020;39:S0261561420301606.
- Healey G, Murphy R, Butts C, Brough L, Whelan K, Coad J. Habitual dietary fibre intake influences gut microbiota response to an inulin-type fructan prebiotic: a randomised, double-blind, placebo-controlled, cross-over, human intervention study. Br J Nutr. 2018;119:176–189. doi:10.1017/S0007114517003440.
- first 1000 cultured species of the human gastrointestinal microbiota. FEMS Microbiology Reviews. Oxford Academic [Internet]. [cited 2021 Jun 28]; Available from: https://academic.oup.com/femsre/article/38/5/996/498300?login=true
- de Timary P, Leclercq S, Stärkel P, Delzenne N. A dysbiotic subpopulation of alcohol-dependent subjects. Gut Microbes. 2015;6:388–391. doi:10.1080/19490976.2015.1107696.
- Leclercq S, Matamoros S, Cani PD, Neyrinck AM, Jamar F, Stärkel P, Windey K, Tremaroli V, Bäckhed F, Verbeke K, et al. Intestinal permeability, gut-bacterial dysbiosis, and behavioral markers of alcohol-dependence severity. Proc Natl Acad Sci USA. 2014;111:E4485–4493. doi:10.1073/pnas.1415174111.
- Ramirez-Farias C, Slezak K, Fuller Z, Duncan A, Holtrop G, Louis P. Effect of inulin on the human gut microbiota: stimulation of Bifidobacterium adolescentis and Faecalibacterium prausnitzii. Br J Nutr. 2009;101:541–550. doi:10.1017/S0007114508019880.
- Alcock J, Maley CC, Aktipis CA. Is eating behavior manipulated by the gastrointestinal microbiota? Evolutionary pressures and potential mechanisms. BioEssays. 2014;36:940–949. doi:10.1002/bies.201400071.
- Daud NM, Ismail NA, Thomas EL, Fitzpatrick JA, Bell JD, Swann JR, Costabile A, Childs CE, Pedersen C, Goldstone AP, et al. The impact of oligofructose on stimulation of gut hormones, appetite regulation and adiposity. Obesity (Silver Spring). 2014;22:1430–1438. doi:10.1002/oby.20754.
- Alarcon R, Tiberghien M, Trouillet R, Pelletier S, Luquiens A, Ahmed SH, Nalpas B, Alaux‐Cantin S, Naassila M, Perney P. Sugar intake and craving during alcohol withdrawal in alcohol use disorder inpatients. Addict Biol [Internet]. 2021 [cited 2020 Jun 26];26. Available from: https://onlinelibrary.wiley.com/doi/abs/10.1111/adb.12907.
- Stickel A, Rohdemann M, Landes T, Engel K, Banas R, Heinz A, Müller CA. Changes in nutrition-related behaviors in alcohol-dependent patients after outpatient detoxification: the role of chocolate. Subst Use Misuse. 2016;51:545–552. doi:10.3109/10826084.2015.1117107.
- Wiss DA, Avena N, Rada P. Sugar addiction: from evolution to revolution. Front Psychiatry. 2018;9:545. doi:10.3389/fpsyt.2018.00545.
- Koob GF. Negative reinforcement in drug addiction: the darkness within. Curr Opin Neurobiol. 2013;23:559–563. doi:10.1016/j.conb.2013.03.011.
- Smith AP, Sutherland D, Hewlett P. An investigation of the acute effects of oligofructose-enriched inulin on subjective wellbeing, mood and cognitive performance. Nutrients. 2015;7:8887–8896. doi:10.3390/nu7115441.
- Leyrolle Q, Cserjesi R, Mulders MDGH, Zamariola G, Hiel S, Gianfrancesco MA, Portheault D, Amadieu C, Bindels LB, Leclercq S, et al. Prebiotic effect on mood in obese patients is determined by the initial gut microbiota composition: a randomized, controlled trial. Brain Behav Immun. 2021;94:289–298. doi:10.1016/j.bbi.2021.01.014.
- Moludi J, Khedmatgozar H, Nachvak SM, Abdollahzad H, Moradinazar M, Sadeghpour Tabaei A. The effects of co-administration of probiotics and prebiotics on chronic inflammation, and depression symptoms in patients with coronary artery diseases: a randomized clinical trial. Nutr Neurosci. 2021;1–10. doi:10.1080/1028415X.2021.1889451.
- Burokas A, Arboleya S, Moloney RD, Peterson VL, Murphy K, Clarke G, Stanton C, Dinan TG, Cryan JF. Targeting the microbiota-gut-brain axis: prebiotics have anxiolytic and antidepressant-like effects and reverse the impact of chronic stress in mice. Biol Psychiatry. 2017;82:472–487. doi:10.1016/j.biopsych.2016.12.031.
- Matt SM, Allen JM, Lawson MA, Mailing LJ, Woods JA, Johnson RW. Butyrate and dietary soluble fiber improve neuroinflammation associated with aging in mice. Front Immunol. 2018;9:1832. doi:10.3389/fimmu.2018.01832.
- Deltheil T, Guiard BP, Cerdan J, David DJ, Tanaka KF, Repérant C, Guilloux J-P, Coudoré F, Hen R, Gardier AM. Behavioral and serotonergic consequences of decreasing or increasing hippocampus brain-derived neurotrophic factor protein levels in mice. Neuropharmacology. 2008;55:1006–1014. doi:10.1016/j.neuropharm.2008.08.001.
- Bercik P, Denou E, Collins J, Jackson W, Lu J, Jury J, Deng Y, Blennerhassett P, Macri J, McCoy KD, et al. The intestinal microbiota affect central levels of brain-derived neurotropic factor and behavior in mice. Gastroenterology. 2011;141:599–609.e3. doi:10.1053/j.gastro.2011.04.052.
- Schéle E, Grahnemo L, Anesten F, Hallén A, Bäckhed F, Jansson J-O. The gut microbiota reduces leptin sensitivity and the expression of the obesity-suppressing neuropeptides proglucagon (Gcg) and brain-derived neurotrophic factor (Bdnf) in the central nervous system. Endocrinology. 2013;154:3643–3651. doi:10.1210/en.2012-2151.
- Klein AB, Williamson R, Santini MA, Clemmensen C, Ettrup A, Rios M, Knudsen GM, Aznar S. Blood BDNF concentrations reflect brain-tissue BDNF levels across species. Int J Neuropsychopharm. 2011;14:347–353. doi:10.1017/S1461145710000738.
- Pan W, Banks WA, Fasold MB, Bluth J, Kastin AJ. Transport of brain-derived neurotrophic factor across the blood–brain barrier. Neuropharmacology. 1998;37:1553–1561. doi:10.1016/S0028-3908(98)00141-5.
- Grimaldi R, Gibson GR, Vulevic J, Giallourou N, Castro-Mejía JL, Hansen LH, Leigh Gibson E, Nielsen DS, Costabile A. A prebiotic intervention study in children with autism spectrum disorders (ASDs). Microbiome. 2018;6:133. doi:10.1186/s40168-018-0523-3.
- Petit G, Luminet O, Cordovil de Sousa Uva M, Monhonval P, Leclercq S, Spilliaert Q, Zammit F, Maurage P, de Timary P. Gender differences in affects and craving in alcohol-dependence: a study during alcohol detoxification. Alcohol Clin Exp Res. 2017;41:421–431. doi:10.1111/acer.13292.
- Costea PI, Zeller G, Sunagawa S, Pelletier E, Alberti A, Levenez F, Tramontano M, Driessen M, Hercog R, Jung F-E, et al. Towards standards for human fecal sample processing in metagenomic studies. Nat Biotechnol. 2017;35:1069–1076. doi:10.1038/nbt.3960.
- Escudié F, Auer L, Bernard M, Mariadassou M, Cauquil L, Vidal K, Maman S, Hernandez-Raquet G, Combes S, Pascal G. FROGS: find, rapidly, OTUs with galaxy solution. Bioinformatics. 2018;34:1287–1294. doi:10.1093/bioinformatics/btx791.
- Bokulich NA, Subramanian S, Faith JJ, Gevers D, Gordon JI, Knight R, Mills DA, Caporaso JG. Quality-filtering vastly improves diversity estimates from Illumina amplicon sequencing. Nat Methods. 2013;10:57–59. doi:10.1038/nmeth.2276.
- Quast C, Pruesse E, Yilmaz P, Gerken J, Schweer T, Yarza P, Peplies J, Glöckner FO. The SILVA ribosomal RNA gene database project: improved data processing and web-based tools. Nucleic Acids Res. 2012;41:D590–6. doi:10.1093/nar/gks1219.
- Francis CY, Morris J, Whorwell PJ. The irritable bowel severity scoring system: a simple method of monitoring irritable bowel syndrome and its progress. Aliment Pharmacol Ther. 1997;11:395–402. doi:10.1046/j.1365-2036.1997.142318000.x.
- Neyrinck AM, Nazare J-A, Rodriguez J, Jottard R, Dib S, Sothier M, Berghe LVD, Alligier M, Alexiou H, Maquet V, et al. Development of a repertoire and a food frequency questionnaire for estimating dietary fiber intake considering prebiotics: input from the FiberTAG project. Nutrients. 2020;12:2824. doi:10.3390/nu12092824.
- Leclercq S, Cani PD, Neyrinck AM, Stärkel P, Jamar F, Mikolajczak M, Delzenne NM, de Timary P. Role of intestinal permeability and inflammation in the biological and behavioral control of alcohol-dependent subjects. Brain Behav Immun. 2012;26:911–918. doi:10.1016/j.bbi.2012.04.001.
- Smets EM, Garssen B, Bonke B, De Haes JC. The Multidimensional Fatigue Inventory (MFI) psychometric qualities of an instrument to assess fatigue. J Psychosom Res. 1995;39:315–325. doi:10.1016/0022-3999(94)00125-O.
- Whelan DC, Zelenski JM. Experimental evidence that positive moods cause sociability. Soc Psychol Personal Sci. 2012;3:430–437. doi:10.1177/1948550611425194.
- Dehghan P, Gargari BP, Jafar-Abadi MA, Aliasgharzadeh A. Inulin controls inflammation and metabolic endotoxemia in women with type 2 diabetes mellitus: a randomized-controlled clinical trial. Int J Food Sci Nutr. 2014;65:117–123. doi:10.3109/09637486.2013.836738.