
ABSTRACT
Little is known about how interactions among grain processing, grain type, and carbohydrate utilization (CU) by the microbiome influence the health benefits of whole grains. Therefore, two whole grains – brown rice and whole wheat – and two processing methods – boiling (porridge) and extrusion – were studied for their effects on host metabolic outcomes in mice harboring human microbiomes previously shown in vitro to have high or low CU. Mice carrying either microbiome experienced increases in body weight and glycemia when consuming Western diets supplemented with extruded grains versus porridge. However, mice with the high but not low CU microbiome also gained more weight and fat over time and were less glucose tolerant when consuming extruded grain diets. In high CU microbiome mice, the exacerbated negative health outcomes associated with extrusion were related to altered abundances of Lachnospiraceae and Ruminococcaceae as well as elevated sugar degradation and colonic acetate production. The amplicon sequence variants (ASVs) associated with extruded and porridge diets in this in vivo study were not the same as those identified in our prior in vitro study; however, the predicted functions were highly correlated. In conclusion, mice harboring both high and low CU microbiomes responded to the whole grain diets similarly, except the high CU microbiome mice exhibited exacerbated effects due to excessive acetate production, indicating that CU by the microbiome is linked to host metabolic health outcomes. Our work demonstrates that a greater understanding of food processing effects on the microbiome is necessary for developing foods that promote rather than diminish host health.
Abbreviations: CU- carbohydrate utilization; SCFA- short-chain fatty acids; GF- germ-free; HMA, human-microbiome associated; ipGTT- intraperitoneal glucose tolerance test; HOMA-IR- Homeostatic Model Assessment for Insulin Resistance; AUC- area under the glycemia curve; ASV- amplicon sequence variant; lf- low-fat; wd- Western diet; wd_wwp- Western diet containing whole wheat porridge; wd_wwe- Western diet containing whole wheat extrudate; wd_bre- Western diet containing brown rice extrudate; wd_extr- Western diet containing either whole wheat or brown rice extrudate.
Introduction
Whole grain intake is associated with a reduced risk of type 2 diabetes, cardiovascular disease, cancer, and obesity.Citation1 Moreover, whole grains and dietary fibers also influence the composition and function of the gut microbiota.Citation2,Citation3 Although the effects on specific microbial taxa are varied, whole grains generally increase microbial diversity, particularly in subjects who habitually consume diets low in fiber or whole grains.Citation3 Unfortunately, most Westerners do not consume adequate levels of dietary fiber and whole grains despite decades of recommendations and public health initiatives promoting such behavior.Citation4 In the United States, 94% of adults fail to consume adequate levels of dietary fiber.Citation5 Adult intake of whole grains also falls far below published recommendations (3 ounce equivalents/2000 kcal recommended versus <1 ounce equivalents/2000 kcal actual consumption) despite consumption of sufficient amounts of grain products (6 ounce equivalents/2000 kcal).Citation6 Consequently, efforts to maximize the benefits of dietary fiber are critical because most Americans do not get enough of this vital nutrient.
Processing holds promise as a way to overcome fiber consumption challenges by manipulating the interactions between dietary carbohydrates and the microbiota to improve human health.Citation7 For example, cooking high starch foods has been shown to improve gut bacterial physiology by controlling starch availability.Citation8 However, among high starch foods processed by different cooking methods, the outcomes of processing can be unpredictable. In a previous in vitro study using human gut microbiota, we expected that extrusion, a severe processing operation that uses pressure, mechanical shear, and higher temperatures (>120°C) to process grains into foods such as breakfast cereals and crispy snacks, would increase carbohydrate utilization (CU) by the microbiome and lead to positive changes in microbiota composition and functionality compared with less severe processing methods such as boiling.Citation9 Although extrusion increased non-digestible CU, it also changed fermentation dynamics such that fast-growing bacteria, including Acinetobacter, Enterococcus, and Staphylococcaceae, outcompeted beneficial butyrate-producing Ruminococcaceae and Lachnospiraceae. In contrast, less severe processing methods (i.e., boiling and sourdough breadmaking) lowered total carbohydrate utilization compared to extrusion but increased butyrate production and the abundance of butyrate-producing Ruminococcaceae and Lachnospiraceae. Notably, only microbiomes capable of metabolizing a high proportion of the non-digestible carbohydrates (i.e., high CU) changed their fermentation patterns in response to processing method. Microbiomes with low CU showed no significant differences among extrusion, boiling, sourdough breadmaking or any other processing operation. These key findings provide an important potential explanation for why some individuals “respond” to dietary interventions aimed at improving human health through their interactions with the gut microbiome while others do not.Citation10,Citation11
Although previous studies have demonstrated that processing, grain type, and the microbiome each individually influence the health benefits experienced by those who consume whole grains,Citation1,Citation12–14 we do not yet understand how these factors interact with one another to alter host health outcomes in a predictable fashion. Indeed, results from our prior work suggest that only individuals who harbor high CU microbiomes are able to experience the potential benefits or disadvantages of processed whole grain treatments. Therefore, the purpose of this study was to examine the combinatorial effects of whole grain type and processing method on host health using mice harboring either high or low CU microbiomes. Two whole grains, brown rice and whole wheat, and two processing methods, boiling and extrusion, were studied for their effects on the microbiome and host metabolic outcomes. We hypothesized that mice harboring a high CU microbiome would experience metabolic improvements when fed boiled whole grains compared to extruded whole grains. In contrast, no appreciable metabolic differences would be noted for mice harboring a low CU microbiome when fed either extruded or boiled whole grains. We further hypothesized that the metabolic effects experienced by the high CU microbiome mice would be exaggerated when consuming whole wheat diets compared to brown rice diets due to the higher concentration of non-digestible carbohydrates in wheat versus brown rice.Citation15
Materials and methods
Whole grain processing
Hard red wheat was obtained from Bay State Milling (Quincy, MA, USA). Wheat kernels were dried at 40°C for 16 h before milling according to Doblado-Maldonado et al.Citation16 All milled fractions obtained from the mill were mixed together to obtain whole wheat flour. Brown rice flour was obtained from Bay State Milling (Quincy, MA, USA).
To make the whole wheat porridge, water (530 g) was brought to a boil on a gas range. Once boiling, 1 g of salt and 100 g whole wheat flour were added and the mixture was cooked for 5 min under rapid manual stirring (~60 revolutions per min) at 85–95°C. This process was repeated for 30 batches. The boiled wheat porridge was then cooled to room temperature before being frozen at −80°C and then freeze dried. The freeze died product was then coarsely ground and then milled with a pin mill (Buhler, Uzwil, Switzerland) twice to obtain a fine powder. All batches of freeze dried, milled whole wheat porridge were mixed together for incorporation into the mouse feed.
For extrusion, samples were processed as described previously.Citation17 One kilogram of flour (whole wheat or brown rice) was mixed in a stand mixer (c-100, Hobart, Troy, OH) for 10 min with 1% salt (w/w) and water to adjust the moisture content to 20% (dry weight basis). The mixtures were equilibrated in closed containers at 4°C overnight. The moisture-adjusted whole grain flours were then extruded using a twin-screw extruder equipped with a single stage mixing zone and a 3 mm outlet die at 250 rpm, 3:1 compression ratio, and a 20:1 L/D ratio (CW Brabender Instruments, NJ, USA). The extruder was operated by a direct current drive unit (Intelli-Torque, Pastic Corder Lab-station, C.W. Brabender) with a 5.6 kW motor. The flour was fed into the extruder using a volumetric feeder (FW 40 Plus, C. W. Brabender) set at a constant flow rate of ~50 g/min. Barrel temperatures were set at 60°C (zone 1; inlet), 70°C (zone 2), 120°C (zone 3), and 120°C (zone 4; die assembly). Samples were collected from the extruder die once steady state had been reached. Extrudates were then dried in a convection oven overnight at 70°C to complete the extrusion processing. Although the product contained very low moisture at this stage (~3%), the dried extrudates were subject to freeze drying (3600, Freeze Dry Co., Pine River, MN) because the whole wheat porridge was freeze dried following processing. The freeze-dried material was coarsely ground and then milled with a pin mill (Buhler, Uzwil, Switzerland) twice to obtain a fine powder.
Composition of the whole wheat porridge and whole grain extrudates were measured on the processed flours. Moisture, protein, lipid, dietary fiber, and starch were measured using standard methods.Citation18–22 Degree of starch gelatinization was measured using an enzymatic method.Citation23 Sugars (glucose, fructose, and sucrose) were measured as previously described with some modifications.Citation24 Sample (150 mg) was dispersed in 1.5 mL of water and stirred for 1 h at room temperature. The slurry was then centrifuged at 4000 g for 10 min and the supernatant was filtered through a 0.45 μm syringe filter before injecting into an HPLC (1260, Agilent, Santa Clara, CA, USA) equipped with an HPX-87P carbohydrate analysis column (300 × 7.8 mm, Bio-Rad, Hercules, CA, USA) with an ionic form H+/CO3− deashing guard column. Results were compared to authentic glucose, fructose, and sucrose standards (0–1 mg/mL) to calculate the concentration in the processed grain samples.
Selection of high CU and low CU microbiomes
We previously identified groups of “high CU” and “low CU” microbiomes based on contrasting percentages of carbohydrates fermented during in vitro fermentation.Citation9 In that study, ten microbiomes were subjected to in vitro fermentation using whole wheat processed by five different methods and CU was quantified by high-performance anion exchange chromatography. These ten microbiomes separated into two groups based on CU (31.1 ± 1.1% versus 19.3 ± 1.2%, P < .001), where CU was defined as the percentage of carbohydrates fermented during 12 h of in vitro fermentation.
For this study, the microbiome that was closest to the mean CU for each group was selected for inoculation into mice in this study (donor 1 for the high CU microbiome and donor 2 for the low CU microbiome). The same fecal samples collected from the previous study were used in this study. Two stool samples were collected from each donor (<2 weeks apart) and blended (model 2774 blender; Sunbeam) separately with sterile phosphate-buffered saline, pH 7.0 (1:9 wt/vol) containing 10% glycerol as a cryoprotectant for 1 min. The slurry was then filtered through four layers of sterile cheesecloth and frozen at −80°C. The two fecal slurries from each donor were defrosted and pooled on the day the mice were inoculated and stored on ice until use. All procedures involving human subjects were approved by the Institutional Review Board of the University of Nebraska–Lincoln (20160816311EP).
Experimental diets
The diets used in the study were prepared and irradaited by Research Diets (New Brunswick, NJ USA) (Table S2). The control diet was a defined rodent diet meant to represent a human Western diet in terms of macronutrient caloric distribution (D12451). A low fat diet (D12450K) was included to confirm metabolic aberrations induced by the Western diet. The processed whole grain samples were incorporated into the mouse diets at 18.5% of the total diet. The casein, corn starch, maltodextrin, soybean oil, and cellulose were reduced in the grain-containing samples compared with the control Western diet to keep the macronutrient composition consistent for total protein, starch, fat, and dietary fiber among each diet. Because of the differences in dietary fiber concentration among processed whole grain samples, the fiber from the grain treatment in each diet varied from as little as 0.3% to 1.8% of the whole diet. The level of whole grains included in the treatment diets were approximated to match the recommendations in the USDA Dietary Guidelines for AmericansCitation6 These Guidelines recommend 3 servings (ounce equivalents) per day for a standard 2000 kcal diet. Assuming 1 serving of whole grain contributes about 120 kcal to the diet, then 3 servings of whole grain would comprise 370 kcal, or about 18.5%, of an overall diet.
Human microbiota-associated mice
The Institutional Animal Care and Use Committee at the University of Nebraska–Lincoln approved all procedures involving animals (Project ID: 1700). The study was conducted in two arms (one for each human microbiome) due to the number of mice on study. Germ-free (GF) C57BL/6 male mice were bred and reared in flexible film isolators and maintained under gnotobiotic conditions (including temperature 20°C, relative humidity 60%, 14 h light/10 h dark cycle) by the Nebraska Gnotobiotic Mouse Program at the University of Nebraska–Lincoln. Germ-free status of the breeding colony was checked routinely as previously described.Citation25 At seven weeks of age (±11 d), GF mice were transferred from isolators to autoclaved individually ventilated cages mounted on racks with positive airflow as previously described,Citation25 colonized immediately with either the high CU or low CU human stool microbiome, and housed two to three mice per cage. Cages were only opened in a biosafety cabinet. To establish human microbiome-associated (HMA) mice, 100 μL of each human fecal slurry was orally gavaged into mice once. After receiving a microbiome, mice were fed an autoclaved chow diet (LabDiet 5K67, Purina Foods, St. Louis, MO) for two weeks and allowed to acclimate prior to beginning the study. After two weeks, HMA mice were randomly assigned to one of the five dietary treatments (n = 10–11 mice/treatment) and then fed irradiated test diets for 12 weeks. No significant differences in body weight were observed among treatment groups on the day of randomization (data not shown). Diet replacement and recording of both food intake and body weights were performed weekly. Body composition was measured bi-weekly (Minispec LF50, Bruker, Billerica, MA).
Feces were collected from individual mice three times during the experiment (weeks 0, 1, and 11) and stored at −80°C until further analysis. After 12 weeks of feeding experimental diets, mice were euthanized via CO2 asphyxiation. Blood was harvested by cardiac puncture and plasma was collected by centrifugation at 13,000 × g for 3 min at 4°C. Cecal and colonic tissues and contents were weighed at the time of collection. All biological samples were snap frozen in liquid nitrogen and stored at −80°C until analysis.
Intraperitoneal glucose tolerance test
An intraperitoneal glucose tolerance test (ipGTT) was performed after 11 weeks of dietary intervention.Citation26 Mice were fasted in clean cages for 6 h prior to the test. Thirty minutes prior to the test, blood was collected from the tip of the tail to measure fasting glucose concentration using a glucose meter (ACCU-CHEK, Aviva Plus system, Indianapolis, IN, USA). An aliquot of blood was also saved for subsequent insulin analysis via ELISA (Mercodia Insulin ELISA Kit, Uppsala Sweden). At time zero, a glucose solution (20 g/100 mL) was injected into the peritoneal cavity (1 g glucose/kg body weight). Blood glucose levels were measured using a glucose meter (Roche Diagnostics, Indianapolis, IN) at 0, 30, 60, 90, 120, and 150 min after glucose injection. An index of insulin resistance [Homeostatic Model Assessment for Insulin Resistance (HOMA-IR)] was calculated using the formula: [fasting glucose (mg/dL) * fasting insulin (μU/mL)]/405.Citation27
Cecal and colon short-chain fatty acids
SCFA were extracted from the cecum and colon collected at necropsy. SCFA were measured by gas chromatography as describedCitation28 with 7 mM 2-ethylbutyric acid as the internal standard. SCFA were reported as the total quantity of SCFA in each tissue by multiplying the concentration by the weight of tissue contents.
Characterization of the fecal microbiota composition
The fecal samples were analyzed for differences in the microbiome using 16S rRNA gene sequencing. A kit from Biovet (BioSprint 96 One-For-All Vet Kit, Quebec Canada) was used for DNA extraction. Microbiome characterization was performed by amplicon sequencing of the V4 region of the 16S rRNA gene on the Illumina MiSeq platform using the MiSeq Reagent kit v2 (2 × 250 bp) following the protocol of Kozich et al.Citation29 Sequences were demultiplexed and barcodes were removed prior to sequence analysis with the QIIME 2 platform.Citation30 Sequencing reads are available at: PRJNA690589. Sequence quality control, trimming and denoising was performed with DADA2.Citation31 Forward and reverse reads were trimmed to maintain sequence qualities above a phred score of 30. Using DADA2, sequences were dereplicated into 100% amplicon sequence variants (ASVs) for exact sequence matching. Taxonomy was assigned using the SILVA database.Citation32 Reads were rarefied to a sampling depth of 7,662 prior to analysis. Prediction of metagenome function of ASVs was performed using pathway analysis in PiCRUSt2Citation33 using the stratified and per-sequence contribution option to determine the predicted pathway abundance contributed by each individual sequence. Pathways were then grouped into hierarchical classifications as found in https://metacyc.org/.
Statistical analysis
For analysis of host parameters, a one-way analysis of variance (ANOVA) was performed (version 9.4, SAS Institute, Bray, NC USA). Body weights while feeding test diets and blood glucose concentrations during the ipGTT were analyzed using a repeated measures ANOVA with dietary treatment and time and their interaction as the factors and mouse as the experimental unit on which repeated measures were taken. When the ANOVA F-value was significant (p < .05), Tukey’s honestly significant difference (HSD) was used to compute differences among treatments. Because the study was conducted in two arms (one for each human microbiome), statistics were run by microbiome.
Fecal microbiota analyses were conducted using R (version 4.0.2) with various packages as indicated, except for linear discriminate analysis effect size (LEfSe) analysis,Citation34 which was performed using the online Galaxy module (http://huttenhower.sph.harvard.edu/galaxy). Diversity of each fermented and fecal sample was determined using the phyloseq package.Citation35 For β-diversity, unweighted and weighted UniFrac distances were calculated and then visualized using principal coordinates analysis. Homogeneity of group variances was performed using the vegan package.Citation36 For α-diversity, observed ASVs and Shannon diversity were calculated and differences among treatments were analyzed using a non-parametric Kruskal–Wallis test followed by a Dunn test using the rstatix package.Citation37 For further analysis, low abundance ASVs that occurred at <0.1% in all samples were considered possible spurious sequences and were filtered out, resulting in 455 ASVs across both microbiomes, with 319 ASVs in the high CU microbiome mice and 212 ASVs in the low CU microbiomes (76 shared ASVs). To analyze shifts in individual ASVs over time, the DESeq2 package was usedCitation38 with time as the factor in the model (week 11 vs week 0); analyses were grouped by microbiome and dietary treatment.
To determine ASVs that were significantly associated with extruded diets versus the porridge diet after 11 weeks of feeding, linear discriminate analysis effect size (LEfSe) was used using data at 11 weeks. For correlation analysis between host parameters and abundance of different ASVs, Spearman correlations were calculated. Results from the DESeq2, correlation, and pathway contribution analyses were visualized using the ComplexHeatmap package.Citation39 Dietary treatments were clustered using the complete-linkage method based on Euclidean distance. ASVs were clustered using ggtree.Citation40 All other data were plotted using the ggplot2 package.Citation41 Multipanel figures were arranged using the cowplot package.Citation42
Results
In vitro fermentation of processed whole grains identified high and low carbohydrate utilizing microbiomes
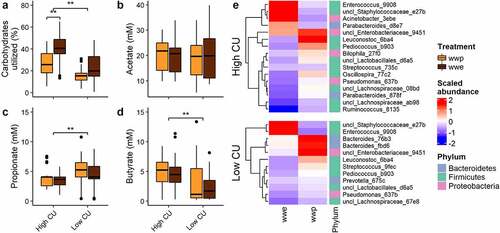
In a previous in vitro study examining the effects of whole-grain processing on gut microbiota composition and function,Citation9 extrusion, a severe processing method, negatively affected microbiome composition and function compared to other milder processing methods, but only in microbiomes demonstrating a high carbohydrate utilization (CU) pattern. Specifically, extrusion resulted in greater CU than boiling (porridge) for the high CU microbiomes (), but also increased ASVs from Acinetobacter, Enterococcus, and Staphylococcaceae at the expense of key cell wall degrading bacteria from the Ruminococcaceae and Lachnospiraceae families (). High CU microbiomes also produced significantly more butyrate than low CU microbiomes, which were more propiogenic ().
Figure 1. In vitro fermentation of processed whole grains identified high and low carbohydrate utilizing microbiomes from donors. (a) Carbohydrates utilized; (b-d) short-chain fatty acid production; (e) differentially abundant ASVs. ASVs were named by genus (or lowest taxonomic rank available) followed by the first four characters of the feature ID generated from QIIME 2; wwp, whole wheat porridge; wwe, whole wheat extrudate; **p < .01; data from.Citation9
Whole grain porridge and extrudates showed differences in composition
The composition of the whole wheat porridge and whole grain extrudates was as expected, with a very low concentration of dietary fiber in the brown rice extrudate (1.69%) compared with the whole wheat extrudate (8.75%; Table S1). The extrusion processing diminished the total fiber content compared with the porridge sample (8.75% versus 9.70%). There were marked differences in degree of starch gelatinization among the samples, with the extruded diets containing a much greater proportion of gelatinized starch (whole wheat extrudate: 95.7%; brown rice extrudate: 88.6%) compared with the whole wheat porridge (68.3%). The whole wheat porridge and the whole wheat extrudate represented the contrast between a minimally processed grain and a severely processed grain, respectively. The whole wheat extrudate and the brown rice extrudate represented the contrast between different grain types when processed using the same methodology.
Extruded diets worsened host metabolic health compared with non-extruded diets in mice harboring a high CU microbiome
Given the differential microbiome and SCFA responses to processed whole grains by the high CU microbiomes versus the low CU microbiomes in vitro, we examined whether these relationships persisted in vivo. Specifically, we hypothesized that mice fed a diet containing whole grain porridge would experience enhanced metabolic benefits compared to mice fed a diet containing extruded whole grain, but only in hosts harboring a high CU microbiome.
To test this hypothesis, we inoculated germ-free mice with high CU and low CU microbiomes.Citation9 The high CU microbiome had more observed ASVs, but its Shannon diversity was similar to the low CU microbiome (Fig. S1), indicating that although species richness was greater for the high CU microbiome, species distrubution was uneven. The high CU microbiome had a greater abundance of Verrucomicrobia, while the low CU was higher in Actinobacteria (Fig. S1). In addition, the high CU microbiome had greater levels of Prevotella and more Ruminococcaceae, especially Ruminococcus, compared to the low CU microbiome. The composition of the Lachnospiraceae family was also different between the two microbiomes, with more Roseburia, Coprococcus, and [Eubacterium] xylanophilium group present in the high CU microbiome and more Fusicatenibacter, Dorea, Blautia, Anaerostipes, and [Eubacterium] hallii group present in the low CU microbiome. These differences were similar to those previously reported for the whole high and low CU microbiome groups.Citation9
These two microbiomes were used to create HMA mice harboring either a high CU or low CU human stool microbiome. After a two-week acclimation period, HMA mice were fed one of five test diets containing processed whole grains for 12 weeks (). The diets included a control low-fat diet, a control Western diet, and three energy and macronutrient-matched Western diets supplemented with either boiled whole wheat (whole wheat porridge), extruded whole wheat, or extruded brown rice. The metabolic health of the mice was assessed by measuring changes in body weight, body composition, and glucose tolerance.
Figure 2. Extruded diets worsened host metabolic health compared with non-extruded diets in mice harboring a high CU microbiome. Study design (a); body weight (b), body fat (c), lean mass (d), body weight gain (e), change in body fat (f), change in lean mass (g), fasting blood glucose (h), fasting insulinemia (i), glycemia during intraperitoneal glucose tolerance test (j), area under the glycemia curve (k); index of insulin resistance (l), complete linkage clustering based on Euclidean distance of treatment means of data in panels B-L (m); lf, low fat control; wd, Western diet; wd_wwp, wd + whole wheat porridge; wd_wwe, wd + whole wheat extrudate; wd_bre, wd + brown rice extrudate; treatments marked with different letters within panel are significantly different from one another (Tukey’s HSD p < .05).
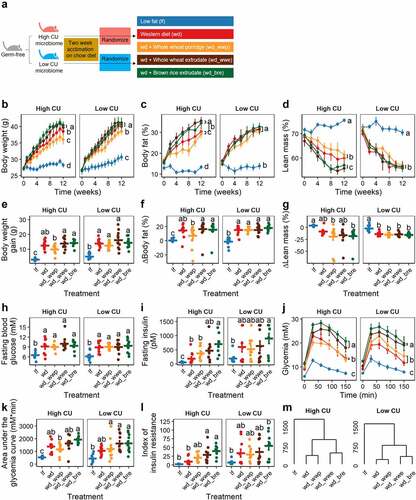
All mice receiving a Western diet gained significantly more body weight and fat, experienced elevated blood glucose and insulin levels, and were more insulin resistant following a glucose challenge compared to mice fed a low fat control diet, all of which are features associated with the development of metabolic syndrome (). No significant differences in feed intake were observed among mice harboring either microbiome for any of the test diets (high CU, 19.6 ± 1.5 g/week, p = .59; low CU, 22.6 ± 2.7 g/week, p = .18).
For mice inoclulated with the high CU microbiome, body weight gain and fat percentage were significantly higher when consuming a Western diet supplemented with either extruded grain compared to mice receving the whole wheat porridge diet. Weight gain and fat accretion for mice fed the control Western diet were between results obtained for mice receiving a Western diet supplemented with whole grain treatments (). Mice consuming the brown rice extrudate experienced higher fasting insulin levels and were more insulin resistant following a glucose challenge compared with mice consuming whole wheat porridge (). Insulin levels and glycemia profiles for mice consuming whole wheat extrudate were intermediate to profiles for mice receiving the other two whole grain diets. Glycemia was also lower for mice consuming the control Western diet or a Western diet supplemented with whole wheat porridge compared to mice consuming the extruded whole grain diets ().
In contrast to the findings for mice carrying a high CU microbiome, mice inoculated with the low CU microbiome experienced far fewer differences in metabolic features among whole grain dietary treatments. A significant decrease in body weight over time was seen in mice consuming the whole wheat porrige diet compared with the other whole grain diets (), but no differences were observed in body weight gain or body composition profiles (). Mice consuming the whole wheat porridge diet had lower glycemia during a glucose challenge compared with mice receiving the extruded diets (). However, no other differences in metabolic parameters were observed among mice carrying the low CU microbiome and consuming whole grains ().
Although a greater number of significant differences among dietary treatments for host metabolic parameters were observed for mice harboring the high CU microbiome, mice receiving either microbiome showed similar clustering of treatment means (). In general, mice consuming either extruded diet (whole wheat or brown rice) were less metabolically healthy than mice consuming the other diets. Altogether, these results demonstrate that the host metabolic response to extruded diets was worse than the porridge diet in mice regardless of microbiome, but the negative effects were greatly exacerbated in the mice harboring the high CU microbiome compared to the low CU microbiome.
Mice inoculated with the high CU microbiome showed greater variance in microbiota composition among treatments during feeding compared with the low CU microbiome mice
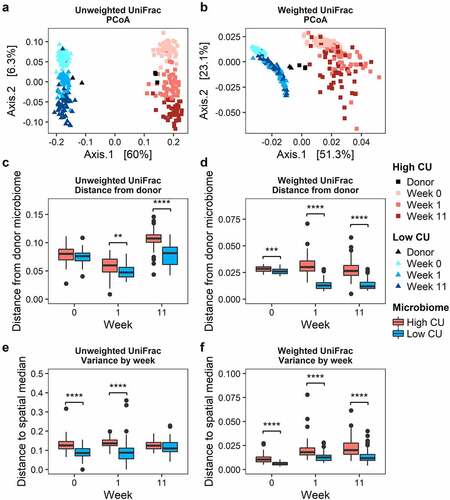
Because the high CU microbiome mice experienced a greater number of significant metabolic differences among dietary treatments compared to the low CU microbiome mice, we expected that the high CU microbiome mice would show greater variation in microbiome composition among treatments. Upon transfer into mice, both fecal microbiomes exhibited compositional shifts based on fecal collection week (). During the two-week acclimation period, the shift in microbiota composition from the donor inocula ranged from 0.027 to 0.11 based on unweighted UniFrac distance, which was substantially smaller than the difference between the high and low CU fecal inocula (0.27 ± 0.01) with no significant difference between high and low CU microbiome mice (). In contrast, the change in microbiota composition after inoculation and acclimation based on weighted UniFrac distance ranged from 0.021 to 0.033, which was larger than the difference between the high and low CU fecal inocula (0.0087 ± 0.0015) with a slight but significantly greater shift for the high CU microbiome mice compared with the low CU microbiome mice (). Together, these observations indicate that the minor alterations in microbiome composition during the acclimation period were mostly changes in abundance rather than loss/gain of taxa. After 11 weeks of feeding, the variance in β-diversity among treatments was significantly greater for the high CU microbiome mice compared with the low CU microbiome mice for weighted UniFrac distance but not for unweighted UniFrac distance (). These observations suggest that the high CU microbiome mice exhibited a more dramatic response to treatment conditions compared with the low CU microbiome mice and that differences among dietary treatments may have been more dependent on shifts in abundance of certain species rather than simply presence or absence.
Figure 3. Mice inoculated with the high CU microbiome showed greater variance in microbiota composition among treatments during feeding compared with the low CU microbiome mice. Principal coordinate analysis biplots of unweighted (A) and weighted (B) UniFrac distance matrices; distance from donor microbiome and group dispersions (variances) based on unweighted (C, E) and weighted (D, F) UniFrac distances, respectively; ****p<0.001 (t-test).
For α-diversity, very few differences in observed ASVs or Shannon diversity were observed among treatments for either microbiome with only the low CU microbiome mice showing any signifciant differences at all (Fig. S2). However, over 11 weeks of feeding, there was a general trend for increasing α-diversity during the study. This general trend was more pronounced for mice receiving the high CU microbiome and was more evident for observed ASVs than for Shannon diversity. These results suggest that the dietary treatments had more of an effect at the ASV level, even among the low abundance ASVs, rather than affecting the evenness of the community, especially in the high CU microbiome mice.
Changes in microbiome composition during feeding clustered by processing method in mice harboring the high CU microbiome
The β-diversity results suggested that shifts in microbal abundances – rather than the presence or absence of certain species – may explain the enhanced differences among dietary treatments in the high CU microbiome mice. Thus, we analyzed shifts in microbiome composition at the ASV level from week 0 to week 11 for each treatment and microbiome (). In both microbiomes, 30% of the ASVs showed significant changes during feeding in at least one dietary treatment condition. Since the high CU microbiome mice had more observed ASVs, this result translated into 82 ASVs with significant shifts over time in the high CU microbiome mice compared to 61 for the low CU microbiome mice. While the specific ASVs that changed in each microbiome were different, remarkably similar shifts were evident when the log2 fold changes during feeding were clustered by phylogeny. Notably, closely related ASVs exhibited similar shifts during feeding in either microbiome. For example, different ASVs from Blautia, Erysipelactoclostridium, Enterococcus, and Romboutsia tended to increase, while ASVs from Bacteroides tended to decrease.
Figure 4. Changes in microbiome composition during feeding clustered by processing method in mice harboring the high CU microbiome. ASVs with significant log2 fold changes (DESeq2 padj<0.05) during feeding of high (a) and low (b) CU microbiomes; ASVs are clustered by phylogeny; treatments are clustered by the complete-linkage method based on Euclidean distance; ASVs with the largest absolute value of the log2 fold change (top 20%) are labeled; lf, low fat control; wd, Western diet; wd_wwp, wd + whole wheat porridge; wd_wwe, wd + whole wheat extrudate; wd_bre, wd + brown rice extrudate.
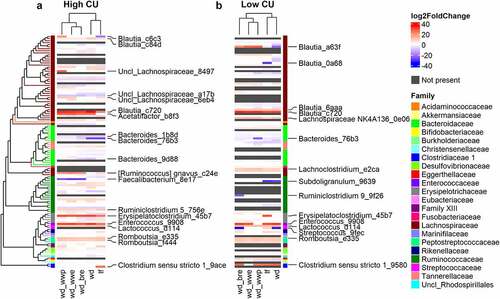
More revealing than the shifts in individual ASVs during feeding were the clustering patterns observed among the dietary treatments for each microbiome. In mice inoculated with the high CU microbiome, the extruded diet treatments clustered separately from the other diets (). This result is similar to the clustering based on host metabolic outcomes, where extruded diets also clustering separately from other dietary treatments (). In contrast, shifts in microbiome composition clustered by grain type rather than processing method for mice inoculated with the low CU microbiome (), which was different from the clustering of metabolic outcomes (). Together, these findings suggest that the exacerbated negative host metabolic outcomes in high CU microbiome mice fed the extruded diets were related to changes in microbiota composition.
Extruded diets resulted in differential ASVs with strong correlations to negative host outcomes in the high CU microbiome mice
Because high CU microbiome mice consuming the extruded diets clustered together for both host metabolic outcomes and shifts in microbiome composition during feeding, we considered that processing method (extruded versus not extruded) was more important for shaping metabolic health and microbiome composition than grain type (whole wheat versus brown rice). We therefore examined differentially abundant ASVs from mice consuming either extruded diet (whole wheat or brown rice) compared with the non-extruded whole grain diet (porridge). There were seven ASVs that were significantly associated with the extruded diets and six ASVs that were associated with the non-extruded (porridge) diet (). We also examined differentially abundant ASVs between extruded versus non-extruded diets for the low CU microbiome mice for comparison. In this background, six ASVs were increased on the extruded diets and four ASVs increased on the non-extruded diet (). Although these ASVs were diverse (from Actinobacteria, Bacteroidetes, Firmicutes, and Proteobacteria), most ASVs associated with extrusion were from the Lachnospiraceae or Ruminococcaceae families (6/7 and 5/6 for the high and low CU microbiome mice, respectively). One ASV was associated with extrusion in both microbiomes (Flavonifractor_5fbc), and two ASVs were significantly associated with the non-extruded diet in both microbiomes (Bilophila_27f0 and Turicibacter_df0e).
Figure 5. Extruded diets resulted in differential ASVs with strong correlations to negative host outcomes in the high CU microbiome mice. Differential ASVs associated with extruded (wd_extr) and non-extruded (wd_wwp) diets in high CU (a) and low CU (b) microbiomes; correlations between differential ASVs in high CU (c) and low CU (d) microbiomes and host metabolic variables; wd_extr, Western diet + whole wheat extrudate (wd_wwe) and brown rice extrudate (wd_bre); non-extruded diet included the Western diet + whole wheat porridge (wd_wwp); ASVs were named by genus (or lowest taxonomic rank available) followed by the first 4 characters of the feature ID generated from QIIME2; *p < .05, **p < .01, ***p < .001, ****p < .0001 (Spearman correlation with Benjamini-Hochberg p-value adjustment).
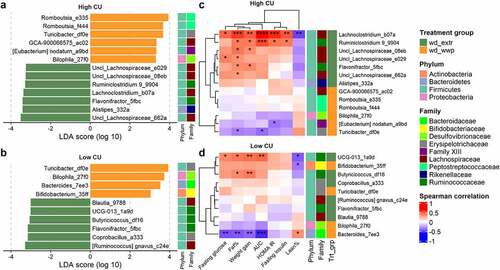
To examine the relationship between these ASVs and host health, we correlated the abundances of these taxa at week 11 with host metabolic phenotypes. For the high CU microbiome mice, correlations with host metabolic parameters clustered by dietary treatment (). Specifically, ASVs associated with feeding extruded diets were strongly and positively correlated with poor host health [i.e., 18 significant positive correlations to increased body weight/body fat or poor glucose metabolism ranging from ρ(0.33, 0.62); adjusted p(0.04, 3.4 × 10⁻⁵)], while ASVs associated with non-extruded diets were moderately negatively correlated with poor host health [i.e., three significant negative correlations ranging from ρ(−0.40, −0.35); adjusted p(0.02, 0.04)]. In contrast, correlations with host metabolic parameters in the low CU microbiome mice did not cluster by dietary treatment, and the correlations were generally weaker than for the high CU microbiome mice (). Collectively, these results corroberate our previous assertion that host metabolic health outcomes were related to changes in microbiota composition in the high CU microbiome mice but not in the low CU microbiome mice. Furthermore, these results indicate that the microbiota compositional changes contributing to the negative metabolic effects of high CU microbiome mice consuming an extruded diet were due to changes in only a small number of ASVs, primarily from the Lachnospiraceae and Ruminococcaceae families.
ASVs associated with extrusion were linked with elevated sugar degradation and SCFA production in the high CU microbiome mice
We next hypothesized that ASVs associated with consuming either extruded diet may be contributing increased functionality related to microbiome energy harvest from the diet and thus causing negative metabolic responses in the mice. We therefore examined the predicted functions contributed by ASVs associated with extrusion versus those associated with the whole wheat porridge diet. We focused our analysis on metabolic pathways related to degradation and energy harvest from undigested components of the dietary treatments.
In the high CU microbiome mice, metabolic pathways associated with sugar fermentation and SCFA were the most abundant, with significantly more sugar degradation and SCFA production contributed by ASVs associated with extruded diets compared with diets that were not extruded (). (Note that ‘Sugar Degradation’ was a separate category from ‘Polysaccharide Degradation,’ which was also higher for ASVs associated with the extruded diets but of lower abundance than ‘Sugar Degradation.’)
Figure 6. ASVs associated with extrusion were predicted to contribute to elevated sugar degradation and SCFA production in the high CU microbiome mice. Predicted (PICRUSt2) metabolic pathway classes with significant differences between extruded and non-extruded diets (a); SCFA pools in the cecum and colon measured at necropsy (b); wd_extr, extruded diets (wd_wwe and wd_bre); *p < .05, **p < .01, ***p < .001, ****p < .0001 (Wilcoxon-test with Benjamini-Hochberg p-value adjustment).
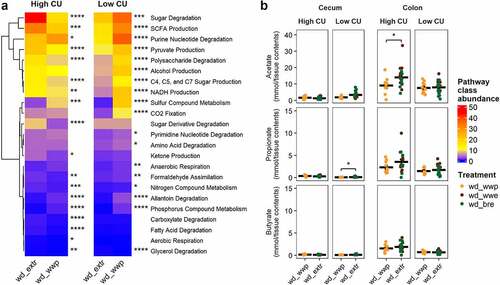
As with the high CU microbiome mice, sugar degradation and SCFA production were the most abundant metabolic pathways associated with differentially abundant ASVs in the low CU microbiome mice (). However, the magnitude of difference between the extruded and non-extruded diets was smaller than that for the high CU microbiome mice. Also, these pathways were elevated in the ASVs associated with the non-extruded whole wheat porridge diet rather than the extruded diets.
Because the differential ASVs associated with extrusion versus porridge were predicted to contribute primarily to sugar degradation and subsequent SCFA production, we examined the SCFA concentrations in the cecal and colonic contents of mice. A slight, but significant, increase in propionate production was found in the ceca of mice consuming the extruded diets compared with the whole wheat porridge diet in the low CU microbiome mice (). However, overall SCFA production in the cecum was very low for all treatments. Much greater SCFA production was found in the colon, where the high CU microbiome mice consuming the extruded diets had significantly higher colonic acetate production. These results suggest that the ASVs contributing to the negative effects of extrusion on host health were involved in increased energy harvest due to excessive acetate production.
ASVs associated with extrusion were different during an in vivo study compared with prior in vitro study but showed similar predicted functionality
Notably, the ASVs associated with the extruded and non-extruded diets in this in vivo study were not the same as those associated with the whole wheat extrudate and whole wheat porridge in the prior in vitro study. As mentioned, in vitro fermentations with the whole wheat extrudate resulted in increases in ASVs from Acinetobacter, Enterococcus, and Staphylococcaceae at the expense of key cell wall degrading bacteria from Ruminococcaceae and Lachnospiraceae in vitro (). In contrast, in the present study, the extruded diets were associated with ASVs from Lachnospiraceae and Ruminococcaceae, and the whole wheat porridge resulted in elevated ASVs from several other families, including those from phyla other than Firmicutes.
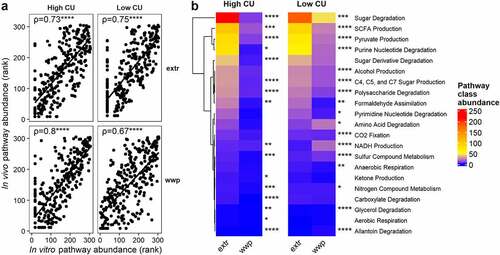
Despite this inconsistency, we speculated that ASVs enriched in vivo and in vitro, although different, may perform similar functions under each dietary treatment. We therefore examined the predicted function of ASVs previously associated with extrusion and porridge (non-extruded) from our in vitro study in the same manner as was done for this in vivo study. The predicted functions of the differential ASVs between the present in vivo and the previous in vitro study were indeed highly correlated (), indicating that these ASVs may be performing similar functions under different experimental conditions. Also similar to the present study, sugar degradation and SCFA production functions were significantly elevated by ASVs associated with extrusion in the high CU microbiome mice in vitro (). This difference was also observed in the low CU microbiome mice, although the magnitude of difference between the extruded and porridge samples was smaller. This finding differs from the present in vivo study, where the ASVs associated with porridge diets were predicted to contribute elevated sugar degradation and SCFA production compared with the ASVs associated with the extruded diets. Together, these results support the conclusion that the functions performed by differentially abundant ASVs among different dietary treatments are similar between our in vitro and in vivo studies despite unique changes in microbiota composition under these two different experimental conditions. Furthermore, the host metabolic outcomes observed during the in vivo study were predictable based on the projected functions obtained from the in vitro study.
Figure 7. ASVs associated with extrusion were different during an in vivo study compared with prior in vitro study but showed similar predicted functionality. Spearman’s rank correlation plots between predicted pathway abundances contributed by differentially abundant ASVs in vivo versus in vitro in high and low carbohydrate utilization microbiomes on extruded (extr) or non-extruded (wwp) substrates (a); mean abundances of pathway classes with significant differences between extr and wwp (b); *p < .05; **p < .01; ***p < .001; ****p < .0001 (Wilcoxon-test with Benjamini-Hochberg p-value adjustment).
Discussion
In the present study, human microbiota-associated mice inoculated with one of two microbiomes that varied in their in vitro CU capability (high versus low) were fed processed whole grain diets for 12 weeks. Mice consuming either extruded diet (whole wheat or brown rice) were less metabolically healthy than mice consuming the other diets regardless of microbiome; however, the negative effects of consuming the extruded diet were exacerbated in mice harboring the high CU microbiome compared with the low CU microbiome. Because similar host metabolic responses to consuming an extruded diet were seen in both microbiomes – except for an exaggerated effect in the high CU microbiome mice – we suggest that the negative effects of extrusion may involve both microbiome-independent and -dependent mechanisms. First, extrusion can have a microbiome-independent influence on glucose metabolism, whereby it increases the glycemic index and load of cereals and whole grains by making the starch more rapidly available and digestible.Citation43–45 This is supported by our data showing that the extruded samples had a much higher proportion of gelatinized starch, which is known to digest more rapidly than ungelatinized starch,Citation46 compared with the whole wheat porridge sample. The change in glycemic index for a particular grain processed via extrusion or not has been shown to be much greater than the difference between grains processed using the same conditions,Citation47 further suggesting a dramatic influence of processing on the glycemic index of whole grains that exceed the differences in composition among grain types. This scenario is particularly true when extrusion conditions are extremeCitation48 as they were in this study. Consequently, the negative effects of the extruded diets in both microbiome backgrounds could be due, in part, to the increased glycemic index of the extruded diets.
Nevertheless, high CU microbiome mice clearly experienced exaggerated negative effects when consuming extruded diets. These exacerbated negative effects were likely mediated via microbiome-dependent pathways because they were not observed in the low CU microbiome mice and because the high CU microbiome mice consuming the extruded diets clustered together for both changes in metabolic health and microbiota composition during feeding. Based on our results showing that ASVs associated with the extruded diets contributed to elevated sugar degradation and SCFA production, together with elevated colonic acetate production in mice fed the extruded diets, we infer that the microbiome-dependent effects of extrusion on host health were related to increased energy recovery brought about by increased fermentation of carbohydrates and acetate production by the microbiome.
Although SCFA are beneficial products of fermentation of dietary fibers by the microbiome,Citation49 they also provide a means of energy recovery (increased Calories) from the diet.Citation50 Acetate in particular has generated a fair amount of controversial literature about its benefits versus detrimental effects on host metabolic health.Citation51–54 Acetate arising from gut microbiota metabolism is absorbed by colonocytes and transported to the liver where a portion of it is available for lipogenesis and cholesterol synthesis.Citation55 However, most microbiota-generated acetate exits the liver and enters peripheral circulation for uptake by adipose and muscle tissueCitation55 where it is then either oxidized to produce ATP or used as a substrate for de novo lipogenesis depending on energy needs.Citation50 Alternatively, circulating acetate can bind to G-protein coupled receptors and precipitate host metabolic benefits by reducing appetite and increasing both insulin sensitivity and energy expenditure.Citation56 Therefore, under normal circumstances, any energy recovery contributed by acetate arising from gut microbial fermentation of dietary fiber fermentation is likely counteracted by reduced appetite and increased energy expenditure, thus ultimately leading to health benefits for the host. However, under ad libitum consumption of an energy dense diet, the positive effects of acetate may not outweigh the additional energy it supplies. For example, Perry et al.Citation57 showed that mice consuming a high fat diet (60% kcal from fat containing 6.5% dietary fiber as cellulose) produced elevated levels of acetate, which were responsible for increased insulin resistance and body weight gain. Additionally, human fecal samples from obese individuals are repeatedly reported to have higher acetate concentrations compared with those obtained from normal weight individuals,Citation58–61 even though people with obesity tend to eat lower fiber diets.Citation62 In our study, although all diets contained equivalent concentrations of dietary fiber, the extruded diet had a portion of the cellulose replaced with dietary fibers that were easily fermentable for mice with the high CU microbiome. Replacement of poorly fermentable dietary fibers (i.e., cellulose or, to a lesser extent, the dietary fibers in the whole wheat porridge), with the available fermentable fibers in the extruded diets likely led to increased acetate production and energy harvest from the diet and subsequent negative health effects for the mice.
Our observation of higher acetate concentrations in the colon versus the cecum of high CU mice is peculiar. The cecum is usually the primary site of dietary carbohydrate fermentation, and SCFA concentrations decrease along the colon due to absorption by host colonocytes.Citation63 However, Arora et al. showed that cecal SCFA were dramatically reduced in mice consuming a defined diet containing 10% cellulose compared with mice consuming chow diets.Citation64 When all of the cellulose was replaced with a fermentable flaxseed fiber, total cecal SCFA concentrations were partially restored but still significantly lower than mice on a chow diet. In our study, only a portion of the cellulose was replaced with the whole grains (0.3–1.8% of the diet or 5–30% of the cellulose). Perhaps the low concentration of fermentable fiber in our study was not sufficient to elicit substantial SCFA production in the cecum. Moreover, whole grain dietary fibers are known for their slow and incomplete fermentation properties,Citation65 which may explain why fermentation of the fiber in our test diets was delayed into the colon.
Another potential explanation for the elevated acetate production in the colons of high CU mice consuming extruded diets may involve fermentation of other substrates such as host polysaccharides after the fermentable carbohydrates supplied by the extruded diets were exhausted. The observation that acetate was only elevated in the colons of high CU mice consuming the extruded whole grain diets, which were known to be more readily available to this microbiome,Citation9 together with previous studies showing that whole grains tend to increase propionate or butyrate rather than acetate,Citation13,Citation14,Citation66,Citation67 support this explanation.
Remarkably, the method of grain processing (extruded versus porridge) had a greater effect on the metabolic health of the mice than the type of whole grain added to the diet (whole wheat versus brown rice). The extrusion processing utilized in this study was extremely severe, employing high temperature and screw speed and low moisture, while boiling grain into porridge is among the most mild treatments that can be used to process grain into an edible food product. Although we magnified the effects of processing by selecting very severe extrusion conditions and mild porridge conditions, we also did this for grain type, since brown rice is the lowest in dietary fiber among whole grains.Citation15 Thus, our study highlights the importance of processing method on the interaction between whole grains and the gut microbiome. It should be noted, however, that the extrusion conditions utilized in this study were very severe and are not typically used in routine food production. Thus, our results probably represent a worst-case scenario for extrusion. Other more typical extrusion conditions may not elicit such a negative impact on host metabolic health.
In contrast to the extruded diet, the porridge diet did not result in negative health effects. Although we anticipated that porridge would provide significant metabolic improvements for the host compared to extrusion, we expected that it would also improve host health relative to the control Western diet. Despite tendencies for the whole wheat porridge diet to provide metabolic benefits over the control Western diet, the effects were not significant. As discussed previously, all our diets were fabricated with equivalent concentrations of dietary fiber – the control Western diet containing cellulose and the whole wheat porridge diet containing a portion of cellulose replaced with the dietary fibers from the porridge. However, because the diets were formulated with the processed whole grains rather than isolated cereal fibers, the dietary fibers from the porridge comprised only 1.8% of the overall diet. Other studies demonstrating beneficial metabolic benefits of dietary fiber have provided higher levels by incorporating bran into the diet and removing all of the cellulose ingredient (5.8% fiber from bran).Citation68 Although our approach was chosen to approximate the recommended intake of three servings of whole grain per day for Americans,Citation6 the level of inclusion of these fibers in the diet was perhaps still too low to elicit significant positive effects on host metabolic health.
Finally, we found discrepancies between taxa associated with extruded and non-extruded diets in this in vivo study compared with our previous in vitro study. Specifically, extrusion was associated with decreases in some Lachnospiraceae and Ruminococcaceae in vitro, but several ASVs from these families were elevated with extrusion in vivo. This differential result is likely due to 1) imperfect establishment of human gut microbes into a mouse modelCitation69 and 2) consumption of other dietary components (in addition to the processed whole grains) that were not included in the in vitro study but likely influenced microbiota composition during this in vivo study. However, the predicted metabolic pathways contributed by ASVs associated with the extruded or non-extruded diets were highly correlated between the in vivo and in vitro results, suggesting that although the ASVs were different, they were performing similar functions. Importantly, the metabolic phenotypes observed in the present study were entirely predictable based on the results from the in vitro study.
Conclusions
The present study provides novel insight into the influence of whole grain processing method on host metabolic health. Surprisingly, the impact of processing was greater than the effect of grain type, where extruded whole wheat and brown rice both worsened host metabolic health compared to whole wheat porridge. This outcome was observed independently of the microbiome’s CU capacity; however, mice harboring the high CU microbiome exhibited an exaggerated host metabolic response to food processing, where severe extrusion resulted in a greater number of significant negative effects on host health than mice harboring the low CU microbiome. Thus, the negative effects of extrusion on host health were attributed to microbiome-independent effects in both microbiomes – likely an increase in glycemic index of the diet – and microbiome-dependent effects in only the high CU microbiome mice. In mice carrying the high CU microbiome, grain processing had the greatest effects on the abundance of Lachnospiraceae and Ruminococcaceae, which contributed to elevated sugar degradation and acetate production by the microbiome when feeding extruded grains versus porridge, thus resulting in increased energy recovery. We encourage funding agencies and the food industry to consider with greater urgency the importance of developing food processing strategies that target the microbiome and decrease the public health crises caused by poor diet.Citation70
Author contributions
ART and DR contributed conception and design of the study and secured funding; ART and DR provided resources; CS, MVH, YX, RRSM, SL, RJS, and DR performed experiments; DR and MVH performed data and statistical analysis; CS and DR wrote the first draft of the manuscript. All authors contributed to manuscript revision and read and approved the submitted version.
Data availability
The datasets supporting the conclusions of this article are included within the article and its additional files. Additional files include: 1) metadata table, 2) OTU table 3) taxonomy table, 4) tree file, 5) biological sequence file, 6) PICRUSt2 pathway abundance contribution table, 7) Metacyc pathway class descriptions, 8) mouse metabolic and SCFA data. Raw sequencing data (paired end reads in FASTQ) and metadata are available at the NCBI SRA: PRJNA690589.
Ethics approval and consent to participate
All procedures involving human subjects were approved by the Institutional Review Board of the University of Nebraska–Lincoln (20160816311EP). Written informed consent was obtained from all subjects. The Institutional Animal Care and Use Committee at the University of Nebraska–Lincoln approved all procedures involving animals (Project ID: 1700).
Supplemental Material
Download Zip (705.9 KB)Acknowledgments
The authors gratefully acknowledge Tushar Verma for technical assistance with extrusion, Alex Racine for assistance with animal studies, and the Nebraska Gnotobiotic Mouse Program staff for their technical expertise and skillful animal husbandry.
Disclosure statement
The authors declare that the research was conducted in the absence of any commercial or financial relationships that could be construed as potential conflicts of interest.
Supplementary material
Supplemental data for this article can be accessed online at https://doi.org/10.1080/19490976.2022.2126275
Correction Statement
This article has been corrected with minor changes. These changes do not impact the academic content of the article.
Additional information
Funding
References
- Cho SS, Qi L, Fahey GC, Klurfeld DM. Consumption of cereal fiber, mixtures of whole grains and bran, and whole grains and risk reduction in type 2 diabetes, obesity, and cardiovascular disease. Am J Clin Nutr. 2013;98(2):594–20. doi:10.3945/ajcn.113.067629.
- Carroccio A, Celano G, Cottone C, Di Sclafani G, Vannini L, D’Alcamo A, Vacca M, Calabrese FM, Mansueto P, Soresi M, et al. WHOLE-meal ancient wheat-based diet: effect on metabolic parameters and microbiota. Dig Liver Dis. 2021;53(11):1412–1421. doi:10.1016/J.DLD.2021.04.026.
- Jefferson A, Adolphus K. The effects of intact cereal grain fibers, including wheat bran on the gut microbiota composition of healthy adults: a systematic review. Front Nutr. 2019; 6:33. accessed 2021 Mar 22. Internet: 10.3389/fnut.2019.00033.
- Albertson AM, Reicks M, Joshi N, Gugger CK. Whole grain consumption trends and associations with body weight measures in the United States: results from the cross sectional national health and nutrition examination survey 2001–2012. Nutr J. 2016;15(1):8. doi:10.1186/s12937-016-0126-4.
- US Department of Agriculture-Agricultural Research Service. 2021. Usual nutrient intake from food and beverages, by gender and age, What We Eat in America, NHANES 2015-2018 [Internet]. [accessed 2021 Mar 22]. http://www.ars.usda.gov/nea/bhnrc/fsrg
- US Department of Agriculture, US Department of Health and Human Services. Dietary guidelines for Americans, 2020-2025. 9th, Internet. Washington DC. DietaryGuidelines.gov; 2020.
- Barratt MJ, Lebrilla C, Shapiro HY, Gordon JI. The gut microbiota, food science, and human nutrition: a timely marriage. Cell Host Microbe. 2017;22(2):134–141. doi:10.1016/j.chom.2017.07.006.
- Carmody RN, Bisanz JE, Bowen BP, Maurice CF, Lyalina S, Louie KB, Treen D, Chadaideh KS, Maini Rekdal V, Bess EN, et al. Cooking shapes the structure and function of the gut microbiome. Nat Microbiol. 2019;4(12):2052–2063. [Internet]. accessed. doi: 10.1038/s41564-019-0569-4.
- Smith C, Van Haute MJ, Rose DJ, Dudley EG. Processing has differential effects on microbiota-accessible carbohydrates in whole grains during in vitro fermentation. Appl Environ Microbiol. 2020;86(21):1–16. doi:10.1128/AEM.01705-20.
- Salonen A, Lahti L, Salojärvi J, Holtrop G, Korpela K, Duncan SH, Date P, Farquharson F, Johnstone AM, Lobley GE, et al. Impact of diet and individual variation on intestinal microbiota composition and fermentation products in obese men. ISME J. 2014;8(11):2218–2230. doi:10.1038/ismej.2014.63.
- Korpela K, Flint HJ, Johnstone AM, Lappi J, Poutanen K, Dewulf E, Delzenne N, De Vos WM, Salonen A, Bereswill S. Gut microbiota signatures predict host and microbiota responses to dietary interventions in obese individuals. PLoS One. 2014;9(3):e90702. doi:10.1371/JOURNAL.PONE.0090702.
- Carvalho-Wells AL, Helmolz K, Nodet C, Molzer C, Leonard C, McKevith B, Thielecke F, Jackson KG, Tuohy KM. Determination of the in vivo prebiotic potential of a maize-based whole grain breakfast cereal: a human feeding study. Br J Nutr. 2010;104(9):1353–1356. doi:10.1017/S0007114510002084.
- Zhong Y, Marungruang N, Fåk F, Nyman M. Effects of two whole-grain barley varieties on caecal SCFA, gut microbiota and plasma inflammatory markers in rats consuming low- and high-fat diets. Br J Nutr. 2015;113(10):1558–1570. doi:10.1017/S0007114515000793.
- Zhong Y, Nyman M, Fåk F. Modulation of gut microbiota in rats fed high-fat diets by processing whole-grain barley to barley malt. Mol Nutr Food Res. 2015;59(10):2066–2076. doi:10.1002/mnfr.201500187.
- Rose DJ. Impact of whole grains on the gut microbiota: the next frontier for oats? Br J Nutr Internet. 2014;112(S2):S44–S49. doi:10.1017/S0007114514002244.
- Doblado-maldonado AF, Flores RA, Rose DJ. Low moisture milling of wheat for quality testing of whole grain flour. J Cereal Sci. 2013;58(3):420–423. doi:10.1016/j.jcs.2013.08.006.
- Arcila JA, Weier SA, Rose DJ. Changes in dietary fiber fractions and gut microbial fermentation properties of wheat bran after extrusion and bread making. Food Res Int. 2015;74:217–223. Internet. doi:10.1016/j.foodres.2015.05.005.
- Cereals & Grains Association. 1999. Moisture–Air-oven methods. In: AACC approv methods anal. 11th ed. St. Paul (MN);Cereals & Grains Association. 44–15.02. 10.1094/AACCIntMethod-44-15.02
- Cereals & Grains Association. 1999. Crude protein–Combustion method. In: AACC approv methods anal. 11th ed. St. Paul (MN);Cereals & Grains Association. 46–30.01. 10.1094/AACCIntMethod-46-30.01
- Cereals & Grains Association. 1999. Crude fat in wheat, corn, and soy flour, feeds, and mixed feeds. In AACC approv methods anal. 11th ed. St. Paul (MN);Cereals & Grains Association. 30–25.01. 10.1094/AACCIntMethod-30-25.01
- Cereals & Grains Association. 1999. Total starch assay procedure (Megazyme amyloglucosidase/α-amylase method). In: AACC Approv Methods Anal. 11th ed. St. Paul (MN);Cereals & Grains Association. 76–13.01. 10.1094/AACCIntMethod-76-13.01
- Cereals & Grains Association. 2011. Insoluble, soluble, and total dietary fiber (Codex definition) by an enzymatic-gravimetric method and liquid chromatography. In: AACC approv methods anal. 11th ed. St. Paul (MN);Cereals & Grains Association. 32–50.01. 10.1094/AACCIntMethod-32-50.01
- Liu K, Liu Q. Enzymatic determination of total starch and degree of starch gelatinization in various products. Food Hydrocoll. 2020;103:105639. Internet. doi:10.1016/j.foodhyd.2019.105639.
- Sluiter A, Hames B, Ruiz R, Scarlata C, Sluiter J, Templeton D, Nrel DC. Determination of structural carbohydrates and lignin in biomass determination of structural carbohydrates and lignin in biomass. Tech Rep. 2012:510–42618. Internet. https://www.nrel.gov/docs/gen/fy13/42618.pdf
- Gomes-Neto JC, Mantz S, Held K, Sinha R, Segura Munoz RR, Schmaltz R, Benson AK, Walter J, Ramer-Tait AE. A real-time PCR assay for accurate quantification of the individual members of the Altered Schaedler Flora microbiota in gnotobiotic mice. J Microbiol Methods. 2017;135:52–62. Internet. doi:10.1016/J.MIMET.2017.02.003.
- De Vadder F, Kovatcheva-Datchary P, Goncalves D, Vinera J, Zitoun C, Duchampt A, Bäckhed F, Mithieux G. Microbiota-generated metabolites promote metabolic benefits via gut-brain neural circuits. Cell. 2014;156(1–2):84–96. doi:10.1016/j.cell.2013.12.016.
- Frøsig C, Jensen TE, Jeppesen J, Pehmøller C, Treebak JT, Maarbjerg SJ, Kristensen JM, Sylow L, Alsted TJ, Schjerling P, et al. AMPK and insulin action - Responses to ageing and high fat diet. PLoS One. 2013;8(5):e62338. doi:10.1371/JOURNAL.PONE.0062338.
- Hartzell AL, Maldonado-Gomez MX, Hutkins RW, Rose DJ. Synthesis and in vitro digestion and fermentation of acylated inulin. Bioact Carbohydrates Diet Fibre Internet. 2013;1(1):81–88. doi:10.1016/j.bcdf.2013.01.004.
- Kozich JJ, Westcott SL, Baxter NT, Highlander SK, Schloss PD. Development of a dual-index sequencing strategy and curation pipeline for analyzing amplicon sequence data on the MiSeq Illumina sequencing platform. Appl Environ Microbiol Internet. 2013;79(17):5112–5120. doi:10.1128/aem.01043-13.
- Bolyen E, Rideout JR, Dillon MR, Bokulich NA, Abnet CC, Al-Ghalith GA, Alexander H, Alm EJ, Arumugam M, Asnicar F, et al. Reproducible, interactive, scalable and extensible microbiome data science using QIIME 2. Nat Biotechnol. 2019;37(8):852–857. Internet. doi:10.1038/s41587-019-0209-9.
- Callahan BJ, McMurdie PJ, Rosen MJ, Han AW, Johnson AJA, Holmes SP. DADA2: high-resolution sample inference from Illumina amplicon data. Nat Methods Internet. 2016;13(7):581–583. doi:10.1038/nmeth.3869.
- Quast C, Pruesse E, Yilmaz P, Gerken J, Schweer T, Yarza P, Peplies J, Glöckner FO. The SILVA ribosomal RNA gene database project: improved data processing and web-based tools. Nucleic Acids Res. [Internet]. accessed. 2013;41(D1):D590–D596. doi:10.1093/nar/gks1219.
- Douglas GM, Maffei VJ, Zaneveld J, Yurgel SN, Brown JR, Taylor CM, Huttenhower C, Langille MGI. PICRUSt2 for prediction of metagenome functions. Nat Biotechnol. 2020;38(6):685–688. doi:10.1038/s41587-020-0548-6.
- Segata N, Izard J, Waldron L, Gevers D, Miropolsky L, Garrett WS, Huttenhower C. Metagenomic biomarker discovery and explanation. Genome Biol. [Internet]. accessed. 2011;12(6):R60. doi:10.1186/gb-2011-12-6-r60.
- McMurdie PJ, Holmes S. phyloseq: an R package for reproducible interactive analysis and graphics of microbiome census data.Watson M, editor. PLoS One. Internet]. [accessed. 2013;8(4):e61217. doi:10.1371/journal.pone.0061217.
- Oksanen J, Blanchet FG, Friendly M, Kindt R, Legendre P, McGlinn D, Minchin PR, O’Hara RB, Simpson GL, Solymos P, et al. 2020. vegan: Community Ecology Package [Internet]. accessed 2021 Dec 22]. https://cran.r-project.org/package=vegan
- Kassambara A 2020. rstatix: pipe-friendly framework for basic statistical tests [Internet]. https://cran.r-project.org/package=rstatix
- Love MI, Huber W, Anders S. Moderated estimation of fold change and dispersion for RNA-seq data with DESeq2. Genome Biol. [Internet]. accessed. 2014;15(12):550. doi:10.1186/s13059-014-0550-8.
- Gu Z, Eils R, Schlesner M. Complex heatmaps reveal patterns and correlations in multidimensional genomic data. Bioinformatics. [Internet]. accessed. 2016;32(18):2847–2849. doi:10.1093/bioinformatics/btw313.
- Yu G, Smith DK, Zhu H, Guan Y, Lam TTY, McInerny G. Ggtree: an r package for visualization and annotation of phylogenetic trees with their covariates and other associated data. Methods Ecol Evol. [Internet]. accessed. 2017;8(1):28–36. doi:10.1111/2041-210X.12628.
- Wickham H. ggplot2: elegant graphics for data analysis. New York: Springer-Verlag; 2016.
- Wilke CO 2019. cowplot: streamlined plot theme and plot annotations for “ggplot2”. version 1.0.0 [Internet]. https://cran.r-project.org/package=cowplot
- Atkinson FS, Foster-Powell K, Brand-Miller JC. International tables of glycemic index and glycemic load values: 2008. Diabetes Care. 2008;31(12):2281–2283. doi:10.2337/dc08-1239.
- Jenkins DJA, Wolever TMS, Jenkins AL. Starchy foods and glycemic index. Diabetes Care. 1988;11(2):149–159. doi:10.2337/diacare.11.2.149.
- Ross SW, Brand JC, Thorburn AW, Truswell AS. Glycemic index of processed wheat products. Am J Clin Nutr. 1987;46(4):631–635. doi:10.1093/ajcn/46.4.631.
- Korompokis K, Verbeke K, Delcour JA. Structural factors governing starch digestion and glycemic responses and how they can be modified by enzymatic approaches: a review and a guide. Compr Rev Food Sci Food Saf. [Internet]. accessed. 2021;20(6):5965–5991. doi:10.1111/1541-4337.12847.
- Shobana S, Kumari SRU, Malleshi NG, Ali SZ. Glycemic response of rice, wheat and finger millet based diabetic food formulations in normoglycemic subjects. Int J Food Sci Nutr. 2007;58(5):363–372. doi:10.1080/09637480701252229.
- Björck I, Asp NG, Birkhed D, Eliasson AC, Sjöberg LB, Lundquist I. Effects of processing on starch availability In vitro and In vivo. II. Drum-drying of wheat flour. J Cereal Sci. 1984;2(3):165–178. doi:10.1016/S0733-5210(84)80030-2.
- Ríos-Covián D, Ruas-Madiedo P, Margolles A, Gueimonde M, de Los Reyes-Gavilán CG, Salazar N. Intestinal short chain fatty acids and their link with diet and human health. Front Microbiol. 2016; 7:185. accessed 2017 Dec 12. Internet: 10.3389/fmicb.2016.00185.
- Bergman EN. Energy contributions of volatile fatty acids from the gastrointestinal tract in various species. Physiol Rev. [Internet]. accessed. 1990;70(2):567–590. doi:10.1152/PHYSREV.1990.70.2.567.
- Sukkar AH, Lett AM, Frost G, Chambers ES. Regulation of energy expenditure and substrate oxidation by short-chain fatty acids. J Endocrinol. [Internet]. accessed. 2019;242(2):R1–R8. doi:10.1530/JOE-19-0098.
- Liu JL, Segovia I, Yuan XL, Gao ZH. Controversial roles of gut microbiota-derived short-chain fatty acids (SCFAs) on pancreatic β-cell growth and insulin secretion. Int J Mol Sci. [Internet]. accessed. 2020;21(3):910. doi:10.3390/IJMS21030910.
- Bindels LB, Leclercq I. Colonic acetate in obesity: location matters! Clin Sci. [Internet]. accessed. 2016;130(22):2083–2086. doi:10.1042/CS20160556.
- Blaut M. Gut microbiota and energy balance: role in obesity. Proc Nutr Soc. [Internet]. accessed. 2015;74(3):227–234. doi:10.1017/S0029665114001700.
- Bloemen JG, Venema K, van de Poll Mc, Olde Damink SW, Buurman WA, Dejong CH. Short chain fatty acids exchange across the gut and liver in humans measured at surgery. Clin Nutr. 2009;28(6):657–661. doi:10.1016/J.CLNU.2009.05.011.
- Hernández MAG, Canfora EE, Jocken JWE, Blaak EE. The short-chain fatty acid acetate in body weight control and insulin sensitivity. Nutrients. Internet]. [accessed. 2019;11(8):1943. doi:10.3390/NU11081943.
- Perry RJ, Peng L, Barry NA, Cline GW, Zhang D, Cardone RL, Petersen KF, Kibbey RG, Goodman AL, Shulman GI. Acetate mediates a microbiome–brain–β-cell axis to promote metabolic syndrome. Nature. Internet]. [accessed. 2016;534(7606):213–217. doi:10.1038/NATURE18309.
- Goffredo M, Mass K, Parks EJ, Wagner DA, McClure EA, Graf J, Savoye M, Pierpont B, Cline G, Santoro N. Role of gut microbiota and short chain fatty acids in modulating energy harvest and fat partitioning in youth. J Clin Endocrinol Metab. Internet]. [accessed. 2016;101(11):4367–4376. doi:10.1210/JC.2016-1797.
- de la Cuesta-Zuluaga J, Mueller NT, Álvarez-Quintero R, Velásquez-Mejía EP, Sierra JA, Corrales-Agudelo V, Carmona JA, Abad JM, Escobar JS. Higher fecal short-chain fatty acid levels are associated with gut microbiome dysbiosis, obesity, hypertension and cardiometabolic disease risk factors. Nutrients. Internet]. [accessed. 2018;11(1):51. doi:10.3390/NU11010051.
- Fernandes J, Su W, Rahat-Rozenbloom S, Wolever TMS, Comelli EM. Adiposity, gut microbiota and faecal short chain fatty acids are linked in adult humans. Nutr Diabetes. Internet]. [accessed. 2014;4(6):e121–e121. doi:10.1038/NUTD.2014.23.
- Teixeira TFS, Grześkowiak Ł, Franceschini SCC, Bressan J, Ferreira CLLF, Peluzio MCG. Higher level of faecal SCFA in women correlates with metabolic syndrome risk factors. Br J Nutr. Internet]. [accessed. 2013;109(5):914–919. doi:10.1017/S0007114512002723.
- Slavin JL. Dietary fiber and body weight. Nutrition. 2005;21(3):411–418. doi:10.1016/J.NUT.2004.08.018.
- Brown K, Abbott DW, Uwiera RRE, Inglis GD. Removal of the cecum affects intestinal fermentation, enteric bacterial community structure, and acute colitis in mice. Gut Microbes. [Internet]. accessed. 2018;9(3):218–235. doi:10.1080/19490976.2017.1408763.
- Arora T, Rudenko O, Egerod KL, Husted AS, Kovatcheva-Datchary P, Akrami R, Kristensen M, Schwartz TW, Bäckhed F. Microbial fermentation of flaxseed fibers modulates the transcriptome of GPR41-expressing enteroendocrine cells and protects mice against diet-induced obesity. Am J Physiol - Endocrinol Metab. [Internet]. accessed. 2019;316(3):E453–E463. doi:10.1152/AJPENDO.00391.2018.
- Nordlund E, Aura AM, Mattila I, Kössö T, Rouau X, Poutanen K. Formation of phenolic microbial metabolites and short-chain fatty acids from rye, wheat, and oat bran and their fractions in the metabolical in vitro colon model. J Agric Food Chem. [Internet]. accessed. 2012;60(33):8134–8145. doi:10.1021/JF3008037.
- Garcia-Mazcorro JF, Ivanov I, Mills DA, Noratto G. Influence of whole-wheat consumption on fecal microbial community structure of obese diabetic mice. Peer J. 2016;4:e1702. doi:10.7717/peerj.1702.
- Ounnas F, Privé F, Salen P, Gaci N, Tottey W, Calani L, Bresciani L, López-Gutiérrez N, Hazane-Puch F, Laporte F, et al. Whole rye consumption improves blood and liver n-3 fatty acid profile and gut microbiota composition in rats. PLoS One. 2016;11(2):e0148118. doi:10.1371/journal.pone.0148118.
- Keski-Rahkonen P, Kolehmainen M, Lappi J, Micard V, Jokkala J, Rosa-Sibakov N, Pihlajamäki J, V KP, Mykkänen H, Poutanen K, et al.Decreased plasma serotonin and other metabolite changes in healthy adults after consumption of wholegrain rye: an untargeted metabolomics study. Am J Clin Nutr. 2019;109(6):1630–1639. [Internet]. accessed. doi: 10.1093/ajcn/nqy394.
- Arrieta MC, Walter J, Finlay BB. Human microbiota-associated mice: a model with challenges. Cell Host Microbe. 2016;19(5):575–578. doi:10.1016/J.CHOM.2016.04.014.
- Murray CJL, Mokdad AH, Ballestros K, Echko M, Glenn S, Olsen HE, Mullany E, Lee A, Khan AR, Ahmadi A, et al. The state of US health, 1990-2016: burden of diseases, injuries, and risk factors among US states. JAMA. 2018;319(14):1444–1472. doi:10.1001/JAMA.2018.0158.