
ABSTRACT
The success of fecal microbiota transplants (FMT) has provided the necessary proof-of-concept for microbiome therapeutics. Yet, feces-based therapies have many associated risks and uncertainties, and hence defined microbial consortia that modify the microbiome in a targeted manner have emerged as a promising safer alternative to FMT. The development of such live biotherapeutic products has important challenges, including the selection of appropriate strains and the controlled production of the consortia at scale. Here, we report on an ecology- and biotechnology-based approach to microbial consortium construction that overcomes these issues. We selected nine strains that form a consortium to emulate the central metabolic pathways of carbohydrate fermentation in the healthy human gut microbiota. Continuous co-culturing of the bacteria produces a stable and reproducible consortium whose growth and metabolic activity are distinct from an equivalent mix of individually cultured strains. Further, we showed that our function-based consortium is as effective as FMT in counteracting dysbiosis in a dextran sodium sulfate mouse model of acute colitis, while an equivalent mix of strains failed to match FMT. Finally, we showed robustness and general applicability of our approach by designing and producing additional stable consortia of controlled composition. We propose that combining a bottom-up functional design with continuous co-cultivation is a powerful strategy to produce robust functionally designed synthetic consortia for therapeutic use.
Introduction
Intestinal microbiome-based live biotherapeutic products (LBPs) are emerging as a novel modality to treat a large number of chronic diseases.Citation1,Citation2 The therapeutic objective is to induce a targeted modulation of the intestinal microbiota by administering live microorganisms to reverse dysbiosis and promote recovery.Citation3,Citation4 However, how to construct and produce such LBPs and robustly achieve intestinal microbiota modulation is a yet unsolved technological and biological challenge.
Fecal microbiota transfer (FMT) from healthy donors is currently the most successful method of restoring diseased microbiota to a healthy state.Citation5 However, it is not fully understood what the specific properties of a healthy microbiota are and how these might promote recovery,Citation6,Citation7 resulting in variable efficacy of FMT for different diseases.Citation5,Citation8–11 Moreover, the potential for adverse events with FMT raises critical safety concerns.Citation12
Defined bacterial consortia that are well characterized represent a safer and more controlled alternative to FMT.Citation13,Citation14 Because a healthy microbiota typically contains hundreds of strains, simply recreating the full taxonomic diversity in a defined product is intangible. The complexity can, however, be reduced by removing functionally redundant strainsCitation15–17 and focusing on those microbial functions that are key for the specific therapeutic target. While intuitive in principle, translating this functional concept into a defined consortium is not straightforward because most of the intestinal microbiota remains uncultured and uncharacterized.Citation18
Here, we present a technological solution to constructing and co-culturing multi-strain consortia based on the principle of ‘division of labor’. Microbial consortia in which the overall function is divided among bacteria are often more robust and productive than would be expected from the physiology of individual strains.Citation19–23 Examples include simplified trophic consortia used in wastewater treatment,Citation24 biofuel production,Citation25–27 and food production.Citation28 Nevertheless, this principle has not yet been applied to designing intestinal LBPs. We hypothesized that division of labor increases consortium stability and robustness, thus enabling the resulting LBP to match the therapeutic effect of FMT. We used our approach to select nine anaerobic intestinal bacteria that cover the essential elements of carbohydrate metabolism in the large intestine.Citation29,Citation30 Using continuous co-culture fermentation, we confirmed the reproducible establishment of a compositional and metabolic equilibrium with complete carbohydrate fermentation akin to a healthy intestinal microbiome. Importantly, co-culturing affected the phenotypic state of the strains in such a way that the co-cultured consortium (CC) was different from an equivalent mix of identical but individually cultivated bacterial strains. The CC matched the in vivo efficacy of FMT in a mouse model of acute dextran sulfate sodium (DSS) colitis, while the simple mix of strains did not. Finally, we demonstrated the robustness and reproducibility of our approach by designing and producing further consortia comprising different strains. Thus, our approach offers a robust blueprint for the design and production of consortium LBPs.
Results
The joint metabolic activity of nine strains fully converts complex carbohydrate substrates into end metabolites without accumulating intermediate products
We aimed to develop a simplified bacterial consortium that recapitulates the most central function of the microbiota in a healthy intestine – carbohydrate fermentation. On the one hand, bacteria gain energy from breaking down complex carbohydrates for growth and maintenance. On the other hand, fermentation products interact with host physiology. The key end products of the carbohydrate metabolism are short-chain fatty acids (SCFA) that can be beneficial to the host.Citation31,Citation32 However, the accumulation of intermediate breakdown products due to incomplete fermentation can be detrimental.Citation32–34 This multi-step conversion of complex carbohydrates through intermediate products into end products in the gut is typically distributed across different bacterial species in a multi-level trophic cascade. While there are several trophic paths to convert one metabolite into another, we here propose a defined set of 13 metabolic reactions deemed as essentialCitation35,Citation36 (Supplementary Table S1). These reactions reflect the baseline requirement for the stabilization of the gut microbiome as an ecosystem (). Primary ‘A’ reactions cover the conversion of complex fibers, starches, and sugars into either intermediate (formate, lactate, succinate, acetate) or end products (acetate, butyrate, propionate). Primary degraders perform these reactions using specific mechanisms such as extracellular enzymes to degrade and import these primary substrates. Secondary ‘B’ reactions cover the conversion of intermediate metabolites into the end metabolites. These intermediate products can inhibit the growth of some bacteria,Citation38 and their accumulation has been associated with different diseases.Citation32,Citation33,Citation39 Finally, ‘C’ reactions consume gases like hydrogen and oxygen that typically have inhibitory effects at high concentrations by disrupting redox balance or imposing oxidative stress.Citation40 With this characterization of the trophic cascade at hand, we next proceeded to construct a consortium to implement this functional sequence of reactions.
Figure 1. A minimal intestinal microbiome of nine strains performs complete carbohydrate fermentation. a. The trophic cascade of essential metabolic reactions ferments carbohydrates into the end metabolites acetate, propionate, and butyrate. ‘A reactions’ convert primary substrates to intermediate or end metabolites, and ‘B reactions’ convert intermediate metabolites. ‘C-reactions’ consume oxygen and hydrogen that can inhibit fermentative activity. b. The combined metabolic activity of nine selected species covers all essential reactions of the trophic cascade. Five primary degraders produce intermediate metabolites and acetate from primary substrates. Four secondary degraders consume intermediates and produce end metabolites. Hydrogen and oxygen metabolism were attributed to strains using published data. Y: YCFA, M: M2GSC, FO: formate, LT: lactate, SU: succinate, AC: acetate, BU: butyrate, PR: propionate. c. Log fold change of single strains (in gray) and co-cultured strains (PB002; in black) as determined by qPCR for three replicate experiments with three technical replicates from time point 0 h and 48 h with SD. The data are normalized by the 16S rRNA gene copy number of each strain. (†) The starting cell concentration of A. lactatifermentans could not be quantified in the mixed culture, thus the starting concentration of the single cultures was used as a proxy. Culturing was performed in Hungate tubes for single strains and PB002. d. Metabolites produced by either single cultures or the PB002 consortium. Intestine image adapted from Staff, Blausen.com. 2014. WikiJournal of Medicine 1(2).Citation37
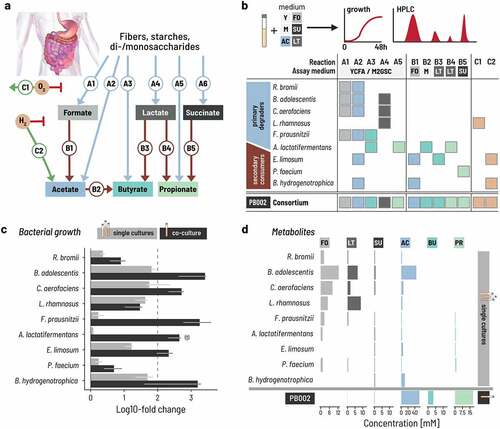
We selected a set of bacterial strains to fully cover these essential reactions and hypothesized that the resulting consortium would establish a trophic reaction cascade that recapitulates the carbohydrate metabolism in a healthy gut microbiome. To this end, we profiled a panel of human intestinal isolates for A and B reactions by testing their metabolic activity in anaerobic batch fermentation (, Supplementary Figure S1). We selected nine strains to form the first consortium, six of which were preferentially isolated from the same main donor to capture potential unknown adaptations between the strains (Supplementary Table S2).
For A reactions, we assessed growth after 48 h on two rich media that contained a mixture of primary carbon sources (M2GSC and YCFA, see Methods). We identified five primary degraders, in particular, that produced intermediate metabolites from these primary substrates. Ruminococcus bromii produced formate (19 mM) and acetate (10 mM) when grown in M2GSC after 48 h, but lower concentrations in YCFA (3 mM acetate and 2 mM formate). Bifidobacterium adolescentis produced primarily acetate on both M2GSC and YCFA (51 mM and 53 mM), with some formate (16 mM and 18 mM) and lactate (11 mM and 10 mM). Collinsella aerofaciens was a strong lactate (21 mM and 15 mM) and formate (21 mM and 16 mM) producer on M2GSC and YCFA, together with acetate (13 mM and 10 mM). Lacticaseibacillus rhamnosus produced almost exclusively lactate (57 mM and 37 mM). Finally, Faecalibacterium prausnitzii produced high concentrations of formate on M2GSC (17 mM) and some butyrate (7 mM) but only grew poorly on YCFA. Anaerotignum lactatifermentans produced propionate (14 mM) together with some butyrate (5 mM) on both media. Based on this, we assigned reactions A1 and A2 to R. bromii; A1, A2, and A4 to B. adolescentis and C. aerofaciens; A4 to L. rhamnosus, A1, A2, and A3 to F. prausnitzii; and A3 and A5 to A. lactatifermentans.
For B reactions, we assessed growth on media containing the respective intermediate organic acids (lactate, formate, succinate) as a carbon source after up to 7 d to account for the slow utilization rates we observed under these conditions. We identified four strains that together converted formate, lactate, and succinate. Eubacterium limosum consumed all formate after 2 d when grown in M2 supplemented with 60 mM formate (see Methods) and produced 26 mM acetate. E. limosum also consumed all lactate when grown in M2 supplemented with 52 mM lactate and produced 30 mM acetate and 20 mM butyrate. Phascolarctobacterium faecium converted all succinate to propionate when grown in M2 with 70 mM succinate. Finally, Blautia hydrogenotrophica converted most formate (53 mM) after 2 d and all formate after 7 d into acetate. We thus assigned reactions B1 and B3 to E. limosum; B5 to P. faecium; and B1 to B. hydrogenotrophica.
We assigned C reactions to the strains using published data: oxygen reduction (C1) was assigned to strains reported to grow under aerobic or microaerophilic conditions and hydrogen consumption (C2) to acetogenic or methanogenic gut bacteria.Citation41–43 We thus assigned C1 to L. rhamnosus, and C2 to E. limosum and B. hydrogenogrophica.
These nine strains thus cover all essential reactions of the carbohydrate metabolism except A6 (succinate production) and we subsequently refer to this consortium as PB002 (). We excluded succinate-producing Bacteroidota species in a first step but subsequently implemented A6 into other consortia as we report later in the paper. Interestingly, genome-based in silico predictions of the metabolic capabilities of the nine strains uncovered only a small fraction of their actual measured capabilities (Supplementary Table S3), confirming that in silico predictions cannot completely replace in vitro phenotypic characterization when selecting strains for their metabolic phenotype.
The individual strain assays show that each has different requirements for growth. However, because we chose the strains based on their trophic interactions, we hypothesized that the metabolic interactions within the consortium would allow all nine strains to grow even in a culture medium that did not explicitly accommodate all their specific requirements. Rather, we designed the medium to contain a minimal amount of undefined ingredients that are typically used to cover unknown nutrient requirements. The medium (PBMF009) contained four different primary carbohydrate substrates – disaccharides, fructo-oligosaccharides, resistant starch, and soluble starch – and was free of rumen fluid and meat extract but did contain complex ingredients of yeast extract, peptone, and amicase (Supplementary Table S4). We then measured the growth and metabolic activity of the nine strains individually and in co-culture in triple-buffered (3xb) PBMF009 in anaerobic batch incubations carried out in Hungate tubes with 100% CO2 at 37°C for 48 h. We quantified the growth of each strain by qPCR with genus-specific primers normalizing for gene copy number (Supplementary Table S5) and measured the metabolite profiles using high-performance liquid chromatography with refractive index (HPLC-RI).
All primary degraders showed equal or increased growth when co-cultured compared to monocultures (, Supplementary Figure S2). In monocultures, three out of the five primary degraders, C. aerofaciens, B. adolescentis, and L. rhamnosus grew more than 1.5 orders of magnitude after a 1% v/v inoculation, confirming that these primary degraders can utilize elements of 3xb PBMF009 as growth substrates. Notably, these primary degraders grew equally well or better in co-culture than in monoculture. The remaining two primary degraders, R. bromii and F. prausnitzii, grew poorly over the 48 h in monoculture but achieved nearly a 10- and 1000-fold growth, respectively, in co-culture. Because primary degraders are expected to compete for carbon sources when co-cultured, potential explanations for the superior growth in co-culture include that the strains are utilizing different components of the medium as their primary energy source or that some strains are removing and thus preventing the buildup to inhibitory levels of potentially toxic fermentation products like lactate and succinate. Nevertheless, the presence of the other strains improves the ability to extract energy for growth from the medium beyond what is possible in monoculture.
The growth of secondary degraders was equally boosted in co-culture compared to monoculture (, Supplementary Figure S2). In monoculture, E. limosum and B. hydrogenotrophica showed intermediate regrowth between 10-to-30-fold that increased to over 100-fold in co-culture. P. faecium and A. lactatifermentans marginally grew in monoculture, but their growth was enhanced by nearly 0.5 and 2 orders of magnitude in co-culture, respectively, suggesting that the compounds required for their growth were produced by the other strains in the consortium.
The metabolite profile of the co-culture suggested a successful establishment of the designed trophic network (, Supplementary Figure S3). In monoculture, all primary degraders produced mainly formate or lactate between 5 and 15 mM, and B. adolescentis additionally produced acetate above 30 mM. The secondary degraders did not produce meaningful amounts of metabolites in line with their poor growth in monoculture. In co-culture, we did not detect notable levels of lactate at 24 or 48 h. While formate reached moderate levels up to 5 mM at 24 h, it decreased again to zero by 48 h. This suggests that the lactate and formate that was produced by the primary degraders was subsequently metabolized by the secondary consumers, resulting in the production of propionate, butyrate, and acetate.
An initial fed-batch fermentation using ‘controlled strain ratios’ promotes the balanced growth and complete carbohydrate metabolism
Given that co-culturing improved the growth of all strains when compared to equivalent monocultures, we next tested whether strain coexistence and trophic interactions were robustly maintained in a scalable bioreactor setup. To this end, we precultured each strain in its respective preferred growth medium (see Supplementary Table S18) and subsequently mixed all strains together at equal volumes (EV) in condition-controlled stirred-tank bioreactors run in batch mode at physiologically relevant conditions (pH = 6.0, 37°C, anaerobiosis) for 48 h (). Starting 12-h post inoculation, we monitored the optical density (OD) and metabolite concentrations every 3 h and strain composition for a subset of time points.
Figure 2. Fed-batch and controlled inoculation ratios of strains promote the successional colonization of bioreactors. a. Two adjustments to the fermentation strategy were compared: using either a batch or a fed-batch setup over 48 h with two different inoculation ratios, ‘equal volumes’ (EV; black lines) or ‘controlled ratio’ (CR+batch, green lines; CR+fed-batch, Orange lines). Batch fermentation was inoculated at 0.33% v/v and fed-batch bioreactors at 0.66% v/v to balance the doubling of medium during fed-batch fermentation. The volume was doubled by adding fresh medium after 24 h in fed-batch mode. b. The total concentration of metabolites produced, expressed in carbon mol concentration, increases steadily in batch mode with either inoculation ratios (EV: black, CR: green). The vertical dashed line indicates the time of medium refill for the fed-batch setup. Each of the three conditions were run in duplicate. Lines and vertical bars show the mean and spread, respectively. Metabolites were quantified by HPLC-RI analysis. Total carbon production was calculated by summing the C-mol of all measured metabolites. c. We computed the rate of carbon extraction as the empirical difference of the C-mol concentration during the last measurement period and expressed per unit time (hour, h). The lines show the mean of, and the vertical segments show the spread between the duplicates. d. Intermediate (formate, lactate) and end (acetate, butyrate, propionate) metabolites are dynamic during the 48 h fermentation. Each line shows the mean of, and the vertical segments the spread between the duplicates. e. The growth of the nine strains differed between the strategies. Cell counts were determined by qPCR, whereby each time point was measured in triplicate. The lines show the median and the vertical segments show the min and max of the triplicate. The measured gene counts are normalized by the 16S rRNA gene copy number of each strain. Rb: R. bromii; Ba: B. adolescentis; Ca: C. aerofaciens; Lr: L. rhamnosus; Fp: F. prausnitzii; Al: A. lactatifermentans; El: E. limosum; Pf: P. faecium; Bh: B. hydrogenotrophica.
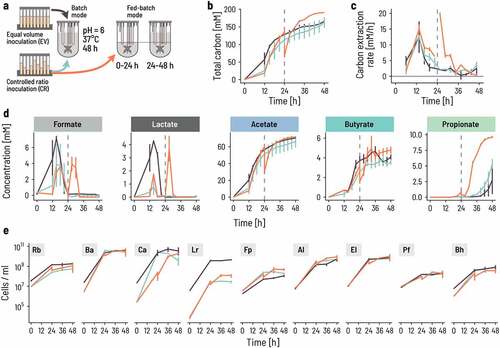
Despite a rapid initial increase in metabolic activity observed at 12 h, carbon conversion of the co-culture was not complete by 48 h (). We computed the total concentration of measured metabolites (formate, lactate, succinate, acetate, butyrate, propionate) expressed in molar concentration of carbon as a marker of overall consortium activity. The total metabolite production rate (carbon conversion rate) was maximal after 12 h reaching 12 mM/h (), mainly because of the production of acetate, lactate, and formate (), in line with the dominant metabolic activity of fast-growing primary degraders. After the initial spike of formate and lactate, their concentrations dropped to zero, suggesting a delayed onset of growth and activity of secondary degraders and the successful establishment of the full metabolic cascade. No intermediate product accumulation was measured later than 24 h despite a continuing increase in the concentration of acetate, butyrate, and propionate, while the final main metabolites, acetate, propionate, and butyrate were produced, indicating that the consortium metabolism was controlled by primary degraders. The metabolite production rate remained positive at 48 h, implying that the co-culture was not able to fully convert the available energy in the fermentation medium (). Most bacterial growth occurred in the first 24 h for all strains, with only limited additional growth between 24 and 48 h measured for secondary degraders (E. limosum, P. faecium, B. hydrogenotrophica) ().
To accelerate the establishment of an equilibrated co-culture, we adjusted the inoculation ratios to limit the growth of fast-growing primary degraders and promote the growth of slow-growing secondary degraders (). The resulting ‘controlled strain ratios’ (CR) were based on the natural abundance in the specific host microbiota from which we isolated six of the nine strains (Supplementary Table S2). Additionally, we diluted L. rhamnosus 10-fold and increased E. limosum, P. faecium, and A. lactatifermentans roughly five-fold compared to the determined abundances in the donor (Supplementary Table S2).
Inoculating at CR and fermenting in batch mode for 48 h did not improve the co-culture efficiency and resulted in similar overall activity profiles (). The adjusted inoculation ratios were successful in reducing the cell numbers of the dominant R. bromii and L. rhamnosus 10- and 100-fold throughout the batch incubation, respectively. However, this did not largely impact the growth of the other strains after 24 h (). In particular, we did not observe any benefit for the secondary degraders after 48 h. This suggested that while setting a cap on the starting inoculation levels of fast growers such as L. rhamnosus can reduce their early dominance, adjusting the inoculation ratios alone is not sufficient to boost growth and activity of the secondary degraders. We thus implemented a two-step fed-batch mode to limit the growth of primary degraders and further support secondary degraders. We started the co-culture with half the volume of the fermentation medium and supplied the second half after 24 h.
The fed-batch strategy was successful at enabling the growth of secondary degraders and therefore promoting trophic succession. The overall behavior of the co-culture in terms of metabolite profile and strain composition was practically identical to the CR batch culture until 24 h, implying that the reduction in fermentation volume over the first 24 h had little effect despite a two-fold increase in inoculum based on starting medium volume. Adding the remaining culture medium at 24 h brought an additional boost to activity and growth. The carbon conversion rate spiked immediately after feeding and subsequently tapered off to zero by 48 h (). Adding the fed-batch step thus enabled the co-culture to rapidly and completely metabolize the available carbon in the medium and reach an overall plateau (). A ‘second phase’ growth was visible in all primary degraders, including a large boost for F. prausnitzii. This strain reached almost two-fold higher cell numbers in CR fed-batch mode than in regular batch mode. The growth of the secondary degraders was also enhanced immediately after feeding. This was especially apparent for A. lactatifermentans and P. faecium, which showed strong growth after 24 h and an overall stronger production of propionate. Thus, the two-stage fed-batch mode allowed the slower growing secondary degraders to catch up with the fast growers during the first stage and enabled the co-culture to enter the second stage in a more synchronized manner.
Continuous co-cultivation of the consortium results in stable strain ratios, with high cell yields and end metabolite production
The differences in outcome between the inoculation strategies imply an important influence of initial conditions on co-culture dynamics and activity. Nevertheless, we hypothesized that if all strains were retained during the initial phase, then the trophic interactions would dictate the final composition of the culture and lead to a specific equilibrium. To determine whether such a stable compositional equilibrium exists and what its strain composition is, we switched the fermentation to a continuous mode after the initial 48-h fed-batch mode. We chose a high mean retention time of 50 h (D = 0.02/h) to mimic a slow transit in the human colon and to limit washout of slow growers. We measured the metabolite profile every 24 h for 2 weeks and quantified the community composition on a subset of days (). To test whether different inoculum ratios lead to the same or alternative compositional equilibria throughout the continuous fermentation period, we inoculated the batches using both CR and EV.
Figure 3. Continuous co-cultivation directs the consortium into a characteristic metabolic and compositional equilibrium. a. Four bioreactors were inoculated at 0.66% v/v at either equal volumes (blue lines) or controlled ratios (Orange lines). Fed-batch fermentation was carried out for the first 48 h, whereby the fermentation volume was doubled after 24 h of fermentation by adding fresh PBMF009 medium. After 48 h, the system was set to continuous mode. Fermentation conditions were chosen to reflect conditions of the human colon, at 37°C, pH 6.0 and a mean retention time of 50 h, or D = 0.02/h (see Methods for details). b,c. The concentration of metabolites changes over the course of the experiment. The lines show the mean and the error bars the range between the duplicates. d. The strain composition at sampling points throughout the experiment evolves from the inoculum composition to a common equilibrium composition (dashed circle). Principal components (PC) are computed from the center log-ratio transformed relative cell concentrations. The circles show the endpoint of the fermentation, and the black and yellow background corresponds to the fed-batch and continuous phase, respectively. e. Cell concentrations for each of the nine strains are dynamic through time. Each sampling point is the median of three technical qPCR replicates and the error bars show the minimum and maximum measurements.
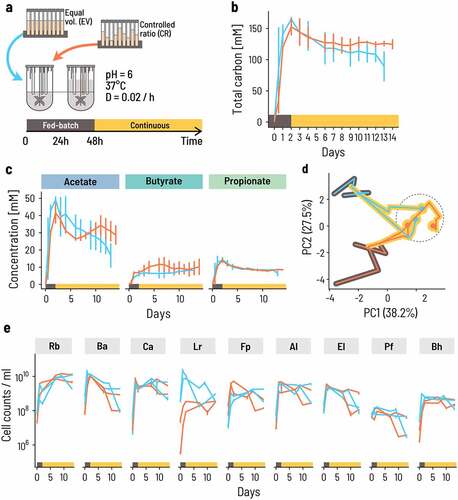
The overall metabolic activity was maintained at high levels after switching from fed-batch to continuous mode. The total carbon concentration in the measured metabolites decreased slightly from almost 150 mM to around 130 mM after changing the operation mode and approached an apparent stable level after approximately 10 d for the CR inoculum (). The relative contribution of acetate, butyrate, and propionate to the total metabolites varied between replicate reactors during the fed-batch phase, but eventually converged to a common composition with 56% acetate, 24% butyrate, and 20% propionate on average (). Propionate levels were extremely consistent and approached a mean of 8 mM across all four reactors. Acetate and butyrate levels were more variable. In all reactors, acetate was highest at the end of the fed-batch phase and decreased during the continuous phase, while butyrate levels were maintained or even increased with opposite trends to acetate. This is consistent with the notion that acetate is both a general marker for metabolic activity and an intermediate compound in butyrate production. Acetate and butyrate levels were relatively stable after 5 d in the CR reactors, but the acetate level continued to decrease after day 5 for the EV reactors, implying that the CR inoculum enabled the consortium to approach its metabolic equilibrium more rapidly. During this phase, butyrate and acetate concentrations were strongly anticorrelated (Pearson’s r = – 0.83, p = .00485 and r = – 0.81, p = .00113, respectively), suggesting that this fluctuation arises from the conversion of acetate into butyrate.
In all four CR and EV bioreactors, all nine strains persisted during continuous planktonic fermentation, although their relative abundance changed after switching from fed-batch to continuous mode. The initial reactor compositions were different because of the different inoculation strategies but converged to a common state on day 13 (, Supplementary Table S6). At the end of the fed-batch phase, the dominant primary degraders shifted from B. adolescentis and C. aerofaciens – and L. rhamnosus in the case of EV – to R. bromii that comprised 65% and 50% of the consortium at the end of the experiment for CR and EV, respectively (, Supplementary Table S6). L. rhamnosus initially differed between CR and EV but converged to a common equilibrium level in CR and EV (3.45 · 108 and 6.35 · 108 cells/ml, respectively). All other strains had dynamics that did not strongly differ between CR and EV.
These data suggest that the combination of trophic design principles for co-cultures and the optimization of process conditions gives rise to a stable, reproducible consortium both in terms of metabolic output and composition. To validate this reproducibility, we performed four additional repetitions of the fed-batch and continuous fermentation processes with CR for extended periods of up to 92 d (Supplementary Figure S4). Despite early transient differences, the composition of the community consistently reached a state of equilibrium after ca. 10 d of continuous cultivation.
To test to what degree the observed metabolic activity and strain dynamics were specific to the actual selected strains, we assembled an equivalent consortium with the same taxonomic species, but different strains obtained from DSMZ/ATCC, called PB002-ATCC (Supplementary Table S7) and repeated the fed-batch/continuous cultivation in triplicate with PB002-ATCC. The strain abundances and metabolite concentrations approached identical values as for PB002 (Supplementary Figure S5). Note that while the PB002-ATCC strains have the same taxonomic assignment as the PB002 strains, there were important genome-wide differences with average nucleotide identities between the corresponding strains ranging from 99.7% down to 79.5% (Supplementary Table S7). We therefore suggest that this state of equilibrium is primarily intrinsic to the trophic structure of the consortium in the context of the biotechnological cultivation process, and only in a second step dependent on the specific choice of strain.
The consortium state at the end of co-cultivation is not recapitulated by a mix of strains at the same ratios
We next assessed whether the PB002 consortium at equilibrium has phenotypic characteristics beyond the equilibrium ratios of the nine strains. Because of the trophic interactions that underlie the consortium’s bottom-up design, we hypothesized that the stable co-existence of all nine strains implies a physiological synchronicity between them. If this were the case, merely mixing the strains together at equilibrium ratios would not mimic this synchronization of the strains. To test this hypothesis, we performed batch fermentation in serum bottles and compared the regrowth of the CC to individually grown single strains mixed at the same strain ratio. To produce the two different inocula, the strains were cultured either individually in Hungate tubes in their preferred growth medium or co-cultured in a bioreactor until the previously defined equilibrium state was reached. The individually cultured strains were mixed to match the absolute abundance of the CC at equilibrium to form an ‘artificial mixture’ (AM). Batch fermentation was performed in triplicate for 48 h using 3x buffered PBMF009 medium. We measured the consortium composition by qPCR and the metabolites by HPLC-RI every 12 h ().
Figure 4. The onset of growth and activity occurs sooner for the consortium than a mix of strains. a. We compared the growth and metabolic activity of the co-cultured consortium to that of a mix of the same nine strains pooled together to imitate the cell counts of the individual strains at equilibrium. Strict anaerobic serum flasks containing PBMF010 medium were inoculated with either a consortium sample from the continuous fermentation, or an ‘Artificial Mix (AM)’ of single strains at the same ratios as in the continuous fermentation. b-d. Metabolite concentrations in terms of mol of carbon were measured during 48 h. e. Cell counts of each of the nine strains were measured using qPCR.
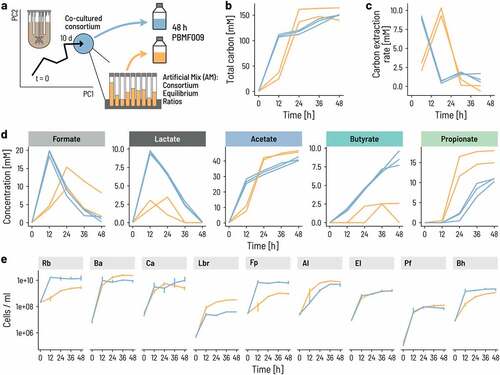
The CC cultures were already metabolically active with an early peak of overall carbon conversion rate between 0 and 12 h, whereas peak conversion for AM occurred between 12 and 24 h (). The activity of AM slightly surpassed the consortium at 24 h, mostly because of increased acetate production likely by the fast-growing primary degraders (). Formate and lactate concentrations were higher in the CC than the AM after 12 h, with higher butyrate production in the CC samples throughout the fermentation. In contrast, higher propionate levels in the AM suggested that the absence of lactate buildup in these samples was likely due to a rapid conversion of lactate into propionate. These metabolic patterns were consistent with strong differences in strain growth between the CC and the AM. Most strikingly, those strains for which we observed a ‘conditioning’ during the continuous fermentation such as R. bromii and F. prausnitzii grew without delay in the CC samples but not in the AM samples (). In addition, the previously observed fast growers L. rhamnosus, B. adolescentis, and C. aerofaciens were dampened in the CC versus the AM. These results confirm our hypothesis that the physiological state of the individual strains at co-culture equilibrium is adapted to the ‘consortium state’ and cannot be replicated by merely mixing the strains at the equivalent ratios.
The PB002 consortium promotes recovery from acute DSS colitis in mice as efficiently as FMT
We postulated that the same kind of ‘physiological conditioning’ of the strains through co-cultivation would occur during ‘natural co-cultivation’ in the human intestine. We thus hypothesized that a co-culture of PB002 would better match the therapeutic effects of FMT than a mix of individually cultivated strains. We tested this through two independent experiments using the acute DSS-induced colitis mouse model (). Specifically, we compared treatment with our CC to FMT with feces from one of the healthy human donors from which one of the strains was isolated (see Supplementary Table S2). To tease apart the effect of co-culturing from the individual strains or the produced metabolites only, we also treated mice with a mix of individually cultured consortium strains (SM), the conditioned medium harvested from the continuous fermentation (CM), and phosphate-buffered saline as a control (PBS). The relative proportions of the strains in CC, SM, and FMT are given in Supplementary Table S6 and Supplementary Figure S6.
Figure 5. PB002 accelerates recovery after DSS-induced colitis in mice. a. Acute colitis was induced in female C57BL/6 mice by supplementing the drinking water with DSS for 7 d (from day 1 to day 8). At day 8, mice were switched back to normal drinking water. Mice were treated once a day by 200 μL oral gavage on days 8, 9, and 10 with the co-cultured consortium (CC, blue), the non-co-cultivated strain mix (SM, Orange), the conditioned medium from the continuous fermentation (CM, green), or with FMT from a healthy human donor (FMT, brown). The control group was given normal water throughout the whole experiment (H2O, gray), and the DSS control group was gavaged with phosphate-buffered saline (DSS, red). Mice were euthanized at day 16. N = 4 to 5 per group. b. Mice treated with CC or FMT regained body weight more rapidly than mice that received the other treatments. Error bars are the standard errors. c. Area under the curve (AUC) of the daily relative body weight for each mouse. Only CC-treated mice had an AUC that was significantly lower than the DSS control mice (linear model, beta = – 0.65, p = .030). The error bars show the confidence interval for the mean. d. Representative light micrographs of large intestine sections at the time of euthanasia (H&E staining, 10 X magnification). CC and FMT showed structural recovery of the epithelium comparable to the control group. Mice that received CM, SM, or PBS showed a substantial degradation and inflammation of the cecal epithelium. e. Histological assessment of the epithelial damage and infiltration in the distal colon. Treatment with CC and FMT showed reduced epithelial damage and infiltration compared to PBS (linear model, p < 10−Citation4 for all marked comparisons).
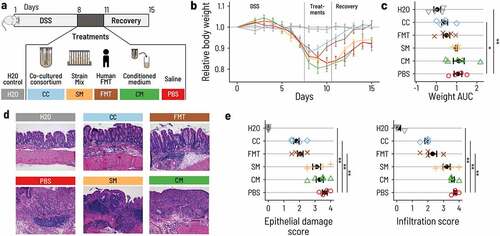
A drastic body weight loss was observed in all DSS-treated mice. Animals treated with the CC or FMT regained weight by day 10 and fully reached their initial body weight by day 14. The average area under the curve (AUC) of body weight was 0.41 for CC, 0.50 for FMT, 0.99 for SM, 1.11 for CM, and 1.07 for PBS. Body weight recovery was thus much faster in mice that received CC or FMT compared to mice that received PBS, SM, or CM, in which body weight only increased after day 12 (). Overall, mice that received the CC lost significantly less body weight throughout the experiment than PBS treated mice (, Supplementary Table S8). To test whether the CC induced amelioration in body weight recovery was associated with reduced epithelial damage and immune cell infiltration, we assessed epithelial damage and infiltration in the large intestine by histology. Mice treated with PBS, CM, or SM showed a disruption of the epithelium and clear signs of infiltration (, Supplementary Table S9, S10). In contrast, CC- or FMT-treated animals showed milder epithelial damage and infiltration, closer to the H2O group that did not receive DSS than to the PBS group. This supports our hypothesis that CC and FMT alleviated intestinal injury from DSS (; Supplementary Table S9, S10). The mice treated with the CC and FMT also had reduced shortening of the colon and a less pronounced increase in spleen weight when compared to the other DSS treated animals (Supplementary Figure S7, Supplementary Tables S11, S12). These results were confirmed in an independent repetition of the experiment (Supplementary Figure S8, Supplementary Tables S13-S17) and suggest that only the CC matched the beneficial effect of FMT on the DSS-induced disease.
The trophic approach to consortium design is validated for two additional consortia
The design approach outlined here is not specific to the consortium PB002 architecture. To support the versatility of our consortium approach, we tested several consortium backbones by substituting strains and removing/adding functions. The consortia follow the same conceptual blueprint as shown in , but we added succinate production (A6) that was not previously included in PB002 and omitted redundancies like C. aerofaciens with respect to B. adolescentis (). After screening bacterial isolates for the desired functions, we formulated two consortia, Q1 and Q2, that differed between each other only in the strain covering function A6, where Q1 contained Bacteroides xylanisolvens and Q2 contained Prevotella copri thus covering the two main enterotypes of human intestinal microbiota.Citation44,Citation45
Both Q1 and Q2 converged to a metabolic state with no measurable concentration of formate, lactate, and succinate during continuous co-cultivation, as expected (Supplementary Figure S9). We inoculated duplicate bioreactors each for Q1 and Q2, operated first in fed-batch mode followed by continuous mode as for PB002 (pH = 6.0, D = 0.02/h). Formate and lactate accumulated during the fed-batch phase, with a peak at 24 h. At 24 h, average formate concentrations across the duplicates reached 1.7 and 4.0 mM and lactate concentrations reached 4.8 and 3.1 mM for Q1 and Q2, respectively. Concentrations of intermediate metabolites fell to and remained at zero from day 3 onwards during the continuous phase (Supplementary Figure S9). All strains persisted during 15 d of continuous co-cultivation and achieved a metabolic equilibrium as observed with PB002.
Discussion
Functionally designed microbial consortia are being heralded as a safer next generation of microbiome-based therapeutics to replace fecal transplants or feces-based products.Citation13 Yet so far only few approaches to rational consortium design based on function have been reported,Citation46–48 and to our best knowledge, a solution to the biotechnological problem of producing consortia that capture the key properties of fecal transplants in a scalable, robust, and cost-efficient manner has remained elusive. Our bottom-up ecological approach to consortium design is based on metabolic trophic interactions between the constituent bacteria. These metabolic dependencies allow for stable co-cultures that can overcome some of the current technological and translational challenges of producing consortium LBPs.
On the technological side, co-culturing enabled the in vitro growth of typically hard-to-culture strains at yields that are relevant for production. Determining the right conditions (medium, pH, incubation time, etc.) to cultivate many intestinal bacteria in the laboratory is a challenge in itself,Citation18,Citation49 and the amount of resources required to further optimize the conditions to achieve acceptable yields are often prohibitive for production at scale. This includes complex medium optimizations that need to be GMP-compliant. Our function-based design approach produces consortia that can grow and stably coexist over extended periods of time under common cultivation conditions and reduced complexity medium composition. This is different from alternative approaches that focus on complex medium optimization to achieve coexistence of consortia and tune the strain composition.Citation50 In our approach, coexistence is achieved in a simple culture medium as a result of the ecological design of the consortia, and a stable equilibrium composition emerges intrinsically from the trophic interactions. This greatly streamlines any downstream optimization when moving from lab-scale to production-scale.
The biomass yields of individual strains are up to 10-fold higher in co-culture than monocultures in the conditions tested here (). This suggests the occurrence of niche construction within the consortium that intrinsically optimizes energy extraction from the primary substrates.Citation51–53 Importantly, the co-culture equilibrium state is defined by more than just specific relative ratios of the strains, but also a ‘primed’ metabolic state. Hence, the co-cultured consortium more rapidly initiates activity and growth after inoculation compared to mixing strains together, even after controlling for inoculation ratios. Ultimately, this leads to better energetic yields and shorter process durations.
Finally, producing consortia using co-culturing requires only one single biotechnological production process. In contrast, when strains are produced in monoculture and subsequently mixed, increasing the number of strains to tens or even hundredsCitation48,Citation54,Citation55 implies an increase in the required production equipment and infrastructure that is directly proportional to the number of strains. Co-culturing offers an elegant solution to this problem that is largely independent of the number of strains in the LBP when the consortium is designed according to trophic interactions. In summary, co-culturing a trophically interacting consortium has the potential to both simplify technological translation and achieve high biomass yields of controlled composition.
On the translational side, co-culturing also better represents the in situ growth environment than individual monocultures. Both bacterial growth and bacterial metabolic activity depend on the environmental context, with respect to abiotic parameters such as temperature, pH, redox, and growth substrate, as well as biotic parameters like competitive or positive interactions with coexisting strains.Citation56 Our results show that co-culturing preconditions the strains for rapid and balanced growth. In contrast, mixes of individually cultured strains have long lag phases while they adapt to new culture conditions. This is especially important when considering microbiome interventions in patients, where the processes of bacterial growth and washout due to transit contribute to the success or failure of bacterial engraftment. While no in vitro growth environment will fully capture all the intricacies of the human intestine, integrating part of the bacterial biotic environment into the production environment can better prime the consortium for growth after administration.
Our study puts forward a blueprint for the bottom-up design and subsequent production of defined consortia as LBPs to replace FMT, where the core functionality based on trophic carbohydrate fermentation is conserved, and specific microbiome modulations can be fine-tuned by the specific choice of strains in each functional role. Because our design approach is built around a stable functional scaffold, we envisage that auxiliary functions might be added on to the scaffold to support their delivery in different diseases. We have applied this blueprint successfully for the design and production of additional consortia (Supplementary Figure S9), suggesting a broad applicability of our approach.
In this study, we have demonstrated the potential of this approach using one specific selection of strains for the different functional roles in the trophic fermentation network. Because our approach is based on function rather than taxonomy, we posit that strains that perform the same functional role are typically interchangeable with respect to the main overall functional objective of complete anaerobic carbon fermentation. This notion is supported by our results with the ATCC/DSMZ strain replacements and the two other presented consortia, and we have continued to apply this approach to the design and production of over 20 different consortia. Nevertheless, exchanging strains may impact the specific compositional equilibrium and metabolic output, as well as traits that are not directly related to carbon fermentation, such as oxygen stress tolerance or antibiotic resistance.Citation52
In the PB002 consortium, some functional roles are covered by more than one strain, and some strains perform more than one role in a sort of ‘functional pleiotropy’. The former case results in some functional redundancy, while the latter creates some collateral dependence between functions. Functional redundancy has been repeatedly hypothesized to provide stability to microbiome function in the wake of unpredictable and changing environments.Citation16 Here, we did not actively consider redundancy when selecting strains, but given that most strains can exert more than one function, some redundancy naturally emerges. Follow-up studies are underway to investigate whether equivalent consortia with either more or less redundancy have better or worse stability properties.
Other approaches to consortium design have also been proposed. These often start with a selection of many strains that span the typical taxonomic diversity, which is subsequently refined to lower complexity using criteria on the individual strain level – such as the ability to be cultured in vitro – or on the community level – such as taxonomic representativeness,Citation57 genomic potential,Citation58 or overall diversity.Citation50 These approaches implicitly assume that by simply incorporating representative strains or achieving diversity is sufficient to elicit a therapeutic effect without mechanistic insight.Citation59 The power of our bottom-up functional approach is that consortium design starts with the target mechanism and builds up the consortium surrounding this mechanism. Here, the target is full carbohydrate fermentation but this may be expanded to the cross-feeding of other macroelements (e.g., proteins, peptides, and amino acids) or micronutrients (e.g., vitamins). In particular, the secondary consumers are often subdominant in healthy microbiomes compared to primary degraders and hence are not typically included when the criteria are representativeness and diversity.
Our approach to developing LBPs is based on a combination of ecological and biotechnological perspectives. On the ecological side, strain selection incorporates the metabolic dependencies required for a consortium-level functional output. Here, the explicit measurements of the metabolic activities in vitro are essential, as genome-based in silico methods may not predict their actual metabolic capabilities as observed in our study. On the biotechnological side, continuous co-cultivation is the mere in vitro equivalent of growth in the intestine, incorporating flow, and abiotic and biotic environments. This resulted in a synthetic LBP that was able to match the therapeutic effect of FMT in an acute DSS model of colitis in mice, while a simple mix of the same strains was not. This implies that the production process imparts properties onto the consortium in a product-by-process manner. We expect that the co-cultivation of consortia will provide an efficient and highly controlled solution for LBP production adapted to GMP conditions after the optimization of biotic and abiotic conditions. Based on our results, we believe that our approach will support the evolution of the next generation of microbiome products.
Methods
Strain isolations
Bacterial strains were isolated from healthy donors using strict anaerobic Hungate techniques and characterized for growth and metabolite production on M2GSC Medium (ATCC Medium 2857) and modifications thereof whereby the carbon sources glucose, cellobiose, and starch were replaced by specific substrates including intermediate metabolites and fibers found in the human intestine (M2RS, resistant starch; M2LT, lactate; M2FO, formate; M2SU, succinate). To isolate the maximal diversity, fresh fecal samples of healthy donors were processed within 2 h after expulsion. Dilutions of fresh fecal matter were inoculated into different media and incubated for 24 h at 37°C under anaerobic conditions. Enrichment tubes with visible growth were analyzed by HPLC-RI. Clusters of functional microbial groups were formed based on combinations of substrate-utilization and metabolite-production from which isolates were chosen for subsequent characterization. Isolates were taxonomically annotated based on 16S Sanger sequencing.
Six of the nine strains in PB002 were isolated from the same donor. L. rhamnosus and R. bromii were isolated on M2RS, B. adolescentis and C. aerofaciens were isolated on M2FO, F. prausnitzii were isolated on M2LT, and P. faecium was isolated on M2SU. E. limosum and A. lactatifermentans were isolated on M2LT from two different donors.
Assignment of essential reactions and strain selection
We assigned the essential metabolic reactions to a panel of intestinal bacterial strains. We measured their metabolic activity by cultivation on five different media: (1) yeast extract, casitone, fatty acids medium (YCFA); (2) glucose, soluble starch, cellobiose medium (M2GSC); (3–5) variants of M2GSC, where the ‘GSC’ carbon sources were exchanged with the intermediate metabolites lactate (M2LT), formate (M2FO), and succinate (M2SU), respectively. Cultivation was strictly anaerobic in Hungate tubes. We assigned reactions A1-A6 to the strains based on media 1 and 2, and the reactions B1-B5 based on growth in media 3–5 (Supplementary Table S18). Growth was assessed after 48 h on media 1 and 2 and after 48 h and 7 d on media 3–5 to account for typically slow utilization rates for intermediate metabolites.
The YCFA and M2GSC media were prepared as described in the references.Citation60,Citation61 M2SU, M2LT, and M2FO contained 80 mM of sodium succinate (SU), 50 mM of DL-lactate (LT), or 60 mM of formate (FO), respectively. All media components were supplied by Sigma-Aldrich (Buchs, Switzerland) unless otherwise noted. We further supplemented the media with a redox potential indicator (resazurin, 1 mg/L). Liquid media were boiled, flushed with 100% O2-free CO2, dispensed into CO2-flushed Hungate tubes, sealed with butyl rubber septa (Bellco Glass, Vineland, USA), and autoclaved before use.
For the cultivation of pre-cultures, 0.5 mL of cryopreserved isolates (1 mL of 48-h-old culture mixed with 1 mL of respective fresh medium containing 60% of glycerol, stored at – 80°C) were inoculated in Hungate tubes containing 8 mL of the respective preferred growth medium of the strain (see Supplementary Table S18). Optical density measurements (Biochrom WPA CO8000 Biowave Personal Cell Density Meter, Labgene Scientific SA, Chatel-St-Denis, Switzerland) confirmed growth. Subsequently, 0.1 mL of 48 h-old single cultures were used to inoculate 8 mL of each of the five cultivation media in duplicate. To assign the respective A or B reactions, consumption and/or production of fatty acids was measured using high-pressure liquid chromatography with refractive index (HPLC-RI).
Literature data on hydrogen utilization or oxygen tolerability were used to assign C-reactions to the strains, whereby oxygen reduction was assigned to strains reported to grow under aerobic or microaerophilic conditions and hydrogen consumption to acetogenic or methanogenic gut bacteria.Citation41–43
Preparation of single strains for inoculation
For the inoculation of bioreactors, strain pre-cultures were grown as described above. Equal volume inocula were produced by mixing 0.5 mL of each of the pre-cultures. ‘Controlled ratios’ were chosen to mimic the natural abundance of the respective genera in the host-microbiota from which seven out of the nine strains were isolated. To additionally improve the competitiveness of slow-growers and prevent growth inhibition through inhibitory concentrations of intermediate metabolites, the ratio of fast-growing primary degrader L. rhamnosus was diluted 10-fold, and the ratios of secondary degraders P. faecium, E. limosum, and A. lactatifermentans were increased 5-fold compared to their relative abundance in the donor profile. The final concentrations are listed in Supplementary Table S2.
Co-culture fermentation media
We designed a growth medium – PBMF009 – based on YCFA and M2GSC and adapted it to contain complex carbohydrates but a minimal amount of animal-derived ingredients (Supplementary Table S4). We did not include meat extract or rumen fluid. The carbon sources consisted of cellobiose (1.5 g/L), Fibrulose F97 (1 g/L; Cosucra-Group Warcoing SA, Warcoing, Belgium), soluble potato starch (1.5 g/L) and resistant pea starch N-735 (2 g/L; Roquette Frères, Lestrem, France). For Hungate tube and serum flask experiments, we additionally buffered 3x to prevent rapid acidification of the culture (3xb PBMF009, Supplementary Table S4). Fermentation with Q1 and Q2 were performed with PBMF010 culture medium that is identical to PBMF009 with the exception of resistant pea starch replaced with Nutriose® (2 g/L, Roquette Frères, Lestrem, France).
Hungate tube cultivations
For individual strain cultures and co-cultures, we took 0.1 mL of 48-h-old single cultures or 0.1 mL of a mix of ‘equal volumes’ of all nine strains, respectively, and inoculated Hungate tubes containing 8 mL of 3xb PBMF009 medium. The tubes were then incubated for 48 h at 37°C. We confirmed growth with optical density, measured metabolites with HPLC-RI, and quantified growth with qPCR at times t = 0 and t = 48 h. We performed three independent biological replicates of the cultivations with three technical replicates per condition.
Bioreactor cultivations
Controlled fermentation was carried out in 0.3 L (Sixfors) or 1 L (Multifors) flat bottom glass bioreactors (Infors AG, Bottmingen, Switzerland) or 0.5 L Sartorius qPlus microbial version bioreactors (Sartorius AG, Göttingen, Germany). To maintain anaerobiosis, bioreactors were continuously flushed with CO2. The redox potential was monitored using EASYFERMPLUS ORP ARC probes (Hamilton, Bonaduz, Switzerland) and the supplier’s software HDM (Version 1.0; Hamilton). Medium feed, temperature, pH, stirring speed, and base consumption were monitored throughout the fermentation using the supplier’s software IRIS V5 (Version: 5; Infors AG), or DCU (Sartorius AG). pH was maintained by the automatic addition of 2.5 M NaOH.
Batch fermentation bioreactors were inoculated at 0.33% v/v and fed-batch fermentation bioreactors at 0.66% v/v of the initial medium volume corresponding to 0.33% inoculation on the final volume of the fed-batch fermentation. Fermentation conditions were chosen to reflect conditions of the human colon and prevent a possible washout of slow growing strains, at 37°C, pH = 6.0, and a mean retention time of 50 h (D = 0.02 h−Citation1). The bioreactors were initialized with either batch or fed-batch mode for the first 48 h. In fed-batch mode, the first half of the fermentation medium was added at t = 0 and the second half was added at t = 24 h of fermentation. After 48 h, bioreactors were set to continuous mode. Bioreactor effluent samples were taken daily unless otherwise noted, and strain composition was measured using qPCR and metabolites by HPLC-RI.
Fermentation of Q1 and Q2 in PBMF010 medium were carried out in 0.5 L Sartorius qPlus microbial version bioreactors, in duplicates. The bioreactors were operated for a total of 17 d following the procedure described for PB002. Strains were inoculated at equal proportions while increasing the cell concentrations of putative secondary degraders 10-fold based on cell concentrations determined by flow cytometry.
Reactivation in serum flasks
To assess whether the metabolic and compositional balance of the continuously co-cultured nine strain mix persists after a reactivation step, we performed a batch fermentation experiment in serum flasks and compared the regrowth of the CC with a mixture of individually grown single strains after inoculation. To produce the two different inocula, strains were either cultured individually in Hungate tubes for 48 h in their preferred growth medium (Supplementary Table S18) or as a co-culture in a controlled-ratio/fed-batch/continuous bioreactor as described in the previous section. On day 10 of co-cultivation, when equilibrium was reached, we determined the abundance of each strain by qPCR. At the same time, viable cells in the Hungate tube cultures were measured by flow cytometry using a live/dead staining approach (see protocol below). All measurements were performed in triplicate. For inoculation of the serum flasks, the individually cultured strains were mixed to match the absolute abundance of strains in the co-culture from the bioreactor. Batch fermentation was inoculated in triplicate with 0.1 mL of either of the two inocula in 10 mL of 3xb PBMF009 medium and were incubated and shaken (120 rpm, Celltron, Infors AG) at 37°C for 48 h. We measured growth by optical density and pH, consortium composition by qPCR, and metabolites by HPLC-RI every 12 h.
DNA extraction
DNA extraction of samples was performed according to an adapted version of the ‘DNA purification from human feces using the Maxwell® RSC instrument and the Maxwell® RSC PureFood GMO and Authentication Kit’ developed by Promega (Promega Corporation, Dübendorf, Switzerland). Instead of using 250 mg of fecal matter for the extraction process, we directly added 1 mL of CTAB Buffer to the pellet of a 1 mL liquid culture. After heating the samples for 5 min at 95°C we transferred the liquid to a 2 mL Lysis Matrix E tube (MP Biomedicals, Lucerne, Switzerland) and bead beated 2-times for 40 s at 6 m/s using a FastPrep™ 24 5 G Bead Beating System (MP Biomedicals). After the bead beating step, we centrifuged the samples at RT for 10 min at 14ʹ000 g and transferred the supernatant to a new 2 mL Eppendorf tube and proceeded with the supplier’s guidelines.
Strain abundance quantification
Quantitative real-time PCR (qPCR) was performed by using an ABI 7000 Sequence Detection System apparatus with 7000 system software version 1.2.3 (Applied Biosystems) or a magnet induction cycler (MIC) from Biomolecular systems (Labgene Scientific SA). qPCR to enumerate 16S rRNA gene copies was performed by mixing 1 µl of sample genomic DNA with 2x Kapa SYBR Fast qPCR Mastermix (Biolabo Scientific Instruments, Basel, Switzerland) in a total volume of 25 μL.
For PB002 and PB002-ATCC, we used genus-specific primers (Microsynth AG; Balgach, Switzerland) and validated no cross-reactivity on genomic DNA extracts of all other consortium members (Supplementary Table S5). Amplifications were performed with the following temperature profile: 1 cycle at 95°C for 10 min to denature DNA and activate the polymerase, followed by 40 cycles of 95°C for 30 sec, 60°C for 1 min. A dissociation step was added to control the amplification specificity. A melting curve analysis was carried out to ensure the specificity of the amplification products. For quantification, 10-log-fold standard curves ranging from 102 to 107 copies were produced using the full-length amplicons of the purified 16S rRNA gene (pGEM®-T Vector Systems, Promega) of each of the nine PB002 strains to convert the threshold cycle (Ct) values into the average cells of target bacterial genomes present in 1 mL of fermentation effluent. As a negative control water was used. Sample DNA was analyzed in triplicate, and the results were normalized by the number of 16S rRNA copies per strain (for exact numbers, see Supplementary Table S5).
For Q1 and Q2, we determined the relative abundances of each strain using 16S metagenomic sequencing on Nanopore with the Nanopore 16S Barcoding Kit according to the manufacturer’s protocol. We computed absolute abundances by performing qPCR on Lb. rhamnosus and subsequently multiplying the measured cell concentration with the relative ratios of all other strains. Because the primers in the 16S Barcoding Kit do not amplify Bifidobacterium sp.,Citation62 we additionally quantified B. adolescents with qPCR directly.
Whole genome sequencing of strains
High molecular weight DNA was extracted using the Wizard® Genomic DNA Purification Kit (Promega). The high molecular weight DNA was sent to the Functional Genomic Center Zurich (FGCZ, Zurich, Switzerland) for PacBio Sequel SMRT Cell sequencing. Additionally, high-quality DNA was sent to FGCZ for library prep using the 2 × 150 bp True Seq kit and Illumina MiSeq Sequencing. For the assembly, PacBio long reads were assembled using Flye 2.4.4.Citation63 This assembly was used in the hybrid assembly with the Illumina short reads using Unicycler 0.4.4.Citation64 The resulting assembly was annotated using Prokka 1.13.3.Citation65 We predicted the metabolic activities of the whole genomes with gutSMASH.Citation66
Metabolic analysis using HPLC-RI
The concentrations of SCFAs (propionate, acetate, butyrate) and intermediate metabolites (formate, lactate, succinate) were measured using HPLC-RI. Cultures of 1 mL or 100 mg of mouse cecal content homogenized in 600 μL of HPLC eluent were centrifuged (14,000 g, 10 min, 4°C) and subsequently filtered into 1.5 mL short thread vials with crimp caps (VWR International GmbH, Schlieren, Switzerland) using 0.2 µm regenerated cellulose membrane filters (Phenomenex Inc., Aschaffenburg, Germany). Analyses were performed with a VWR Hitachi Chromaster 5450 RI-Detector using a Rezex ROA-Organic Acid (4%) precolumn connected to a Rezex ROA-Organic Acid (8%) column, equipped with a Security Guard Carbo-H cartridge (4 × 3.0 mm). Volumes of 40 μL were injected into the HPLC with a flow rate of 0.6 mL/min at a constant column temperature of 80°C using a mixture of H2SO4 (10 mM) and Na-azide (0.05 g/L) as an eluent. Concentrations were determined using external standards by comparing the retention time (all compounds were purchased from Sigma-Aldrich). Peaks were integrated using the EZChromElite software (Version V3.3.2.SP2, Hitachi High Tech Science Corporation). The limit of detection was defined as >0.8 mM for succinate, lactate, and acetate or >0.5 mM for all other SCFAs.
Viability measurement using live/dead staining
We measured the viability of the individually cultivated strains after 48 h of incubation with flow cytometry. A double-staining assay with the two nucleic acid dyes SYBR Green (SG) and propidium iodide (PI) was used to differentiate between cells with intact and damaged cytoplasmic membranes, as described by Van Nevel et al. (2013).Citation67 Samples were diluted 100-fold with filtered (0.20 μm) PBS to get an appropriate bacterial concentration for flow cytometry. Samples of 30 μL were stained either with 3 μL of SG (10 μL of SG stock solution from Life Technologies Europe BV, Zug, Switzerland, in 990 μL dimethylsulfoxide) or 3 μL of SG combined with PI (SGPI) (10 μL of SYBR Green stock solution and 20 μL of PI stock solution 20 mM from Life Technologies Europe BV, in 970 μL dimethylsulfoxide) and mixed by vortexing. Samples were stained for 20 min at RT protected from light. To determine bacterial cell numbers, 30 μL of Flow-CountTM fluorosphere beads (Beckman Coulter, Nyon, Switzerland) at known concentrations were added to 30 μL of the diluted samples. Before measuring, the samples were again mixed by vortexing. Each sample was diluted, stained, and measured in triplicate. Each replicate was stained twice, once with SG only for total cell count, and once with SGPI for differentiating viable and dead cells. SGPI stained samples were always measured first to limit aerobic conditions and avoid false PI-positive results because of cells dying during the incubation period.
Dextran sulfate sodium-induced acute colitis mouse model
To assess the effect of PB002 administration on recovery from intestinal inflammation, an acute DSS-induced colitis mouse model was used. Female C57BL/6 J mice were purchased from Janvier Labs (Le Genest-Saint-Isle, France). Upon arrival at the animal facility of the University Hospital Zurich, the mice were acclimatized for 2 weeks before the start of the experiment. All mice were housed in a barrier-protected specific pathogen-free unit in individually ventilated cages, with a 12:12-h light/dark cycle and an artificial light of approximately 40 Lux in the cage. The animals were kept under controlled humidity (45–55%) and temperature (21 ± 1°C). Mice had access to sterilized drinking water and to pelleted and extruded regular mouse chow (diet 3436, Kliba Nafag, Switzerland) ad libitum. Mice with a body weight between 20 g and 23 g were used for all experiments. 3% DSS (MP Biomedicals, Carlsbad, CA) was added to the drinking water for 7 d (day 1 until day 8 of the experiment) to induce acute colitis. On day 8, the DSS-containing water was replaced with normal water, and mice were randomly allocated to control and experimental groups to obtain groups with equal body weight at the treatment start. Each treatment group consisted of 4–5 mice. The control (sterile PBS) and treatment substances were administered daily per oral gavage (200 µL) on days 8, 9, and 10. The treatment substances were prepared as follows:
The strain mix was prepared akin to the ‘controlled ratio’ inoculum. ‘Conditioned medium’ consisted of the centrifuged (10,000 g, 10 min, 4°C) and subsequently filtered (0.45 µm Nylon filter) supernatant of the CC after 8 d of continuous co-cultivation from a ‘controlled ratio’ inoculation taken from the same bioreactor, and at the same time as for ‘PB002’. To produce ‘human FMT’, a fecal suspension was prepared by adding 100 g fecal sample of a healthy male donor (approved by the Ethical Commission of Zurich, Switzerland; Kantonale Ethikkomission Zürich, BASEC-Nr. 2017–01290) to 500 mL sterile saline. The suspension was homogenized in a blender for 2 min. Particles were then allowed to sediment for 20 sec. The particulate material was removed by passing the slurry through a sterile gauze. The slurry was centrifuged (6,000 g, 15 min, 4°C), and the supernatant was subsequently removed. The pellets were resuspended in 15.3 mL sterile saline and filtered with a Falcon Cell Strainer 100 µm Nylon Filter (VWR, Dietikon, Switzerland) to remove particles. Glycerol was added to reach a final concentration of 10% (as specified by Youngster et al.Citation68). The FMT samples were frozen at – 80°C and thawed on ice 1 h before use. The strain composition of the CC, SM, and FMT was determined using 16S amplicon sequencing of the V4 region on the Illumina MiSeq platform. Amplicon Sequence Variants (ASV) were inferred with dada2Citation69 and taxonomically assigned based on GTDB r95.Citation70
Body weight was monitored daily, and mice were euthanized on day 16 to collect colon and spleen specimens, which served as a proxy for colitis severity. Moreover, bacterial metabolites of cecal content were analyzed using HPLC-RI. Animal experiments were carried out according to Swiss animal welfare laws and were approved by the veterinary authorities of Zurich, Switzerland (Veterinäramt des Kantons Zürich, approval no. ZH255/2014 and ZH171/2017).
Hematoxylin and eosin staining and histological assessment of colitis severity
Formalin-fixed, paraffin-embedded samples of the most distal 1.5 cm of the colon and the distal part of the cecum were cut into 5 µm sections, and stained with hematoxylin and eosin (H&E) according to standard procedures. In brief, formalin-fixed, paraffin-embedded tissue samples were deparaffinized in HistoClear for 2 × 10 min, followed by incubation in a descending ethanol series (100%, 96%, 70% ethanol). Samples were briefly incubated in double-distilled H2O prior to incubation in hematoxylin for 10 minutes and subsequently rinsed with tap water before differentiation in a solution consisting of 20% HCl and 80% ethanol for twice 1 s. Samples were then rinsed for 10 min with tap water and incubated for 15 s in a 1% eosin solution. Samples were dehydrated in an ascending ethanol series, incubated in HistoClear, and finally mounted. The slides were analyzed using an AxioCam HRc (Zeiss, Jena, Germany) on a Zeiss Axio Imager.Z2 microscope (Zeiss) and images captured using the AxioVision Release 4.8.2 software (Zeiss). For colitis severity assessment, the following scores were applied: scores for epithelial damage: 0, normal morphology; 1, loss of goblet cells; 2, loss of goblet cells in large areas; 3, loss of crypts; and 4, loss of crypts in large areas. Scores for infiltration: 0, no infiltrate; 1, infiltrate around the crypt base; 2, infiltrate reaching to L. muscularis mucosae; 3, extensive infiltration reaching the L. muscularis and thickening of the mucosa with abundant edema; and 4, infiltration of the L. submucosae. The total histological score represents the sum of the scores for epithelial damage and infiltration. Scoring activities were performed in a blinded manner.
Statistical analysis
Graphing and statistical analysis were performed in R version 4.0.2.Citation71 qPCR data were normalized by dividing by the number of 16S rRNA gene copies per strain. Principal component analysis (PCA) was performed on the relative abundances of the consortium strains after a center log-ratio transformation. The correlation between metabolites was computed as the Pearson correlation between the individual metabolite time series. Mouse weights were normalized by their weight at day 0. The area under the curve (AUC) was computed as the sum of relative mouse weights throughout the experiment. Comparisons of readouts between mouse treatment groups were done using a linear model with the PBS group as the intercept.
Data availability
All data analyzed during this study are included in this published article and its supplementary information files, and deposited in the ETH Research Collection (20.500.11850/576817).
Author contributions
F.K., L.A., M.R.S., G.R., C.L., and T.W. conceptualized the project. F.K., G.E.L., F.R., M.R.S., G.R., C.L., T.W., planned the experiments. F.K, L.A., F.R., and T.W. developed methods. M.R.S. planned and performed mouse experiments. F.K. and L.A. assisted with mouse experiments. F.K, C.M., M.R., and M.R.S. performed analyses. G.E.L. and P.R.v.B. analyzed and curated data. M.M. contributed to choosing the primers for the strains and developed software used in parts of the analysis. T.W., C.L., and G.E.L. supervised the work. F.K., G.E.L., C.L., and T.W. wrote the original draft. All authors reviewed and edited the manuscript.
Supplemental Material
Download Zip (1.9 MB)Acknowledgments
We thank Christophe Chassard for support with the strain selection.
Disclosure statement
F.K., G.E.L., L.A., P.R.v.B., C.M., M.M., F.R., M.R., and T.W. are or were employees of PharmaBiome. T.W., G.R., and C.L. are founders of PharmaBiome. F.K., L.A., M.M., M.R. and F.R. are co-founders of PharmaBiome. F.K., L.A., G.R., M.R.S., C.L., M.M., F.R., and T.W. are inventors on patent application number WO2018189284, entitled ‘Consortia of living bacteria useful for treatment of microbiome dysbiosis’. F.K., C.L., F.R., and T.W. are inventors on patent application WO2020079026, entitled ‘A method of manufacturing a consortium of bacterial strains’. PharmaBiome provided financial support.
Supplementary material
Supplemental data for this article can be accessed online at https://doi.org/10.1080/19490976.2023.2177486
Additional information
Funding
References
- Cani PD. Human gut microbiome: hopes, threats and promises. Gut. 2018;67:1716–22. doi:10.1136/gutjnl-2018-316723.
- Schmidt TSB, Raes J, Bork P. The human gut microbiome: from association to modulation. Cell. 2018;172:1198–1215. doi:10.1016/j.cell.2018.02.044.
- Hadrich D. Microbiome research is becoming the key to better understanding health and nutrition. Front Genet. 2018;9. doi:10.3389/fgene.2018.00212.
- Shreiner AB, Kao JY, Young VB. The gut microbiome in health and in disease. Curr Opin Gastroenterol. 2015;31:69–75. doi:10.1097/MOG.0000000000000139.
- Verbeke F, Janssens Y, Wynendaele E, de Spiegeleer B. Faecal microbiota transplantation: a regulatory hurdle? BMC Gastroenterol. 2017;17. doi:10.1186/s12876-017-0687-5.
- Gianotti RJ, Moss AC. Fecal microbiota transplantation: from clostridium difficile to inflammatory bowel disease. Gastroenterol Hepatol (N Y). 2017;13:209–213.
- Shi YC, Yang YS. Fecal microbiota transplantation: current status and challenges in China. JGH Open. 2018;2:114–116. doi:10.1002/jgh3.12071.
- Ianiro G, Bibbò S, Scaldaferri F, Gasbarrini A, Cammarota G. Fecal microbiota transplantation in inflammatory bowel disease: beyond the excitement. Medicine. 2014;93:e97.
- Moayyedi P, Surette MG, Kim PT, Libertucci J, Wolfe M, Onischi C, Armstrong D, Marshall JK, Kassam Z, Reinisch W, et al. Fecal microbiota transplantation induces remission in patients with active ulcerative colitis in a randomized controlled trial. Gastroenterology. 2015;149(1):102–109. doi:10.1053/j.gastro.2015.04.001.
- Paramsothy S, Kamm MA, Kaakoush NO, Walsh AJ, van den Bogaerde J, Samuel D, Leong RWL, Connor S, Ng W, Paramsothy R, et al. Multidonor intensive faecal microbiota transplantation for active ulcerative colitis: a randomised placebo-controlled trial. Lancet. 2017;389(10075):1218–1228. doi:10.1016/S0140-6736(17)30182-4.
- Rossen NG, MacDonald JK., de Vries EM., D’Haens GR, de Vos WM, Zoetendal EG, Ponsioen CY. Fecal microbiota transplantation as novel therapy in gastroenterology: a systematic review. World J Gastroenterol. 2015;21:5359–5371. doi:10.3748/wjg.v21.i17.5359.
- Wang S, Xu M, Wang W, Cao X, Piao M, Khan S, Yan F, Cao H, Wang B. Systematic review: adverse events of fecal microbiota transplantation. PLoS ONE. 2016;11(8):e0161174. doi:10.1371/journal.pone.0161174.
- O’Toole PW, Marchesi JR, Hill C. Next-generation probiotics: the spectrum from probiotics to live biotherapeutics. Nat Microbiol. 2017;2(5):17057. doi:10.1038/nmicrobiol.2017.57.
- Olle B. Medicines from microbiota. Nat Biotechnol. 2013;31:309–315. doi:10.1038/nbt.2548.
- Lozupone CA, Stombaugh JI, Gordon JI, Jansson JK, Knight R. Diversity, stability and resilience of the human gut microbiota. Nature. 2012;489:220–230. doi:10.1038/nature11550.
- Louca S, Polz MF, Mazel F, Albright MBN, Huber JA, O’Connor MI, Ackermann M, Hahn AS, Srivastava DS, Crowe SA, et al. Function and functional redundancy in microbial systems. Nat Ecol Evolut. 2018;2(6):936–943. doi:10.1038/s41559-018-0519-1.
- Grosskopf T, Soyer OS. Synthetic microbial communities. Curr Opin Microbiol. 2014;18:72–77. doi:10.1016/j.mib.2014.02.002.
- Nayfach S, Shi ZJ, Seshadri R, Pollard KS, Kyrpides NC. New insights from uncultivated genomes of the global human gut microbiome. Nature. 2019;568:505–510. doi:10.1038/s41586-019-1058-x.
- Lindemann SR, Bernstein HC, Song H-S, Fredrickson JK, Fields MW, Shou W, Johnson DR, Beliaev AS. Engineering microbial consortia for controllable outputs. ISME J. 2016;10(9):2077–2084. doi:10.1038/ismej.2016.26.
- Roell GW, Zha J, Carr RR, Koffas MA, Fong SS, Tang YJ. Engineering microbial consortia by division of labor. Microb Cell Fact. 2019;18(1):1–11. doi:10.1186/s12934-019-1083-3.
- Jia X, Liu C, Song H, Ding M, Du J, Ma Q, Yuan Y. Design, analysis and application of synthetic microbial consortia. Synth Syst Biotechnol. 2016;1(2):109–117. doi:10.1016/j.synbio.2016.02.001.
- Shou W, Ram S, Vilar JMG. Synthetic cooperation in engineered yeast populations. Proc Natl Acad Sci U S A. 2007;104:1877–1882. doi:10.1073/pnas.0610575104.
- Ben SS, Or D. Synthetic microbial ecology: engineering habitats for modular consortia. Front Microbiol. 2017;8:1125. doi:10.3389/fmicb.2017.01125.
- Pan J, Ma J, Wu H, Chen B, He M, Liao C, Wei C. Application of metabolic division of labor in simultaneous removal of nitrogen and thiocyanate from wastewater. Water Res. 2019;150:216–224. doi:10.1016/j.watres.2018.11.070.
- He Q, Hemme CL, Jiang H, He Z, Zhou J. Mechanisms of enhanced cellulosic bioethanol fermentation by co-cultivation of Clostridium and Thermoanaerobacter spp. Bioresour Technol. 2011;102:9586–9592. doi:10.1016/j.biortech.2011.07.098.
- Wang Z, Cao G, Zheng J, Fu D, Song J, Zhang J, Zhao L, Yang Q. Developing a mesophilic co-culture for direct conversion of cellulose to butanol in consolidated bioprocess. Biotechnol Biofuels. 2015;8(1):84. doi:10.1186/s13068-015-0266-3.
- Minty JJ, Singer ME, Scholz SA, Bae C-H, Ahn J-H, Foster CE, Liao JC, Lin XN. Design and characterization of synthetic fungal-bacterial consortia for direct production of isobutanol from cellulosic biomass. Proc Natl Acad Sci U S A. 2013;110(36):14592–14597. doi:10.1073/pnas.1218447110.
- Smid EJ, Lacroix C. Microbe-microbe interactions in mixed culture food fermentations. Curr Opin Biotechnol. 2013;24:148–154. doi:10.1016/j.copbio.2012.11.007.
- The Human Microbiome Project Consortium et al. Structure, function and diversity of the healthy human microbiome. Nature. 2012;486:207–214. doi:10.1038/nature11234.
- Chassard C, Lacroix C. Carbohydrates and the human gut microbiota. Curr Opin Clin Nutr Metab Care. 2013;16:453–460. doi:10.1097/MCO.0b013e3283619e63.
- El Kaoutari A, Armougom F, Gordon JI, Raoult D, Henrissat B. The abundance and variety of carbohydrate-active enzymes in the human gut microbiota. Nat Rev Microbiol. 2013;11(7):497–504. doi:10.1038/nrmicro3050.
- Franzosa EA, Sirota-Madi A, Avila-Pacheco J, Fornelos N, Haiser HJ, Reinker S, Vatanen T, Hall AB, Mallick H, McIver LJ, et al. Gut microbiome structure and metabolic activity in inflammatory bowel disease. Nat Microbiol. 2019;4(2):293–305. doi:10.1038/s41564-018-0306-4.
- Fernández-Veledo S, Vendrell J. Gut microbiota-derived succinate: friend or foe in human metabolic diseases? Rev Endocr Metab Disord. 2019;20:439–447. doi:10.1007/s11154-019-09513-z.
- Connors J, Dawe N, Van Limbergen J. The role of succinate in the regulation of intestinal inflammation. Nutrients. 2019;11:25. doi:10.3390/nu11010025.
- Flint HJ, Duncan SH, Scott KP, Louis P. Links between diet, gut microbiota composition and gut metabolism. Proce Nutr Soc. 2015;74:13–22. doi:10.1017/S0029665114001463.
- Oliphant K, Allen-Vercoe E. Macronutrient metabolism by the human gut microbiome: major fermentation by-products and their impact on host health. Microbiome. 2019;7:1–15. doi:10.1186/s40168-019-0704-8.
- Staff B. Com. Medical gallery of blausen medical 2014. Wiki J Med. 2014;1(2). doi:10.15347/wjm/2014.010.
- Wang SP, Rubio LA, Duncan SH, Donachie GE, Holtrop G, Lo G, Farquharson FM, Wagner J, Parkhill J, Louis P, et al. Pivotal roles for pH, lactate, and lactate-utilizing bacteria in the stability of a human colonic microbial ecosystem. mSystems. 2020;5(5). doi:10.1128/mSystems.00645-20.
- Pham VT, Lacroix C, Braegger CP, Chassard C. Lactate-utilizing community is associated with gut microbiota dysbiosis in colicky infants. Sci Rep. 2017;7:1–13. doi:10.1038/s41598-017-11509-1.
- Smith NW, Shorten PR, Altermann EH, Roy NC, McNabb WC. Hydrogen cross-feeders of the human gastrointestinal tract. Gut Microbes. 2019;10:270–288. doi:10.1080/19490976.2018.1546522.
- Chassard C, Scott KP, Marquet P, Martin JC, Del’homme C, Dapoigny M, Flint HJ, Bernalier-Donadille A. Assessment of metabolic diversity within the intestinal microbiota from healthy humans using combined molecular and cultural approaches. FEMS Microbiol Ecol. 2008;66(3):496–504. doi:10.1111/j.1574-6941.2008.00595.x.
- Diekert G, Wohlfarth G. Metabolism of homoacetogens. Antonie van Leeuwenhoek. 1994;66:209–221. doi:10.1007/BF00871640.
- Ragsdale SW, Pierce E. Acetogenesis and the Wood-Ljungdahl pathway of CO2 fixation. Biochimica et Biophysica Acta. 2008;1784:1873–1898.
- Arumugam M, Raes J, Pelletier E, Le Paslier D, Yamada T, Mende DR, Fernandes GR, Tap J, Bruls T, Batto J-M, et al. Enterotypes of the human gut microbiome. Nature. 2011;473(7346):174–180. doi:10.1038/nature09944.
- Costea PI, Hildebrand F, Arumugam M, Bäckhed F, Blaser MJ, Bushman FD, De vos WM, Ehrlich S, Fraser CM, Hattori M, et al. Enterotypes in the landscape of gut microbial community composition. Nat Microbiol. 2017;3(1):8–16. doi:10.1038/s41564-017-0072-8.
- Pereira FC, Wasmund K, Cobankovic I, Jehmlich N, Herbold CW, Lee KS, Sziranyi B, Vesely C, Decker T, Stocker R, et al. Rational design of a microbial consortium of mucosal sugar utilizers reduces Clostridiodes difficile colonization. Nat Commun. 2020;11(1):1–15. doi:10.1038/s41467-020-18928-1.
- Stein RR, Tanoue T, Szabady RL, Bhattarai SK, Olle B, Norman JM, Suda W, Oshima K, Hattori M, Gerber GK, et al. Computer-guided design of optimal microbial consortia for immune system modulation. eLife. 2018;7. doi:10.7554/eLife.30916.
- van der Lelie D, Oka A, Taghavi S, Umeno J, Fan T-J, Merrell KE, Watson SD, Ouellette L, Liu B, Awoniyi M, et al. Rationally designed bacterial consortia to treat chronic immune-mediated colitis and restore intestinal homeostasis. Nat Commun. 2021;12(1):1–17. doi:10.1038/s41467-021-23460-x.
- Lagkouvardos I, Overmann J, Clavel T. Cultured microbes represent a substantial fraction of the human and mouse gut microbiota. Gut Microbes. 2017;8:493–503. doi:10.1080/19490976.2017.1320468.
- Connors BM, Ertmer S, Clark RL., Thompson J, Pfleger BF, Venturelli OS. Model-guided design of the diversity of a synthetic human gut community. bioRxiv. 2022;2022. doi:10.1101/2022.03.14.484355.
- San Roman M, Wagner A. An enormous potential for niche construction through bacterial cross-feeding in a homogeneous environment. PLoS Comput Biol. 2018;14(7):e1006340. doi:10.1371/journal.pcbi.1006340.
- Gralka M, Szabo R, Stocker R, Cordero OX. Trophic interactions and the drivers of microbial community assembly. Curr Biol. 2020;30:R1176–R1188. doi:10.1016/j.cub.2020.08.007.
- Estrela S, Diaz-Colunga J, Vila JCC, Sanchez-Gorostiaga A, Sanchez A. Diversity begets diversity under microbial niche construction. bioRxiv. 2022:2022. doi:10.1101/2022.02.13.480281.
- Cheng AG, Ho PY, Jain S, Meng X, Wang M, Yu FB, Iakiviak M, Brumbaugh AR, Nagashima K, Zhao A, Patil A. In vivo augmentation of a complex gut bacterial community. bioRxiv. 2021;2021. doi:10.1101/2021.06.15.448620.
- Dsouza M, Menon R, Crossette E, Bhattarai SK, Schneider J, Kim Y-G, Reddy S, Caballero S, Felix C, Cornacchione L, et al. Colonization of the live biotherapeutic product VE303 and modulation of the microbiota and metabolites in healthy volunteers. Cell Host Microbe. 2022;30:583–598.e8. doi:10.1016/j.chom.2022.03.016.
- Coyte KZ, Rakoff-Nahoum S. Understanding Competition and Cooperation within the Mammalian Gut Microbiome. Curr Biol. 2019;29:R538–R544. doi:10.1016/j.cub.2019.04.017.
- Darnaud M, De Vadder F, Bogeat P, Boucinha L, Bulteau A-L, Bunescu A, Couturier C, Delgado A, Dugua H, Elie C, et al. A standardized gnotobiotic mouse model harboring a minimal 15-member mouse gut microbiota recapitulates SOPF/SPF phenotypes. Nat Commun. 2021;12(1):1–21. doi:10.1038/s41467-021-26963-9.
- Brugiroux S, Beutler M, Pfann C, Garzetti D, Ruscheweyh HJ, Ring D, Diehl M, Herp S, Lötscher Y, Hussain S, Bunk B. Genome-guided design of a defined mouse microbiota that confers colonization resistance against Salmonella enterica serovar Typhimurium. Nat Microbiol. 2016;2:16215. doi:10.1038/nmicrobiol.2016.215.
- Fischbach MA. Microbiome: focus on causation and mechanism. Cell. 2018;174:785–790. doi:10.1016/j.cell.2018.07.038.
- Duncan SH, Hold GL, Barcenilla A, Stewart CS, Flint HJ. Roseburia intestinalis sp. nov., a novel saccharolytic, butyrate-producing bacterium from human faeces. Int J Syst Evol Microbiol. 2002;52:1615–1620. doi:10.1099/00207713-52-5-1615.
- Miyazaki K, Martin JC, Marinsek-Logar R, Flint HJ. Degradation and utilization of xylans by the rumen anaerobe Prevotella bryantii (formerly P. ruminicola subsp. brevis) B14. Anaerobe. 1997;3:373–381. doi:10.1006/anae.1997.0125.
- Matsuo Y, Komiya S, Yasumizu Y, Yasuoka Y, Mizushima K, Takagi T, Kryukov K, Fukuda A, Morimoto Y, Naito Y, et al. Full-length 16S rRNA gene amplicon analysis of human gut microbiota using MinIONTM nanopore sequencing confers species-level resolution. BMC Microbiol. 2021;21:1–13. doi:10.1186/s12866-021-02094-5.
- Kolmogorov M, Yuan J, Lin Y, Pevzner PA. Assembly of long, error-prone reads using repeat graphs. Nat Biotechnol. 2019;37:540–546. doi:10.1038/s41587-019-0072-8.
- Wick RR, Judd LM, Gorrie CL, Holt KE. Unicycler: resolving bacterial genome assemblies from short and long sequencing reads. PLoS Comput Biol. 2017;13:e1005595. doi:10.1371/journal.pcbi.1005595.
- Prokka: ST. Rapid prokaryotic genome annotation. Bioinformatics. 2014;30:2068–2069. doi:10.1093/bioinformatics/btu153.
- Pascal Andreu V, Augustijn HE., Chen L, Zhernakova A, Fu J, Fischbach MA, Dodd D, Medema MH. A systematic analysis of metabolic pathways in the human gut microbiota. bioRxiv. 2021;2021. doi:10.1101/2021.02.25.432841.
- Van Nevel S, Koetzsch S, Weilenmann HU, Boon N, Hammes F. Routine bacterial analysis with automated flow cytometry. J Microbiol Methods. 2013;94:73–76. doi:10.1016/j.mimet.2013.05.007.
- Youngster I, Sauk J, Pindar C, Wilson RG., Kaplan JL., Smith MB., Alm EJ., Gevers D, Russell GH, Hohmann EL. Fecal microbiota transplant for relapsing clostridium difficile infection using a frozen inoculum from unrelated donors: a randomized, open-label, controlled pilot study. Clin Infect Dis. 2014;58:1515–1522.
- Callahan BJ, McMurdie PJ, Rosen MJ, Han AW, Johnson AJA, Holmes SP. DADA2: high-resolution sample inference from Illumina amplicon data. Nat Methods. 2016;13(7):581–583. doi:10.1038/nmeth.3869.
- Parks DH, Chuvochina M, Chaumeil PA., Rinke C, Mussig AJ, Hugenholtz P. A complete domain-to-species taxonomy for Bacteria and Archaea. Nat Biotechnol. 2020;38:1079–1086.
- Team RC. A language and environment for statistical computing. Vienna (Austria): R Foundation for Statistical Computing; 2020.