
ABSTRACT
The gut microbiota evolves rapidly after birth, responding dynamically to environmental factors and playing a key role in short- and long-term health. Lifestyle and rurality have been shown to contribute to differences in the gut microbiome, including Bifidobacterium levels, between infants. We studied the composition, function and variability of the gut microbiomes of 6- to 11-month-old Kenyan infants (n = 105). Shotgun metagenomics showed Bifidobacterium longum to be the dominant species. A pangenomic analysis of B. longum in gut metagenomes revealed a high prevalence of B. longum subsp. infantis (B. infantis) in Kenyan infants (80%), and possible co-existence of this subspecies with B. longum subsp. longum. Stratification of the gut microbiome into community (GMC) types revealed differences in composition and functional features. GMC types with a higher prevalence of B. infantis and abundance of B. breve also had a lower pH and a lower abundance of genes encoding pathogenic features. An analysis of human milk oligosaccharides (HMOs) classified the human milk (HM) samples into four groups defined on the basis of secretor and Lewis polymorphisms revealed a higher prevalence of HM group III (Se+, Le-) (22%) than in most previously studied populations, with an enrichment in 2′-fucosyllactose. Our results show that the gut microbiome of partially breastfed Kenyan infants over the age of six months is enriched in bacteria from the Bifidobacterium community, including B. infantis, and that the high prevalence of a specific HM group may indicate a specific HMO-gut microbiome association. This study sheds light on gut microbiome variation in an understudied population with limited exposure to modern microbiome-altering factors.
Introduction
The gut microbiota evolves rapidly after birth in response to host and environmental factors. Its composition and function affect short- and long-term health.Citation1 Increasing numbers of studies monitoring the dynamics of gut microbiota establishment and maturation during the first few years of life and their effects on health and disease across populations are revealing both common global patterns of gut microbiota development,Citation2,Citation3 and distinctive features.Citation4,Citation5 The gut microbiome of infants living in rural areas and with low rates of immune disorders has consistently been shown to be enriched in Bifidobacterium, and, specifically, in B. longum subsp. infantis (B. infantis)Citation6–10 relative to that of infants living in more urbanized or industrial settings.Citation8,Citation10–12 These findings were recently borne out by a global meta-analysis of 1900 fecal samples from healthy infants from 18 populations with different lifestyles.Citation13 There are growing clinical evidence to support an association between low levels of Bifidobacterium and the prevalence of chronic and autoimmune diseases (reviewed by)Citation14 and systemic inflammation.Citation15 In resource-poor countries, infants are exposed to different environmental factors, the rate of vaginal delivery is higher and infants are breastfed for longer periods. Human milk (HM) has multiple nutritional and immunological benefits and is associated with both short- and long-term health benefits, and with a lower risk of developing several chronic diseases later in life (reviewed by).Citation16 HM contains various bioactive compounds, including secretory IgA, antimicrobial factors, and human milk oligosaccharides (HMOs), which can be metabolized by various gut bacteria, including Bifidobacterium in particular (reviewed by).Citation17 The HMO profile of HM is highly variable and affected by multiple factors, including geographic location, lactation stage, and genetics.Citation18 Genetic factors make the largest contribution to the high variability of HMO profile, which depends on the maternal Secretor (Se) and Lewis (Le) genes. Mothers with a functional α-1-2-fucosyltransferase (FUT2) are described as having the secretor phenotype. They produce milk that contains HMOs, with residual amounts of α-1-2-fucose (reviewed elsewhere).Citation19,Citation20 Most mothers in diverse populations have the secretor phenotype.Citation21 The reported association between secretor status and the infant gut microbiome varies between studies.Citation22–28 Mothers with a functional α1-3/4-fucosyltransferase gene (FUT3) are referred to as “Lewis-positive”.Citation18 FUT2/FUT3 polymorphisms result in four different milk groups: HM group I (Se+,Le+), HM group II (Se–, Le+), HM group III (Se+, Le–), and HM group IV (Se–, Le–), with HM groups I and II typically accounting for > 80% of mothers across different populations (reviewed by).Citation29 However, fewer studies have investigated FUT2/FUT3 polymorphism and its association with the gut microbiome in African populations.Citation28,Citation30 Previous studies have shown that the gut microbiota of Kenyan infants breastfed for six to nine months and given supplementary food is dominated by Bifidobacterium.Citation28,Citation31,Citation32 However, the taxonomic resolution of these studies was limited, and no functional assessment of the gut microbiome was performed. We conducted a single-blind randomized study in infants from rural Kenya, to evaluate the effects on iron absorption, inflammation and fecal microbiota composition of an iron-fortified wheat-based cereal (NCT03894358) containing two different doses of a prebiotic mixture including short chain galacto-oligosaccharides (GOS) and long chain fructo-oligosaccharides (FOS) (9:1 ratio). Here, we describe the use of shotgun metagenomics to assess the variability of the gut microbiome at baseline in a subset of these Kenyan infants (105 infants, 6 to 11 months postpartum).
Results
Gut microbiome of infants from rural Kenya
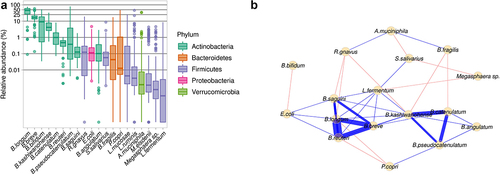
We included 105 infants aged 8.31 ± 1.38 months (mean ± SD) and with a weight-for-age z-score of −0.43 ± 1.23 in this study. All infants received complementary foods (starting at the age of 5.72 ± 1.05 months), mostly in the form of maize porridge, and 104 infants were still partially breastfed at the time of the study. The gut microbiome was profiled by shotgun metagenomics, its composition was determined, and a functional analysis was performed (Figure S1). Species-level analysis showed that B. longum was the most abundant species (42.67 ± 20.10%), followed by B. breve (17.30 ± 8.52%), B. bifidum (12.82 ± 13.09%), and B. kashiwanohense (5.94 ± 5.02%) ( and Table S1). Network analysis was performed by CLR normalization and SparCC correlation based on the 20 most abundant species. Two subnetworks (i.e. species highly correlated with each other) of Bifidobacterium species were identified. One subnetwork was based on a positive association between B. kashiwanohense, B. catenulatum, B. pseudocatenulatum, and B. angulatum. The other was based on a positive association between B. breve, B. longum, and B. reuteri. The species with the largest number of connections and associations was B. kashiwanohense, followed by B. longum (). The gut microbiome of partially breastfed infants from rural Kenyan was, thus, enriched in Bifidobacterium, with specific connections between species.
Figure 1. Gut microbiome of the infants from rural Kenya included in the study cohort. A. Abundance of bacterial species in the study cohort. B. Network based on the 20 most abundant species. Blue edges correspond to positive estimated associations; Red edges correspond to negative estimated associations and the thickness of the lines indicates the strength of the correlation between taxa.
Pangenomic analysis of B. longum in the gut microbiome of infants from rural Kenya
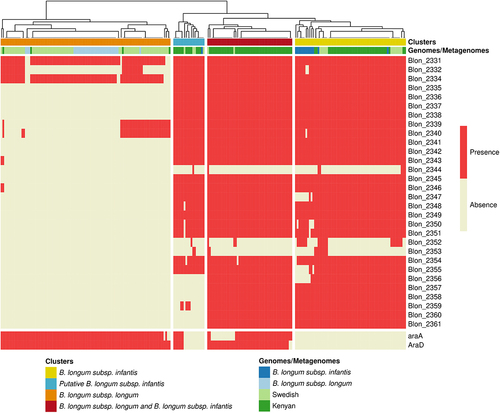
Given the high abundance of the species B. longum in our study cohort, and previous studies showing a high prevalence of B. longum subsp. infantis (B. infantis) in infants from non-industrialized countries,Citation13 we assessed the prevalence of B. infantis in our study cohort. We used a strain-specific metagenomic approach on the pangenome of species B. longum with PanPhlAn ( and Table S2). We focused on a cluster of genes encoding enzymes relating to HMOs import and metabolism (Blon_2331–Blon_2361) that is part of the larger H-1 cluster shown to be conserved in B. infantis genomesCitation33 and two genes encoding proteins involved in arabinose consumption (araA and araD) used for the identification of B. longum subsp. longum in a previous study.Citation34 Most of B. infantis genomes harbored almost all the genes from the HMO cluster. The araA and araD genes were detected in all the B. longum subsp. longum genomes and none of the B. infantis genomes included in the study. We then compared the metagenomes from our study cohort with 98 metagenomes from four-month-old infants from a Swedish cohortCitation35 (). In this Swedish cohort, 85% of infants were vaginally delivered and 68.8% of infants were exclusively breast-fed, 19.8% mixed fed, and 11.4% exclusively formula fed. B. longum was the major Bifidobacterium species, but its abundance was lower (21.23 ± 24.63%) than that in the infants from rural Kenya. A first set of metagenomic samples (39% from Kenyan infants and 15% from Swedish infants) clustered together with B. infantis genomes with positive detection of the HMO cluster and no detection of araA and araD. This cluster was considered to correspond exclusively to B. infantis. A second set of samples (12% of metagenomes from Kenyan infants and 5% from Swedish infants) displayed partial HMO cluster detection, mostly with an absence of araA and araD, and was considered to be a putative B. infantis group. A third set of samples (46% of Kenyan infants and 2% of Swedish infants) had both a detectable HMO cluster and detectable araA and araD genes, consistent with the co-existence of the two B. longum subspecies, whereas 4% of samples from Kenyan infants and 78% of those from Swedish infants clustered together with B. longum subsp. longum genomes, lacked the HMO cluster and had detectable araA and araD genes. This last cluster was considered to correspond exclusively to B. longum subsp. longum. A previous studies reported a lack of detection of genes Blon 2175_2177 (LNT transporter) in B. infantis from Bangladeshi infants.Citation36 We assessed whether these genes were detected in metagenomes of Kenyan infants. We found that 80% of metagenomes that harbored Blon 2331–2361 had at least two genes of Blon 2175_2177 (Table S2). Overall, our pangenomic analysis, showed that B. infantis was highly prevalent in the gut microbiome of partially breastfed infants from rural Kenya.
Figure 2. Identification of B. longum subsp. longum and B. longum subsp. infantis in metagenomes. Detection of genes related to B. longum subsp infantis (HMO clusters) and B. longum subsp. longum (araD and araA) in metagenomes from rural Kenyan and Swedish infants (dark and light green, respectively) and in reference genomes of B. longum subsp. longum and B. infantis. Clusters indicate the resulting stratification of metagenomes with the exclusive detection of B. infantis (yellow and blue) and B. longum subsp. longum (Orange) or the detection of both B. infantis and B. longum subsp. longum (red); clustering was performed by complete linkage analysis (Euclidean distance).
Gut microbiome community types in infants from rural Kenya
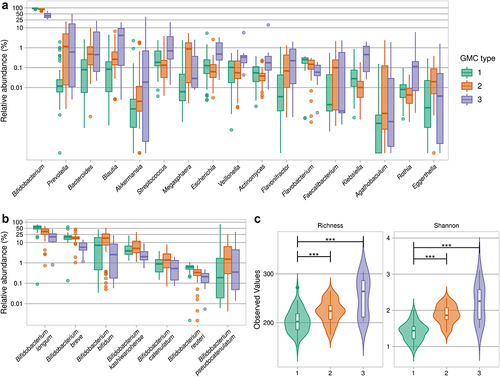
We further explored gut microbiota variation between infants by clustering-based approaches. Dirichlet multinomial mixtures (DMM) based on genus relative abundance, as previously described,Citation37,Citation38 revealed that the infant gut microbiotas could be split optimally into three to four gut microbiome community (GMC) types (Laplace) (Figure S2), three of which were retained for further characterization to increase statistical power. GMC type 1 (50.5% of infants) had the highest levels of Bifidobacterium (Kruskal-Wallis test followed by a post-hoc Dunn test, FDR <0.001) (, Table S1 and Table S3), particularly for B. longum, the abundance of which decreased with increasing GMC type number (53.38 ± 16.10% for GMC type 1, 34.12 ± 17.61% for GMC type 2, and 19.91 ± 12.93% for GMC type 3) (, Table S1). GMC type 2 (40.0% of infants) was also enriched in Bifidobacterium, specifically B. bifidum (Kruskal-Wallis test followed by a post-hoc Dunn test, FDR <0.05), and was the GMC type most enriched in Megasphaera elsdenii (Figure S3A, Table S1 and Table S3). GMC type 3 (9.5% of infants) was the most enriched in various other genera, including those related to Enterobacteriaceae Escherichia and Klebsiella, and had the lowest abundance of Bifidobacterium (44.10 ± 16.09% (Table S1), notably B. breve (Table S3). Alpha-diversity differed between GMC types, with the lowest values obtained for GMC type 1 ().
Figure 3. Gut microbiota community types in infants from rural Kenya. A. Abundances of the highest ranked bacterial genera that were statistically significantly different between the three GMC types. B. Abundance of significant Bifidobacterium species (Kruskal-Wallis test, followed by a post-hoc Dunn test; for details see Table S3 for panels A and B). C. Species-based alpha-diversity (species richness and Shannon index). ***p < .001 (Kruskal-Wallis test, followed by a post-hoc Dunn test).
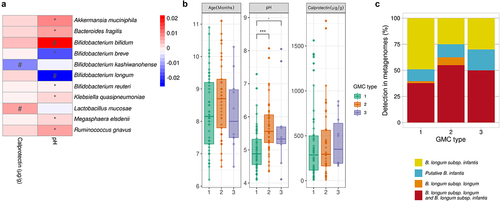
Linear mixed models implemented in MaAsLin2 (adjusted for subject and age) for the relationships between the most abundant bacterial species (accounting for 93.84 ± 6.19% of the gut microbiota) and pH revealed positive correlations for A. muciniphila, B. fragilis, R. gnavus, and Klebsiella quasipneumoniae and a negative correlation for B. breve (FDR <0.1). The abundances of B. longum and B. kashiwanohense were negatively related to pH (p= .06) and calprotectin levels (p= .008) respectively, before but not after FDR adjustment (FDR = 0.14–0.16) ( and Table S4). Fecal pH varied with GMC type (Kruskal-Wallis p< .001) with a lower pH for GMC type 1 (5.01 ± 0.65) than for GMC type 2 (5.70 ± 0.81) and GMC type 3 (5.68 ± 1.24) (p< .001 and p= .05, respectively, in post-hoc Dunn tests) (). Age and calprotectin levels did not differ significantly between GMC types (Kruskal-Wallis p= .17 and 0.62, respectively) (). Given previous reports of the association between low pH and the presence of B. infantis,Citation39 we further investigated whether the detection of the HMO cluster only (B. infantis) differed between the GMC types. We found that GMC type 1, for which the lowest pH values were recorded, had a higher percentage of metagenomes corresponding exclusively to B. infantis (60%) than the other types ().
Figure 4. Association between host microbiota markers and the gut microbiota. A. Heatmap of the model coefficient values resulting from the MaAsLin2 analysis of the top 20 species, fecal calprotectin levels and pH. * indicates FDR<0.1 # indicates p< .1. B. Age, pH and calprotectin level distributions between GMC types (Kruskal-Wallis test, followed by a post-hoc Dunn test). “.”p= .05, *** p < .001. C. Exclusive presence of B. infantis or B. longum subsp. longum or the presence of both species in the three GMC types.
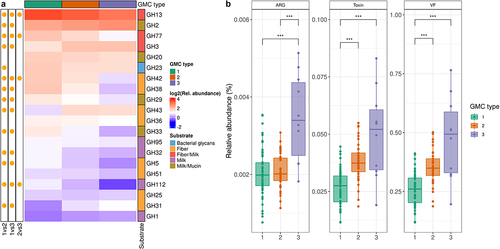
We then assessed the functional differences between the three GMC types. We focused on carbohydrate metabolism, particularly that mediated by glycoside hydrolases (GH), and features relating to pathogen carriage. GH repertoire profiling showed that GH13, GH2, GH77, GH3, and GH20, which target both fiber and milk carbohydrates, were the most abundant in the gut microbiome, regardless of GMC type (, Table S1). Multiple GHs differed in abundance between the three GMC types (, Table S3). Specifically, GMC type 1 differed from the other two types in terms of the abundance of several GHs related to host glycan metabolism: GH29 (fucosidase), GH33 (sialidase), and GH112 (GNB/LNB phosphorylase) (, Figure S3B, and Table S3). We then investigated the differences between GMC types in terms of the abundance of genes encoding pathogenic factors with Pathofact, a pipeline that can predict functions related to pathogens from metagenomic data. We found that the relative abundance of antimicrobial resistance genes, virulence factors, and toxins was higher in GMC type 3 than in the other GMC types (Kruskal-Wallis test, followed by a post-hoc Dunn test, p < .001 (). Overall, our findings reveal differences in both the composition and functional features between community types for the gut microbiomes of infants from rural Kenya.
Figure 5. Functional assessment of gut microbiota in the three GMC types. A. Heatmap of the most abundant glycoside hydrolases (GH). Significance (on the left) of differences between GMC types (log2 of mean relative abundance) (Kruskal-Wallis test, followed by a post-hoc Dunn test; FDR<0.05). GHs are ordered in decreasing abundance. The substrates for GHs were taken from Qin et alCitation40 B. Relative abundances of antimicrobial resistance genes (ARG), toxins and virulence factors (VF), as predicted by PathoFact (* p < .05, ** p < .01, and *** p < .001). Kruskal-Wallis test, followed by a post-hoc Dunn test.
Maternal human milk phenotype and HMO composition
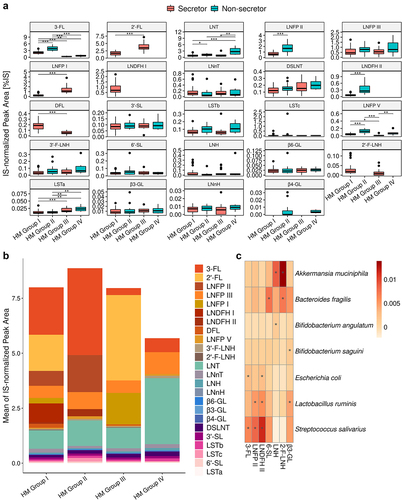
We then investigated the HMO profiles (based on relative abundances) of 90 HM samples. In total, 250 valid peaks (equivalent to at least as many different HMOs) were detected in at least one of the 90 HM samples. We focused on 24 HMOs accounting for about 80% of total HMO content: 2’- fucosyllactose (2’-FL), 3-fucosyllactose (3-FL); 2’- and 3’-fucosyllacto-N-hexaose (2’- and 3’-F-LNH); 3’- and 6’-sialyllactose (3’- and 6’-SL); difucosyllactose (DFL); disialyllacto-N-tetraose (DSLNT); LNFP I, LNFP II, LNFP III, and LNFP V; LNDFH I and LNDFH II; lacto-N-hexaose (LNH); lacto-N-neohexaose (LNnH); lacto-neotetraose (LNnT); lacto-tetraose (LNT); sialyllacto-N-tetraose (LST)a, LSTb, and LSTc; β1-3’-, β1-4’-, and β1-6’-galactosyllactose (β3-, β4-, and β6-GL) (). The least prevalent HMOs were β4-GL (present in 17% of all donors, but in 57% of all secretor-negative HM samples). The abundance of LNDFH II was low in all secretor HM samples with values above the LOQ. Maternal secretor and Lewis (SeLe) phenotype or HM group was assigned based on the presence of specific fucosylated HMOs. HM typing showed that 48.9% of the HM samples corresponded to HM group I (Se+, Le+), 22.2% to HM group II (Se−, Le+), 22.2% to HM group III (Se+, Le−) and 6.7% to HM group IV (Se−, Le−). After grouping by secretor and Lewis status, 71% of the mothers were found to be secretors (HM groups I and III) and 29% were non-secretors (HM groups II and IV). Similarly, 71% of the mothers were Lewis-positive (HM groups I and II) and 29% were Lewis-negative (HM groups III and IV); the prevalence of Lewis positivity was higher in this population than in a European population studied in more detail.Citation41 The most abundant HMOs in all 90 HM samples, regardless of Se or Le status, were 3-FL, LNT, and LNFP III. The abundance of 3-FL, LNT, LNFP II, LNFP III, LNFP V, LSTb, and LNDFH II was higher in milk from non-secretors than in milk from secretors (Mann-Whitney test, FDR<0.05) (Figure S4). More detailed studies of the four HM groups showed that 3-FL and LNFP V were more abundant in HM of group II (Se-, Le+), LNFP I and 2’-FL were more abundant in HM of group III (Se+, Le-), and LNT was more abundant in HM of group IV (Se-, Le-) (). Overall, in this cohort of infants with prolonged breastfeeding, the occurrence and abundance of HMOs differed between maternal HM phenotypes.
Figure 6. Abundance of the major HMOs stratified by maternal HM group. A. Boxplot of HMOs ranked in descending order of abundance (Mann-Whitney test, * FDR <0.05, ** FDR <0.01, and *** FDR <0.001). B. Mean proportion of HMOs in the different HM groups. Neutral fucosylated HMOs are shown as an orange-red gradient, neutral non-fucosylated HMOs are shown as a blue-green gradient and sialylated acids are shown as a pink-purple gradient C. Heatmap of MaAsLin2 correlation coefficients for the relationship between HMO abundance and bacterial species. HMOs are shown in descending order of abundance.
Association of HMO profiles and HM groups with the infant gut microbiota
Previous studies have investigated the association between maternal HMOs, HM phenotype and the infant gut microbiota in different populations, and at various stages of lactation. We first investigated the association of individual HMOs with the gut microbiome in a linear mixed model analysis based on the 20 most abundant bacterial species (Table S4). Only positive correlations were retained after FDR adjustment (FDR <0.1) (), with Streptococcus salivarius having the largest number of significant correlations with fucosylated HMOs such as 3-FL, LNFP II, and LNDFH II. We then investigated the association between HM secretor status and the infant gut microbiome. The abundances of multiple bacterial species (including Escherichia coli, Streptococcus salivarius, Bifidobacterium saguini, and Bacteroides thetaiotaomicron) were higher in the gut microbiota of the infants of non-secretor mothers, whereas the gut microbiota of the infants of secretor mothers was enriched in Bifidobacterium pullorum and Clostridium saccharolyticum (Table S5) (DESeq2, FDR<0.05, age as a covariate). No difference in the overall gut microbiota (alpha- and beta-diversity), or in the prevalence of gut microbiota community types was observed (Figure S5 A-C).
Finally, given the higher prevalence of HM group III than in most previous studies, we explored the possible differential association of this HM group with the gut microbiome. The abundance of Bifidobacterium pseudocatenulatum was higher and that of Klebsiella pneumoniae was lower in HM group III than in HM groups I and II, respectively (DESeq2, FDR<0.05) (Figure S6A), with no overall difference in the global gut microbiota (Figure S6 B and C). There was a trend of lower pH in HM group III compared to HM group I (Mann-Whitney, p = .06). A network analysis of bacterial species of the three major HM groups showed differential co-variation between bacterial species including Bifidobacterium (Figure S7).
Our results indicate that associations between HMOs and the gut microbiota may be population-specific.
Discussion
During early life, the gut microbiota is highly dynamic, responds to the environment and is crucial for health. In this study, we used metagenomics to explore the variability and function of the gut microbiome in an understudied population, 6 to 11-month-old infants living in rural Kenya. We found that the gut microbiome of the infants studied here were enriched in B. longum and, specifically, B. longum subsp. infantis. Several gut microbiota community types were identified that differed in composition and functional features.
In previous studies, Bifidobacterium was found to be the most abundant genus in the gut microbiota in six- to nine-month-old Kenyan infants.Citation28,Citation31,Citation32 Here, using shotgun metagenomics, we showed that the gut microbiome of breastfed Kenyan infants also receiving complementary food is dominated by B. longum species, consistent with the findings of other studies of infants of similar age living in rural environments in Malawi,Citation42,Citation43 and Indonesia.Citation8
This indicates that there is a sustained enrichment in bacteria from the Bifidobacterium community in partially breastfed infants. B. breve, B. bifidum, and B. kashiwanohense were the other most abundant Bifidobacterium species; these species are known to metabolize HMOs, albeit with different efficiencies.Citation44–47 Network analysis identified B. kashiwanohense as key to the interaction between two Bifidobacterium subnetworks, suggesting a possible ecological role in shaping Bifidobacterium community despite the lower abundance and narrower range of HMOs metabolized by this species relative to B. longum, B. breve, and B. bifidum, which have a wider metabolic range.Citation44,Citation45 We further differentiated between B. longum subsp. longum and B. longum subsp. infantis in a pangenomic analysis of the B. longum species. We focused on an HMO cluster of genes encoding proteins involved in both the import and metabolism of HMOsCitation12,Citation48 and genes encoding proteins involved in arabinose metabolism.Citation34 The prevalence of B. infantis was high in metagenomes from Kenyan infants (> 80%), contrasting with its much lower levels in a cohort of mostly exclusively breastfed four-month-old Swedish infants (20%),Citation35 in which B. longum subsp. longum was the more abundant of the two subspecies. Our results are consistent with studies reporting a higher prevalence of B. infantis, typically reaching more than 70%, in infants from countries with limited resources, such as Gambia (76.9%) and Bangladesh (86%),Citation7 or from rural settings in the USA.Citation10 The prevalence of this subspecies is lower (<20%) in more developed countries with higher rates of immune disorders,Citation11,Citation12,Citation49 as recently shown in a global meta-analysis.Citation13 We then studied the variation of the gut microbiome among the infants of our study cohort. We identified GMC types by the Dirichlet multimodal mixture method,Citation50 a clustering approach widely used in studies of the gut microbiome, including investigations in infants.Citation37,Citation38 Previous studies have shown that GMC type is influenced by age, feeding and geographic location.Citation8,Citation11,Citation12,Citation51,Citation52 Here, in a cohort with a narrow range of age and feeding practices, we found differences in alpha-diversity between GMC types, the least diverse of which was enriched in Bifidobacterium, whereas the most diverse was enriched in multiple genera including Enterobacteriaceae. The GMC type with the highest abundance of B. longum and in which B. infantis and B. breve were most frequently exclusively detected had the lowest pH and alpha-diversity, and a higher abundance of some glycoside hydrolases involved in host/animal glycan metabolism, possibly reflecting the metabolism of HMOs and/or mucosal glycans.Citation53 Analysis of Metagenomes-assembled genomes would allow to compare the diversity and function of gut microbiome across populations in early life.Citation54 Furthermore, the frequency of genes encoding antimicrobial resistance, virulence factors and toxins was lower in GMC type 1, consistent with the lower abundance of Enterobacteriaceae species and a lower pH than for the other two GMC types. Fecal pH was generally low in this study (mean of 5.3), consistent with the high levels of Bifidobacterium (specifically B. infantis and B. breve), reflecting the production of organic acids, such as lactic acid and acetic acid.Citation55 In Western infants, fecal pH typically exceeds 6, and the abundance of Bifidobacterium is lower.Citation56 The least prevalent GMC (GMC type 3) had the highest alpha-diversity and displayed the greatest enrichment in genera other than Bifidobacterium, regardless of age and calprotectin levels, a surrogate marker of inflammation. Diet is considered as a major determinant of gut microbiome composition and function. A previous study in infants showed that the cessation of breastfeeding, rather than the introduction of other foods, drove maturation of gut microbiome.Citation35 In our study, most of the infants received cereals in addition to human milk. While this study provides a first insight into the variation of the gut microbiome in infants from rural Kenya, larger studies, with detailed and quantified recording of dietary habits, are now required.
We assessed the association with HMOs further, as most infants were still partially breastfed. Several factors, including genetic background and lactation stage, are known to affect HMO profile.Citation18 The composition of HMOs in this study cohort was consistent with previous studies performed during the late lactation stage (> 6 months), as 3-FL levels have been shown to increase during the course of lactation.Citation41,Citation57 The association between individual HMOs, secretor status and the gut microbiome varies considerably between studies.Citation22–28 We found several associations between individual HMOs and bacterial species, including known HMO-metabolizing species from the genera Akkermansia, Bifidobacterium, Bacteroides, and Streptococcus. The lack of association between abundant Bifidobacterium species (B. longum, B breve and B. bifidum) and individual HMOs, despite the observed enrichment in Bifidobacterium, may reflect metabolic cooperation between species, as observed in studies performed in vitro.Citation46,Citation58 We further evaluated the association of maternal HMO secretor status, with functional α-1-2-fucosyltransferase (FUT2) status, HMO abundance and infant gut microbiome. In our study, 71% of the mothers were secretors, which is in the range with other studies from different populations as well as in African countries such as South Africa, Gambia, Ghana, Ethiopia, and Malawi.Citation21,Citation59 Stratification into four HM groups based on Se/Le genes revealed a higher prevalence of Lewis-negative samples, belonging to HM group III (22.2%) in particular in line with a recent study,Citation60 than in most other populations studied.Citation29,Citation57 2’-FL, a HMO widely studied due to its effects on the gut microbiome, such as the stimulation of Bifidobacterium and the inhibition of pathogens,Citation61,Citation62 was more abundant in HM group III, consistent with previous studies.Citation29,Citation57 Despite the limited sample size of this study, the abundance of B. pseudocatenulatum was higher, and that of Klebsiella spp. lower, in HM group III. Interestingly, Newburg et al. reported that infants fed with HM group III were significantly less likely to be infected with a pathogenic E. coliCitation63 potentially suggesting a specific association between HMOs and gut microbiome in our cohort, and potentially rural African population. Further larger studies are required to confirm these differences in abundances between HM groups and, specifically, to determine whether the higher prevalence of HM group III resulted from the evolutionary pressure imposed by pathogens in rural regions like those studied here in Kenya.Citation28,Citation41,Citation57
Overall, this study provides new insight into the composition and function of the gut microbiota of infants from rural Kenya, and the variability of genetic factors and HMO profiles. The enrichment of the gut microbiome in specific species of Bifidobacterium is associated with functional differences such as a low pH, and low frequencies of antimicrobial resistance genes and virulence factors. Our study also highlights the existence of variable patterns, with some infants harboring a higher abundance of pathogens, which may be useful to guide microbiome-based nutritional interventions. The association between the baseline gut microbiota and clinical responses (iron absorption) to nutritional intervention (prebiotics) would also be of considerable interest in this study cohort. In addition, larger and longitudinal studies in rural Africa should improve our understanding of the structural and functional variation of the gut microbiome of African infants, and in generally understudied populations, shedding light on the contribution of intestinal symbionts to health.
Materials and methods
Study design and participants
We studied a subset of infants (n = 105) enrolled in a single-blind, randomized controlled intervention trial with three arms, conducted in Msambweni and the surrounding rural communities in Kwale County on the southern coast of Kenya. The study was conducted from July 2019 (rainy season) to January 2020 (dry season). We enrolled 6 to 11-month-old infants with no reported current acute or chronic illness, and z-scores for weight-for-age and weight-for-length ≥-3. Infants were excluded if they were severely anemic (Hb <70 g/L), had regularly been given iron-containing mineral and vitamin supplements within the last two months, or had received antibiotics in the month before study enrollment.
Stool collection and DNA extraction
We analyzed fecal samples from 105 infants. The caregivers were asked to collect the fecal samples carefully from the infant on the evening before or the morning of the study visit. They were provided with: i) a specific tube (OMNIgene GUT, OM-200, DNAgenotek, Canada) for the analysis of gut microbiota profile; and ii) polystyrene stool tubes (Sarstedt, Sevelen, Switzerland) for the determination of fecal calprotectin levels and fecal pH. Fecal samples were split into aliquots and frozen at −20°C. All aliquots were stored at the study site until shipment on dry ice to the ETH Zurich, Switzerland, for further analyses. Fecal calprotectin was determined with an ELISA kit (Eurospital, Italy) and fecal pH was determined with a digital pH meter (Metrohm, Switzerland). For fecal DNA extraction, samples were vortexed for 60s and incubated at 50°C for 30 min (as recommended by OMNIgene.GUT for viscous samples). The pellet obtained after centrifugation (1 min at 13. 800 g) was incubated with 200 μL enzyme cocktail (50 mg/mL lysozyme, 20 U/mL lysostaphin and 150 U/mL mutanolysin, all from Sigma-Aldrich, St. Louis, USA), at 37°C for 30 min before mechanical disruption with a FastPrep‐24™ instrument (MP Biomedicals™) set at speed 6.0, for two 60-second periods. DNA was isolated with the QIAamp®PowerFecal®Pro DNA-kit (QIAGEN®, Hilden, Germany) according to the manufacturer’s instructions. DNA was eluted in a final volume of 75 μL. The DNA preparation was subjected to quality control by spectrophotometry on a NanoDrop™ 2000c spectrophotometer (Thermo Fisher Scientific, Waltham, USA), according to the manufacturer’s instructions.
Metagenomic shotgun sequencing and preprocessing. In total, 105 samples were analyzed by Shotgun metagenomics at ADM-Biopolis (Paterna, Spain). DNA was quantified fluorometrically with a Qubit Fluorometer (Themo Fisher Scientific, Carlsbad, USA). Sequencing libraries were prepared with the Nextera XT DNA sample preparation kit, according to the manufacturer’s instructions. Samples were sequenced on a NovaSeq 6000 platform with the kit for 151 bp paired-end reads, resulting in 34.7 million (± 7.8 million) paired-end reads per sample. Demultiplexed reads were filtered with BBToolsCitation64 and quality filtering was performed with NGLess v1.0.0-Linux64 software.Citation65 Reads were filtered for 97% identity to the human genome (hg19), to obtain Q20 reads with a minimal length of 45 nt and no trace of human DNA contamination. After filtering, a mean of 26.6 million (± 5.6 million) paired-end reads per sample were retained.
Genomic assembly and annotation
Sequences were assembled with MetaSPADES genome assembler v3.13.0 (Nurk et al., 2017), with a range of k-mer sizes (21–127) and the assemblies were filtered to exclude sequences of less than 500 bp in length. Assembly performance was analyzed with QUAST v.5.0.0,Citation66 using the default parameters. Open reading frames (ORFs) were predicted with Prodigal v2.6.3Citation67 in metagenomic mode and then filtered to obtain ORFs with start or stop codons, yielding a mean of 53.085 (± 24.138) genes per sample. Genes from all samples were clustered with CD-HIT v4.8.1.Citation68 with the following criteria: 90% alignment coverage and 95% gene sequence identity, to generate a non-redundant de novo gene set. A count matrix for each sample was generated from the non-redundant de novo gene set with NGLess v.1.0.0,Citation65 retaining only primary mapped reads with a minimum match size of 45 nt displaying at least 95% alignment, with a dist1 for multiple mapping reads. Pathogenic factors were identified with PathoFact software, using default parameters.Citation69 Carbohydrate-active enzyme (CAZy) was assessed with dbcan2.Citation70 In short, a triple annotation was performed with (i) HMMer against the dbCAN HMM database, (ii) DIAMOND search against the CAZy pre-annotated CAZyme sequence database, and (iii) eCAMI run against the CAZyme database; CAZy terms annotated with at least two methods were retained for downstream analysis.
For taxonomic analysis, the filtered reads were aligned with single-copy marker genes present in almost all bacteria, viruses, and archaea. The relative abundances of the taxa identified were calculated with the MetaPhlAn3 v.3 pipeline.Citation71 The pipeline used is depicted in Figure S1. Bifidobacterium longum subsp. infantis (B. infantis) and B. longum subsp. longum were detected with PanPhlAn softwareCitation72 applied to the B. longum pangenome (14 B. infantis and 30 B. longum reference genomes) (Table S2). In short, B. infantis HMO cluster genes (Blon_2331–Blon_2361) were selected from the B. longum (species) pangenome (Sela et al., 2008), together with the B. longum subsp. longum-specific genes (araA and araD),Citation34 to assess the presence of these subspecies in the metagenomes for Kenyan and Swedish infants. We excluded 18 samples from Swedish infants (18% of the sample set) and two samples (2% of the sample set) from Kenyan infants from the analysis (below the default PanPhlAn threshold for the presence of B. longum genes).
External dataset. A four-month-old infant microbiome gene set catalog was obtained from the GIGAdb website (gigadb.org/dataset/100145)Citation35 and compared with the non-redundant de novo gene set.
Human milk collection and HMO profiling
Human milk samples for HMO analysis were obtained by manual milk expression by the mother into a clean plastic container. The samples were kept cool until homogenization by the study team. They were then split into 1–2 mL portions and stored at −20°C. All aliquots were stored at −20°C at the study site until shipment on dry ice to the ETH Zurich, Switzerland. For the HMO composition analysis reported here, the HM samples were transported on dry ice to the glycoanalytical laboratory (glyXera GmbH, Magdeburg, Germany). The qualitative and quantitative HMO composition of each individual HM sample was determined with the glyXboxCE™ system (glyXera GmbH, Magdeburg, Germany) based on multiplexed capillary gel electrophoresis with laser-induced fluorescence detection (xCGE-LIF).Citation73 In accordance with the glyXera GmbH kit protocol (KIT-glyX-OS.P-APTS, glyXera GmbH, Magdeburg, Germany), the pure HM samples were diluted 1:100, spiked with an internal standard (IS) (oligosaccharide (OS) quantification standard solution, OS-A5-N-1 mL-01; part of the KIT-glyX-Quant-DP5, all from glyXera GmbH, Magdeburg, Germany) and treated with a denaturation solution. The free OS were labeled with 8-aminopyrene-1,3,6-trisulfonic acid (APTS), purified and determined with the glyXbox™ system. All measurements included the addition of a migration time alignment standard (glyXalign4; STD-glyXalign-4-S, glyXera GmbH) to the sample. Finally, glyXtoolGUI™ software (Beta v0.8.11, glyXera GmbH, Magdeburg, Germany) was used for the processing and analysis of the HMO Fingerprints data (normalized electropherograms). The limit of quantification (LOQ) was determined from the signal-to-noise ratio (SNR) of each HMO Fingerprint calculated as described by Ullsten et al.Citation74 The LOQ was defined as an SNR of 10 and the limit of detection (LOD) was defined as an SNR of 3. The respective noise for each sample was determined after migration time alignment of the unsmoothed data in the late migration time range (approximation range = degree of polymerization (DP) 18< DP<20). Peaks with intensities below the LOQ but above the LOD were picked. All peaks ≥LOQ were considered and their IS-normalized peak areas were calculated (as percentages relative to the peak area of the IS [% IS] (= nPA)). All peaks ≥LOD but <LOQ were replaced with a fixed value; the peaks followed a triangular distribution, so the respective peak areas were replaced with LOQ/√2.Citation75 All HM samples were assigned to a maternal secretor and Lewis (Se/Le) phenotype (HM groups I–IV) based on the presence or absence of specific α1-2- and/or α1-4-fucosylated HMOs, as previously described.Citation73 The assignment of maternal secretor status was based on the presence of 2’-fucosyllactose (2’-FL), difucosyllactose (DFL), and lacto-N-fucopentaose (LNFP) I, and the determination of Lewis status was based on the presence of LNFP II and lacto-N-difucohexaose (LNDFH) II. Differences in HMO abundance between maternal secretor status and HM types were assessed with Mann-Whitney tests or Kruskal-Wallis tests followed by post-hoc Dunn’s test, respectively, with adjustment for false discovery rate (FDR) by the Benjamini-Hochberg mechanism (FDR<0.05).
Gut microbiota statistical analysis
All analyses were performed with R version 3.6.0. The R package Vegan (function richness) was used to calculate alpha-diversity metrics (Shannon’s H, inverse Simpson’s index, and feature richness). Samples were rarefied with the phyloseq library in R (rarefy_even_depth function). Bray-Curtis dissimilarity was used for the analysis of beta-diversity. Permutational testing of variance (PERMANOVA) between groups was performed with the adonis2 function (R package Vegan). For the identification of gut microbiota community types (GMC types) at genus level (relative abundance), we used the Dirichlet multinomial mixture (DMM) approachCitation50 with Laplace number selection. Kruskal-Wallis tests were performed, followed by post-hoc Dunn’s tests, for comparisons between GMC types for the parameters studied (CAZy, main genera and species, age, fecal pH, and fecal calprotectin level, alpha-diversity, and ARG) followed by FDR correction by the Benjamini-Hochberg method for CAZy, main genera, and species. A Pearson’s Chi-squared test was used to determine whether GMC types were associated with secretor status. Network analysis was performed by center log ratio (CLR) normalization and SparCC correlation with the NetCoMi R package, based on the top 20 species with a prevalence of at least 25%, and a correlation threshold of 0.2. We used DESeq2 package (version 1.26.0) to identify species with differential abundances, and different CAZy levels between secretors and non-secretors, with age as a covariate (count sums > 5, and present in at least five subjects). Significant fold-change differences between groups were evaluated with the negative binomial model-based Wald test implemented in DESeq2 (alpha risk = 0.05). A linear mixed model analysis was performed to analyze the relationships between the 20 most abundant bacterial species and 1) calprotectin level, 2) pH, and 3) the abundance of individual HMOs, in MaAsLin2 with default settings (v.1.0.0).Citation76 Age was considered as a random effect and individual HMO, pH and calprotectin levels were considered as fixed effects. Heatmaps based on the correlation coefficients (effect size) with FDR <0.1 (Benjamini-Hochberg) or p< .1 were generated for individual variables (pH, calprotectin, and HMOs).
Ethics approval and consent to participate
Caregivers gave informed consent with either a written signature or a fingerprint. The study protocol was approved by the ethical review committee of ETH Zurich, Switzerland (EK 2018-N-84), and the Institutional Ethics and Review Committee of the Jomo Kenyatta University of Agriculture and Technology, Kenya (JKU/2/4/896B). The trial is registered at clinicaltrials.gov as NCT03894358.
Contributions
M.B.Z., R.B.S., N.M., N.U.S. and M.A.U. designed the clinical study. N.M, M.A.U., S.K. and S.N. conducted the clinical study. M.D. and R.B.S. designed the gut microbiota study. R.K. performed the HMO analysis. M.D., E.C. and R.B.S. supervised the analysis. E.C.Z. and A.H-V. performed the bioinformatic and statistical analysis. M.D. wrote the first draft with inputs from E.C., R.K., R.B.S. All authors were involved in data interpretation and discussion of the results. All the authors edited and approved the final manuscript for submission.
Supplemental Material
Download Zip (525.4 KB)Acknowledgments
We thank the mothers and infants in the study, field workers and E. Mwasi from Msambweni County Referral Hospital (Msambweni, Kenya), as well as C. Zeder, A. Krzystek, T. Christ (ETH Zurich, Switzerland) and J. Erhardt (Willstaett, Germany) for providing support for laboratory and data analyses. We thank R. Berends, A. Botma, and L. Kaptein from Danone Nutricia Research (Utrecht, The Netherlands) for clinical study support. We thank M. Mank (Danone Nutricia Research, Utrecht, The Netherlands) and E. Rapp (glyXera GmbH, Magdeburg, Germany) for fruitful discussions on HMOs and critical reading of the manuscript.
Data Availability Statement
Metagenomic sequences associated with this project were deposited in EMBL under BioProject accession no. PRJEB52748. The source codes used in this study are available from GitHub (github.com/danone/Kenya.study)
Disclosure statement
M.D., R.B.S., and B.S. are Danone Nutricia Research employees and R.K. is an employee of glyXera GmbH, Magdeburg, Germany.
Supplementary material
Supplemental data for this article can be accessed online at https://doi.org/10.1080/19490976.2023.2178793
Additional information
Funding
References
- Rodríguez JM, Murphy K, Stanton C, Ross RP, Kober OI, Juge N, Avershina E, Rudi K, Narbad A, Jenmalm MC, et al. The composition of the gut microbiota throughout life, with an emphasis on early life. Microb Ecol Health Dis. 2015;26:26050. doi:10.3402/mehd.v26.26050.
- de Goffau MC, Jallow AT, Sanyang C, Prentice AM, Meagher N, Price DJ, Revill PA, Parkhill J, Pereira DIA, Wagner J. Gut microbiomes from Gambian infants reveal the development of a non-industrialized Prevotella-based trophic network. Nat Microbiol. 2022;7(1):132–17. doi:10.1038/s41564-021-01023-6.
- Yatsunenko T, Rey FE, Manary MJ, Trehan I, Dominguez-Bello MG, Contreras M, Magris M, Hidalgo G, Baldassano RN, Anokhin AP, et al. Human gut microbiome viewed across age and geography. Nature. 2012;486(7402):222–227. doi:10.1038/nature11053.
- Milani C, Duranti S, Bottacini F, Casey E, Turroni F, Mahony J, Belzer C, Delgado Palacio S, Arboleya Montes S, Mancabelli L, et al. The first microbial colonizers of the human gut: composition, activities, and health implications of the infant gut microbiota. Microbiol Mol Biol Rev. 2017;81(4):e00036–17. doi:10.1128/MMBR.00036-17.
- Robertson RC, Manges AR, Finlay BB, Prendergast AJ. The human microbiome and child growth – first 1000 days and beyond. Trends Microbiol. 2019;27(2):131–147. doi:10.1016/j.tim.2018.09.008.
- Davis JCC, Lewis ZT, Krishnan S, Bernstein RM, Moore SE, Prentice AM, Mills DA, Lebrilla CB, Zivkovic AM. Growth and morbidity of Gambian infants are influenced by maternal milk oligosaccharides and infant gut microbiota. Sci Rep. 2017;7(1):40466. doi:10.1038/srep40466.
- Huda MN, Ahmad SM, Alam MJ, Khanam A, Kalanetra KM, Taft DH, Raqib R, Underwood MA, Mills DA, Stephensen CB. Bifidobacterium abundance in early infancy and vaccine response at 2 years of age. Pediatrics. 2019;143(2):e20181489. doi:10.1542/peds.2018-1489.
- Lawley B, Otal A, Moloney-Geany K, Diana A, Houghton L, Heath AM, Taylor RW, Tannock GW. Fecal microbiotas of Indonesian and New Zealand children differ in complexity and bifidobacterial taxa during the first year of life. Appl Environ Microbiol. 2019;85(19):e01105–19. doi:10.1128/AEM.01105-19.
- Young SL, Simon MA, Baird MA, Tannock GW, Bibiloni R, Spencely K, Lane JM, Fitzharris P, Crane J, Town I, et al. Bifidobacterial species differentially affect expression of cell surface markers and cytokines of dendritic cells harvested from cord blood. Clin Diagn Lab. 2004;11(4):686–690. doi:10.1128/CDLI.11.4.686-690.2004.
- Seppo AE, Bu K, Jumabaeva M, Thakar J, Choudhury RA, Yonemitsu C, Bode L, Martina CA, Allen M, Tamburini S, et al. Infant gut microbiome is enriched with Bifidobacterium longum ssp. infantis in Old Order Mennonites with traditional farming lifestyle. Allergy. 2021;76(11):3489–3503. doi:10.1111/all.14877.
- Casaburi G, Duar RM, Brown H, Mitchell RD, Kazi S, Chew S, Cagney O, Flannery RL, Sylvester KG, Frese SA, et al. Metagenomic insights of the infant microbiome community structure and function across multiple sites in the United States. Sci Rep. 2021;11(1):1472. doi:10.1038/s41598-020-80583-9.
- Vatanen T, Plichta DR, Somani J, Munch PC, Arthur TD, Hall AB, Rudolf S, Oakeley EJ, Ke X, Young RA, et al. Genomic variation and strain-specific functional adaptation in the human gut microbiome during early life. Nat Microbiol. 2019;4(3):470–479. doi:10.1038/s41564-018-0321-5.
- Olm MR, Dahan D, Carter MM, Merrill BD, Yu FB, Jain S, Meng X, Tripathi S, Wastyk H, Neff N, et al. Robust variation in infant gut microbiome assembly across a spectrum of lifestyles. Science. 2022;376(6598):1220–1223. doi:10.1126/science.abj2972.
- Turroni F, Milani C, Ventura M, van Sinderen D. The human gut microbiota during the initial stages of life: insights from bifidobacteria. Curr Opin Biotechnol. 2021;73:81–87. doi:10.1016/j.copbio.2021.07.012.
- Henrick BM, Rodriguez L, Lakshmikanth T, Pou C, Henckel E, Arzoomand A, Olin A, Wang J, Mikes J, Tan Z, et al. Bifidobacteria-mediated immune system imprinting early in life. Cell. 2021;184(15):3884–3898.e11. doi:10.1016/j.cell.2021.05.030.
- de Weerth C, Aatsinki AK, Azad MB, Bartol FF, Bode L, Collado MC, Dettmer AM, Field CJ, Guilfoyle M, Hinde K, et al. Human milk: from complex tailored nutrition to bioactive impact on child cognition and behavior. Crit Rev Food Sci Nutr. 2022;1–38. doi:10.1080/10408398.2022.2053058.
- Masi AC, Stewart CJ. Untangling human milk oligosaccharides and infant gut microbiome. iScience. 2022;25(1):103542. doi:10.1016/j.isci.2021.103542.
- Thurl S, Munzert M, Boehm G, Matthews C, Stahl B. Systematic review of the concentrations of oligosaccharides in human milk. Nutr Rev. 2017;75(11):920–933. doi:10.1093/nutrit/nux044.
- Smilowitz JT, Lebrilla CB, Mills DA, German JB, Freeman SL. Breast milk oligosaccharides: structure-function relationships in the neonate. Annu Rev Nutr. 2014;34(1):143–169. doi:10.1146/annurev-nutr-071813-105721.
- Walsh C, Lane JA, van Sinderen D, Hickey RM. From lab bench to formulated ingredient: characterization, production, and commercialization of human milk oligosaccharides. J Funct Foods. 2020;72:104052. doi:10.1016/j.jff.2020.104052.
- Vinjamuri A, Davis JCC, Totten SM, Wu LD, Klein LD, Martin M, Quinn EA, Scelza B, Breakey A, Gurven M, et al. Human milk oligosaccharide compositions illustrate global variations in early nutrition. J Nutr. 2022;152(5):1239–1253. doi:10.1093/jn/nxac027.
- Zivkovic AM, German JB, Lebrilla CB, Mills DA. Human milk glycobiome and its impact on the infant gastrointestinal microbiota. Proc Natl Acad Sci U S A. 2011;108(Suppl 1):4653–4658. doi:10.1073/pnas.1000083107.
- Korpela K, Salonen A, Hickman B, Kunz C, Sprenger N, Kukkonen K, Savilahti E, Kuitunen M, de Vos WM. Fucosylated oligosaccharides in mother’s milk alleviate the effects of caesarean birth on infant gut microbiota. Sci Rep. 2018;8(1):13757. doi:10.1038/s41598-018-32037-6.
- Borewicz K, Gu F, Saccenti E, Hechler C, Beijers R, de Weerth C, van Leeuwen SS, Schols HA, Smidt H. The association between breastmilk oligosaccharides and faecal microbiota in healthy breastfed infants at two, six, and twelve weeks of age. Sci Rep. 2020;10(1):4270. doi:10.1038/s41598-020-61024-z.
- Lewis ZT, Totten SM, Smilowitz JT, Popovic M, Parker E, Lemay DG, Van Tassell ML, Miller MJ, Jin Y-S, German JB, et al. Maternal fucosyltransferase 2 status affects the gut bifidobacterial communities of breastfed infants. Microbiome. 2015;3(1):13. doi:10.1186/s40168-015-0071-z.
- Bai Y, Tao J, Zhou J, Fan Q, Liu M, Hu Y, Xu Y, Zhang L, Yuan J, Li W, et al. Fucosylated human milk oligosaccharides and N-Glycans in the milk of Chinese mothers regulate the gut microbiome of their breast-fed infants during different lactation stages. mSystems. 2018;3(6):e00206–18. doi:10.1128/mSystems.00206-18.
- Wang M, Li M, Wu S, Lebrilla CB, Chapkin RS, Ivanov I, Donovan SM. Fecal microbiota composition of breast-fed infants is correlated with human milk oligosaccharides consumed. J Pediatr Gastroenterol Nutr. 2015;60(6):825–833. doi:10.1097/MPG.0000000000000752.
- Paganini D, Uyoga MA, Kortman GAM, Boekhorst J, Schneeberger S, Karanja S, Hennet T, Zimmermann MB. Maternal human milk oligosaccharide profile modulates the impact of an intervention with iron and galacto-oligosaccharides in Kenyan infants. Nutrients. 2019;11(11):2596. doi:10.3390/nu11112596.
- Hundshammer C, Minge O. In love with shaping you-influential factors on the breast milk content of human milk oligosaccharides and their decisive roles for neonatal development. Nutrients. 2020;12(11):3568. doi:10.3390/nu12113568.
- Liu Y, Koda Y, Soejima M, Pang H, Schlaphoff T, du Toit ED, Kimura H. Extensive polymorphism of the FUT2 gene in an African (Xhosa) population of South Africa. Hum Genet. 1998;103(2):204–210. doi:10.1007/s004390050808.31.
- Paganini D, MA U, GAM K, CI C, Moretti D, Barth-Jaeggi T, Schwab C, Boekhorst J, HM T, Lacroix C, et al. Prebiotic galacto-oligosaccharides mitigate the adverse effects of iron fortification on the gut microbiome: a randomised controlled study in Kenyan infants. Gut. 2017;66(11):1956–1967. doi:10.1136/gutjnl-2017-314418.
- Jaeggi T, GA K, Moretti D, Chassard C, Holding P, Dostal A, Boekhorst J, HM T, DW S, Tjalsma H, et al. Iron fortification adversely affects the gut microbiome, increases pathogen abundance and induces intestinal inflammation in Kenyan infants. Gut. 2015;64(5):731–742. doi:10.1136/gutjnl-2014-307720.
- LoCascio RG, Desai P, Sela DA, Weimer B, Mills DA. Broad conservation of milk utilization genes in Bifidobacterium longum subsp. infantis as revealed by comparative genomic hybridization. Appl Environ Microbiol. 2010;76(22):7373–7381. doi:10.1128/AEM.00675-10.
- Casaburi G, Duar RM, Vance DP, Mitchell R, Contreras L, Frese SA, Smilowitz JT, Underwood MA. Early-life gut microbiome modulation reduces the abundance of antibiotic-resistant bacteria. Antimicrob Resist Infect Control. 2019;8(1):131. doi:10.1186/s13756-019-0583-6.
- Backhed F, Roswall J, Peng Y, Feng Q, Jia H, Kovatcheva-Datchary P, Li Y, Xia Y, Xie H, Zhong H, et al. Dynamics and stabilization of the human gut microbiome during the first year of life. Cell Host Microbe. 2015;17(6):852. doi:10.1016/j.chom.2015.05.012.
- Barratt MJ, Nuzhat S, Ahsan K, Frese SA, Arzamasov AA, Sarker SA, Islam MM, Palit P, Islam MR, Hibberd MC, et al. Bifidobacterium infantis treatment promotes weight gain in Bangladeshi infants with severe acute malnutrition. Sci Transl Med. 2022;14(640):eabk1107. doi:10.1126/scitranslmed.abk1107.
- Beller L, Deboutte W, Falony G, Vieira-Silva S, Tito RY, Valles-Colomer M, Rymenans L, Jansen D, Van Espen L, Papadaki MI, et al. Successional stages in infant gut microbiota maturation. mBio. 2021;12(6):e0185721. doi:10.1128/mBio.01857-21.
- Stewart CJ, Ajami NJ, O’Brien JL, Hutchinson DS, Smith DP, Wong MC, Ross MC, Lloyd RE, Doddapaneni H, Metcalf GA, et al. Temporal development of the gut microbiome in early childhood from the TEDDY study. Nature. 2018;562(7728):583–588. doi:10.1038/s41586-018-0617-x.
- Duar RM, Kyle D, Casaburi G. Colonization resistance in the infant gut: the role of B. infantis in reducing pH and preventing pathogen growth. High Throughput. 2020;9(2):7. doi:10.3390/ht9020007.
- Qin Y, AS H, Liu Y, Jousilahti P, SC R, Tokolyi A, Jg S, Valsta L, Brożyńska M, Zhu Q, et al. Combined effects of host genetics and diet on human gut microbiota and incident disease in a single population cohort. Nat Genet. 2022;54(2):134–142. doi:10.1038/s41588-021-00991-z.
- Siziba LP, Mank M, Stahl B, Gonsalves J, Blijenberg B, Rothenbacher D, Genuneit J. Human milk oligosaccharide profiles over 12 months of lactation: the Ulm SPATZ health study. Nutrients. 2021;13(6):1973. doi:10.3390/nu13061973.
- Cheung YB, Xu Y, Mangani C, Fan YM, Dewey KG, Salminen SJ, Maleta K, Ashorn P. Gut microbiota in Malawian infants in a nutritional supplementation trial. Trop Med Int Health. 2016;21(2):283–290. doi:10.1111/tmi.12650.
- Ł G, Collado MC, Mangani C, Maleta K, Laitinen K, Ashorn P, Isolauri E, Salminen S. Distinct gut microbiota in southEastern African and Northern European infants. J Pediatr Gastroenterol Nutr. 2012;54(6):812–816. doi:10.1097/MPG.0b013e318249039c.
- James K, Bottacini F, Contreras JIS, Vigoureux M, Egan M, MOc M, Holmes E, van Sinderen D. Metabolism of the predominant human milk oligosaccharide fucosyllactose by an infant gut commensal. Sci Rep. 2019;9(1):15427. doi:10.1038/s41598-019-51901-7.
- Bunesova V, Lacroix C, Schwab C. Fucosyllactose and L-fucose utilization of infant Bifidobacterium longum and Bifidobacterium kashiwanohense. BMC Microbiol. 2016;16(1):248. doi:10.1186/s12866-016-0867-4.
- Lawson MAE, O’Neill IJ, Kujawska M, Gowrinadh Javvadi S, Wijeyesekera A, Flegg Z, Chalklen L, Hall LJ. Breast milk-derived human milk oligosaccharides promote Bifidobacterium interactions within a single ecosystem. ISME J. 2020;14(2):635–648. doi:10.1038/s41396-019-0553-2.
- Ruiz-Moyano S, Totten SM, Garrido DA, Smilowitz JT, German JB, Lebrilla CB, Mills DA. Variation in consumption of human milk oligosaccharides by infant gut-associated strains of Bifidobacterium breve. Appl Environ Microbiol. 2013;79(19):6040–6049. doi:10.1128/AEM.01843-13.
- Sela DA, Chapman J, Adeuya A, Kim JH, Chen F, Whitehead TR, Lapidus A, Rokhsar DS, Lebrilla CB, German JB, et al. The genome sequence of Bifidobacterium longum subsp. infantis reveals adaptations for milk utilization within the infant microbiome. Proc Natl Acad Sci U S A. 2008;105(48):18964–18969. doi:10.1073/pnas.0809584105.
- Tso L, Bonham KS, Fishbein A, Rowland S, Klepac-Ceraj V. Targeted high-resolution taxonomic identification of Bifidobacterium longum subsp. infantis using human milk oligosaccharide metabolizing genes. Nutrients. 2021;13(8):2833. doi:10.3390/nu13082833.
- Holmes I, Harris K, Quince C. Dirichlet multinomial mixtures: generative models for microbial metagenomics. PLoS One. 2012;7(2):e30126. doi:10.1371/journal.pone.0030126.
- Matsuki T, Yahagi K, Mori H, Matsumoto H, Hara T, Tajima S, Ogawa E, Kodama H, Yamamoto K, Yamada T, et al. A key genetic factor for fucosyllactose utilization affects infant gut microbiota development. Nat Commun. 2016;7(1):11939. doi:10.1038/ncomms11939.
- Tsukuda N, Yahagi K, Hara T, Watanabe Y, Matsumoto H, Mori H, Higashi K, Tsuji H, Matsumoto S, Kurokawa K, et al. Key bacterial taxa and metabolic pathways affecting gut short-chain fatty acid profiles in early life. ISME J. 2021;15(9):2574–2590. doi:10.1038/s41396-021-00937-7.
- Bell A, Juge N. Mucosal glycan degradation of the host by the gut microbiota. Glycobiology. 2021;31(6):691–696. doi:10.1093/glycob/cwaa097.
- Zeng S, Patangia D, Almeida A, Zhou Z, Mu D, Paul Ross R, Stanton C, Wang S. A compendium of 32,277 metagenome-assembled genomes and over 80 million genes from the early-life human gut microbiome. Nat Commun. 2022;13(1):5139. doi:10.1038/s41467-022-32805-z.
- Kumar H, Collado MC, Wopereis H, Salminen S, Knol J, Roeselers G. The bifidogenic effect revisited-ecology and health perspectives of bifidobacterial colonization in early life. Microorganisms. 2020;8(12):1855. doi:10.3390/microorganisms8121855.
- Henrick BM, Hutton AA, Palumbo MC, Casaburi G, Mitchell RD, Underwood MA, Smilowitz JT, Frese SA. Elevated fecal pH indicates a profound change in the breastfed infant gut microbiome due to reduction of Bifidobacterium over the past century. mSphere. 2018;3(2):e00041–18. doi:10.1128/mSphere.00041-18.
- Eussen S, Mank M, Kottler R, Hoffmann XK, Behne A, Rapp E, Stahl B, Mearin ML, Koletzko B. Presence and levels of galactosyllactoses and other oligosaccharides in human milk and their variation during lactation and according to maternal phenotype. Nutrients. 2021;13(7):2324. doi:10.3390/nu13072324.
- Gotoh A, Katoh T, Sakanaka M, Ling Y, Yamada C, Asakuma S, Urashima T, Tomabechi Y, Katayama-Ikegami A, Kurihara S, et al. Sharing of human milk oligosaccharides degradants within bifidobacterial communities in faecal cultures supplemented with Bifidobacterium bifidum. Sci Rep. 2018;8(1):13958. doi:10.1038/s41598-018-32080-3.
- McGuire MK, Meehan CL, McGuire MA, Williams JE, Foster J, Sellen DW, Kamau-Mbuthia EW, Kamundia EW, Mbugua S, Moore SE, et al. What’s normal? Oligosaccharide concentrations and profiles in milk produced by healthy women vary geographically. Am J Clin Nutr. 2017;105(5):1086–1100. doi:10.3945/ajcn.116.139980.
- Moya-Alvarez V, Eussen S, Mank M, Koyembi JJ, Nyasenu YT, Ngaya G, Mad-Bondo D, Kongoma JB, Stahl B, Sansonetti PJ, et al. Human milk nutritional composition across lactational stages in Central Africa. Front Nutr. 2022;9:1033005. doi:10.3389/fnut.2022.1033005.
- Vigsnaes LK, Ghyselinck J, Van den Abbeele P, McConnell B, Moens F, Marzorati M, Bajic D. 2ʹFL and LNnT exert antipathogenic effects against C. difficile ATCC 9689 in vitro, coinciding with increased levels of bifidobacteriaceae and/or secondary bile acids. Pathogens. 2021;10(8):927. doi:10.3390/pathogens10080927.
- Fonvig CE, Amundsen ID, Vigsnæs LK, Sørensen N, Frithioff-Bøjsøe C, Christiansen M, Hedley PL, Holm LA, McConnell B, Holm JC. Human milk oligosaccharides modulate fecal microbiota and are safe for use in children with overweight: a randomized controlled trial. J Pediatr Gastroenterol Nutr. 2021;73(3):408–414. doi:10.1097/MPG.0000000000003205.
- Newburg DS, Ruiz-Palacios GM, Altaye M, Chaturvedi P, Meinzen-Derr J, Guerrero Mde L, Morrow AL. Innate protection conferred by fucosylated oligosaccharides of human milk against diarrhea in breastfed infants. Glycobiology. 2004;14(3):253–263. doi:10.1093/glycob/cwh020.
- Bushnell B, Rood J, Singer E. BBMerge – accurate paired shotgun read merging via overlap. PLoS One. 2017 Oct 26;12(10):e0185056. doi:10.1371/journal.pone.0185056.
- Coelho LP, Alves R, Monteiro P, Huerta-Cepas J, Freitas AT, Bork P. NG-meta-profiler: fast processing of metagenomes using NGLess, a domain-specific language. Microbiome. 2019;7(1):84. doi:10.1186/s40168-019-0684-8.
- Gurevich A, Saveliev V, Vyahhi N, Tesler G. QUAST: quality assessment tool for genome assemblies. Bioinformatics. 2013;29(8):1072–1075. doi:10.1093/bioinformatics/btt086.
- Hyatt D, Chen G-L, LoCascio PF, Land ML, Larimer FW, Hauser LJ. Prodigal: prokaryotic gene recognition and translation initiation site identification. BMC Bioinform. 2010;11(1):119. doi:10.1186/1471-2105-11-119.
- Li W, Godzik A. Cd-hit: a fast program for clustering and comparing large sets of protein or nucleotide sequences. Bioinformatics. 2006;22(13):1658–1659. doi:10.1093/bioinformatics/btl158.
- de Nies L, Lopes S, Busi SB, Galata V, Heintz-Buschart A, Laczny CC, May P, Wilmes P. PathoFact: a pipeline for the prediction of virulence factors and antimicrobial resistance genes in metagenomic data. Microbiome. 2021;9(1):49. doi:10.1186/s40168-020-00993-9.
- Zhang H, Yohe T, Huang L, Entwistle S, Wu P, Yang Z, Busk PK, Xu Y, Yin Y. dbCAN2: a meta server for automated carbohydrate-active enzyme annotation. Nucleic Acids Res. 2018;46(W1):W95–W101. doi:10.1093/nar/gky418.
- Beghini F, McIver LJ, Blanco-Míguez A, Dubois L, Asnicar F, Maharjan S, Mailyan A, Manghi P, Scholz M, Thomas AM, et al. Integrating taxonomic, functional, and strain-level profiling of diverse microbial communities with bioBakery 3. Elife. 2021;10:e65088. doi:10.7554/eLife.65088.
- Scholz M, Ward DV, Pasolli E, Tolio T, Zolfo M, Asnicar F, Truong DT, Tett A, Morrow AL, Segata N. Strain-level microbial epidemiology and population genomics from shotgun metagenomics. Nat Methods. 2016;13(5):435–438. doi:10.1038/nmeth.3802.
- Kottler R, Mank M, Hennig R, Müller-Werner B, Stahl B, Reichl U, Rapp E. Development of a high-throughput glycoanalysis method for the characterization of oligosaccharides in human milk utilizing multiplexed capillary gel electrophoresis with laser-induced fluorescence detection. Electrophoresis. 2013;34(16):2323–2336. doi:10.1002/elps.201300016.
- Ullsten S, Danielsson R, Bäckström D, Sjöberg P, Bergquist J. Urine profiling using capillary electrophoresis-mass spectrometry and multivariate data analysis. J Chromatogr A. 2006;1117(1):87–93. doi:10.1016/j.chroma.2006.03.048.
- Hornung R, Reed L. Estimation of average concentration in the presence of nondetectable values. J Occup Environ Hyg. 1988;5(1):46–51. doi:10.1080/1047322X.1990.10389587.
- Mallick H, Rahnavard A, McIver LJ, Ma S, Zhang Y, Nguyen LH, Tickle TL, Weingart G, Ren B, Schwager EH, et al. Multivariable association discovery in population-scale meta-omics studies. PLoS Comput Biol. 2021;17(11):e1009442. doi:10.1371/journal.pcbi.1009442.