
 ?Mathematical formulae have been encoded as MathML and are displayed in this HTML version using MathJax in order to improve their display. Uncheck the box to turn MathJax off. This feature requires Javascript. Click on a formula to zoom.
ABSTRACT
Predicting the long-term outcome of multiple sclerosis (MS) remains an important challenge to this day. As the gut microbiota is emerging as a potential player in MS, we investigated in this study whether gut microbial composition at baseline is related to long-term disability worsening in a longitudinal cohort of 111 MS patients. Fecal samples and extensive host metadata were collected at baseline and 3 months post-baseline, with additional repeated neurological measurements performed over (median) 4.4 y. Worsening (with EDSS-Plus) occurred in 39/95 patients (outcome undetermined for 16 individuals). The inflammation-associated, dysbiotic Bacteroides 2 enterotype (Bact2) was detected at baseline in 43.6% of worsened patients, while only 16.1% of non-worsened patients harbored Bact2. This association was independent of identified confounders, and Bact2 was more strongly associated with EDSS-Plus than neurofilament light chain (NfL) plasma levels. Furthermore, using fecal sampling performed 3 months post-baseline, we observed Bact2 to be relatively stable, suggesting its potential use as a prognostic biomarker in MS clinical practice.
Introduction
The course of multiple sclerosis (MS), a chronic inflammatory and degenerative disease of the central nervous system, is largely unpredictable as currently available tools (including conventional magnetic resonance imaging (MRI)) offer limited prognostic value.Citation1 Although blood-based candidate biomarkers, such as neurofilament light chain (NfL), seem to have some predictive potential, combining different measures might improve prognostication overall.Citation2
Evidence from experimental autoimmune encephalomyelitis (EAE) studies in animal models hints at a role for the gut microbiota (i.e., the collection of micro-organisms inhabiting the gastrointestinal tract) in MS, as germ-free mice are less inclined to develop induced or spontaneous EAE than conventionally colonized mice.Citation3,Citation4 Furthermore, a study in monozygotic twin pairs discordant for MS observed a high incidence of EAE in mice that received a fecal transplant from MS patients, whereas fecal transplantation from the healthy twin was less likely to lead to EAE.Citation5 Indeed, the gut microbiome seems dissimilar, albeit moderately, between MS patients and healthy controls,Citation6 but also diverges among different MS phenotypes.Citation7
While cross-sectional variation of the gut microbiome in MS has been extensively described, longitudinal studies exploring associations between gut microbiota composition and clinical outcome measures in MS remain scarce. Moreover, existing longitudinal reports mostly focus on the potential link between the gut microbiome and relapse activity, not disability worsening. In pediatric MS cases, absence of FusobacteriaCitation8 and a lower relative abundance of microbial genes involved in tryptophan metabolismCitation9 were found to be linked to a higher relapse risk. Another publication described several taxa that were associated with risk for new relapses and MRI activity over the following 2 y, albeit also in the context of pediatric MS.Citation10 As of yet, only one study has investigated whether gut microbial composition is associated with disability worsening.Citation11 This study found an increased Th17 cell frequency and mucosal microbiota alterations in the small intestine of relapsing-remitting (RR) MS patients which seemed to be related to evidence of disease activity during 2-y follow-up (either relapse(s), worsening, or new MRI lesion(s)).Citation11
Evidently, more research is needed to establish whether a link exists between the gut microbiome and MS disease course. In this study, we investigate whether gut microbiome characteristics are associated with sustained disability worsening in an MS cohort that includes both patients with a relapsing (relapsing-remitting MS, RRMS) and progressive (primary progressive MS, PPMS) onset. We cover well-established gut microbiome read-outs, such as within-sample (alpha) and between-sample (beta) diversity measures, taxonomic (absolute) abundance profiles, and enterotypesCitation12,Citation13 (or community types). The enterotyping approach, which allows classifying microbiome profiles in a limited number of different gut microbiota constellations that were shown to be relatively stable in time,Citation14 facilitates linking host variables (such as disease,Citation13,Citation15 inflammation levels,Citation16 medication useCitation17,Citation18) with overall gut community variation, while simultaneously reducing the complexity of the gut microbiome space.Citation19 A recent set of studies showed the association of one dysbiotic enterotype (Bacteroides 2) with multiple pathologies, including MS.Citation7 In addition, we assess several biological variables stool characteristics, including moisture content (a proxy for transit time), microbial loads, and calprotectin levels.
Results
Cohort description
Fecal samples were collected from 111 adult MS patients (RRMS N = 86; PPMS N = 25; N = 70[63%] female; aged 48.0 ± 13.50 [median ± IQR] y) at baseline and 3 months post-baseline. Several neurological assessments were also performed on said time points: overall disability was determined with Expanded Disability Status Scale (EDSS); short distance walking speed using the timed 25-foot walk test (T25FW); and manual dexterity through the nine-hole peg test (9-HPT) (, , supplementary table 2). Patients were either disease-modifying treatment naïve (N = 54), untreated (N = 30), or interferon-β- (IFN-β) treated (N = 27) at baseline. After a median follow-up time of 4.4 (± 0.77) (median ± IQR) y, 41.1% of patients (N = 39/95) had worsened on the EDSS-Plus. The number of clinical evaluations per patient over the study period was 6 1 (median
IQR). The EDSS-Plus outcome could not be determined in 16 patients and thus the longitudinal analysis was performed with a sample size of 95 individuals with MS (RRMS N = 73; PPMS N = 22). Reasons for undetermined EDSS-Plus outcome were as follows: patients lost to follow-up (N = 5), unconfirmed worsening upon data closure (N = 4), stable EDSS scores but lacking 9-HPT or T25FW data at baseline (N = 3) or at the last time point (N = 2), or suspected interrater variability interfering with EDSS assessment (N = 2).
Figure 1. Study cohort and prevalence of sustained disability worsening, using the EDSS-Plus endpoint. (a) The cohort consisted of 111 MS patients (86 relapsing-remitting (RR), 25 primary progressive (PP)). At baseline, patients were either disease-modifying treatment naïve (RRMS N = 33, PPMS N = 21), untreated (RRMS N = 26, PPMS N = 4), or treated with interferon-β (IFN-β, RRMS N = 27). (b) EDSS-Plus worsening was observed in 39/95 patients (RRMS N = 29/73, PPMS N = 10/22; undetermined in 16 patients) and was not associated with onset (χ2 test; N = 95, χ2 = 0.23, false-discovery rate (FDR) adjusted P value = .89). (c) Distribution of treatment groups was similar in patients with and without worsening (IFN-β N = 11/39 & N = 15/56; untreated N = 8/39 & N = 18/56; naïve N = 20/39 & 23/56, respectively) (χ2 tests; N = 95, 1.68, FDR = 0.72). n.s. = non-significant.
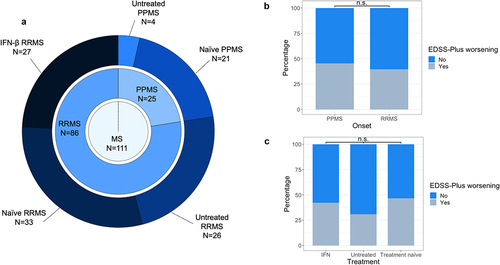
Table 1. Description of study participants.
The distribution of worsened and non-worsened participants was similar among onset types and treatment groups (χ2 tests; N = 95, χ2 = 0.23 and 1.68, respectively, false-discovery rate (FDR) adjusted P value = .89 and 0.72) (, supplementary table 3). Assessed diet and lifestyle variables did not significantly differ between worsened and non-worsened patients either (χ2 and Wilcoxon rank sum tests, FDR > 0.1; supplementary table 3). Likewise, no significant difference in annualized relapse rate was observed between RRMS patients who worsened (0.2 ± 0.37; median ± IQR) and those who did not (0.0 ± 0.25) (Wilcoxon rank sum test, N = 73, P = .67). In contrast, T25FW (N = 95, effect size = −0.29, FDR = 0.06) and 9-HPT scores (N = 89, both dominant hand [effect size = −0.24, FDR = 0.096] and non-dominant hand values [effect size = −0.33, FDR = 0.06] for the latter variable), Hauser ambulation index (N = 95, effect size = −0.29, FDR = 0.06), NfL concentration in plasma (effect size = −0.25, FDR = 0.096), self-reported feelings of anxiety (as measured with HADS; N = 95, effect size = −0.24, FDR = 0.096), and the proportion of individuals taking vitamin D (N = 95, χ2 = 8.71, FDR = 0.04) were significantly higher at baseline in the worsened versus non-worsened group (supplementary table 3).
The T25FW score and Hauser ambulation index are both measures of mobility and correlated significantly with each other as expected (Spearman test, N = 95, rho = 0.68, P = 3.613 × 10⁻¹⁴). Given its use in defining EDSS-Plus, baseline T25FW score was used for further analysis. For the distinct 9-HPT values, which also showed great correlation (N = 89, rho = 0.82, P < 2.2e-16), the non-dominant hand score was retained as it was more strongly associated with the EDSS-Plus outcome.
Association between gut microbiota composition and EDSS-Plus outcome
To explore how gut microbiota features at baseline are related to the EDSS-Plus outcome, we studied relative (RMP) and quantitative (QMP) microbiome profiles based on amplicon sequencing, combined with flow cytometry for the latter.Citation13 None of the determined alpha diversity indices (i.e. microbial richness, Inverse Simpson diversity index, and Pielou evenness index) were associated with EDSS-Plus worsening (Wilcoxon rank sum tests; N = 93, QMP taxa abundances missing due to unavailable microbial load values for N = 2 participants; effect sizes = −0.15, −0.01, −0.04 respectively; FDR = 0.44, 0.91, 0.91 respectively, supplementary table 4, supplementary figure 1).
In terms of global gut community composition (beta diversity), samples from worsened patients did not separate from those of non-worsened individuals (permutational multivariate analysis of variance (MANOVA) Adonis test, Bray–Curtis dissimilarity, N = 93, adjusted R2 = 0.01, P = .41, supplementary table 4, supplementary figure 1). We also checked for distinct compositional differences between groups but found no evidence of specific genera being related to either worsening or non-worsening of patients (Wilcoxon rank sum test, N = 93, number of genera tested = 55, FDR > 0.1, supplementary table 5).
Next, we investigated whether baseline enterotype (i.e., microbial community typeCitation13) was associated with EDSS-Plus worsening. Using the Dirichlet multinomial mixtures method (performed on a combined genus-level matrix of both study and Flemish Gut Flora ProjectCitation20 (FGFP) reference samples), we identified the previously observed Prevotella (Prev; prevalence of 9.1% at baseline in study cohort [N = 111] vs. 18.1% in FGFP [N = 1106]), Ruminococcaceae (Rum [25.2% vs. 31.9%]), Bacteroides 1 and 2 (Bact1 [39.6% vs. 37.1%], Bact2 [26.1% vs. 12.9%]) enterotypesCitation13 (supplementary figure 2). Microbial load differed among the enterotypes, with lower counts observed in Bact2 versus Bact1 (Dunn test, N = 108, n = 216 [including baseline and 3 months post-baseline samples, microbial load values missing for N = 3 individuals], Z = −3.75, FDR = 0.001; supplementary table 6). The Bact2 enterotype was also characterized by lower absolute abundances of short-chain fatty acid producing genera such as Faecalibacterium, Coprococcus, and Roseburia (n = 216, FDR > 0.1; supplementary figure 3, supplementary table 6). In addition, fecal moisture content was found to be higher in Bact2 than in the Rum enterotype (N = 111, n = 222; Z = 3.58, FDR = 0.001), but lower compared to Prev (Z = −3.27, FDR = 0.003).
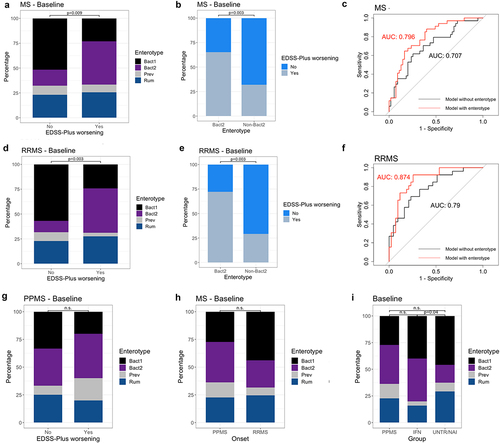
Baseline enterotype distribution was significantly different between patients who worsened and those who did not (χ2 test, N = 95, χ2 = 11.20, P = .009; ), with a striking prevalence of 43.6% for the Bact2 enterotype in worsened patients versus 16.1% in patients without sustained disability worsening (Post-hoc χ2 test, N = 95, Pearson standardized residuals = −2.96). Similarly, a higher proportion of patients with EDSS-Plus worsening was found among individuals harboring a Bact2 enterotype (65.4% worsened) than in non-Bact2-enterotyped patients (31.9% worsened) (χ2 test, N = 95, χ2 = 8.76, P = .003; ).
Figure 2. Baseline enterotype is associated with sustained worsening as defined with EDSS-Plus. (a, d) Enterotype distribution was significantly different between patients with and without EDSS-Plus worsening (χ2 tests; χ2 = 11.20, N = 95, P = .009 for total MS group; χ2 = 13.18, N = 73, P = .003 for relapsing-remitting (RR) MS group), even after partialling out effects of timed 25-foot walk (T25FW) and nine-hole peg test (9-HPT, non-dominant) scores (Generalized Linear Models (GLMs); N = 89, R2 enterotype = 0.16, P = .001 for total MS group; N = 69, GLM, R2 enterotype = 0.19, P = .015 for RRMS group). (Bacteroides 1 (Bact1) N = 38 & N = 32, Bacteroides 2 (Bact2) N = 26 & N = 18, Prevotella (Prev) N = 8 & N = 5, Ruminococcaceae (Rum) N = 23 & N = 18 for total MS group and RRMS group, respectively) (b, e) Group distribution was significantly different between Bact2 and non-Bact2 enterotypes (χ2 tests; N = 95, χ2 = 8.76, P = .003 for total MS group; N = 73, χ2 = 13.18, P = .003 for RRMS group). (c, f) ROC (receiver operating characteristic) curve of the logistic regression models (with area under the curve (AUC)) with (red) and without (black) enterotype to predict sustained worsening with the EDSS-Plus (N = 95 and N = 73 for total MS group and RRMS group, respectively). (g) No association between enterotype at baseline and sustained worsening as defined with EDSS-Plus was found for primary progressive (PP) MS (χ2 test, N = 22, χ2 = 1.03, P = .832). (h) No significant difference in enterotype distribution (at baseline) between onsets was found (χ2 test, N = 95, χ2 = 2.96, P = .404). (i) The Bact2 enterotype is more prevalent in interferon-β- (IFN-β) treated RRMS than untreated and naïve (UNTR/NAI) RRMS (χ2 test, χ2 = 4.82, N = 95, P = .04). The percentage of Bact2-enterotyped individuals within the IFN-β-treated RRMS group (N = 25/95) and untreated RRMS group (N = 48/95) was 40% and 16.7%, respectively. n.s. = non-significant.
Identification of confounders and deconfounding
To identify features that may potentially confound the reported relationship between Bact2 prevalence and sustained disability worsening, we investigated whether baseline metadata variables that were altered between patients with and without worsening (i.e., T25FW and 9HPT [non-dominant hand] values, self-reported anxiety, NfL plasma concentration and vitamin D supplementation) were also associated with Bact2. This was indeed the case for T25FW and 9-HPT scores (Dunn tests, N = 95 for T25FW, N = 89 for 9-HPT, FDR < 0.1, supplementary table 7). The association between baseline enterotype and disability accumulation remained significant after adjusting for baseline T25FW and 9-HPT scores (nested Generalized Linear Models (GLM), N = 89, R2 = 0.16, 0.008, 0.07 for enterotype, T25FW, and 9-HPT, respectively, P = .001). Furthermore, the model including enterotype had an area under the curve (AUC) of 0.796, compared to 0.707 when solely using baseline T25FW and 9-HPT scores to predict EDSS-Plus outcome ().
Subgrouping the cohort according to onset type, this association was only significant in the RRMS group (χ2 test, χ2 = 13.18, N = 73, P = .003; GLM, R2 enterotype = 0.19, N = 69, P = .015; AUC = 0.874; ), with 44.8% of RRMS patients with sustained disability worsening having the Bact2 enterotype.
Enterotype distribution was similar for RRMS and PPMS groups (N = 95, χ2 = 2.96, P = .404; ), indicating that a higher Bact2 prevalence within the RRMS was not the cause of this discrepancy between onsets. Because we have previously shown that the Bact2 enterotype occurs more frequently in IFN-β-treated than in untreated RRMS patients,Citation7 a finding that was corroborated in this dataset (χ2 = 4.82, N = 95, P = .04; ), we examined whether the discovered association was driven by IFN-β use. This was not the case – a similar proportion of patients on IFN-β at baseline was observed in both the worsened (28.2%) and non-worsened (26.8%) group.
Then, we evaluated whether adding NfL plasma concentration, a blood-based candidate prognostic biomarker for MS, would improve our model’s performance in discriminating worsened from non-worsened patients. Enterotype distribution was still significantly associated with the EDSS-Plus outcome when NfL was added to the GLM as an additional predictor (N = 88 MS patients, P = .001; N = 68, P = .01). Moreover, including NfL in the GLM resulted in a higher AUC (0.82) when considering the total MS population but remained almost identical (0.871) for the RRMS subset. Of all predictors for sustained disability worsening, enterotype (specifically being Bact2 or not) had the largest relative risk ratio, being 6.19 (95% confidence interval (CI) = 2.38–14.40). Relative risk ratio values were 1.06 (95% CI 1.01–1.13), 1.07 (95% CI 1.01–1.15), 1.00 (95% CI 0.97–1.02) for plasma NfL concentration, 9-HPT score, and T25FW score, respectively.
Stability of the baseline sample
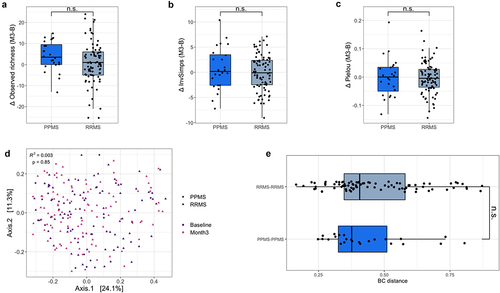
To evaluate the stability of the baseline sample, we compared its microbial community features with those of the fecal sample collected 3 months post-baseline. Measures of alpha and beta diversity showed that overall, no major shifts in gut microbiota composition had occurred between visits (Wilcoxon signed-rank and permutational MANOVA Adonis tests, RRMS N = 84, PPMS = 24, FDR > 0.1 and P > .05 for indices of alpha and beta diversity respectively, , supplementary table 8). Bray–Curtis distances between samples of each participant showed a similar amount of variation for both RRMS and PPMS (Kruskal-Wallis test, N = 111, χ2 = 1.07, P = .3).
Figure 3. Gut microbial composition is similar at baseline and 3 months post-baseline. (a–c) Box plots representing differences in observed richness, Inverse Simpson’s and Pielou indices between baseline and 3 months post-baseline for each participant. Indices were similar in all groups for both visits (Wilcoxon signed-rank, for relapsing-remitting (RR)MS N = 84, effect size = −0.088, −0.007, −0.111, respectively, false-discovery rate (FDR) adjusted P value = .89, 0.95, 0.89 respectively; for primary progressive (PP)MS N = 24, effect size = −0.49, −0.06, −0.032 respectively, FDR = 0.10, 0.89, 0.95, respectively). Microbial load measurements were unavailable for 3/111 samples, with quantitative microbiota profiles (QMP) thus missing for these participants. (d) Principal coordinates analysis (PCoA) on QMP genus-level matrix (Bray–Curtis dissimilarity) of cohort (RRMS N = 84, PPMS N = 24). No major shifts in global community structure were observed between visits (permutational MANOVA Adonis, N = 108, n = 216 samples, adjusted R2 = 0.003, P = .852). (e) Bray–Curtis distance between baseline and 3 months post-baseline samples for each participant. Variation in distance was similar in all groups (Kruskal–Wallis, N = 111, χ2 = 1.07, P = .30). The box plot body represents the first and third quartiles of the distribution and the median line. Whiskers extend from quartiles to the last data point within 1.5× the interquartile range, outliers lie beyond. n.s. = non-significant.
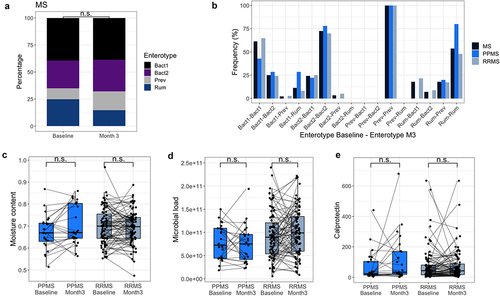
In terms of enterotypes, these were not deemed unstable between visits (McNemar–Bowker test, N = 111, χ2 = 9.98, P = .12, ). In the total MS population, 72.4% of patients who harbored Bact2 at baseline had the same enterotype 3 months later (77.8% for PPMS, 70% for RRMS). Except for Prev, which had a stability of 100%, switching community types occurred more frequently for the other enterotypes (Rum = 46.5%, Bact1 = 38.6%). In addition, we found no indications of a change in microbial load, moisture content and fecal calprotectin levels between baseline and 3 months post-baseline for either the PPMS or RRMS group (Wilcoxon signed-rank test, N = 108 for microbial load, N = 111 for moisture content and fecal calprotectin, FDR > 0.1, , supplementary table 9). Finally, we assessed whether the aforementioned association between Bact2 and EDSS-Plus worsening could be corroborated in the sample collected 3 months post-baseline. Again, among RRMS patients with EDSS-Plus worsening, the percentage of Bact2-enterotyped patients (64.7%) was significantly higher than the percentage of patients harboring non-Bact2 enterotypes (31.2%) (χ2 test, N = 67 (six individuals excluded due to antibiotic use), χ2 = 4.92, P = .047, supplementary figure 4).
Figure 4. Enterotypes and distinct stool characteristics are similar at baseline and 3 months post-baseline. (a) Bar plots representing enterotype distribution (based on relative microbiota profiles (RMP)) per visit. Enterotype distribution was similar in MS patients at both visits (χ2 test, MS N = 111, χ2 = 3.73, P = .29). (b) Bar plots representing the frequency of enterotype switches between baseline and 3 months post-baseline for the total MS population, PPMS, and RRMS. In the MS group, enterotypes were found to be stable between visits (McNemar–Bowker, N = 111, χ2 = 9.98, P = .12; sample size of subgroups proved too small for separate testing), although multiple transitions toward the Bact2 enterotype occurred that seemed to be linked to oral antibiotic usage between time points. (Bact: Bacteroides; Prev: Prevotella, Rum: Ruminococcaceae) (c, d, e) No significant difference in moisture content, fecal calprotectin levels, and microbial load was found between baseline and 3 months post-baseline for primary progressive (PP)MS and relapsing-remitting (RR)MS (Wilcoxon signed-rank, for RRMS N = 84, effect size = −0.065, −0.064, −0.145 respectively, false-discovery rate (FDR) adjusted P value = .56, 0.56, 0.55, respectively; PPMS = 24, effect size = −0.381, −0.184, −0.154, FDR = 0.37, 0.56, 0.56, respectively). The box plot body represents the first and third quartiles of the distribution and the median line. Whiskers extend from quartiles to the last data point within 1.5× the interquartile range, outliers lie beyond. n.s. = non-significant.
Discussion
The main finding of our study relates to the association of the dysbiotic, inflammation-associated Bact2 enterotype with sustained disability worsening in (RR)MS over four to 5 y of follow- up. We believe this finding to be robust for several reasons. First, the observed association remained significant after partialling out effects of identified confounders (i.e., T25FW and 9-HPT (non-dominant hand) scores). Other clinical variables (including EDSS, annualized relapse rate, DMT) and major covariates of gut microbiome compositionCitation20 (age, BMI, sex, dietary habits, antibiotic use, stool consistency (a proxy for transit time)) were not significantly different between the worsening and the non-worsening group. Second, we used a composite measure, the EDSS-Plus, to increase the sensitivity to detect disability accumulation in a study population including both relapsing and progressive MS patients.Citation21
By requiring this worsening to be sustained for at least 6 months and to persist until the last study visit, we reduced the potential impact of relapses and inter- or intra-rater variability. Third, the finding of a relative stability of the baseline sample (with 72.4% of patients still having a Bact2 enterotype 3 months post-baseline) strengthens our conclusion. Lastly, a substantial proportion of patients in this study were untreated (and even treatment-naïve) at baseline, reducing potential confounding by immunomodulation or immunosuppression.
Even though no formal causal relationship can be established at this moment, the link between the prevalence of the inflammation-associated Bact2 enterotype and subsequent disability worsening in RRMS presumably refers to mechanisms related to CNS inflammation. Bact2 is thought to be a dysbiotic enterotype, characterized by lowered microbial load and diversity, as well as a reduced abundance of Faecalibacterium, which is thought to exert anti-inflammatory functions through the production of short chain fatty acids.Citation17
Prevalence of Bact2 has been shown to be increased in multiple inflammatory conditions (such as inflammatory bowel disease, primary sclerosing cholangitis, and obesityCitation13,Citation16,Citation17) but also in depression.Citation15 We previously found indications of a higher Bact2 prevalence in certain MS phenotypes,Citation7 a finding that was corroborated in this study. While the name of the Bact2 enterotype seems to focus on high Bacteroides, it is defined as an aberrant microbiome structure overall, and thus not only denoted by the abundance of this specific taxon.Citation13 Therefore, our findings are not contradictory to the results of previous gut microbiome studies in EAECitation22 and individuals with MS,Citation11,Citation23,Citation24 which have suggested potentially beneficial properties of certain Bacteroides species in MS.
There are a multitude of cross-sectional studies on the gut microbiome in MS, but the number of longitudinal studies is rather limited. Three studies – all in pediatric MS – investigated the association of the gut microbiota with subsequent disease activity (relapses and/or new or enhancing lesions on brain MRI).Citation8,Citation9,Citation25
To our knowledge, only one small-scale study has previously investigated disability worsening over time in relation to gut microbial composition.Citation11 In this work, authors reported differential abundances of certain members of the small intestine mucosal microbiota at baseline (i.e., lowered Prevotella and higher Streptococcus) in patients who either experienced a relapse, progressed based on the EDSS, or developed a new MRI lesion during 2 y of follow-up versus patients who remained stable.Citation11 As this study used small intestinal biopsies and ours used fecal samples, a detailed comparison of findings remains difficult.
Sustained disability worsening in our cohort was not related to relapse frequency. The rather low annualized relapse rate is in line with the study participants’ age and longer disease duration. While differences in relapse-associated worsening between worsened and non-worsened patients remain possible, findings from both the EPIC cohortCitation1 and a pooled analysis of two randomized clinical trialsCitation21 suggest that disability accumulation in RRMS is not primarily driven by cumulative injury from relapses, but rather by diffuse inflammatory and neurodegenerative processes (i.e. silent progression). The lacking association between Bact2 and disability accrual in the subgroup of PPMS could be due to the small sample size of this group (N = 22) or other reasons, such as less prominent inflammatory mechanisms within this phenotype.
We realize that our study population has a relatively modest size and is rather heterogeneous, with relapsing and progressive patients, including patients exhibiting a rather mild and longstanding disease and patients with a more severe disease course. We therefore stratified all analyses by onset type and used a composite measure that has been shown to be sensitive to detect worsening not only in relapsing,Citation21 but also in progressive patients.Citation26 Other limitations include the lack of brain MRI data and absence of an independent validation cohort. However, based on our information, there are no (published) studies of gut microbiome composition in relation to similar long-term clinical follow-up. The fact that enterotype remained significant in a model including plasma-NfL, which has shown potential as prognostic biomarker for MS in previous studies,Citation2 indicates that Bact2 and NfL have a non-redundant explanatory power for disability worsening in MS.
Although enterotype-based diagnostics would certainly need some development before its implementation in (MS) clinical practice, this finding is, if validated in larger cohorts, indeed promising. To conclude, our results implicate the gut microbiota as a potential prognostic biomarker and underline the importance of large-scale follow-up studies of the gut microbiota in association with disease course modifiers in MS.
Patients and methods
Cohort and study design
In 2014–2015, patients with MS (diagnosed with 2010 McDonald criteriaCitation27) were recruited at the National MS Center Melsbroek (NMSC) and University Hospital of Brussels (UZB) for a prospective study. To participate in the study, patients needed to be either treatment naïve, currently untreated (having stopped treatment for at least 3 months if previously treated with glatiramer acetate and at least 6 months if previously treated with fingolimod or natalizumab) or being treated with interferon-β (IFN-β). Antibiotic use 4 weeks before baseline, chronic gastrointestinal disease, and systemic corticosteroid use 2 months before baseline were exclusion criteria for this study. At baseline and 3 months post-baseline, participants provided a fecal sample, filled in questionnaires, and underwent clinical neurological assessments including the expanded disability status scale (EDSS)Citation28 score, the nine-hole peg test (9-HPT)Citation29 and the timed 25-foot walk (T25FW).Citation30 At baseline, patients had a blood draw for neurofilament light chain (NfL) measurement. Neurological assessments were repeated during study visits at 1, 2 and 4–5 y post-baseline. In in-between study visits, clinical assessments were performed in the context of regular follow-up at the NMSC or UZB.
Clinical data
We assessed clinical neurological disability worsening with a composite measure, the EDSS-Plus.Citation26 EDSS-Plus worsening was defined as worsening in one or more out of three measures (EDSS,Citation28 9-HPT,Citation29 T25FWCitation30) which needed to be sustained, i.e., confirmed after 6 or more months and persistent throughout the last study visit. In view of the non-linearity of the EDSS, the relevance of observed changes depended on baseline valuesCitation1 (if EDSS = 0 at baseline, a 1.5-point increase was needed to indicate worsening; if EDSS ≥1.0 and <6.0, a 1-point increase in the EDSS was required; if EDSS 6, an increase by 0.5 point sufficed). Short distance walking speed and manual dexterity were measured with the T25FWCitation30 and 9-HPT,Citation29 respectively, with meaningful worsening defined as a
20% increase in scores. Additional EDSS, T25FW and 9-HPT assessments obtained during regular follow-up in-between study visits were used to confirm worsening if applicable. Based on a careful consideration of all available clinical data, patients were categorized into groups: patients with sustained disability worsening over the study period as defined with the EDSS-Plus, patients without sustained disability worsening, and patients for whom it was not possible to determine the outcome (e.g., patients lost to follow-up). Relapses (defined as new or worsening focal neurological symptoms lasting for more than 24 h and usually followed by at least some recovery over timeCitation1) were assessed for each patient during study visits and regular follow-up in-between and were allowed to be patient-reported. Atypical symptoms or worsening of symptoms in the context of infection were not considered relapses. Annualized relapse rate (ARR) was determined by dividing the total number of relapses experienced during the study period by the number of years of study follow-up.Citation1
Metadata
To assess potential confounders, participants filled out questionnaires (baseline, 3 months post-baseline, and approximately 1, 2, 4.5 y post-baseline) regarding anthropometrics/general health, current medication (prescription drugs, supplements, vitamins, probiotics), bowel and dietary habits, and lifestyle. For the medication metadata class, only medication taken by ≥10% of the participants were included in further analysis (as described in Reynders et al.Citation7). Fatigue, anxiety, depression, and quality of life were assessed with the Fatigue Scale for Motor and Cognitive functions (FSMC) and Hospital Anxiety and Depression Scale (HADS) self-reporting questionnaires, respectively.
Biological variables
At baseline, a venous blood sampling was performed. EDTA tubes were centrifuged at 3500 rpm during 15 min at 3–5°C. Plasma supernatant was transferred to 1-ml cryotubes and stored at −80°C. Biomarker analyses were performed blinded to clinical data by a board-certified laboratory technician. Neurofilament light chain (NfL) and glial fibrillary acidic protein (GFAP) were determined using the Single-Molecule Array (Simoa®) HD-1 platform (Simoa® NF-light™ Advantage Kit; Quanterix, MA, USA) following manufacturer’s instructions. All samples were within the measurement range of the assays. High- and low-quality control (QC) samples were analyzed in duplicates in the beginning, middle and end of each run. Cortisone and testosterone levels were measured (in hair, approximately 15.5 mg was collected per participant) using Liquid Chromatography Mass Spectrometry (based on methodology described in Fiers et al.Citation31,Citation32) at the laboratory of Dr Tom Fiers (University of Ghent, Belgium).
Stool sample collection
Stool samples were collected at baseline and 3 months post-baseline. Fecal collection kits, consisting of a plastic tube (without stabilizing agents) into which fecal material was transferred with a spatula, were provided to participants during clinical consultation. Fecal samples were stored at −20°C immediately after sampling in the participants’ home freezer and were transferred in frozen condition to the NMSC or UZB within 48 h for storage at −80°C. In case of inpatient care at the NMSC, fecal samples of participants were immediately stored at −80°C. From there, fecal samples were transported on dry ice, without breaking the cold chain, to the Raes lab for processing. Participants were asked to note down date and time of stool sampling, time since last defecation, and the Bristol Stool Score immediately after defecation.
DNA extraction, library preparation, sequencing, preprocessing
Microbial DNA was extracted from frozen (−80°C) fecal aliquots (0.15–0.20 g) with the MagAttract PowerMicrobiome DNA/RNA kit (Qiagen), using a slightly altered protocol as described in Sabino et al.Citation33 and Falony et al.Citation20 Specifically, a 10-min heating (90°C) step was added before centrifugation to increase yield of extracted DNA.Citation20 Nucleic acid concentration was subsequently measured with DropQuant, after which the V4 region of the 16S rRNA gene was amplified with 515 F/806 R primers modified to contain Illumina adaptors and dual-index barcodes. PCR amplicons were quantified with Fragment Analyzer (Advanced Analytical Technologies) and sequenced on the Illumina MiSeq platform (V2 Reagent kit) to generate 250 bp paired-end reads. Sequencing reads were de-multiplexed with LotuSCitation34 (version 1.565) and processed further with the DADA2Citation35 pipeline (version 1.6.0), using the RDP classifierCitation36 version 2.12 for taxonomy assignment (default parameters).
Relative microbiome profiling
Samples were rarefied to 10,000 randomly selected reads, with exclusion of samples with <10 000 reads. Enterotyping (or community typing) was performed based on the Dirichlet-multinomial Model (DMM) approach in R (dmn function) as previously describedCitation37 on a combined genus-level abundance matrix containing the study samples as well as 1106 Flemish Gut Flora Project (FGFP)Citation20 samples to increase accuracy. The DMM method applies probabilistic models to bin samples into (a non-predetermined number of) clusters based on their similarity in microbiota composition. The Bayesian Information Criterion (BIC) was used to determine the optimal number of clusters (k = 4; minimum BIC = 429,086.9), and the probability for enterotype assignment was calculated for all samples. Mean probability ± standard deviation for community-type assignment was 0.97 ± 0.089. The four clusters were named after their enterotype-discriminating predominant taxa,Citation13 being Ruminococcaceae (Rum; 29% of samples), Prevotella (Prev; 17% of samples), and Bacteroides 1 and 2 (Bact1 and Bact2; 38% and 16% of samples, respectively).
Microbial load measurement by flow cytometry
Microbial load measurement was performed as described by Vandeputte et al.Citation13 and Vieira-Silva et al.Citation16 In short, frozen (−80°C) fecal aliquots were weighed [average weight ± standard deviation: 0.197 g ± 0.038] and dissolved in physiological solution to a total volume of 100 ml (8.5 g/l NaCl; VWR International). The fecal slurry was then diluted 10,000 times, and 2 ml per sample was filtered with a sterile syringe filter (5 µm pore size; Sartorius Stedim Biotech).
Next, 1 ml (2 replicates per sample) of the filtered microbial cell suspension was stained with SYBR Green (1:100 dilution in dimethyl sulfoxide, 10,000× concentrate, Thermo Fisher Scientific) and dark-incubated at 37°C for 15 min. Flow cytometry analysis was carried out using a C6 Accuri flow cytometer (BD Biosciences) following a previously published method.Citation13 Fluorescence events were monitored using the FL1 533/30 nm and FL >670 nm optical detectors, and forward and sideward-scattered light were collected as well. With BD Accuri CFlow software, microbial fluorescence events were gated and separated from background events on the FL1/FL3 density plot. A threshold value of 2 000 was applied on the FL1 channel. In order to obtain an accurate microbial cell count per sample, gated fluorescence events were evaluated on the forward and sideward density plot and remaining background events were excluded. Instrument and gating settings were kept identical for all samples (i.e. fixed staining/gating strategy; illustration of flow cytometry gating strategy can be found in supplementary figure 5). Fecal aliquot weight was used to convert microbial cell counts to microbial loads per gram of fecal material.
Quantitative microbiome profiling
Quantitative microbiome profiling (QMP) was carried out by combining sequencing data and microbial load calculation via flow cytometry, with procedures performed as described by Vandeputte et al.Citation13 and Vieira-Silva et al.Citation16 Briefly, samples were downsized to an even sampling depth, i.e. the ratio between sampling size (sequencing depth corrected for the number of 16S rRNA gene copies per genus) and microbial load (average total cell count per gram of frozen fecal aliquot). 16S rRNA gene copy numbers were extracted from the rRNA operon copy number database rrnDB.Citation38 The copy number-corrected sequencing depth per sample was then downsized to the level necessary to match the minimum observed sampling depth in the cohort. Samples with read counts <150 after rarefaction were excluded from QMP analyses. Rarefied genus abundances were subsequently converted to cell count per gram to obtain a QMP matrix.
Fecal moisture content
Fecal moisture content was obtained through lyophilization of frozen (−80°C), non-homogenized aliquots (0.1–0.2 g) and calculated as the percentage of lost mass after said process. Lyophilization of fecal samples was performed at the laboratory of Kristin Verbeke, KU Leuven, Belgium).
Fecal calprotectin levels
Concentration of fecal calprotectin was measured in frozen (−80°C) fecal aliquots (0.075–0.1 g) with the fCAL ELISA kit (Bühlmann) following manufacturer’s instructions. Based on the weight of the collected fecal aliquots, fecal calprotectin concentration was converted to µg/g.
Statistical analyses
All statistical analyses and graphical representations were performed in RCitation39 version 3.6.0, using packages phyloseq,Citation40 vegan,Citation41 DirichletMultinomial,Citation42 FSA,Citation43 ggplot2,Citation44 pROC,Citation45 rsq.Citation46 Multiple testing correction was applied where necessary using the Benjamini–Hochberg procedure (FDR), with significance defined as FDR < 0.1. All analyses were performed at genus level.
Analysis of metadata
Demographics were compared between groups and visits using Wilcoxon rank-sum and Wilcoxon signed-rank tests, respectively. Effect sizes for Wilcoxon-Rank Sum tests were calculated as the ratio of the obtained Z-statistic and the square root of the number of observations. Potential confounders were identified with Wilcoxon rank-sum and Kruskal–Wallis tests for numeric variables, and Chi-square tests for categorical variables.
Alpha and beta diversity
Measures of alpha diversity (i.e. observed richness, Simpson’s diversity index and Pielou’s evenness index) were determined with phyloseq and vegan packages. Microbiome inter-individual variation was visualized by principal coordinate analysis using Bray–Curtis dissimilarity on the genus-level abundance matrix. Vegan’s adonis function was used to test for differences in community structure between visits.
Associations with taxa and enterotypes
For genus abundance analysis, the following prevalence and abundance thresholds were set: only genera that were present in ≥20% of samples and with median relative abundance over all QMPs in which it was detected >1% were included. Taxa that were unclassified at genus level were excluded. Associations between enterotype (at baseline and 3 months post baseline) and disability accumulation were tested with (pairwise) Chi-square tests (chi.sq function). Generalized linear models (GLM; glm function) and subsequent log-likelihood tests were used to assess the significance of enterotype contribution to prediction of disability accumulation after factoring out effects of potential confounders. In these nested GLMs, disability accumulation (binomial, link = logit) was used as a response variable, while timed 25-foot walk, nine-hole peg test (non-dominant) scores at baseline were used as explanatory variables in the null model. In the alternative model, baseline enterotype was included as an additional explanatory variable. The same approach was used to evaluate whether the association between EDSS-Plus outcome and Bact2 prevalence was independent of NfL. GLM (partial) R2 values were determined with rsq’s rsq function. Receiver operating characteristic (ROC) curves and area under the curve (AUC) for regression models were obtained with pROC’s roc function. Risk ratio estimates and (their associated 95% confidence interval) were obtained using the odds_to_riskratio function of the effect size R package.
Inclusion and ethics
Study procedures were compliant with all relevant ethical regulations, aligning with the Declaration of Helsinki and Belgian privacy laws. Study procedures were approved by the medical ethics committee of the UZB (approval number B.U.N. 143201317985) and of the NMSC. Informed consent was obtained from all participants. The study protocol was registered at https://ClinicalTrials.gov under trial identifier NCT04929145.
Availability of data and materials
Raw 16S rRNA amplicon sequencing and selected host metadata will be available immediately following publication at the European Nucleotide Archive (ENA) via https://www.ebi.ac.uk/ena/browser/home under accession number PRJEB45550. Other individual de-identified participant data underlying the results reported in this article (text, tables, figures and appendix) will be shared upon reasonable request. Researchers who provide a methodologically sound proposal can request the data by contacting the corresponding authors.
Code availability
An open-source R script for obtaining QMP matrices is available on https://raeslab.org/software/QMP and the Github repository (https://github.com/raeslab/QMP).
Authors’ contributions
Laboratory experiments, flow cytometry analysis, preprocessing of raw sequencing data and statistical analyses were carried out by LD with guidance from GF and SVS. Cleaning of metadata was done by LD and AP. Clinical assessment of participants during study visits was performed by MD, AP and AVR. Patient data from in-between study visits was collected and quality checked by AP. Evaluation of sustained worsening for each patient was performed by AP. Sampling of cohorts was carried out by AVR. The study was designed by MD and JR, with help of JDK and GN. The manuscript was drafted by LD, AP, JR and MD, with critical revision by GF, SVS, JDK, GN. All authors approved the final version for publication.
Supplemental Material
Download MS Word (8 MB)Acknowledgments
We thank all study participants for their valuable contribution. We sincerely appreciate all who provided logistic support for sample collection (nurses and health practitioners in the National MS Center as well as Annick Van Merhaegen-Wieleman and Tatjana Reynders in University Hospital Brussels). We are grateful for the support of Chloë Verspecht, Duyen Nguyen, Leen Rymenans, Lindsey De Commer and other members of the Raes Lab for assistance in laboratory work and logistics or participation in helpful discussions. We thank Kristin Verbeke for facilitating measurements of moisture content in fecal samples.
Disclosure statement
JR, LD, MD, JDK, GF, SVS are inventors on the patent EP2018/084920: A new inflammation associated, low cell count enterotype issued to VIB VZW, Katholieke Universiteit Leuven, KU Leuven and Vrije Universiteit Brussel. JR is inventor on patent EP14184535.4 - 12/09/2014: Biological sampling and storage container, International patent application on 14/09/2015: PCT/EP2015/070977 issued to VIB VZW, Vrije Universiteit Brussel and LRD.
Supplementary material
Supplemental data for this article can be accessed online at https://doi.org/10.1080/19490976.2023.2180316
Additional information
Funding
References
- Cree BAC, Hollenbach JA, Bove R, Kirkish G, Sacco S, Caverzasi E, Bischof A, Gundel T, Zhu AH, Papinutto N, et al. Silent progression in disease activity–free relapsing multiple sclerosis. Ann Neurol. 2019;85(5):653–15. doi:10.1002/ana.25463.
- Bittner S, Oh J, Havrdová EK, Tintoré M, Zipp F. The potential of serum neurofilament as biomarker for multiple sclerosis. Brain. 2021;144:2954–2963. doi:10.1093/brain/awab241.
- Lee YK, Menezes JS, Umesaki Y, Mazmanian SK. Proinflammatory T-cell responses to gut microbiota promote experimental autoimmune encephalomyelitis. Proc Natl Acad Sci U S A. 2011;108(supplement_1):4615–4622. doi:10.1073/pnas.1000082107.
- Berer K, Mues M, Koutrolos M, Rasbi ZA, Boziki M, Johner C, Wekerle H, Krishnamoorthy G. Commensal microbiota and myelin autoantigen cooperate to trigger autoimmune demyelination. Nature. 2011;479(7374):538–541. doi:10.1038/nature10554.
- Berer K, Gerdes LA, Cekanaviciute E, Jia X, Xiao L, Xia Z, Liu C, Klotz L, Stauffer U, Baranzini SE, et al. Gut microbiota from multiple sclerosis patients enables spontaneous autoimmune encephalomyelitis in mice. Proc Natl Acad Sci U S A. 2017;114(40):10719–10724. doi:10.1073/pnas.1711233114.
- Mirza A, Forbes, J. D., Zhu, F., Bernstein, C. N., Van Domselaar, G., Graham, M. & Tremlett, H. The multiple sclerosis gut microbiota: a systematic review multiple sclerosis and related. Disord Vol. 2020;37:101427. Preprint at. doi:10.1016/j.msard.2019.101427.
- Reynders T, Devolder, L., Valles-Colomer, M., Van Remoortel, A., Joossens, M., De Keyser, J. & Raes, J. Gut microbiome variation is associated to multiple sclerosis phenotypic subtypes. Ann Clin Transl Neurol. 2020;7(4):406–419. doi:10.1073/pnas.1711233114.
- Tremlett H, Fadrosh, D. W., Faruqi, A. A., Hart, J., Roalstad, S., Graves, J. & Weinstock-Guttman, B. Gut microbiota composition and relapse risk in pediatric MS: a pilot study. J Neurol Sci. 2016;363:153–157. doi:10.1016/j.jns.2016.02.042.
- Nourbakhsh B, Bhargava P, Tremlett H, Hart J, Graves J, Waubant E. Altered tryptophan metabolism is associated with pediatric multiple sclerosis risk and course. Ann Clin Transl Neurol. 2018;5(10):1211–1221. doi:10.1002/acn3.637.
- Horton MK, McCauley K, Fadrosh D, Fujimura K, Graves J, Ness J, Wheeler Y, Gorman MP, Benson LA, Weinstock-Guttman B, et al. Gut microbiome is associated with multiple sclerosis activity in children. Ann Clin Transl Neurol. 2021;85(5):653–666. doi:10.1002/acn3.51441.
- Cosorich I, Dalla-Costa G, Sorini C, Ferrarese R, Messina MJ, Dolpady J, Radice E, Mariani A, Testoni PA, Canducci F, et al. High frequency of intestinal T H 17 cells correlates with microbiota alterations and disease activity in multiple sclerosis. Sci Adv. 2017;3(7). doi:10.1126/sciadv.1700492.
- Arumugam M, Raes J, Pelletier E, Le Paslier D, Yamada T, Mende DR, Fernandes GR, Tap J, Bruls T, Batto J-M, et al. Enterotypes of the human gut microbiome. Nature. 2011;473(7346):174–180. doi:10.1038/nature09944.
- Vandeputte D, Kathagen G, D’hoe K, Vieira-Silva S, Valles-Colomer M, Sabino J, Wang J, Tito RY, De Commer L, Darzi Y, et al. Quantitative microbiome profiling links gut community variation to microbial load. Nature. 2017;551(507):507–511. doi:10.1038/nature24460.
- Costea PI, Hildebrand F, Arumugam M, Bäckhed F, Blaser MJ, Bushman FD, De vos WM, Ehrlich S, Fraser CM, Hattori M, et al. Enterotypes in the landscape of gut microbial community composition. Nat Microbiol. 2017;3(1):8–16. doi:10.1038/s41564-017-0072-8.
- Valles-Colomer M, Falony G, Darzi Y, Tigchelaar EF, Wang J, Tito RY, Schiweck C, Kurilshikov A, Joossens M, Wijmenga C, et al. The neuroactive potential of the human gut microbiota in quality of life and depression. Nat Microbiol. 2019;4(4):623–632. doi:10.1038/s41564-018-0337-x.
- Vieira-Silva S, Sabino J, Valles-Colomer M, Falony G, Kathagen G, Caenepeel C, Cleynen I, van der Merwe S, Vermeire S, Raes J, et al. Quantitative microbiome profiling disentangles inflammation- and bile duct obstruction-associated microbiota alterations across PSC/IBD diagnoses. Nature Microbiol. 2019;4(11):1826–1831. Preprint at. doi:10.1038/s41564-019-0483-9.
- Vieira-Silva S, Falony G, Belda E, Nielsen T, Aron-Wisnewsky J, Chakaroun R, Forslund SK, Assmann K, Valles-Colomer M, Nguyen TTD, et al. Statin therapy is associated with lower prevalence of gut microbiota dysbiosis. Nature. 2020;581(7808):310–315. doi:10.1038/s41586-020-2269-x.
- Forslund SK, Chakaroun R, Zimmermann-Kogadeeva M, Markó L, Aron-Wisnewsky J, Nielsen T, Moitinho-Silva L, Schmidt TSB, Falony G, Vieira-Silva S, et al. Combinatorial, additive and dose-dependent drug–microbiome associations. Nature. 2021;600:500–505. doi:10.1038/s41586-021-04177-9.
- Falony G, Vandeputte D, Caenepeel C, Vieira-Silva S, Daryoush T, Vermeire S, Raes J. The human microbiome in health and disease: hype or hope. Acta Clinica Belgica Int J Clin Lab Med. 2019;74(2):53–64. doi:10.1080/17843286.2019.1583782.
- Falony G, Joossens, M., Vieira-Silva, S., Wang, J., Darzi, Y., Faust, K. & Raes, J. Population-level analysis of gut microbiome variation. Science (1979). 2016;352:560–564.
- Kappos L, Wolinsky JS, Giovannoni G, Arnold DL, Wang Q, Bernasconi C, Model F, Koendgen H, Manfrini M, Belachew S, et al. Contribution of relapse-independent progression vs relapse-associated worsening to overall confirmed disability accumulation in typical relapsing multiple sclerosis in a pooled analysis of 2 randomized clinical trials. JAMA Neurol. 2020;77(9):1132–1140. doi:10.1001/jamaneurol.2020.1568.
- Ochoa-Reparaz J, Mielcarz DW, Ditrio LE, Burroughs AR, Begum-Haque S, Dasgupta S, Kasper DL, Kasper LH. Central nervous system demyelinating disease protection by the human commensal bacteroides fragilis depends on polysaccharide A expression. J Immunol. 2010;185(7):4101–4108. doi:10.4049/jimmunol.1001443.
- Katz Sand I, Zhu Y, Ntranos A, Clemente JC, Cekanaviciute E, Brandstadter R, Crabtree-Hartman E, Singh S, Bencosme Y, Debelius J, et al. Disease-modifying therapies alter gut microbial composition in MS. Neurol Neuroimmunol Neuroinflamm. 2019;6(1):1–13. doi:10.1212/NXI.0000000000000517.
- Tremlett H, Fadrosh, D. W., Faruqi, A. A., Zhu, F., Hart, J., Roalstad, S. & Weinstock‐Guttman, B. Gut microbiota in early pediatric multiple sclerosis: a case-control study. Eur J Neurol. 2016;23:1308–1321. doi:10.1111/ene.13026.
- Horton MK, McCauley K, Fadrosh D, Fujimura K, Graves J, Ness J, Wheeler Y, Gorman MP, Benson LA, Weinstock-Guttman B, et al. Gut microbiome is associated with multiple sclerosis activity in children. Ann Clin Transl Neurol. 2021;8(9):1867–1883. doi:10.1002/acn3.51441.
- Cadavid D, Cohen, J. A., Freedman, M. S., Goldman, M. D., Hartung, H. P., Havrdova, E. & Mikol, D. The EDSS-Plus, an improved endpoint for disability progression in secondary progressive multiple sclerosis. Mult Scler. 2017;23:94–105. doi:10.1177/1352458516638941.
- Polman CH, Reingold SC, Banwell B, Clanet M, Cohen JA, Filippi M, Fujihara K, Havrdova E, Hutchinson M, Kappos L, et al. Diagnostic criteria for multiple sclerosis: 2010 Revisions to the McDonald criteria. Ann Neurol. 2011;69(2):292–302. doi:10.1002/ana.22366.
- Kurtzke JF. Rating neurologic impairment in multiple sclerosis: an expanded disability status scale (EDSS) EDSS. Neurology. 1983;33(11): 1444. doi:10.1212/WNL.33.11.1444.
- Feys P, Lamers I, Francis G, Benedict R, Phillips G, LaRocca N, Hudson LD, Rudick R. The nine-hole peg test as a manual dexterity performance measure for multiple sclerosis. Mult Scler. 2017;23(5):711–720. doi:10.1177/1352458517690824. Preprint at.
- Motl RW, Cohen JA, Benedict R, Phillips G, LaRocca N, Hudson LD, Rudick R. Validity of the timed 25-foot walk as an ambulatory performance outcome measure for multiple sclerosis. Mult Scler. 2017 SAGE Publications Ltd;23(5):704–710. doi:10.1177/1352458517690823.
- Fiers T, Delanghe J, T’Sjoen G, Van Caenegem E, Wierckx K, Kaufman J-M. A critical evaluation of salivary testosterone as a method for the assessment of serum testosterone. Steroids. 2014;86:5–9. doi:10.1016/j.steroids.2014.04.013.
- Janssens H, Clays E, Fiers T, Verstraete AG, de Bacquer D, Braeckman L. Hair cortisol in relation to job stress and depressive symptoms. Occup Med (Chic Ill). 2017;67(2):114–120. doi:10.1093/occmed/kqw114.
- Sabino J, Vieira-Silva S, Machiels K, Joossens M, Falony G, Ballet V, Ferrante M, Van Assche G, Van der Merwe S, Vermeire S, et al. Primary sclerosing cholangitis is characterised by intestinal dysbiosis independent from IBD. Gut. 2016;65(10):1681–1689. doi:10.1136/gutjnl-2015-311004.
- Hildebrand F, Tadeo R, Voigt AY, Bork P, LotuS: RJ. An efficient and user-friendly OTU processing pipeline. Microbiome. 2014;2(30). doi:10.1186/2049-2618-2-30.
- Callahan BJ, McMurdie PJ, Rosen MJ, Han AW, Johnson AJA, Holmes SP. DADA2: high-resolution sample inference from Illumina amplicon data. Nat Methods. 2016;13(7):581–583. doi:10.1038/nmeth.3869.
- Wang Q, Garrity GM, Tiedje JM, Cole JR. Naıve Bayesian classifier for rapid assignment of rRNA sequences.pdf. Appl Environ Microbiol. 2007;73:5261–5267. doi:10.1128/AEM.00062-07.
- Holmes I, Harris K, Quince C. Dirichlet multinomial mixtures: generative models for microbial metagenomics. PLoS One. 2012;7(2):e30126. doi:10.1371/journal.pone.0030126.
- Stoddard SF, Smith BJ, Hein R, Roller BRK, Schmidt T. M. rrnDB: improved tools for interpreting rRNA gene abundance in bacteria and archaea and a new foundation for future development. Nucleic Acids Res. 2015;43:D593–D598. doi:10.1093/nar/gku1201.
- R Core Team. R: a Language and Environment for Statistical Computing. R Foundation for Statistical Computing, Vienna. 2011.
- McMurdie PJ, Holmes S, Watson M. Phyloseq: an R package for reproducible interactive analysis and graphics of microbiome census data. PLoS One. 2013;8(4):e61217. doi:10.1371/journal.pone.0061217.
- Oksanen J, Simpson G, Blanchet F, Kindt R, Legendre P, Minchin P, O’hara R. vegan: community ecology package. R package version 2.6-4. 2022. https://CRAN.R-project.org/package=vegan.
- Morgan M. DirichletMultinomial: Dirichlet-Multinomial Mixture Model Machine Learning for Microbiome Data. Bioconductor version 1.20.0. 2017. http://bioconductor.org/packages/release/bioc/html/DirichletMultinomial.html
- Ogle DH, Doll JC, Wheeler AP, Dinno A. FSA: Fisheries Stock Analysis. R package version 0.9.3. 2022. https://CRAN.R-project.org/package=FSA
- Wickham H. ggplot2 - Elegant graphics for data analysis | Hadley Wickham | Springer. New York, USA: Springer Science & Business Media. 2017.
- Robin X, Turck N, Hainard A, Tiberti N, Lisacek F, Sanchez J-C, Müller M. pROC: an open-source package for R and S+ to analyze and compare ROC curves. BMC Bioinform. 2011;12(1). doi:10.1186/1471-2105-12-77.
- Zhang D. rsq: R-Squared and Related Measures. R package version 2.5. 2021. https://CRAN.R-project.org/package=rsq