
ABSTRACT
The mouse cecum has emerged as a model system for studying microbe-host interactions, immunoregulatory functions of the microbiome, and metabolic contributions of gut bacteria. Too often, the cecum is falsely considered as a uniform organ with an evenly distributed epithelium. We developed the cecum axis (CecAx) preservation method to show gradients in epithelial tissue architecture and cell types along the cecal ampulla-apex and mesentery-antimesentery axes. We used imaging mass spectrometry of metabolites and lipids to suggest functional differences along these axes. Using a model of Clostridioides difficile infection, we show how edema and inflammation are unequally concentrated along the mesenteric border. Finally, we show the similarly increased edema at the mesenteric border in two models of Salmonella enterica serovar Typhimurium infection as well as enrichment of goblet cells along the antimesenteric border. Our approach facilitates mouse cecum modeling with detailed attention to inherent structural and functional differences within this dynamic organ.
Introduction
Mouse models are indispensable for studying gastrointestinal physiology and infection pathogenesis. The histological and cellular differences along both the small intestine and the colon have been characterized extensively and show remarkable variability with implications for gastrointestinal disease pathology.Citation1 Accordingly, histological preparations of the mouse intestine and colon often involve the Swiss roll technique enabling comprehensive analysis of the entire bowel segment length in one section.Citation2 The mouse cecum has recently been highlighted as a critical site for microbe-host-metabolite interactions,Citation3,Citation4 but much less is known about its histological topology. To our knowledge, no tissue preparation for the cecum has been described that is comparable to the Swiss roll.
The cecum collects intestinal contents from the small intestine before they pass into the colon. In rodents, the cecum is easily distinguished from that of humans because of its relatively large size. Some postulate the size of the cecum is directly proportional to an animal’s ability to ferment complex carbohydrates.Citation5 In addition to nutritional functions, the cecum likely has a critical role in immune system maintenance and bacterial defense.Citation6,Citation7 Studies of Clostridioides difficile (C. difficile) infection using transoral spore-gavage in C57Bl/6J mice consistently show more epithelial damage and edema in the cecum than the colon or small intestine.Citation8,Citation9 These observations led us to question whether the mouse cecum contained pathological and/or physiological gradients across anatomic axes similar to the colon and small intestine.
We devised a simple and reproducible procedure called CecAx, for cecum axis preservation, to maintain the anatomic orientation of the mouse cecum for histopathological analysis. In the healthy mouse and during infection with either C. difficile or Salmonella enterica serovar Typhimurium (S. Tm), we observe gradients in tissue architecture, metabolism, and cell type. Specifically, we show that crypt depth is greatest at the ampulla and along the mesenteric border of the cecum. With imaging mass spectrometry, we demonstrate how metabolites and lipids have a gradation of abundance in healthy mice. During C. difficile infection, edema and inflammatory infiltration predominate at the mesenteric border of the cecum. However, goblet cells are enriched at the antimesenteric border in mice infected with S. Tm. The CecAx method enables careful comparisons across animals within the same anatomical regions of the cecum.
Results
Cecum axis (CecAx) preservation
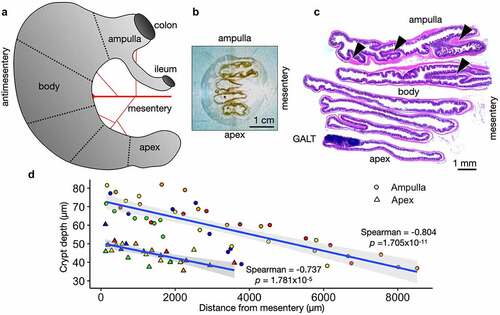
Our preparation of the mouse cecum maintains the anatomical orientation of the ampulla-apex axis and mesentery-antimesentery axis (). The harvested, washed, and fixed mouse ceca were cut into pieces (dotted lines, ), and the pieces were aligned with the cut edges down and the mesentery to the right (). The CecAx preservation method uniquely enables precise comparisons of specific regions within this large organ. Immediately, we observed the gut-associated lymphoid tissue (GALT) was not only found most commonly at the apex but always found at the antimesenteric side (), which has been previously described in the small intestine.Citation10 Transverse folds were more numerous and longer toward the ampulla and mesenteric side (arrowheads, ). We measured crypts from 5 wild-type C57Bl/6J adult mice and observed longer crypt depth in the ampulla compared to the apex. Furthermore, we observed longer crypt depth near the mesentery compared to the antimesentery (). These measurements did not include the crypts adjacent to GALT, which appeared much longer but often not completely visible in a single tissue section.
Figure 1. Cecum Axis (CecAx) preservation maintains both the ampulla-apex and mesentery-antimesentery axis and reveals histological gradients in epithelial crypt depth. A) Schematic of the mouse cecum with the ampulla, body, and apex of the cecum depicting the vascular bed attached to the mesenteric lesser curvature opposite from the antimesenteric greater curvature. B) Photograph of a faced tissue block showing formalin-fixed paraffin-embedded mouse cecum. C) Stitched brightfield microscopy images of H&E-stained mouse cecum show how the CecAx preservation technique yielded well-oriented tissue sections with respect to both epithelial crypts and organ anatomy. Arrowheads show examples of transverse folds. D) Individual measurements of crypt depth and distance from the mesentery in both the ampulla and apex of wild-type C57Bl/6J mice. The plot shows a negative correlation between depth and distance from the mesentery and shows that crypts were deeper in the ampulla compared to the apex. Crypts next to GALT are excluded (n = 5 mice; colors represent individual mice, Spearman’s rank correlation rho with p-value shown).
To determine if differences in proliferative cells account for the crypt depth gradient, we performed immunofluorescence and immunoblotting to detect Ki67+ cells and CyclinD1, respectively (Supp. ). There were no discernable changes in these proliferation markers between the different cecal regions. To characterize tuft cell and enteroendocrine cell distribution, we stained wild-type C57Bl/6J mouse cecal tissues with antibodies against Dclk1 and ChromograninA, respectively. We observed more tuft cells at the antimesenteric border compared with the mesenteric border (Supp. ) and increased enteroendocrine cells in the ampulla compared to the apex (Supp. ).
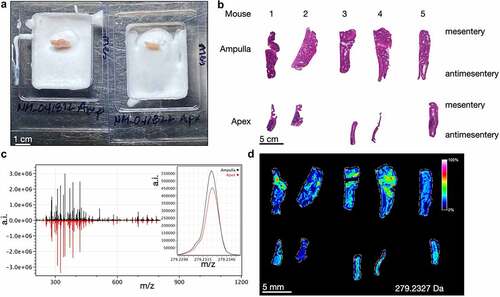
Figure 2. Imaging mass spectrometry of normal mouse cecum shows anatomic gradients of metabolites. A) the cecum ampulla (left) and apex (right) of a healthy adult C57Bl/6J mouse are shown after flash freezing and partial embedding in OCT. The mesenteric side is oriented to the right. B) Images of H&E stained serial mouse ceca sections with identical orientation to the sections imaged via imaging mass spectrometry in D. C) Averaged spectral intensities for 5 ampulla (black, top) and 5 apices (red, bottom). The inset shows a narrow portion of the averaged spectra for 279.233 Da. D) Heatmap showing spatial distribution of the intensity of a signal at m/z 279.233 Da, which putatively represents linoleate. a.i. = arbitrary intensity, m/z = mass/charge.
Metabolic gradients revealed by imaging mass spectrometry
To determine if these histological gradients correlate with physiological differences, we chose the unbiased approach of imaging mass spectrometry for metabolites and lipids. We were inspired by a similar approach recently performed using gerbil stomachs to study Helicobacter pylori.Citation11 Wild-type, adult C57Bl/6J mouse ceca were cut into pieces as in . Ampulla and apex pieces were flash frozen before partial embedding in optimal cutting temperature media (). This technique enables unfixed, unembedded tissues to be sectioned onto a single slide for matrix application and imaging.Citation11 Additional H&E-stained sections were obtained post-imaging alignment (). The mass spectral intensities (arbitrary intensity, a.i.) from each ampulla piece were averaged and compared to the averaged spectra from apex pieces (). Overall, the signal intensities and distributions are similar, however there are unique differences that may be related to tissue region. One example is the signal at m/z 279.233 Da, tentatively identified as linoleate via accurate mass, which has a higher signal in the ampulla compared to apex tissues. Linoleate is a medium-chain unsaturated omega-6 fatty acid implicated in infectious and inflammatory colitis ( inset and 2D).Citation12,Citation13 The distribution for this lipid is predominantly epithelial with highest accumulation toward the mesentery. The full spectra for each of the 10 tissues are shown in , and the raw data are available in Supplementary Table 1 (ampulla tissues) and Supplementary Table 2 (apex tissues).
Edema and inflammation are greater at the mesentery in C. difficile infection
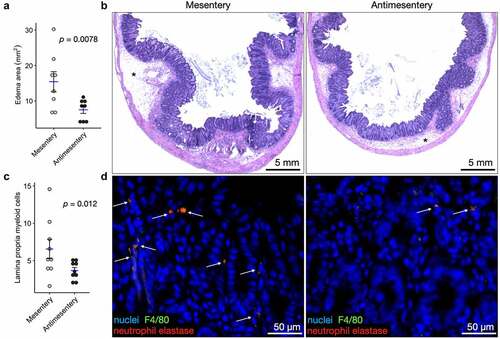
We questioned whether any histological differences were present during disease. Mice infected with C. difficile had ceca that were consistently more edematous toward the mesentery compared to the antimesentery (). Edema was not observed under or next to GALT in any mouse. Inflammation was measured by the number of myeloid cells in the lamina propria, and average cells per high-power field (HPF) were higher at the mesentery compared to the antimesentery (). We observed myeloid cells as having double-positive staining by immunofluorescence for antibodies against F4/80 and neutrophil elastase. Based on review of the H&E images, the majority of these myeloid cells had a polymorphonuclear appearance.
Figure 3. Difficile infection induces a gradient of edema and inflammation along the mesentery-antimesentery axis. A) Quantification of edema during C. difficile infection. Each point represents the average edema area at the mesentery and antimesentery from one mouse, n = 8. B) H&E images depicting edema area (asterisks, *) at the mesenteric and antimesenteric border. C) Quantification of inflammatory infiltration as measured by the number of myeloid cells (predominantly neutrophils) in the lamina propria per HPF (20×). Each point represents the average number of lamina propria myeloid cells at the mesentery and antimesentery from one mouse, n = 8. D) Immunofluorescence microscopy images show double-positive (orange represents the colocalization of F4/80 and neutrophil elastase staining) myeloid cells in the lamina propria. p-values shown from paired Wilcoxon signed-rank exact test.
Opposite distribution of edema and goblet cells in S. tm infection
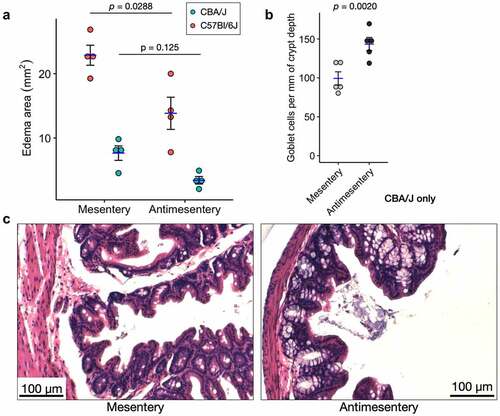
To determine the generalizability of these pathological gradients, we examined the same parameters in both C57Bl/6J and CBA/J genetic backgrounds of mice infected with S. Tm. It is well known that S. Tm preferentially affects M cells in the follicle-associated epithelium on GALT.Citation14,Citation15 To the best of our knowledge, no reports have described other histopathological differences with respect to the cecum axes in this infection. As was the case with C. difficile, we see greater edema at the mesenteric side compared to the antimesentery after S. Tm infection. While both models showed an apparent difference, only the C57Bl/6J model was statistically significant (). In the CBA/J model, but not C57Bl/6J, we observed more goblet cells per mm of crypt depth along the antimesentery (including crypts near GALT) compared to the mesentery ().
Figure 4. Two different S. Tm infection models show differential pathology along the mesentery-antimesentery axis. A) Quantification of edema area as measured in for C57Bl/6J and CBA/J models of S. Tm infection, n = 4 mice for each model. p-values are shown from a paired, two-tailed T-test. B) Quantification of goblet cell number shows higher average abundance at the antimesentery compared to mesentery of CBA/J mice, n = 5 mice. Because crypt depths are variable, we normalized the number of goblet cells per mm of their resident crypt depth. p-value shown from paired Wilcoxon signed-rank exact test. C) H&E images from S. Tm-infected CBA/J mice depicting differences in goblet cell density.
Discussion
CecAx preservation maintains the ampulla-apex axis and mesentery-antimesentery axis for histopathological analysis of the mouse cecum (). The preparation method can be applied to other rodent models and potentially the human appendix. There is no consensus agreement on the essential function of the mouse cecum or the human appendix. Hypotheses for their function range from immune regulation to microbiome maintenance to anaerobic fermentation.Citation16 While our method alone does not resolve this question, it emphasizes the importance of spatial relationships in the gastrointestinal system as critical parameters for understanding host physiology and bacterial infection. Furthermore, CecAx preservation is similar to the intestine Swiss roll for avoiding the potential pitfall of comparing different cecal regions across mice and drawing false conclusions.
In gastrointestinal physiology and pathology, increased crypt depth is often correlated to increased proliferation rate.Citation17 Our experiments show a two-fold difference in crypt depth between the mesenteric ampulla and antimesenteric apex (). However, we do not observe proliferation differences between cecal regions. Perhaps at earlier stages of development, mice might exhibit region-specific proliferative changes. Alternatively, there might be different rates of cell death accounting for the crypt depth gradient. We detect gradients of tuft cell and enteroendocrine cell abundance. The predominance of tuft cells along the antimesenteric border may be a reflection of their apparent enrichment near GALT (Supp. ). Increased IL-13 from group 2 innate lymphoid cells induces tuft cell differentiation,Citation18 which could be a mechanism underlying our observation.
Using the unbiased approach of imaging mass spectrometry, we have created a spectral map for putative metabolites and lipids in the adult wild-type C57Bl/6J mouse cecum. This resource is available in the Supplementary Material (Supp. Tables 1 & 2). A signal at m/z 279.233, tentatively corresponding to linoleic acid (18:2), was found to be differentially expressed in the mouse cecal epithelium (). It is an essential omega-6 fatty acid precursor for arachidonic acid, which is converted by cyclooxygenase enzymes into prostaglandins and eicosanoids with a wide range of homeostatic and immunoregulatory functions in the gut.Citation12 And, it illustrates how functional molecules are unevenly distributed along gradients in the ampulla-apex axis and mesentery-antimesentery axis.
Multiple models of C. difficile infection have identified the mouse cecum as the organ with the highest bacterial load and pathological tissue injury.Citation9,Citation19 Here, we used CecAx preservation to carefully characterize the edema and acute inflammatory response with respect to cecal anatomy. The increased edema and myeloid cell infiltration at the mesentery compared to the antimesentery might be related to the location of bacteria in the lumen or host tissue. It could also be a result of the proximity to more vasculature. The mouse cecum is vascularized via a branch from the superior mesenteric artery. Smaller branches from the same main artery supply the proximal colon and distal ileum.Citation5 Mechanistic experiments to test these hypotheses and determine cause-effect relationships are a part of more complex, ongoing studies.
Similar to C. difficile infection, examination of the S. Tm-infected mouse ceca shows increased edema at the mesentery compared to the antimesentery. This observation demonstrates the robustness of the CecAx preservation method and the consistency of the differential edema phenotype. Interestingly, S. Tm preferentially infects follicle-associated epithelium found along the antimesenteric boarder exclusively, but the edema is most pronounced at the mesenteric boarder. This relationship suggests the vascular location may have a greater impact on the amount of edema than the location of infection. In the CBA/J mouse model of S. Tm infection, the enrichment of goblet cells along the antimesentery demonstrates the existence of opposing gradients along this axis. It is not clear if there is a functional relationship between edema and goblet cells.
In summary, we show a simple and robust method for CecAx preservation. We also present evidence for why careful attention must be given to cecal anatomy when examining differences in proliferation, metabolite abundance, inflammation, edema, or cell type distribution.
Materials and methods
Animals
All mice were maintained in an AAALAC-accredited facility and procedures were performed using protocols approved by the Institutional Animal Care and Use Committee. All mice were purchased from The Jackson Laboratory. C. difficile infections were performed as described previously.Citation8 Specifically, C57Bl6/J mice were challenged with either 1 × 10 spores or 1 × 10 spores from the R20291 strain and euthanized 4 days or 2 days after infection, respectively. S. Tm infections were performed as described previously.Citation20 Specifically, C57BL/6J mice were given 5 g/L streptomycin in the drinking water on day zero. Regular water was given on day 2 followed by infection with S. Tm IR715 (1 × 10Citation9 CFU) on day 3. Mice were euthanized on day 6, and cecal tissue was collected. CBA/J mice were orally inoculated with 1 × 10Citation9 CFU of S. Tm IR715 without any pre-treatment. Five days after infection, ceca were collected for formalin fixation and paraffin embedding. Facilities are regularly tested for pathogens and stocked with clean bedding and free access to food and water. Mice had 12-h cycles of light and dark.
CecAx preservation
To maintain the orientation of each axis, ceca were harvested, washed, and fixed with careful attention to their anatomic regions. Ampulla, body, and apex pieces were cut in the same fashion as depicted in . The cut side was always placed down into a cryomold or tissue cassette for flash freezing or paraffin embedding, respectively. The mesentery was always aligned to the right side and labeled. Confirmation of the mesenteric orientation was typically possible with microscopic visualization of large vessels attached to the serosal surface (seen in the cecal body pieces of ).
Tissue staining and imaging
Tissue was sectioned at 5 μm thickness onto Superfrost Plus microscopy slides (Fisher Scientific). Deparaffinization, rehydration, H&E staining, and immunofluorescence were performed as previously described.Citation21 Antibodies for immunofluorescence were anti-neutrophil elastase-AF555 (#bs-6982 R-A555, Bioss USA), anti-Ki67 (#652402, BioLegend), anti-chromograninA-Cy7 (#sc393941, SantaCruz), anti-Dclk1-Cy3 (#ab187184, Abcam), anti-CyclinD1 (#ab134175, Abcam), and anti-F4/80 (#MF48000, ThermoFisher) with anti-rat-488 (#405418, BioLegend) or anti-rat 555 (#405420, BioLegend). Images were obtained on Keyence BZ-X800 or Leica EVOS microscopes. Tissue area and histology measurements were performed in ImageJ2.Citation22
Imaging mass spectrometry
C57Bl/6J wild-type adult mouse ceca were harvested and washed in ice cold phosphate-buffered saline. Tissue was flash frozen and partially embedded in OCT compound (Tissue-Tek). Tissue was sectioned at 12 μm thick on a cryostat (Leica Biosystems). MALDI matrix (9-aminoacridine, 9AA) (Sigma-Aldrich) was spray-coated onto the target slides in an automated fashion using a TM Sprayer (HTX Imaging). 9-AA was made up as a 5 mg/ml solution in 90% methanol. Four passes were used with a nozzle temperature of 85°C, a flow-rate of 0.15 ml/min, 2-mm track spacing, and a stage velocity of 700 mm/min. Nitrogen was used as the nebulization gas and was set to 10 psi. Images were acquired on a 15T Fourier transform ion cyclotron resonance mass spectrometer (FT-ICR MS, Solarix, Bruker Daltonics) equipped with an Apollo II dual ion source and Smartbeam II 2 kHz Nd:YAG laser that was frequency tripled to 355 nm. Data were collected in the negative ion mode with the laser operating at 2 kHz at 75 μm resolution. Tentative metabolite identifications were made by accurate mass, typically better than 1 ppm. Images were analyzed with flexImaging software (Bruker), while average spectra were exported to mMass for visualization of differences.Citation23
Statistical analysis
Data were plotted and tested for statistical significance using the following packages: ggplot2, ggpubr, rstatix, and tidyverse in R version 3.6.3.Citation24–28 Spearman’s rank correlation was performed for crypt depth and distance from the mesentery. The paired Wilcoxon signed rank exact test was used to compare two groups from non-parametric data, and the paired T-test was used to compare two groups from parametric data. Statistical significance was defined as p < 0.05.
Supplemental Material
Download Zip (131.1 MB)Acknowledgments
Core Services performed through the Digestive Disease Research Center were supported by NIH grant P30DK058404. We acknowledge the Translational Pathology Shared Resource supported by NCI/NIH Cancer Center Support Grant 5P30 CA68485-19. The Imaging Mass Spectrometry work was performed in the Imaging Mass Spectrometry Core (IMSC) at Vanderbilt University.
Disclosure statement
We have no financial disclosures or conflicts of interest. The contents do not represent the views of the U.S. Department of Veterans Affairs or the United States Government.
Supplementary data
Supplemental data for this article can be accessed online at https://doi.org/10.1080/19490976.2023.2185029
Additional information
Funding
References
- Burclaff J, Bliton RJ, Breau KA, Ok MT, Gomez-Martinez I, Ranek JS, Bhatt AP, Purvis JE, Woosley JT, Magness ST. A proximal-to-distal survey of healthy adult human small intestine and colon epithelium by single-cell transcriptomics. Cell Mol Gastroenterology Hepatology, 2022;13(5):1554–9. doi:10.1016/j.jcmgh.2022.02.007.
- Moolenbeek C, Ruitenberg EJ. The ‘Swiss roll’: a simple technique for histological studies of the rodent intestine. Lab Anim, 1980;15(1):57–60. doi:10.1258/002367781780958577.
- Zaborin A, Krezalek M, Hyoju S, Defazio JR, Setia N, Belogortseva N, Bindokas VP, Guo Q, Zaborina O, Alverdy JC. Critical role of microbiota within cecal crypts on the regenerative capacity of the intestinal epithelium following surgical stress. Am J Physiology Gastroenterology Liver, 2017;312(2):G112–22. doi:10.1152/ajpgi.00294.2016.
- Zaborin A, Bernabe BP, Keskey R, Sangwan N, Hyoju S, Gottel N, Gilbert JA, Zaborina O, Alverdy JC, Cotter PD Spatial compartmentalization of the microbiome between the lumen and crypts is lost in the murine cecum following the process of surgery, including overnight fasting and exposure to antibiotics. mSystems 2020; 5:e00377–20. 3 10.1128/mSystems.00377-20
- Snipes RL. Anatomy of the cecum of the laboratory mouse and rat. Anat Embryol (Berl), 1981;162(4):455–474. doi:10.1007/BF00301871.
- Brown K, Abbott DW, Uwiera RRE, Inglis GD. Removal of the cecum affects intestinal fermentation, enteric bacterial community structure, and acute colitis in mice. Gut Microbes, 2018;9:218–235. doi:10.1080/19490976.2017.1408763.
- Smith HF, Parker W, Kotzé SH, Laurin M. Morphological evolution of the mammalian cecum and cecal appendix. Cr Palevol, 2017;16(1):39–57. doi:10.1016/j.crpv.2016.06.001.
- Markham NO, Bloch SC, Shupe JA, Laubacher EN, Thomas AK, Kroh HK, Childress KO, Peritore-Galve FC, Washington MK, Coffey RJ, et al. Murine intrarectal instillation of purified recombinant clostridioides difficile toxins enables mechanistic studies of pathogenesis. Infect Immun, 2021;89(4):89. doi:10.1128/IAI.00543-20.
- Chen X, Katchar K, Goldsmith JD, Nanthakumar N, Cheknis A, Gerding DN, Kelly CP. A mouse model of clostridium difficile–associated disease. Gastroenterology, 2008;135(6):1984–1992. doi:10.1053/j.gastro.2008.09.002.
- Hamada H, Hiroi T, Nishiyama Y, Takahashi H, Masunaga Y, Hachimura S, Kaminogawa S, Takahashi-Iwanaga H, Iwanaga T, Kiyono H, et al. Identification of multiple isolated lymphoid follicles on the antimesenteric wall of the mouse small intestine. J Immunol, 2002;168(1):57–64. doi:10.4049/jimmunol.168.1.57.
- Lin AS, Shuman JHB, Kotnala A, Shaw JA, Beckett AC, Harvey JL, Tuck M, Dixon BREA, Reyzer ML, Algood HMS, et al. Loss of corpus-specific lipids in helicobacter pylori-induced atrophic gastritis. mSphere 2021; 6:e00826–21. 6 10.1128/mSphere.00826-21
- Liu T, Tang X, Cui Y, Xiong X, Xu Y, Hu S, Feng S, Shao L, Ren Y, Miao H, et al. Fibroblast growth factor 19 improves lps-induced lipid disorder and organ injury by regulating metabolomic characteristics in mice. Oxid Med Cell Longev, 2022;2022:9673512. doi:10.1155/2022/9673512.
- Romagnolo DF, Donovan MG, Doetschman TC, Oi S. N-6 linoleic acid induces epigenetics alterations associated with colonic inflammation and cancer. Nutrients, 2019;11(1):171. doi:10.3390/nu11010171.
- Jones BD, Ghori N, Falkow S. Salmonella typhimurium initiates murine infection by penetrating and destroying the specialized epithelial M cells of the peyer’s patches. J Exp Medicine, 1994;180(1):15–23. doi:10.1084/jem.180.1.15.
- Tahoun A, Mahajan S, Paxton E, Malterer G, Donaldson DS, Wang D, Tan A, Gillespie TL, O’shea M, Roe AJ, et al. Salmonella transforms follicle-associated epithelial cells into m cells to promote intestinal invasion. Cell Host Microbe, 2012;12(5):645–656. doi:10.1016/j.chom.2012.10.009.
- Collard MK, Bardin J, Laurin M, Ogier-denis E. The cecal appendix is correlated with greater maximal longevity in mammals. J Anat, 2021;239(5):1157–1169. doi:10.1111/joa.13501.
- Barker N, van EJ, Kuipers J, Kujala P, van den BM, Cozijnsen M, Haegebarth A, Korving J, Begthel H, Peters PJ, et al. Identification of stem cells in small intestine and colon by marker gene Lgr5. Nature, 2007;449(7165):1003–1007. doi:10.1038/nature06196.
- von MJ, Ji M, Liang H-E, Locksley RM. Tuft-cell-derived IL-25 regulates an intestinal ILC2–epithelial response circuit. Nature, 2016;529(7585):221–225. doi:10.1038/nature16161.
- Theriot CM, Koumpouras CC, Carlson PE, Bergin AD II, Young VB. Cefoperazone-treated mice as an experimental platform to assess differential virulence of clostridium difficile strains. Gut Microbes, 2011;2(6):326–334. doi:10.4161/gmic.19142.
- Shelton CD, Yoo W, Shealy NG, Torres TP, Zieba JK, Calcutt MW, Foegeding NJ, Kim D, Kim J, Ryu S, et al. Salmonella enterica serovar Typhimurium uses anaerobic respiration to overcome propionate-mediated colonization resistance. Cell Rep, 2022;38(1):110180. doi:10.1016/j.celrep.2021.110180.
- Drewes JL, Chen J, Markham NO, Knippel RJ, Domingue JC, Tam AJ, Chan JL, Kim L, McMann M, Stevens C, et al. Human colon cancer–derived clostridioides difficile strains drive colonic tumorigenesis in mice. Cancer Discov, 2021;12(8):1873–1885. doi:10.1158/2159-8290.CD-21-1273.
- Schindelin J, Arganda-Carreras I, Frise E, Kaynig V, Longair M, Pietzsch T, Preibisch S, Rueden C, Saalfeld S, Schmid B, et al. Fiji: an open-source platform for biological-image analysis. Nat Methods, 2012;9(7):676–682. doi:10.1038/nmeth.2019.
- Strohalm M, Hassman M, Košata B, Kodíček M. mMass data miner: an open source alternative for mass spectrometric data analysis. Rapid Commun Mass Spectrom, 2008;22(6):905–908. doi:10.1002/rcm.3444.
- Wickham H. Ggplot2: elegant graphics for data analysis. New York: Springer-Verlag; 2016.
- Kassambara AG: “ggplot2” Based Publication Ready Plots. 2020; Available from: https://cran.r-project.org/web/packages/ggpubr/index.html
- Kassambara A. Rstatix: pipe-friendly framework for basic statistical tests [Internet]. 2020. Available from: https://cran.r-project.org/web/packages/rstatix/index.html
- Wickham H, Averick M, Bryan J, Chang W, McGowan L, François R, Grolemund G, Hayes A, Henry L, Hester J, et al. Welcome to the Tidyverse. J Open Source Softw, 2019;4(43):1686. doi:10.21105/joss.01686.
- Team RC. R: a language and environment for ## statistical computing [Internet]. Vienna, Austria: R Foundation for Statistical Computing; 2020. Available fromhttps://www.R-project.org/