
ABSTRACT
Pathogenic enteric Escherichia coli present a significant burden to global health. Food-borne enteropathogenic E. coli (EPEC) and Shiga toxin-producing E. coli (STEC) utilize attaching and effacing (A/E) lesions and actin-dense pedestal formation to colonize the gastrointestinal tract. Talin-1 is a large structural protein that links the actin cytoskeleton to the extracellular matrix though direct influence on integrins. Here we show that mice lacking talin-1 in intestinal epithelial cells (Tln1Δepi) have heightened susceptibility to colonic disease caused by the A/E murine pathogen Citrobacter rodentium. Tln1Δepi mice exhibit decreased survival, and increased colonization, colon weight, and histologic colitis compared to littermate Tln1fl/fl controls. These findings were associated with decreased actin polymerization and increased infiltration of innate myeloperoxidase-expressing immune cells, confirmed as neutrophils by flow cytometry, but more bacterial dissemination deep into colonic crypts. Further evaluation of the immune population recruited to the mucosa in response to C. rodentium revealed that loss of Tln1 in colonic epithelial cells (CECs) results in impaired recruitment and activation of T cells. C. rodentium infection-induced colonic mucosal hyperplasia was exacerbated in Tln1Δepi mice compared to littermate controls. We demonstrate that this is associated with decreased CEC apoptosis and crowding of proliferating cells in the base of the glands. Taken together, talin-1 expression by CECs is important in the regulation of both epithelial renewal and the inflammatory T cell response in the setting of colitis caused by C. rodentium, suggesting that this protein functions in CECs to limit, rather than contribute to the pathogenesis of this enteric infection.
Introduction
The colonic epithelium plays a pivotal role in the delicate balance between gut homeostasis and disease. Colonic epithelial cells (CECs) line the lumen of the colon and provide the initial barrier between the microbiome and the rest of the body.Citation1 Escherichia coli, a prominent member of the human colonic microbiota, usually maintains a commensal relationship with the host, however, enteropathogenic E. coli (EPEC) are leading causes of diarrheal-related deaths, especially in children and the elderly.Citation2,Citation3 One mode of EPEC pathogenesis is through attaching and effacing (A/E) lesions, a strategy shared by other bacteria, such as Shiga toxin-producing E. coli (STEC) and the naturally occurring mouse-restricted pathogen, Citrobacter rodentium.Citation4,Citation5 The virulence factors that induce A/E lesion formation are encoded by the locus of enterocyte effacement (LEE), which includes genes encoding for a type III secretion system (T3SS) secreted proteins, the adhesin intimin, and its receptor termed translocated intimin receptor (Tir).Citation4–6 The formation of pedestal-like structures underneath the intimately adhered bacteria are composed of the bacterial translocated effectors and the recruited host cytoskeletal and focal adhesion proteins α-actinin, vinculin, and talin-1.Citation6,Citation7
Talin-1, encoded by the gene Tln1, is a ubiquitously expressed mechanosensory scaffold protein that was first discovered in chicken gizzards.Citation8,Citation9 The homo-dimeric talin-1 molecule is comprised of two subunits; a 50-kDa N-terminal head containing a FERM domain and a 220-kDa C-terminal rod lined with helical bundles that provide multiple binding sites for actin and vinculin.Citation9–11 The family of proteins that possess a FERM domain are often associated with protein-protein interactions that link the cytoskeleton to transmembrane receptors.Citation12 The head of talin-1 has been shown to bind to the cytoplasmic domain of the β-subunit of integrins and facilitates a conformational change to the extracellular domain that increases integrin binding affinity.Citation9,Citation13 The tail of talin-1 tethers to F-actin and through inside-out signaling, promotes focal adhesion assembly and increases forces exerted on the extracellular matrix (ECM).Citation14–18
Increasing evidence suggests that talin-1 is essential for A/E lesion pedestal formation and actin polymerization.Citation19,Citation20 We have recently shown that suppression of talin-1 expression in vitro results in decreased actin rearrangement in immortalized young adult mouse colon cells.Citation21 Therefore, our aim in this study was to determine the role of talin-1 in CECs during pathogenic enteric bacterial infection in vivo. Cell-specific knockdown of Tln1 in intestinal epithelial cells (IECs) in mice resulted in increased C. rodentium colonization with increased depth of infection in the colonic epithelial glands, associated with decreased actin condensation, enhanced neutrophil infiltration, and impaired T cell response, together resulting in increased clinical and histologic evidence of colitis. In addition, we demonstrate that genetic loss of Tln1 contributes to colonic crypt hyperplasia. This effect was associated with reduced apoptosis of surface CECs and reduced proliferation along the upper zone of the crypts. Taken together, these findings implicate talin-1 as a regulator of CEC response and T cell recruitment during infectious colitis that restricts C. rodentium pathogenesis.
Materials and methods
Mice
C57BL/6 Tln1fl/fl mice were generated by Petrich et al. and provided to us by Dr. Roy Zent at Vanderbilt University Medical Center (Nashville, TN).Citation22,Citation23 The Tln1fl/fl mice were then crossed with C57BL/6 Vil1cre/+ mice and the resulting offspring were backcrossed to Tln1fl/fl mice to generate Tln1fl/fl;Vil1+/+ and Tln1fl/fl;Vil1cre/+ (Tln1Δepi) mice.Citation24 The mouse colony was maintained and housed in a specific-pathogen free facility with ventilated cage racks and a 12 h/12 h light/dark cycle. Mice were fed ad libitum with 5L0D chow (LabDiet) and provided continuous water. All experiments were approved IACUC at Vanderbilt University and Institutional Biosafety Committee and the Research and Development Committee of the Veterans Affairs Tennessee Valley Healthcare System under the protocol V2000018. Procedures were performed in accordance with institutional policies, AAALAC guidelines, the American Veterinary Medical Association Guidelines on Euthanasia, NIH regulations (Guide for the Care and Use of Laboratory Animals; National Academies Press, 2011), and the US Animal Welfare Act (1966).
Isolation of colonic epithelial cells
Epithelial cells were isolated from the colonic mucosa as previously described.Citation21,Citation25 Briefly, colons were excised, cut longitudinally, washed with PBS, cut into 2 mm pieces, placed in dissociation buffer containing 3 mM DTT and 0.5 mM EDTA, and incubated on ice for one hour. The pieces were then vigorously shaken in PBS and the cells were passed through a 70 μm cell strainer.
mRNA analysis
Total RNA was isolated from CECs and colonic tissues using the RNeasy Mini Kit (QIAGEN), according to the manufacturer’s instructions. Equal amounts of total RNA were reverse transcribed into cDNA using the SuperScript III Reverse Transcriptase (Thermo Fisher), Oligo (dT) primers (Thermo Fisher), and dNTP Mix (Applied Biosystems). Quantitative real-time PCR was performed using the PowerUp SYBR Green Master Mix (Applied Biosystems) and the primers listed in .
Table 1. List of qRT-PCR primers used for this paper.
Western blot and densitometric analysis
Isolated CECs or colonic tissues were lysed using ice cold CellLytic MT Reagent (Sigma-Aldrich) supplemented with the Protease Inhibitor Cocktail (Set III, Calbiochem) and the Phosphatase Inhibitor Cocktail (Set I, Calbiochem). The BCA Protein Assay (Pierce) was used to measure total protein concentrations. Proteins were separated by SDS-PAGE on a 4–20% gel, transferred to nitrocellulose membranes, and blocked with 5% w/v milk in TBS with 0.1% Tween-20 for 1 h. Membranes were incubated with a rabbit anti-Talin-1 mAb (Cell Signaling, C45F1; 1:2000) overnight at 4°C in 5% w/v BSA in TBS with 0.1% Tween-20 (based on the manufacturer’s recommendations) or a mouse anti-β-actin mAb (Sigma-Aldrich, A1978; 1:10000) in 5% w/v milk in TBS with 0.1% Tween-20 for 30 min at room temperature. Protein bands were visualized by incubating the membrane with HRP-labeled goat anti-rabbit IgG (Jackson ImmunoResearch, 111-035-003; 1:5000) or HRP-labeled goat anti-mouse IgG (Promega, W402B; 1:20000), respectively, and using SuperSignal West Pico PLUS Chemiluminescent Substrate (Pierce) and HyBlot CL Autoradiography Film (labForce). Densitometric analysis of Western blots was performed with Fiji (ImageJ).Citation26
C. rodentium Infection
C. rodentium strain DBS100 was cultured overnight in Luria-Bertani (LB) broth shaking at 37°C. Adult male Tln1fl/fl and Tln1Δepi littermates (6–12 wk) are inoculated by oral gavage with 5 × 10Citation8 C. rodentium in 0.2 mL LB broth.Citation21,Citation27,Citation28 Control mice received 0.2 mL of sterile LB broth alone. Mice were weighed and monitored daily and animals that showed signs of distress, lost more than 20% of initial body weight, or became moribund were euthanized. At 14 days post-inoculation, mice were sacrificed, and the colons were removed, measured, cleaned, weighed, and Swiss-rolled for fixation in 10% neutral buffered formalin and subsequent histology. Three proximal and distal pieces were collected prior to fixation. Two pieces were flash frozen for RNA and protein isolation and analysis and the third was used to determine bacterial colonization by counting the colony forming units (CFUs) after plating serial dilutions of homogenized tissue on McConkey agar plates. C. rodentium colonization of the spleen was determined as above.
Colonic fecal microbiota analysis
Fecal samples from the colon lumen from Tln1fl/fl and Tln1Δepi mice were frozen, weighed, and genomic DNA was extracted using the QIAamp Fast DNA Stool Mini Kit (QIAGEN). DNA was quantified using Qubit Fluorometric Quantification (Thermo Fisher Scientific), and the V4 region of the 16S rRNA gene was sequenced with the Illumina MiSeq. Sequences were processed with Mothur, version 1.44.3 (https://mothur.org/), aligned to the SILVA database release 132 (https://www.arb-silva.de/), and taxonomically classified with the Ribosomal Database Project classifier version 16. Nonbacterial sequences and chimeric sequences detected by UCHIME were removed. Operational Taxonomic Unit clustering was performed with VSEARCH, using abundance-based greedy clustering. Rarefaction followed by alpha-diversity, and beta-diversity calculations were repeated 1000 times, and the results were averaged. Data summarization and visualization were performed by R package phyloseq (http://joey711.github.io/phyloseq/).
Histologic score
Paraffin-embedded Swiss-rolled colons were sectioned (5 μm), stained with hematoxylin (H&E), and examined in a blinded manner by a gastrointestinal pathologist (MBP). The histologic injury score (0–21) is the combination of epithelial injury score assessed on a scale of 0–3 (no injury, mucus depletion, erosion, superficial ulcers or extensive erosion, deep ulcers and/or necrosis of the mucosa) plus total inflammation (0–18), which is the extent of inflammation from 0–3 (no inflammation, mucosa, submucosa, muscular propria or beyond) multiplied by the sum of acute (polymorphonuclear cell infiltration) and chronic (mononuclear cell infiltration) inflammation on a scale of 0–3 for each.Citation29
Immunofluorescence
Immunofluorescent staining for C. rodentium was performed on paraffin-embedded Swiss-rolled murine colon tissues using the following antibodies: rabbit polyclonal anti-C. koseri (Abcam; 1:50), which cross-reacts with C. rodentium, and Alexa Fluor 488-labeled goat anti-rabbit IgG (1:400; Life Technologies) or Alexa Fluor 555-labeled goat anti-rabbit IgG (1:400; Life Technologies) and pseudo-colored green during imaging.Citation21 Slides were washed, dried, and mounted using VECTASHIELD HardSet™ Antifade Mounting Medium with DAPI (Fisher Scientific). Fluorescently stained slides were imaged using a Cytation C10 Confocal Imaging Reader and Gen 5+ software (Agilent BioTek).
Fluorescence Actin Staining (FAS) test
Phalloidin CF488A (Biotium; 1:50) was included in the secondary antibody incubation step of C. rodentium immunofluorescence staining and pseudo-colored white during imaging.
Immunohistochemistry and analysis
Immunoperoxidase staining for Ki-67, myeloperoxidase (MPO), CD3, and cleaved caspase-3 were performed on paraffin-embedded Swiss-rolled murine colon tissues. Sections were deparaffinized, antigens retrieved with citrate buffer, and quenched with H2O2. Tissues were then incubated overnight at 4°C using the following antibodies: prediluted rabbit polyclonal anti-Ki-67 (Biocare, PRM325AA), prediluted rabbit monoclonal anti-MPO (Biocare, PP023AA), rabbit polyclonal anti-CD3 (Abcam, ab5690; 1:150), or rabbit monoclonal anti-cleaved caspase-3 (Cell Signaling, 9664; 1:400). Primary antibodies were detected with anti-rabbit HRP Polymer (DAKO), color was developed using 3,3′-diaminobenzidine (DAB+), and tissues were counterstained by hematoxylin. All slides were imaged and analyzed using a Cytation C10 Confocal Imaging Reader and Gen 5+ software (Agilent BioTek). Crypt length and the proportion of the crypt that contained Ki-67 positive nuclei were determined by measuring the distance from the base of the crypt to the luminal surface and the last positive nuclei from 3 mid-powered fields, respectively. The average number of CD3-positive cells was quantified by the Cell Analysis function of the Gen 5+ software (Agilent BioTek) and was limited to the mucosa to reduce inclusion of nonspecific staining. The proportion of apoptotic mucosa per 5 high-powered fields was quantified by measuring the total height of the mucosa and the height of the region containing positive cleaved caspase-3 staining.
The average number of MPO-positive cells per 5 high-powered fields was quantified by a gastrointestinal pathologist (MBP) in a blinded manner.
Colonic lamina propria isolation
Colons were removed, opened longitudinally, washed with cold PBS, cut into 5 mm pieces, and incubated in 50-mL conical tubes containing 25 mL pre-warmed RPMI 1640 media with 5% FBS, 5 mM EDTA, 1 mM dithiothreitol (Thermo Fisher Scientific), and 20 mM HEPES at 37°C for 40 minutes in a non-CO2 MaxQ4450 horizontal shaker (Thermo Fisher Scientific). The media was then strained through a sieve (Everyday Living), and intestinal pieces were placed into 25 mL cold RPMI 1640 media containing 2 mM EDTA, and 20 mM HEPES, shaken vigorously 20 times, and strained again. Intestinal pieces were then minced and placed into 25 mL prewarmed RPMI 1640 media containing 0.1 mg/ml Liberase TL (Roche), 0.05% DNAse I (Sigma-Aldrich) and 20 mM HEPES and shaken at 37°C for 30 minutes. Cells were pulled through a 10 mL syringe 20 times and filtered through a 70 μm cell strainer into an equal volume of cold RPMI 1640 media containing 5% FBS, 0.05% DNAse I, 20 mM HEPES on ice. Cells were spun for 10 minutes at 4°C and 475 × g and resuspended in 40% Percoll (Sigma-Aldrich) solution and underlaid using 90% Percoll. The 40/90 gradient was spun for 25 minutes at 20°C at 475 × g with no brake or acceleration applied. The interphase layer was recovered and washed in fluorescence activated cell sorting (FACS) buffer (PBS with 2% FBS and 2 mm EDTA) and spun again for 10 minutes at 20°C and 475 × g prior to staining.
Flow cytometry
For cell surface staining, cells were incubated in the antibody cocktail for 20 minutes at 4°C in the dark. Samples were blocked using 30 μL normal rat serum (StemCell Technologies). Intracellular cytokine staining was performed using Cytofix/Cytoperm (BD) according to the manufacturer’s instructions. Flow cytometric analysis was performed using a 4-Laser Fortessa (BD) with FACSDiva software (BD). Analyses were performed using FlowJo (BD). A live/dead stain (ThermoFisher) was used to only assess live cells. Antibodies used for flow cytometry are listed in .
Table 2. List of flow cytometry antibodies used for this paper.
Ex vivo T cell stimulation
T cells were stimulated ex vivo with 50 ng/mL phorbol 12-myristate 13-acetate (PMA) and 1 µg/mL ionomycin in the presence of GolgiStop (BD) in T cell media (TCM) (RPMI1640 supplemented with 10% HI-FBS, 1% penicillin/streptomycin (ThermoFisher), 1 mM sodium pyruvate (ThermoFisher), 55 µM 2-mercaptoethanol (ThermoFisher), 1% glutamax (ThermoFisher), and 1% non-essential amino acids (ThermoFisher) for 5 hours.
Generation of colonoids
Colons were extracted from Tln1fl/fl and Tln1Δepi mice, washed with PBS, cut into 5–6 pieces, and incubated in chelating buffer (10 mM EDTA in PBS) at 4°C for 30 min while rocking. The tissues were then vigorously shaken in fresh dissociation buffer (1% w/v D-sorbitol and 1.5% w/v sucrose in PBS) and repeated until a clean fraction of crypts was obtained. The isolated crypts were embedded in Matrigel matrix (Corning, 356231) and maintained in 50% L-WRN conditioned media with 100 U/ml penicillin/streptomycin, 10 μg/ml Gentamicin (Gibco), 10 μM Y27632 (Tocris, 1254), and 10 μM SB431542 (Tocris, 12614). Gentamicin and Y27632 are not included after the first passage.
Statistics
All the data shown represent the mean ± SEM unless otherwise noted. GraphPad Prism 9.4 (GraphPad Software) was used to perform statistical analyses and significance was set at P < 0.05. For normally distributed data, a 2-tailed Student’s t test or a 1-way ANOVA with the Tukey or Šídák’s post hoc test were performed to compare differences between two or more test groups, respectively. Non-normally distributed data was analyzed by a 1-way ANOVA with the Kruskal-Wallis test, followed by a Mann-Whitney U test, unless otherwise noted. The Log-rank (Mantel-Cox) test was used to assess differences between the Kaplan-Meier curves of survival. Differences in daily body weights were analyzed by a 2-way ANOVA and Tukey post hoc test.
Results
Tln1Δepi mice have increased susceptibility to C. rodentium infection
Talin-1 has been implicated in the formation of attaching and effacing lesions in response to EPEC and C. rodentium, but this has not been directly studied in vivo.Citation20,Citation21 To evaluate the role of talin-1 in epithelial cells during pathogenic colitis, we used Tln1Δepi and littermate control Tln1fl/fl mice.Citation22,Citation24 We first confirmed knockdown of Tln1 mRNA () and talin-1 protein expression in isolated CECs (). Next, we inoculated Tln1Δepi mice and their Tln1fl/fl littermate controls via oral gavage of 5 × 10Citation8 CFUs of C. rodentium for 14 days, as we described.Citation21,Citation27,Citation28 Tln1Δepi mice were more susceptible to C. rodentium-induced disease, exhibiting decreased survival () and increased body weight loss () compared to infected Tln1fl/fl mice. Tln1 mRNA and talin-1 protein levels remained significantly reduced in whole tissues of Tln1Δepi mice with and without infection ().
Figure 1. Epithelial-specific deficiency of talin-1 enhances susceptibility to C. rodentium-induced death and weight loss. (a-c) Colonic epithelial cells were isolated from Tln1fl/fl and Tln1Δepi mice. (a) Tln1 mRNA expression was determined by RT-qPCR; n = 3–4 per genotype. (b) Representative Western blot of talin-1 protein (270 kDa) expression. (c) Densitometry analysis of talin-1 protein expression; n = 3 mice per group. (d-f) Tln1fl/fl and Tln1Δepi mice were infected with 5 × 10Citation8 CFU of C. rodentium by oral gavage and monitored daily for 14 days; n = 8–9 uninfected mice and n = 12–15 infected mice per genotype. Data pooled from 2 independent experiments. (d) Kaplan-Meier curves of uninfected and infected mice. (e) Daily body weights depicted as percent of initial body weight. (f) Tln1 mRNA expression in whole colon tissues determined by RT-qPCR; n = 4 uninfected mice and n = 6–8 infected mice per genotype. (g) Western blot of talin-1 protein (270 kDa) and (h) densitometry analysis; n = 3 mice per group. All values are reported as mean ± SEM. Statistical analyses, where shown; *P < 0.05, **P < 0.01, ***P < 0.001, and ****P < 0.0001 determined by (a and c) Student’s t test, (d) Log-rank (Mantel-Cox) test, (e) 2-way ANOVA and Tukey test, §P < 0.05 and §§P < 0.01 compared to infected Tln1fl/fl littermate controls, (f and h) 1-way ANOVA and šídák’s test compared to Tln1fl/fl.
Epithelial talin-1 contributes to pathogen containment by facilitating actin rearrangement and attachment of C. rodentium to the epithelium
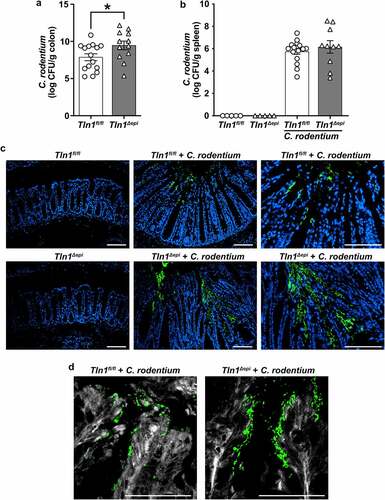
It has been suggested that talin-1, a focal adhesion molecule, is necessary for the binding of A/E pathogens and we have reported that diminution of Tln1 mRNA transcripts results in decreased intimate attachment of C. rodentium to colonic epithelial cells in vitro.Citation7,Citation20,Citation21 Therefore, we assessed the burden and localization of C. rodentium in Tln1fl/fl and Tln1Δepi mice infected for 14 days. Mice with epithelial deletion of Tln1 exhibited a 1.6 log-order increase of C. rodentium CFU per gram of colon tissue (). To determine whether the increase in C. rodentium colonization in the colon led to increased bacterial dissemination to other organs, we harvested the spleens and assessed viable bacteria. There was no difference between bacterial burden in the spleens of infected Tln1Δepi mice compared to Tln1fl/fl mice (). This suggests that epithelial loss of talin-1 does not decrease gut barrier function. Immunofluorescence and confocal microscopy revealed that in Tln1fl/fl mice, C. rodentium was restricted to the apical surface that lines the colon lumen (). In contrast, in mice deficient in epithelial talin-1, the C. rodentium extended along the epithelial cells that line the sides of the crypts and into the base (). C. rodentium-induced actin polymerization, visualized using FAS and confocal microscopy, was decreased in Tln1-deficient epithelial cells (). In addition, detachment of numerous C. rodentium-bound epithelial cells was apparent in Tln1fl/fl mice and this was abolished in the Tln1Δepi mice () suggesting that talin-1 is essential for cytoskeletal polymerization and subsequent shedding of compromised epithelial cells.
Figure 2. Epithelial-specific talin-1 contributes to pathogen containment by facilitating actin rearrangement and attachment ofC. rodentium to the epithelium. (a-b) Bacterial burden was assessed by culturing serial dilutions of homogenized tissues and normalizing to tissue weight on day 14 post-infection (p.I.). (a) C. rodentium colonization of the colon; n = 15 infected Tln1fl/fl mice and n = 12 infected Tln1Δepi mice. Data pooled from 2 independent experiments. *P < 0.05 determined by Student’s t test. (b) C. rodentium colonization of the spleen;n = 5 uninfected mice per genotype, n = 15 infected Tln1fl/fl mice, and n = 10 infected Tln1Δepi mice. (c) Representative immunofluorescence images of C. rodentium (green) and DAPI (blue) in colon tissues of uninfected and infected mice; n = 4 mice per group. (d) Representative images of FAS (white) co-stained with C. rodentium (green) in colon tissues of uninfected and infected mice; n = 4 mice per group. All values are reported as mean ± SEM. Statistical analyses, where shown; *P < 0.05 determined by Student’s t test. (c-d) Scale bars represent 100 μm.
Talin-1 moderates C. rodentium-induced colitis
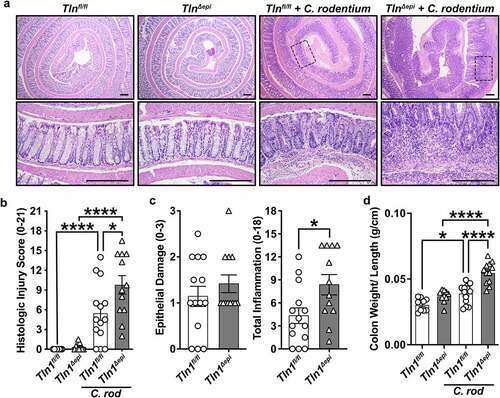
Animals lacking epithelial Tln1 exhibited enhanced immune cell infiltration and hyperplasia (), which led to significantly increased histologic injury scores () compared to Tln1fl/fl littermate controls infected with C. rodentium. The histologic injury score is a composite of the epithelial damage and total inflammation (). While there was exacerbated hyperplasia of the colonic glands (), there was no difference in the score for epithelial damage between infected Tln1fl/fl and Tln1Δepi mice, and the increased histologic injury score was driven by a significant increase in total inflammation (). Consistent with the increase in inflammation, the colon weight to length ratio was higher in infected animals and significantly increased in Tln1Δepi mice compared to Tln1fl/fl littermate controls ().
Figure 3. Talin-1 moderates C. rodentium-induced acute inflammation. Tln1fl/fl and Tln1Δepi mice were infected with 5 × 10Citation8 CFU of C. rodentium by oral gavage for 14 days. Data pooled from 2 independent experiments. (a) Representative H&E images of the Swiss-rolled colon tissues from uninfected and infected mice. (b) Histologic injury scores derived from the H&E-stained tissues; n = 8–9 uninfected mice and n = 12–15 infected mice per genotype. (c) Epithelial damage scores and total inflammation scores that were used to generate the histologic injury score in b. (d) Colon weight as a proportion of body weight on day 14 post-inoculation. Each symbol is a different mouse. All values are reported as mean ± SEM. Statistical analyses, where shown; *P < 0.05, **P < 0.01, and ****P < 0.0001 determine by (b and d) 1-way ANOVA with Tukey test; (c) Student’s t test. (a) Scale bars represent 200 μm.
Tln1 deletion in IECs has no major impact on the composition of the gut microbiota
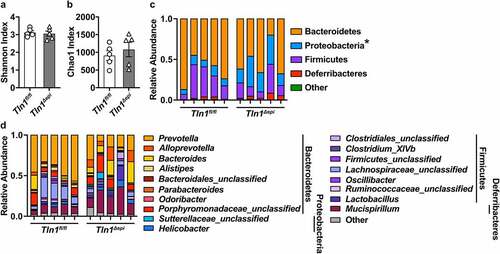
Because the composition of the commensal microbiota can regulate colonization by enteropathogens and intestinal inflammation, we analyzed the colonic fecal microbiome from naïve Tln1fl/fl and Tln1Δepi mice. Sequencing of the V4 region of the 16S rRNA gene and analysis of the beta diversity revealed no significant differences in the bacterial diversity as determined by the Shannon Index () or in estimated operational taxonomic units (OTUs) as determined by the Chao1 metric (). As previously reported for C57BL/6 mice,Citation30,Citation31 the fecal microbiomes of both Tln1fl/fl and Tln1Δepi mice were dominated by the Bacteroidetes and Firmicutes phyla (). The prevalence of Proteobacteria was significantly increased in Tln1Δepi mice at the phylum level (); however, there were no differences in Sutterellaceae or Helicobacter, the two main genera belonging to Proteobacteria (). The relative abundance of Bacteroidetes, Firmicutes, and Deferribacteres phyla (), and respective genera (), were similar between Tln1fl/fl and Tln1Δepi mice.
Figure 4. Effect of epithelial talin-1 loss on the fecal microbiome. 16S sequencing was performed on DNA extracted from colonic feces of naïve Tln1fl/fl and Tln1Δepi mice; n = 5 mice per genotype. Alpha diversity evaluated by (a) Shannon Index and (b) Chao1 Index. The relative abundance of each (c) phylum and (d) genus in the gut colonic bacterial community; *P < 0.05.
Knockdown of talin-1 in epithelial cells heightens neutrophil recruitment but diminishes the T cell response to pathogenic bacteria
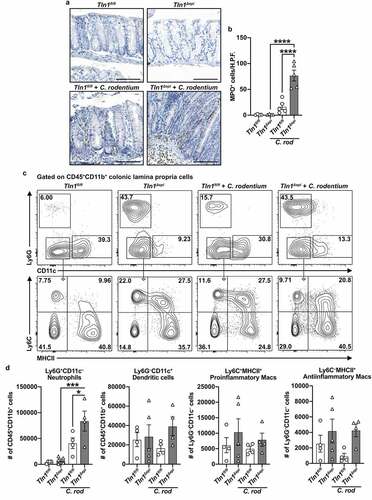
To further evaluate the differences in the inflammatory response between Tln1fl/fl and Tln1Δepi mice, we first assessed the immune cell populations by immunohistochemistry. Colon tissues were immunostained for MPO-expressing neutrophils and monocytic cells (). The number of MPO-positive cells was significantly increased in infected Tln1Δepi mice compared to uninfected Tln1Δepi mice and infected Tln1fl/fl mice (). Flow cytometric analysis of CD45+CD11b+ myeloid cells isolated from the colonic lamina propria of Tln1fl/fl and Tln1Δepi mice confirmed a significant increase in the number of Ly6G+ neutrophils in infected Tln1Δepi mice compared to Tln1Δepi mice and infected Tln1fl/fl mice (). We observed no differences in the number of CD11c+ dendritic cells, Ly6C+MHCII+ proinflammatory macrophages, and Ly6C+MHCII – antiinflammatory macrophages between uninfected and infected Tln1fl/fl and Tln1Δepi mice ().
Figure 5. Knockdown of talin-1 in epithelial cells heightens neutrophil recruitment but diminishes the T cell response to pathogenic bacteria. (a) Representative images of colon tissues immunoperoxidase-stained for MPO and (b) the quantification of MPO+ cells per high-powered field (H.P.F). n = 4 uninfected mice and n = 5 infected mice per genotype. Each symbol is a different mouse. Gating strategy (c) and quantification (d) of myeloid cells isolated from the colonic lamina propria and assessed by flow cytometry; n = 4–5 uninfected mice and n = 4 infected mice per genotype. Plots were pre-gated for single, live CD45+CD11b+ cells. Neutrophils were identified as CD45+CD11b+Ly6G+CD11c – and dendritic cells as CD45+CD11b+Ly6G – CD11c+. Proinflammatory macrophages were identified as CD45+CD11b+Ly6G – CD11c – Ly6C+MHCII+ and antiinflammatory macrophages as CD45+CD11b+Ly6G – CD11c – Ly6C – MHCII+. All values are reported as mean ± SEM. Statistical analyses, where shown; *P < 0.05, **P < 0.01, and ****P < 0.0001 determined by (b) 1-way ANOVA and Tukey test; (d) 1-way ANOVA and šídák’s test. Scale bars represent 100 μm.
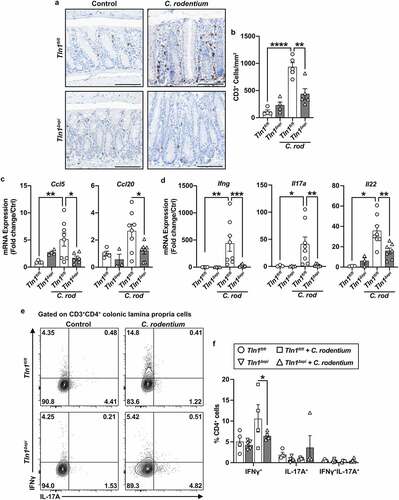
In contrast, the elevated number of CD3+ cells in the mucosa of infected Tln1fl/fl mice was significantly reduced in the tissues of infected Tln1Δepi mice (). Concomitantly, mRNA expression of T cell-attracting chemokines Ccl5 and Ccl20 was induced in Tln1fl/fl mice with infection and was diminished in infected Tln1Δepi mice (). Additionally, the tissues of Tln1Δepi mice expressed significantly reduced levels of the transcripts coding for interferon (IFN)-γ, IL-17, and IL-22 (). We then analyzed the production of IFN-γ and IL-17A by CD3+CD4+ T cells isolated from the lamina propria of Tln1fl/fl and Tln1Δepi mice infected or not with C. rodentium and stimulated with PMA/ionomycin ex vivo. We observed an increase in the percent of IFN-γ-expressing T cells in infected Tln1fl/fl mice that was significantly reduced in Tln1Δepi mice, but no difference in IL-17A (). Thus, these data suggest that the role of talin-1 within epithelial cells includes recruitment and activation of T cells, such that when Tln1 is deleted, there is loss of host defense associated with activated T cells. Additionally, our data suggest that the increased Il17a detected in the tissues of the Tln1Δepi mice most likely derives from other colonic immune cells types than Th cells.
Figure 6. Knockdown of talin-1 in epithelial cells reduces T cell infiltration and activation in the colonic mucosa. (a) Representative images of colon tissues immunoperoxidase-stained for CD3 and (b) the quantification of CD3+ cells per mmCitation2. n = 4 uninfected mice and n = 5 infected mice per genotype. (c) mRNA expression of T cell chemokines analyzed by RT-qPCR. (d) mRNA expression of markers of T cell activation analyzed by RT-qPCR. (c and d) n = 4 uninfected mice and n = 8 infected mice per genotype. (e and f) Lymphocytes were isolated from the lamina propria of uninfected and infected mice. Following isolation, cells were stimulated with PMA/Ionomycin and GolgiStop, and intracellular cytokine expression was analyzed by flow cytometry. Plots were pre-gated for single, live CD3+CD4+ cells. All values are reported as mean ± SEM. Statistical analyses, where shown; **P < 0.01 and ****P < 0.0001 determined by (b) 1-way ANOVA and Tukey test; (c-d) 1-way ANOVA with Kruskal-Wallis test, followed by a Mann-Whitney U test; (f) 1-way ANOVA and šídák’s test. Scale bars represent 100 μm.
Loss of epithelial-specific talin-1 enhances pathogen-induced colonic hyperplasia and suppresses epithelial apoptosis
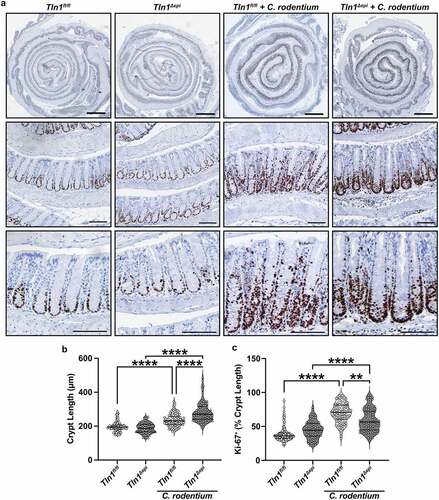
A hallmark of C. rodentium infection is crypt hyperplasia which is characterized by rapid turnover of the epithelial cells lining the crypts and thickening of the colonic mucosa.Citation5,Citation32 Therefore, we assessed cellular proliferation in the colonic mucosa of Tln1fl/fl and Tln1Δepi mice by immunostaining for Ki-67. C. rodentium induced increased Ki-67 expression in both Tln1fl/fl and Tln1Δepi mice when compared to uninfected control mice (). In the infected Tln1fl/fl mice, the proliferating cells extended from the base of the crypt to the luminal surface while in the Tln1Δepi mice, the positive nuclei did not extend to the lumen and crowded at the base of the crypt (). Infected Tln1fl/fl and Tln1Δepi mice had significantly longer crypts compared to uninfected controls and the crypts were further elongated in the infected Tln1Δepi mice (). Consistent with the photomicrographs of , image analysis confirmed that the proportion of the crypt length in which the Ki-67+ cells extended was significantly reduced in infected Tln1Δepi mice ().
Figure 7. Loss of epithelial-specific talin-1 enhances pathogen-induced colonic hyperplasia. (a) Representative images of colon tissues immunoperoxidase-stained for Ki-67. n = 4 uninfected mice and n = 4–5 infected mice per genotype. (b) Colonic crypt length. Each dot represents an individual crypt that was visible from base to opening; n = 70–107 crypts counted from 4 different mice per group. (c) the proportion of the individual crypts that contained Ki-67+ nuclei determined by measuring from the base of the crypt to the last positive nuclei. All values reported with the median depicted as a thick line and the upper and lower quartiles as thin lines. Statistical analyses, where shown; **P < 0.01 and ****P < 0.0001 determined by 1-way ANOVA and Kruskal-Wallis test. Thick scale bars represent 1000 μm and thin scale bars represent 100 μm.
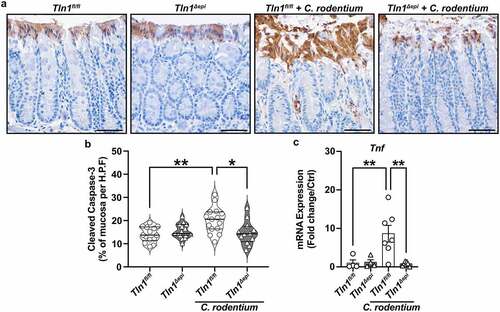
To determine the fate of the mature epithelial cells, we assessed apoptosis by immunostaining for cleaved caspase-3. Uninfected mice from each genotype displayed a baseline level of apoptosis that encompassed a single layer of luminal surface cells, which was then increased in C. rodentium-infected Tln1fl/fl mice (). This increase was absent in the Tln1Δepi mice with infection (), quantified as the proportion of the mucosa containing apoptotic cleaved caspase-3-positive cells (). The mRNA expression of the gene encoding TNF-α, a stimuli of apoptotic cell shedding, was significantly reduced in infected Tln1Δepi mice compared to infected Tln1fl/fl mice ().Citation33 These data along with the decrease in actin polymerization and shedding of C. rodentium-bound cells suggest that talin-1 is important for epithelial cell movement and regeneration in response to challenge, and that this activity is protective during infection.
Figure 8. Loss of epithelial-specific talin-1 suppresses pathogen-induced epithelial apoptosis. (a) Representative images of colon tissues immunoperoxidase-stained for cleaved caspase-3. (b) the proportion of cleaved caspase-3-positive mucosa determined by measuring the total height of the mucosa and the height of the region with positive staining. Each dot represents measurements from a high-powered field; n = 12–15 fields from 3 different mice per group. All values reported with the median depicted as a thick line and the upper and lower quartiles as thin lines. (c) Expression of the gene encoding TNF-α analyzed by RT-qPCR. n = 4 uninfected mice and n = 6–7 infected mice per genotype. Each symbol is a different mouse. Values are reported as mean ± SEM. *P < 0.05 and **P < 0.01 determined by (b) 1-way ANOVA and Tukey test and (c) 1-way ANOVA with Kruskal-Wallis test, followed by a Mann-Whitney U test. Scale bars represent 100 μm.
Epithelial talin-1 deficiency inhibits epithelial cell mobility
To assess epithelial motility, we generated 3D organoids (colonoids) from colonic crypts isolated from Tln1fl/fl and Tln1Δepi mice. The colonoids were cultured for 3 days, passaged and followed daily. The morphology of the Tln1fl/fl and Tln1Δepi colonoids appeared comparable prior to passage (). Post-passage, the colonoids from Tln1fl/fl mice formed irregular structures and buds that protruded into the extracellular growth matrix over time (). Conversely, the colonoids derived from Tln1Δepi mice maintained a uniform spherical shape with minimal to no budding structures and less overall growth ().
Figure 9. Epithelial talin-1 deficiency inhibits epithelial cell mobility in vitro. Representative images of colon organoids (colonoids) generated from crypts isolated from Tln1fl/fl and Tln1Δepi mice and imaged daily for 8 days; n = 3 mice per genotype. Arrowheads highlight colonoids with budding. White scale bars represent 2000 μm and black scale bars represent 100 μm.
Discussion
Talin-1 provides a two-way bridge between the extracellular environment and intracellular networks. Through inside-out signaling, talin-1 induces a conformational change to the integrin heterodimer and increases ligand affinity while also biding to F-actin and vinculin to facilitate focal adhesion assembly and cell migration.Citation13,Citation15,Citation16,Citation18,Citation34 Due to the involvement with the cytoskeleton, talin-1 has also been shown to contribute to pedestal formation and actin polymerization in IECs during infection by A/E pathogens in vitro.Citation20,Citation21 Thus, we sought to determine if talin-1 is required for bacterial colonization and pathogenesis in the C. rodentium mouse model of A/E infection-induced colitis. In this study, we demonstrate that epithelial expression of talin-1 helps contain C. rodentium at the luminal surface and protects against mucosal hyperplasia, neutrophil-driven colitis, and severe pathology, including death.
C. rodentium shares many of the same virulence factors expressed by EPEC and STEC. One important virulence factor is Tir, which is injected into host cells via the T3SS and triggers actin polymerization following the clustering of bacterial intimin.Citation5,Citation6 The N-terminal domain of Tir interacts with host focal adhesion molecules including talin-1, however, this interaction is not necessary for A/E lesion formation as deletion of the N-terminus does not diminish pedestal formation.Citation6,Citation20,Citation35 In addition, phosphorylation of the C-terminus of Tir is required for actin condensation, although the translocation of Tir is sufficient for C. rodentium colonization, A/E lesion formation, and colonic hyperplasia.Citation36 In previous studies, the interaction between bacterial factors and the host cytoskeleton was evaluated using mutant strains. In this study, we directly knocked out an actin binding protein in IECs. Using C. rodentium, we observed that loss of talin-1 attenuated actin polymerization, but did not reduce the ability of C. rodentium to colonize the colonic mucosa. In fact, the loss of talin-1 enhanced the depth in which C. rodentium inhabited the colonic crypts and increased overall colonization. Therefore, we postulate that talin-1 in CECs strengthens the adherence of C. rodentium to host cells by enabling actin rearrangement and preventing detachment and movement of the pathogen further into the glands.
C. rodentium has adapted multiple mechanisms to hijack the host machinery to increase survival in addition to A/E lesions. A hallmark of C. rodentium pathology is transmissible murine crypt hyperplasia.Citation5,Citation32 Under homeostatic conditions, colonic epithelial regeneration begins with the proliferation of colonic stem cells followed by maturation of the transit amplifying cells as they migrate up the crypt to the luminal surface. Finally, the terminal cells undergo apoptosis and are shed into the lumen.Citation37 This process is accelerated by C. rodentium infection and can potentially benefit the bacteria via increased oxygenation of the mucosa as the cells at the apex of the crypts ferment glucose to lactate instead of oxygen.Citation38 However, cell extrusion is detrimental to the pathogen as those bacteria attached to the dying cells are shed out into the lumen, which is protective for the host. Not only did we observe a decrease in apoptotic cells at the luminal surface in talin-1-deficient mice, but also crowding of proliferating cells at the base of the crypt with reduced movement of proliferating cells up the sides of the crypts. This resulted in increased crypt elongation that may also contribute to the increased C. rodentium colonization. In addition, colonoids derived from Tln1Δepi mice grew over time, but remained spherical and did not show signs of budding or extension into the ECM substrate. In prior studies of the small intestine, cell proliferation was the primary force that drove enterocyte migration up the villus, a movement that required integrins.Citation39,Citation40 Moreover, the relationship of talin-1 with both integrins and actin filaments contributes to cell adhesion and ECM traction for movement.Citation17,Citation41 Thus, our data indicates that talin-1 expression in CECs is essential for cell turnover and the movement of proliferating cells up the colonic crypts in a model of infectious colitis.
Interestingly, in addition to the changes we observed in the epithelial cell compartment, the deletion of Tln1 in CECs also modulated the mucosal immune response. The increased histologic injury scores that Tln1Δepi mice exhibited was driven by the infiltration of immune cells. C. rodentium elicits a robust inflammatory response, recently identified as type 3.Citation42 We found that mice lacking epithelial talin-1 displayed higher numbers of MPO+ cells by immunohistochemistry and more neutrophils by flow cytometry in the mucosa, which might seem counterintuitive since there was an increase in bacterial burden. However, mice that do not express TLR4 have decreased recruitment of GR-1+ neutrophils and F4/80+ macrophages to the infected tissues, and are less susceptible to C. rodentium pathogenesis, which would be consistent with our findings of increased disease with more infiltration of innate inflammatory cells.Citation43 Moreover, in combination with our data, these findings suggest that innate cells are not sufficient to control bacterial growth, and that the presence of C. rodentium maintains the pool of MPO-expressing cells in the tissue. Further, immunocompromised Rag–/– mice do not display the classic signs of C. rodentium pathogenesis, but do exhibit impaired bacterial clearance, all of which are reversed with reconstitution of CD4+ cells.Citation44,Citation45 In this present study, we observed that CEC-specific deletion of Tln1 led to decreased T cell recruitment, expression of T cell-attracting chemokines, and expression of the genes encoding IFN-γ, IL-17a, and IL-22. Our findings align with previous studies that found loss of IL-22, and specifically IL-22 expressed by T cells, results in decreased survival, increased weight loss, increased crypt hyperplasia, and increased C. rodentium colonization deep into colonic crypts.Citation46–48
In conclusion, the results from our study demonstrate that talin-1 plays a pivotal role in host response to infection by C. rodentium. Talin-1 expression by CECs not only influences the epithelial compartment, but also affects the immune cell population during bacterial insult. These findings provide insight into the interaction of A/E lesion-forming pathogens with host cell proteins. Contrary to the conventional paradigm that the intimate attachment of A/E pathogens is associated with increased virulence, our data suggest that this process is also to the advantage of the infected host by limiting bacterial invasion of colonic crypts.
Author contributions
YLL, APG, and KTW conceived of the study; DPB contributed to methodology; YLL, MMA, DPB, TMS, KJW, KMM, JJ, JAG, AGD, MBP, and SZ conducted the investigation; YLL conducted the formal analysis; YLL contributed to visualization during the studies and wrote the original draft of the manuscript; YLL, APG, and KTW reviewed and edited the manuscript; APG and KTW supervised conducting of the study; and KTW acquired funding for the study.
Acknowledgments
We kindly thank Roy Zent for providing the C57BL/6 Tln1fl/fl mice. We would like to thank the Vanderbilt Digestive Disease Research Center (DDRC) Tissue Morphology Subcore for help with tissue immunostaining.
Disclosure statement
No potential conflict of interest was reported by the authors.
Data availability statement
The authors confirm that the data supporting the findings of this study are available within the article. The 16S rRNA sequencing of the fecal microbiota has been deposited on the Sequence Read Archive website with the BioProject ID: PRJNA946899 at this URL: https://www.ncbi.nlm.nih.gov/bioproject/PRJNA946899.
Additional information
Funding
References
- Allaire JM, Crowley SM, Law HT, Chang S-Y, Ko H-J, Vallance BA. The intestinal epithelium: central coordinator of mucosal immunity. Trends Immunol. 2018;39(9):677–20. PMID: 29716793. doi:10.1016/j.it.2018.04.002.
- Kotloff KL, Nataro JP, Blackwelder WC, Nasrin D, Farag TH, Panchalingam S, Wu Y, Sow SO, Sur D, Breiman RF, et al. Burden and aetiology of diarrhoeal disease in infants and young children in developing countries (the Global Enteric Multicenter Study, GEMS): a prospective, case-control study. Lancet. 2013;382(9888):209–222. PMID: 23680352. doi:10.1016/S0140-6736(13)60844-2.
- Pakbin B, Brück WM, Rossen JWA. Virulence factors of enteric pathogenic Escherichia coli: a review. Int J Mol Sci. 2021;22(18):9922. PMID: 34576083. doi:10.3390/ijms22189922.
- Nataro JP, Kaper JB. Diarrheagenic Escherichia coli. Clin Microbiol Rev. 1998;11(1):142–201. PMID: 9457432. doi:10.1128/CMR.11.1.142.
- Collins JW, Keeney KM, Crepin VF, Rathinam VAK, Fitzgerald KA, Finlay BB, Frankel G. Citrobacter rodentium: infection, inflammation and the microbiota. Nat Rev Microbiol. 2014;12(9):612–623. PMID: 25088150. doi:10.1038/nrmicro3315.
- Freeman NL, Zurawski DV, Chowrashi P, Ayoob JC, Huang L, Mittal B, Sanger JM, Sanger JW. Interaction of the enteropathogenic Escherichia coli protein, translocated intimin receptor (Tir), with focal adhesion proteins. Cell Motil Cytoskeleton. 2000;47(4):307–318. PMID: 11093251. doi:10.1002/1097-0169(200012)47:4<307:AID-CM5>3.0.CO;2-Q.
- Goosney DL, DeVinney R, Finlay BB. Recruitment of cytoskeletal and signaling proteins to enteropathogenic and enterohemorrhagic Escherichia coli pedestals. Infect Immun. 2001;69(5):3315–3322. PMID: 11292754. doi:10.1128/IAI.69.5.3315-3322.2001.
- Burridge K, Connell L. A new protein of adhesion plaques and ruffling membranes. J Cell Biol. 1983;97:359–367. PMID: 6684120. doi:10.1083/jcb.97.2.359.
- Critchley DR. Biochemical and structural properties of the integrin-associated cytoskeletal protein talin. Annu Rev Biophys. 2009;38(1):235–254. PMID: 19416068. doi:10.1146/annurev.biophys.050708.133744.
- Kukkurainen S, Azizi L, Zhang P, Jacquier M-C, Baikoghli M, von Essen M, Tuukkanen A, Laitaoja M, Liu X, Rahikainen R, et al. The F1 loop of the talin head domain acts as a gatekeeper in integrin activation and clustering. J Cell Sci. 2020;133(19):jcs239202. PMID: 33046605. doi:10.1242/jcs.239202.
- Elliott PR, Goult BT, Kopp PM, Bate N, Grossmann JG, Roberts GCK, Critchley DR, Barsukov IL. The Structure of the talin head reveals a novel extended conformation of the FERM domain. Structure. 2010;18:1289–1299. PMID: 20947018. doi:10.1016/j.str.2010.07.011.
- Bosanquet DC, Ye L, Harding KG, Jiang WG. FERM family proteins and their importance in cellular movements and wound healing. Int J Mol Med. 2014;34(1):3–12. PMID: 24820650. doi:10.3892/ijmm.2014.1775.
- Calderwood DA, Zent R, Grant R, Rees DJG, Hynes RO, Ginsberg MH. The talin head domain binds to integrin β subunit cytoplasmic tails and regulates integrin activation. J Biol Chem. 1999;274(40):28071–28074. PMID: 10497155. doi:10.1074/jbc.274.40.28071.
- Vinogradova O, Velyvis A, Velyviene A, Hu B, Haas TA, Plow EF, Qin J. A structural mechanism of integrin αIIbβ3 “inside-out” activation as regulated by its cytoplasmic face. Cell. 2002;110:587–597. PMID: 12230976. doi:10.1016/s0092-8674(02)00906-6.
- Tadokoro S, Shattil SJ, Eto K, Tai V, Liddington RC, de Pereda JM, Ginsberg MH, Calderwood DA. Talin binding to integrin ß tails: a final common step in integrin activation. Science. 2003;302(5642):103–106. 1979 PMID: 14526080. doi:10.1126/science.1086652.
- Kopp PM, Bate N, Hansen TM, Brindle NPJ, Praekelt U, Debrand E, Coleman S, Mazzeo D, Goult BT, Gingras AR, et al. Studies on the morphology and spreading of human endothelial cells define key inter-and intramolecular interactions for talin1. Eur J Cell Biol. 2010;89(9):661–673. PMID: 20605055. doi:10.1016/j.ejcb.2010.05.003.
- Zhang X, Jiang G, Cai Y, Monkley SJ, Critchley DR, Sheetz MP. Talin depletion reveals independence of initial cell spreading from integrin activation and traction. Nat Cell Biol. 2008;10(9):1062–1068. PMID: 19160486. doi:10.1038/ncb1765.
- Giannone G, Jiang G, Sutton DH, Critchley DR, Sheetz MP. Talin1 is critical for force-dependent reinforcement of initial integrin–cytoskeleton bonds but not tyrosine kinase activation. J Cell Biol. 2003;163(2):409–419. PMID: 14581461. doi:10.1083/jcb.200302001.
- Finlay BB, Rosenshine I, Donnenberg MS, Kaper JB. Cytoskeletal composition of attaching and effacing lesions associated with enteropathogenic Escherichia coli adherence to HeLa cells. Infect Immun. 1992;60(6):2541–2543. PMID: 1587620. doi:10.1128/iai.60.6.2541-2543.1992.
- Cantarelli VV, Takahashi A, Yanagihara I, Akeda Y, Imura K, Kodama T, Kono G, Sato Y, Honda T. Talin, a host cell protein, interacts directly with the translocated intimin receptor, Tir, of enteropathogenic Escherichia coli, and is essential for pedestal formation. Cell Microbiol. 2001;3(11):745–751. PMID: 11696034. doi:10.1046/j.1462-5822.2001.00156.x.
- Singh K, Al-Greene NT, Verriere TG, Coburn LA, Asim M, Barry DP, Allaman MM, Hardbower DM, Delgado AG, Piazuelo MB, et al. The L-arginine transporter solute carrier family 7 member 2 mediates the immunopathogenesis of attaching and effacing bacteria. PLoS Pathog. 2016;12(10):e1005984. PMID: 27783672. doi:10.1371/journal.ppat.1005984.
- Petrich BG, Marchese P, Ruggeri ZM, Spiess S, Weichert RAM, Ye F, Tiedt R, Skoda RC, Monkley SJ, Critchley DR, et al. Talin is required for integrin-mediated platelet function in hemostasis and thrombosis. J Exp Med. 2007;204(13):3103–3111. PMID: 18086863. doi:10.1084/jem.20071800.
- Mathew S, Palamuttam RJ, Mernaugh G, Ramalingam H, Lu Z, Zhang M-Z, Ishibe S, Critchley DR, Fässler R, Pozzi A, et al. Talin regulates integrin β1-dependent and -independent cell functions in ureteric bud development. Development. 2017;144:4148–4158. PMID: 28993400. doi:10.1242/dev.149914.
- Rutlin M, Rastelli D, Kuo WT, Estep JA, Louis A, Riccomagno MM, Turner JR, Rao M. The Villin1 gene promoter drives Cre recombinase expression in extraintestinal tissues. Cell Mol Gastroenterol Hepatol. 2020;10(4):864. PMID: 32464312. doi:10.1016/j.jcmgh.2020.05.009.
- Whitehead RH, VanEeden PE, Noble MD, Ataliotis P, Jat PS. Establishment of conditionally immortalized epithelial cell lines from both colon and small intestine of adult H-2Kb-tsA58 transgenic mice. Proc Natl Acad Sci. 1993;90:587–591. PMID: 7678459. doi:10.1073/pnas.90.2.587.
- Schindelin J, Arganda-Carreras I, Frise E, Kaynig V, Longair M, Pietzsch T, Preibisch S, Rueden C, Saalfeld S, Schmid B, et al. Fiji: an open-source platform for biological-image analysis. Nat Methods. 2012;9(7):676–682. PMID: 22743772. doi:10.1038/nmeth.2019.
- Gobert AP, Finley JL, Latour YL, Asim M, Smith TM, Verriere TG, Barry DP, Allaman MM, Delagado AG, Rose KL. Hypusination orchestrates the antimicrobial response of macrophages. Cell Rep. 2020;33(11):108510. PMID: 33326776. doi:10.1016/j.celrep.2020.108510.
- Gobert AP, Al-Greene NT, Singh K, Coburn LA, Sierra JC, Verriere TG, Luis PB, Schneider C, Asim M, Allaman MM. Distinct immunomodulatory effects of spermine oxidase in colitis induced by epithelial injury or infection. Front Immunol. 2018;9:1242. PMID: 29922289. doi:10.3389/fimmu.2018.01242.
- Singh K, Al-Greene NT, Verriere TG, Coburn LA, Asim M, Barry DP, Allaman MM, Hardbower DM, Delgado AG, Piazuelo MB, et al. The L-arginine transporter solute carrier family 7 member 2 mediates the immunopathogenesis of attaching and effacing bacteria. PLoS Pathog. 2016;12(10):e1005984. PMID: 27783672. doi:10.1371/journal.ppat.1005984.
- Gobert AP, Cheng Y, Akhtar M, Mersey BD, Blumberg DR, Cross RK, Chaturvedi R, Drachenberg CB, Boucher J-L, Hacker A, et al. Protective role of arginase in a mouse model of colitis. J Immunol. 2004;173(3):2109 LP–2117. 2109. PMID. doi:10.4049/jimmunol.173.3.
- Eisenberg T, Abdellatif M, Zimmermann A, Schroeder S, Pendl T, Harger A, Stekovic S, Schipke J, Magnes C, Schmidt A, et al. Dietary spermidine for lowering high blood pressure. Autophagy. 2017;13(4):767–769. PMID. doi:10.1080/15548627.2017.1280225.
- Luperchio SA, Schauer DB. Molecular pathogenesis of Citrobacter rodentium and transmissible murine colonic hyperplasia. Microbes Infect. 2001;3(4):333–340. PMID: 11334751. doi:10.1016/s1286-4579(01)01387-9.
- Watson AJM, Hughes KR. TNF-α-induced intestinal epithelial cell shedding: implications for intestinal barrier function. Ann N Y Acad Sci. 2012;1258(1):1–8. PMID: 22731709. doi:10.1111/j.1749-6632.2012.06523.x.
- Wang P, Ballestrem C, Streuli CH. The C terminus of talin links integrins to cell cycle progression. J Cell Biol. 2011;195:499–513. PMID: 22042621. doi:10.1083/jcb.201104128.
- Campellone KG, Rankin S, Pawson T, Kirschner MW, Tipper DJ, Leong JM. Clustering of Nck by a 12-residue Tir phosphopeptide is sufficient to trigger localized actin assembly. J Cell Biol. 2004;164(3):407–416. PMID: 14757753. doi:10.1083/jcb.200306032.
- Deng W, Vallance BA, Li Y, Puente JL, Finlay BB. Citrobacter rodentium translocated intimin receptor (Tir) is an essential virulence factor needed for actin condensation, intestinal colonization and colonic hyperplasia in mice. Mol Microbiol. 2003;48(1):95–115. PMID: 12657048. doi:10.1046/j.1365-2958.2003.03429.x.
- Barker N, van de Wetering M, Clevers H. The intestinal stem cell. Genes Dev. 2008;22(14):1856–1864. PMID: 18628392. doi:10.1101/gad.1674008.
- Lopez CA, Miller BM, Rivera-Chávez F, Velazquez EM, Byndloss MX, Chávez-Arroyo A, Lokken KL, Tsolis RM, Winter SE, Bäumler AJ. Virulence factors enhance Citrobacter rodentium expansion through aerobic respiration. Sci. 2016;353:1249–1253. 1979 PMID: 27634526. doi:10.1126/science.aag3042.
- Kaemmerer E, Kuhn P, Schneider U, Clahsen T, Jeon MK, Klaus C, Andruszkow J, Härer M, Ernst S, Schippers A. Beta-7 integrin controls enterocyte migration in the small intestine. World J Gastroenterol: WJG. 2015;21(6):1759. PMID: 25684940. doi:10.3748/wjg.v21.i6.1759.
- Parker A, Maclaren OJ, Fletcher AG, Muraro D, Kreuzaler PA, Byrne HM, Maini PK, Watson AJM, Pin C. Cell proliferation within small intestinal crypts is the principal driving force for cell migration on villi. FASEB J. 2017;31:636–649. PMID: 27811059. doi:10.1096/fj.201601002.
- Rankin CR, Hilgarth RS, Leoni G, Kwon M, Ka DB, Parkos CA, Nusrat A. Annexin A2 regulates β1 integrin internalization and intestinal epithelial cell migration. J Biol Chem. 2013;288(21):15229–15239. PMID: 23558678. doi:10.1074/jbc.M112.440909.
- Silberger DJ, Zindl CL, Weaver CT. Citrobacter rodentium: a model enteropathogen for understanding the interplay of innate and adaptive components of type 3 immunity. Mucosal Immunol. 2017;10(5):1108–1117. PMID: 28612839. doi:10.1038/mi.2017.47.
- Khan MA, Ma C, Knodler LA, Valdez Y, Rosenberger CM, Deng W, Finlay BB, Vallance BA. Toll-like receptor 4 contributes to colitis development but not to host defense during Citrobacter rodentium infection in mice. Infect Immun. 2006;74(5):2522–2536. PMID: 16622187. doi:10.1128/IAI.74.5.2522-2536.2006.
- Vallance BA, Deng W, Knodler LA, Finlay BB. Mice lacking T and B lymphocytes develop transient colitis and crypt hyperplasia yet suffer impaired bacterial clearance during Citrobacter rodentium infection. Infect Immun. 2002;70(4):2070–2081. PMID: 11895973. doi:10.1128/IAI.70.4.2070-2081.2002.
- Chan JM, Bhinder G, Sham HP, Ryz N, Huang T, Bergstrom KS, Vallance BA, Bäumler AJ. CD4+ T cells drive goblet cell depletion during Citrobacter rodentium infection. Infect Immun. 2013;81(12):4649–4658. PMID: 24101690. doi:10.1128/IAI.00655-13.
- Zheng Y, Valdez PA, Danilenko DM, Hu Y, Sa SM, Gong Q, Abbas AR, Modrusan Z, Ghilardi N, de Sauvage FJ, et al. Interleukin-22 mediates early host defense against attaching and effacing bacterial pathogens. Nat Med. 2008;14(3):282–289. PMID: 18264109. doi:10.1038/nm1720.
- Basu R, O’quinn DB, Silberger DJ, Schoeb TR, Fouser L, Ouyang W, Hatton RD, Weaver CT. Th22 cells are an important source of IL-22 for host protection against enteropathogenic bacteria. Immunity. 2012;37:1061–1075. PMID: 23200827. doi:10.1016/j.immuni.2012.08.024.
- Zindl CL, Witte SJ, Laufer VA, Gao M, Yue Z, Janowski KM, Cai B, Frey BF, Silberger DJ, Harbour SN, et al. A nonredundant role for T cell-derived interleukin 22 in antibacterial defense of colonic crypts. Immunity. 2022;55(3):494–511.e11. PMID: 35263568. doi:10.1016/j.immuni.2022.02.003.