
 ?Mathematical formulae have been encoded as MathML and are displayed in this HTML version using MathJax in order to improve their display. Uncheck the box to turn MathJax off. This feature requires Javascript. Click on a formula to zoom.
ABSTRACT
Cross-cohort validation is essential for gut-microbiome-based disease stratification but was only performed for limited diseases. Here, we systematically evaluated the cross-cohort performance of gut microbiome-based machine-learning classifiers for 20 diseases. Using single-cohort classifiers, we obtained high predictive accuracies in intra-cohort validation (~0.77 AUC), but low accuracies in cross-cohort validation, except the intestinal diseases (~0.73 AUC). We then built combined-cohort classifiers trained on samples combined from multiple cohorts to improve the validation of non-intestinal diseases, and estimated the required sample size to achieve validation accuracies of >0.7. In addition, we observed higher validation performance for classifiers using metagenomic data than 16S amplicon data in intestinal diseases. We further quantified the cross-cohort marker consistency using a Marker Similarity Index and observed similar trends. Together, our results supported the gut microbiome as an independent diagnostic tool for intestinal diseases and revealed strategies to improve cross-cohort performance based on identified determinants of consistent cross-cohort gut microbiome alterations.
Introduction
In recent years, the human gut microbiome is emerging as a relevant factor in human diseases. For example, dysbiosis of the gut microbiome, i.e., the significant deviation of the gut microbiota compositions in disease subjects as compared with healthy controls, has been linked to multiple human diseases such as the intestinalCitation1–6, autoimmuneCitation7–9, metabolicCitation10–13, neurological and mental diseasesCitation14–19, and othersCitation20–24. To explore such associations, a case–control study is often carried out that involves: 1) recruiting volunteers of a disease of interest and matching health or non-disease controls (a cohort), 2) collection of fecal samples, followed by next-generation sequencing of either the 16S rRNA genes (16S) or the whole metagenome (mNGS), 3) bioinformatics analysis to determine the microbial compositions of samples, i.e., microbial taxa and their relative abundances, and 4) identification of differentially abundant microbial taxa between the case and control groups known as disease biomarkersCitation25–27.
In addition, the modulatory or causal roles of gut dysbiosis have been experimentally validated in many diseases. For example, disease symptoms and/or characteristics could be reproduced in model animals by transplanting feces from patients/disorder mice of Autism Spectrum Disorder (ASD)Citation28, Alzheimer’s Disease (AD)Citation29,Citation30, ObesityCitation31, and DiabetesCitation32. On the other hand, restoring the gut microbiota by transplanting feces from healthy donors to human recipients alleviated symptoms in diseases such as Clostridium Difficile Infection (CDI)Citation33, Inflammatory Bowel Disease (IBD)Citation34, and ASDCitation35.
Alterations in the human gut microbiome thus have been increasingly used as biomarkers for noninvasive disease prescreening and diagnosis, and targets for disease treatment and intervention. For disease diagnostic purposes, machine learning (ML) classifiers are also often trained on either the microbial compositions alone or in combination with clinically relevant features to distinguish patients from controlsCitation36–38. These ML models are often validated on holdout samples of the same cohort to evaluate predictive performance as the area under the receiver operating characteristic curve (AUCs) (i.e., intra-cohort validation), or in rare cases, on independent cohorts for cross-cohort validationCitation39. Among the ML algorithms, Random Forest and Least Absolute Shrinkage and Selection Operator (Lasso) logistic regression-based approaches are the most popular ones because of their advantages including high performance on smaller sample sizes (e.g., less than 50), complex and heterogenous data (e.g., high-dimensional composition data)Citation36, explicit ranking on feature importance, and low overfitting risks by feature selection. So far, gut microbiome-based diagnostic classifiers have been available for CRCCitation1,Citation39, IBDCitation40, Liver Cirrhosis (LC)Citation41,Citation42, Pancreatic Ductal Adenocarcinoma (PDAC)Citation43,Citation44, ASDCitation45, ADCitation15,Citation46,Citation47, and many othersCitation48–50.
For disease intervention and treatment, using fecal microbiota transplantation (FMT) from healthy donorsCitation33, and targeting the depleted/enriched microbial biomarkers in patients have been used. For example, supplementing mice with the Lactobacillus murinus strain could decrease high salt-sensitive hypertension, and in solid tumor models, the application of a mix of commensal gut Clostridiales strains in mice could enhance anti-cancer immune responsesCitation51,Citation52. Conversely, Duan et al. used bacteriophage targeting of a patient-enriched bacterium to decrease cytolysin in the liver and abolish ethanol-induced liver disease in mice transplanted with microbiota from alcoholic liver disease patientsCitation53,Citation54. In addition, Type 2 Diabetes Mellitus (T2D)-deficient species could be selectively promoted by designed diets (i.e., dietary fibers) for treatmentCitation55.
However, controversies exist with the reproducibility of gut dysbiosis in different cohorts, because the gut microbiome is known to be easily and significantly affected by external factors including dietCitation56, drugsCitation57,Citation58, regional differencesCitation59, sample preprocessing processesCitation60, and data analysis methodsCitation61,Citation62. These confounding factors often vary among cohorts, and sometimes dominate the gut microbiome alterations. For example, Chloe et al. revealed that the gut microbiome alterations in ASD children compared with paired siblings in an Australian cohort were mostly due to dietary preferencesCitation63. Moreover, common prescription drugs such as metformin for T2DCitation12,Citation64, proton pump inhibitors (PPIs) for gastrointestinal (GI) disordersCitation65 and LCCitation66, and statin for ObesityCitation67 and Cardiovascular Disease (CVD)Citation58, could dominate the gut microbiome alterations over the corresponding diseases, either aloneCitation12,Citation66 or in combinationCitation58. In addition, disease biomarkers could also differ significantly across cohorts of the same diseasesCitation68. These controversies would greatly impede the real-life applications of the research results for disease diagnosis and targeted intervention.
There is thus an urgent need to test and validate the cross-cohort reproducibility of the gut microbiome as diagnostic prescreening tools, and the cross-cohort consistencies in disease biomarkers. Researchers have recently started such investigations in individual diseases, and revealed higher cross-cohort prediction validation results in CRCCitation39 and LCCitation42, in contrast to lower performances in AdenomaCitation69, T2DCitation69, and psychiatric disordersCitation70. However, a systematic evaluation of cross-cohort reproducibility of gut microbiome alternations in all available datasets is yet to be performedCitation71–75; in addition, the influential factors (i.e., determinants) of the reproducibility are yet to be exploredCitation76.
In this study, we conducted a comprehensive meta-analysis for 20 diseases, using 83 case–control cohorts with a total of 9,708 samples; these diseases spanned five major disease categories, with each disease having two or more cohorts. We performed intra-cohort and combined-cohort modeling and predictive validations using state-of-the-art tools, accessed factors affecting the prediction accuracies, and recommended strategies to improve cross-cohort validation performance in order to support the gut-microbiota-derived classifiers as disease prescreening tools.
Results
Selection of gut microbiome cohorts and modeling strategies
To select gut microbiome data for cross-cohort validation, we screened a total of 361 studies in the GMrepo v2 database that were systematically collected, manually curated, and consistently analyzedCitation68 (). Our inclusion criteria included: 1) case–control studies with clearly defined disease information, 2) with at least 15 valid samples in each of the case and control groups (Methods), 3) no recent use of antibiotics or probiotic supplements. We divided the qualified cohorts into two groups accordingly to their sequencing methodology, namely 16S for 16S ribosomal RNA gene amplicon sequencing, and mNGS for whole-metagenomic shotgun sequencing (here NGS stands for next-generation sequencing). We further required that a disease should have at least two cohorts in the 16S or mNGS groups. In the end, we obtained 83 cohorts from 69 studies (some studies contained two and more diseases) that contained in total 5,984 cases and 3,724 non-disease controls. Most of the cohorts were sequenced using the Illumina platforms (Table S1). These cohorts included 20 diseases; among which, eight were unique to the 16S group, including Irritable Bowel Syndrome (IBS), CDI, AD, Mild Cognitive Impairment (MCI), Chronic Fatigue Syndrome (CFS), Multiple Sclerosis (MS), Juvenile Arthritis (JA), Non-alcoholic Fatty Liver Disease (NAFLD); five were unique to the mNGS group, including IBD, Obesity, Overweight and Ankylosing Spondylitis (AS) and Adenoma; and seven had more than two cohorts in both groups, including Crohn Disease (CD), Colorectal Cancer (CRC), Ulcerative Colitis (UC), T2D, Parkinson’s Disease (PD), ASD and Rheumatoid Arthritis (RA) (Table S1, ). We divided these 20 diseases into five categories, including seven Intestinal, three Metabolic, four Autoimmune, five Mental/nervous system diseases (Mental for short), and one Liver disease (, Table S1; Methods), according to the NCBI MeSH (Medical Subject Headings) database and Human Disease Ontology (DO) databaseCitation77. These cohorts could contain up to 323 cases and 184 controls; however, most studies have been conducted on limited numbers of samples, with median sizes of 48 and 47 for the cases and controls, respectively ().
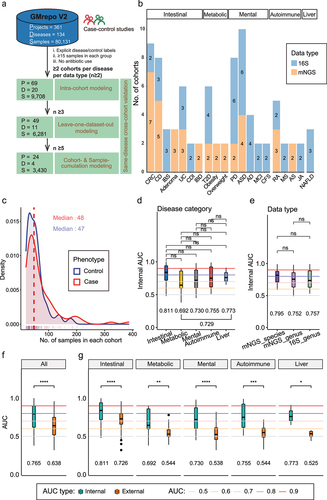
Figure 1. Study design, information of datasets and intra-cohort validation result. (a) Overview of analysis workflow. 361 human gut microbiome case-control (controls only include health phenotype) studies about 134 diseases from a public database were preserved, of which 69 projects about 20 diseases were ultimately selected. Then different modeling methods and cross-cohort (external) validation on the same disease and data type were performed, which are influenced by the cohort size (n) of same disease. First, all diseases with n ≥ 2 were enrolled by intra-cohort modeling (i.e., building single-cohort classifiers). Second, only diseases with n ≥ 3 were performed leave-one-dataset out (LODO) analysis (one of combined-cohort modeling). Thirdly, only diseases with n ≥ 5 were enrolled by cohort-cumulation modeling (CCM) and sample-cumulation modeling (SCM) analyses (two of combined-cohort modeling, Methods). (b) Disease information about filtered 83 cohorts. There are five broad categories of diseases, where Mental diseases represent Mental and Nervous system diseases. Colors represent different data types. The numbers on the graph represent cohort size for each disease on each data type. (c) Density plot of the No. of samples in each cohort. The median sample sizes of case and control are 48 and 47, marked by the red and blue lines, respectively. (d) Comparation of internal validation AUCs with intra-cohort modeling between different disease categories. Multiple adjusted two sides Wilcoxon rank sum test was used for pairwise group comparisons. (e) Comparation of internal validation AUCs with intra-cohort modeling between three different data types (Only diseases with both 16S and mNGS sequencing types were included). (f) Comparation of AUCs with intra-cohort modeling between internal and external validations in overall. Two sides Wilcoxon rank sum test was used for comparisons. (g) Comparation of AUCs with intra-cohort modeling between internal and external validations in Intestinal, Metabolic, Mental, Autoimmune and Liver five disease categories. Two sides Wilcoxon rank sum test was used for pairwise group comparisons. The colored horizontal lines represent different AUC levels. The numbers marked in the bottom of d, e, f and g represent the mean of the corresponding AUCs. *p < 0.05, **p < 0.01, ***p < 0.001, ****p < 0.0001.
For mNGS data, we analyzed their taxonomic relative abundances at both species and genus levels. However, due to the limited taxonomic resolution, we only analyzed the genus-level profiles of the 16S sequencing data. To control for intra-cohort confounding factors, we tested different distributions of the age, gender, body mass indexes (BMI), disease stage and geography between the case and control groups for each cohort, and adjusted the microbial compositions of the gut microbiome data for those with p-values<0.05 using removeBatchEffect function implemented in the ‘limma’ R package (Methods). We further removed cross-cohort batch effects using the adjust_batch function implemented in the ‘MMUPHin’ R package by using the project-id as the controlling factor.
To select the best ML algorithm, we evaluated four algorithms that were popular in gut microbiota studies, including Elastic Network (Enet)Citation78, LassoCitation79, Random Forest (RF)Citation80 and Ridge Regression (Ridge)Citation81 (Methods). We tested them on all datasets, among which CRC and IBD that have been extensively investigated in both individual cohorts and meta-analysesCitation6,Citation39,Citation40,Citation82. We first performed intra-cohort modeling (building single-cohort classifiers) and evaluation using five-fold three times cross-validations (5-fold 3 times; Methods). We then performed cross-cohort validation with applying the single-cohort classifiers to other cohorts of the same diseases, and measured the predictive performances as AUCs (area under the receiver operating characteristic curve). We obtained similar results in terms of internal and external validation AUCs with intra-cohort modeling for the four ML algorithms on selected diseases (Fig. S1A; Methods). In the end, we chose the Lasso algorithm for all subsequent analyses.
We also examined whether feature selection could improve the intra-cohort and/or cross-cohort validation of single-cohort classifier performances. To avoid over-fitting issues caused by label leakage, we adopted a nested feature selection strategy as recommended by Wirbel et al.Citation83 (Methods). When applying this strategy to five selected diseases, including CRC, CD, ASD, PD and AD, we found both internal and external AUCs were increased with the increasing top feature size in general (Fig. S1B), and selecting top features did not significantly improve the internal and external AUCs (Fig. S1C). Thus, we used all gut microbial features for ML modeling and validation in the subsequent analyses. In addition, we also found that logarithmically transforming the relative abundance data could significantly improve the external AUCs (Fig. S1D, p = 1.8e-06, paired Wilcoxon rank sum test) and marginally the internal AUCs (p = 0.074; Methods). Thus, we used the logarithmically transformed data in all subsequent analyses.
In addition to intra-cohort modeling, we also performed three combined-cohort modeling for diseases with required numbers of available cohorts (; Methods). First, for diseases with more than three cohorts, we performed a leave-one-dataset out (LODO)Citation39 analysis by training the model on the pooled samples from all cohorts except the one used for model testing (Methods). Second, for diseases with more than five cohorts, we performed a cohort-cumulation modeling (CCM) analysis by randomly combining increasing number of datasets for training and then testing the remaining cohorts in the same disease (Methods), and a sample-cumulation modeling (SCM) analysis by combining increasing numbers of samples randomly selected from the LODO training dataset as the training data and then testing the resulting classifiers on the remaining cohort of the same disease (Methods). These analyses helped us to determine whether including more samples from multiple cohorts could improve the predictive validation performances, and the minimal sample sizes required to achieve certain AUC levels.
Gut microbiome-based classifiers have high intra-cohort predictive accuracies with mean AUC 0.77
To test whether taxonomic relative abundances of the gut microbes (i.e., features) could be used to distinguish the cases from controls within each cohort, we first built Lasso classifiers using all features (excluding samples with only two taxa or fewer and low-abundant taxa; Methods) and validated their performance using five-fold three times repeated intra-cohort cross-validation (internal validation, Methods). For 16S cohorts, genus-level relative abundances were used; for mNGS cohorts, two classifiers were built for each cohort using genus- and species-level relative abundances, respectively. In total, we obtained 120 classifiers for the 83 cohorts. We observed decent predictive performances averaging at 0.77 AUCs (Q1, First Quartile: 0.62; Q3, Third Quartile: 0.90; SD, Standard Deviation: 0.16) (Table S2). When grouping disease into five categories according to the NCBI MeSH database, we observed no significant differences among the five categories, namely, Intestinal, Metabolic, Mental, Autoimmune and Liver disease (). However, the Intestinal diseases showed the highest mean intra-cohort validation AUC of 0.811, while the Metabolic diseases showed the lowest (0.692; ).
These intra-cohort AUCs were largely consistent with those reported in the works of literature (Fig. S1E, Table S5), except for three projects which our AUCs were significantly lower (Fig. S1E, indicated by red circles). Among them, the PRJNA686821 (ASD)Citation84 and PRJNA496408Citation46 (including MCI and AD disease samples) used a feature selection procedure that cause label leakage and artificially increase intra-cohort AUCsCitation85. For the PRJEB13092 (CFS)Citation86, the higher AUC reported by the literature was mostly due to using additional meta-data in the model training, which accounted for the top three most important featuresCitation86 (Table S5).
In addition, we found comparable internal AUC values among data types, although the AUC values were slightly higher when mNGS data-derived species-level relative abundances were used ().
Together, we showed that gut microbiome-based patient-stratification classifiers could have high intra-cohort predictive performances for the 20 diseases.
Prediction on independent cohorts leads to significantly reduced accuracy, except for intestinal diseases
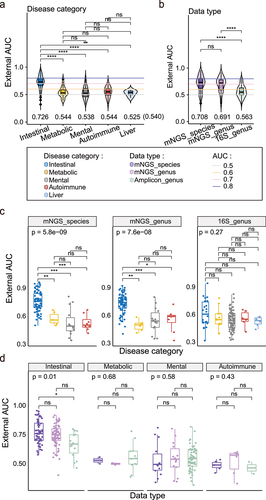
We then examined the predictive performance of the single-cohort classifiers on independent cohorts of the same diseases. We obtained in total 330 external validation AUCs with intra-cohort modeling and observed significantly decreased validation performances with an average AUC of 0.64 (Q1: 0.52, Q3: 0.76, SD: 0.15) compared with the intra-cohort validations (, p = 1.7e-12, Wilcoxon rank sum test). The decreases could be found in all disease categories (), and there were significant differences between disease categories (, p < 2.2e-16, Kruskal Wallis test); for example, we obtained decent external validation AUCs for the Intestinal diseases with an average of 0.73 (Q1: 0.65, Q3: 0.79; SD: 0.12; ), which was above the acceptable level of discrimination power (e.g., AUC>0.7). By contrast, the average AUCs in the other four disease categories dropped to ~ 0.54 (Q1: 0.47, Q3: 0.61; SD: 0.11; , Table S2), which was only slightly better than a random guess. Overall, the cross-cohort validation AUCs of single-cohort classifiers on intestinal diseases were significantly better than the other four disease categories (). Of note, we also calculated alternative model performance measurements for both the intra- and cross-cohort analysis, including AUC-PR (the area under the precision-recall curve) and MCC (Mathews Correlation Coefficient) (Methods), and observed consistent trends. In fact, all three measurements (i.e., the AUC, AUC-PR, and MCC) showed strong pairwise correlations (Fig. S2).
Figure 2. Comparation of external validation with intra-cohort modeling under different disease categories and data types. (a) Comparation of external validation AUCs with intra-cohort modeling between five different disease categories. Multiple adjusted two sides Wilcoxon rank sum test was used for pairwise group comparisons. Kruskal–Wallis test was used for multiple-group comparisons (p < 2.2e − 16). (b) Comparation of external validation AUCs with intra-cohort modeling between three different data types. Kruskal–Wallis test was used for multiple-group comparisons (p = 2.5e − 12). (c) Boxplots of external validation AUCs under different disease categories in each data type. Points represent the external validation AUCs, and colors represent the different disease categories. Kruskal–Wallis test was used for multiple-group comparisons and p values were shown at the top of the picture. Multiple pairwise Wilcoxon rank sum test comparisons were adjusted and p values were shown above the line segment. Box elements show the median and upper and lower quartiles. (d) Boxplots of external validation AUCs between different data types in each disease category. BD (Only diseases with both 16S and mNGS sequencing types were included.
We speculated that the high external AUCs in the intestinal diseases were due to the direct interactions between the diseased sites and the gut microbiota. For example, CRC, CD, and IBD are often associated with physiological/pathological changes in the intestineCitation87, which will render direct and significant impacts on the gut microbiota. So, they dominate the effects over other biological and technical factors, and facilitate cross-cohort validation. This line of reasoning predicts that intestinal diseases that are either at early disease stages (i.e., Adenoma) or often dormant (i.e., IBS) that do not significantly change the intestine and/or the gut microbiome, should have lower cross-cohort validation results. As expected, we observed high external validation performances for CD, IBD, and CRC with averaging AUCs of 0.79, 0.77, and 0.74, respectively, in contrast to much lower external AUCs of 0.59 and 0.547 for Adenoma and IBS (Fig. S3; Table S2).
Together, we showed applying single-cohort ML classifiers to independent cohorts generally led to significantly decreased predictive performance. In addition, we identified the disease category as a key determinant for reproducible gut microbiome-based disease classifiers.
mNGS-based classifiers perform better than 16S-based ones in cross-cohort validation in intestinal diseases
During the external validation analysis of the single-cohort classifiers, we observed significantly higher performances of the mNGS-based classifiers than the 16S-based ones: as shown in , the AUCs of both the mNGS species- (mean: 0.71, SD: 0.15) and genus- (average: 0.69, SD: 0.14) level classifiers were higher than 16S (mean: 0.56, SD: 0.11). These results implied that data type could also be a determinant factor in cross-cohort validation.
Since the above analysis could be confounded by the disease category, we dissected the contributions of the two factors (i.e., data type and disease category) to the external validation AUCs using a two-way analysis of variance (ANOVA). Due to the imbalanced design of our data, i.e., the number of observations is different in different treatments, we found that both contributed significantly to the external AUCs (, p < 2.1e-6, ANOVA; Table S3) when first adjusting the data type and then the disease categories as covariables. However, we identified the disease category as the only significant contributor (, p < 2.1e-6, ANOVA; Table S3) when first adjusting the disease category and then the data type. These results implied that the disease category is a predominant determinant of reproducibilityCitation88, whereas the data type might be a significant factor only in certain disease categories.
Figure 3. ANOVA analysis and comparation of external validation with intra-cohort modeling in detail. (a) Two-factor with interaction (data type * disease category) ANOVA of external AUCs. The R2 and p values of the factors were shown above the box. (b) Two-factor with interaction (disease category * data type) ANOVA of external AUCs. The R2 and p value of the factors were shown above the box. (c) Boxplots of external validation AUC under five disease categories in 16S genus data (dataset excluded IBD). Points represent the external validation AUCs, and colors represent the different disease categories. Kruskal–Wallis test was used for multiple-group comparisons and p value was shown at the top of the picture. Multiple pairwise Wilcoxon rank sum test comparisons were adjusted and p values were shown above the line segment. Box elements show the median and upper and lower quartiles. (d) Boxplots of external validation AUCs between mNGS species and 16S genus in intestinal disease which only included disease with all three data types, including CD, CRC and UC). Colors represent the different data types. Two sides Wilcoxon rank sum test was used and p values were shown above the picture. Box elements show the median and upper and lower quartiles.
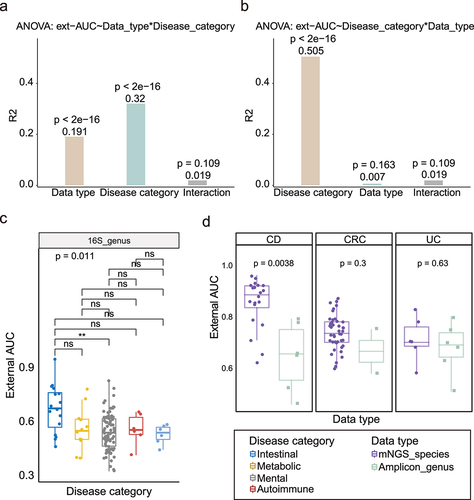
We then reanalyzed the external validation results by considering the two factors at the same time. As shown in , when the data type was controlled, we confirmed the significantly higher external AUCs of the intestinal disease than that of the other three disease categories in mNGS-based species- and genus-level classifiers (, two subgraphs on the left; all pairwise Wilcoxon rank sum test adjusted p < 0.01; Kruskal–Wallis test: species p = 5.8e-09, genus p = 7.6e-08), but not in the 16S-based classifiers. Considering IBS is a functional bowel disorder and associated with stressful life events, we excluded it from intestinal disease and compared again. Then, we observed the intestinal disease was better than the mental disease (, pairwise Wilcoxon rank sum test adjust p = 0.0046). When controlling for the disease category, we observed significantly higher external AUCs of the mNGS-based species-level classifiers than the 16S-based genus-level classifiers only in the Intestinal disease () especially for CD (). Furthermore, we did not observe any significant differences in the Metabolic, Mental and Autoimmune diseases (), and their generally low cross-cohort validation results regardless of the data type.
Together, our results suggested that mNGS-based classifiers could improve the cross-cohort validations, likely because they offered higher taxonomic resolutions. However, we only observed such improvements in intestinal diseases.
Pooling of training cohorts substantially improves predictive performances in independent cohorts for non-intestinal diseases
To overcome limitations of single-cohort classifiers, we performed three combined-cohort analyses by pooling samples from multiple cohorts for training and validated in independent cohorts (). First, a leave-one-dataset out (LODO) analysis was performed for each of 12 diseases (, Table S1) with 3 cohorts, which trained classifiers on n-1 datasets combined (where n was the number of all cohorts of a disease of interest), and validated them on the one left-out cohort, for each cohort in turnCitation89. We observed increases of the median external AUCs for both the intestinal and non-intestinal diseases, respectively; among which, the increases for the latter were significant (, p = 0.027, paired Wilcoxon rank sum test). Closer examination on each non-intestinal disease indicated that the LODO analysis increased the external validation AUCs median for all diseases (T2D, AD, PD, ASD, and NAFLD) but one (RA; ). For RA, the overall AUCs were likely affected by the much lower external validation results (0.38) between PRJ356102 and PRJ487636; in addition, samples from these cohorts accounted for, respectively, 53% and 38% of the total samples in the training set, which could lead to lower predictive accuracies in other cohorts. The increases varied from 1.13% to 13.27% among the diseases, although none reached statistical significance, except for the ASD 16S cohorts (, p < 0.031, paired Wilcoxon rank sum test). For each intestinal disease, we observed increases in the external validations AUCs for UC, CD with 16S data, and CRC with mNGS data, but not the IBS and Adenoma (Fig. S4A or Table S2). For IBS, the internal AUC of PRJ268708 (AUC = 0.97) was better than the other two cohorts (all AUCs<0.58), while the external AUC of PRJ268708 involved (median AUC = 0.46) was lower than the others (median AUC = 0.53), which may be due to over-fitting modeling of PRJ268708. For Adenoma, the external validation AUCs were generally low (0.59) indicating difficult to distinguish from health; nevertheless, our results were consistent with previous meta-analysis on AdenomaCitation39. Overall, these results suggested pooling of training cohorts could improve predictive performances in independent cohorts for most diseases (9 out of 12, 75%).
Figure 4. The improvement of the external validation in LODO and Cohort-Cumulation modeling. (a) Left: Comparation of median external validation AUCs between intra-cohort and LODO modeling method under non-intestinal diseases. Each point represents the median external AUC of each cohort (as testing dataset). Two-side paired Wilcoxon rank sum test was used for pairwise group comparisons. Right: Comparation of median external validation AUCs between intra-cohort and LODO modeling method under intestinal diseases. (b) Comparation of median external validation AUCs between intra-cohort and LODO modeling method per non-intestinal disease. Two-side paired Wilcoxon rank sum test was used for pairwise group comparisons. (c) External AUCs for the testing datasets at increasing numbers of training cohorts considered for the model (CCM). Non-intestinal diseases with more than or equal to 5 were shown here (including ASD and PD). The green line linked the median external AUC at each number of training datasets. (d) External AUCs for the LODO modeling at increasing numbers of samples considered for the training model (SCM). Non-intestinal diseases with more than or equal to 5 were shown here (including ASD and PD). The green line linked the median external AUC at each number of training datasets. The red line represents the linear regression model of the No. of training samples to median external AUC (Table S4), and Spearman correlation analysis was also carried out (the correlation coefficient and p value were shown at the top).
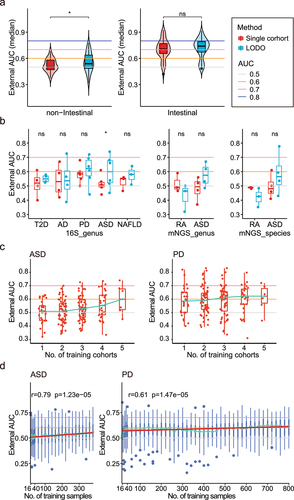
We next tested whether adding more cohorts could continuously improve the external validation performances using a cohort-cumulation analysis for diseases with 5 cohorts, which trained models by randomly combining 2 to n-1 cohorts and validated them on the left-out ones (CCM). Four diseases met the criteria for such an analysis, including ASD, PD, CRC, and CD; among which, six 16S cohorts were available for ASD and PD, respectively, and seven and five mNGS cohorts were available for CRC and CD. For ASD and PD, we obtained continuously improved external validation AUC with the increase of the number of training datasets (). However, even when n-1 cohorts were combined as the training set (e.g., the same as the LODO analysis), we still observed very low external AUCs with medians of 0.6 and 0.62 for ASD and PD, respectively, indicating additional samples/cohorts may be required to further improve the predictive validation performance. For CRC and CD, we did not always observe the increased external AUCs with the increasing numbers of cohorts; however, we did obtain the highest predictive performance with the three cohorts and one cohort combined, respectively (0.77 and 0.89 for CRC and CD, respectively, Fig. S4B).
Together, our results suggested that combining samples from multiple cohorts as the training data, i.e., combined-cohort analyses, did improve the predictive performances in external validation, especially for the non-intestinal diseases.
CD and CRC achieve high external validation with small sample sizes, whereas ASD and PD require more samples
To estimate the minimal number of required samples to train a classifier that can achieve high external validation performances, e.g., predictive AUCs 0.7, we performed a sample-cumulation analysis (one of combined-cohort analysis) on the diseases used in the cohort-cumulation analysis, for which we trained the classifiers by randomly selecting increasing number samples from the pool of n-1 cohorts combined, and tested them on the left-out cohort (Methods). For both ASD and PD, we observed an increasing trend in the external AUCs in a linear growth with the increasing number of training samples (; ASD: Spearman correlation coefficient r = 0.79, p = 1.23e − 05; PD: r = 0.61, p = 1.47 e − 05). Thus, applying a linear regression model to fit the relationships between the number of training samples and the external AUCs (median), we estimated that a total of 1,600 and 2,400 samples would be required for ASD and PD to achieve a median external AUC of 0.70 (95%CI: 0.62–0.78) and 0. 70 (95%CI: 0.64–0.76) (Table S4, both p < 0.0001, F-test).
Conversely, in both CRC and CD, we observed a rapid increase of the external AUCs at the very beginning of the sample-cumulation analysis, which quickly plateaued at 80 ~ 100 samples (Fig S4C); at this relatively small sample size, the external results were already very high, with 0.74 and 0.86 AUCs (~80 samples) for CRC and CD, respectively. In fact, with only~40 samples for the two diseases, we could obtain high AUCs of 0.73 and 0.86 for CRC and CD, respectively. After the plateau, the AUCs for CRC could be further improved with increasing number of samples, although at a much slower pace (Fig. S4C); however, the external AUCs for CD were not increased (Fig. S4C). These results were consistent with previous resultsCitation69, and speculation that the direct interaction between the diseased site (i.e., the intestine) and the gut microbiota could greatly facilitate the classifier validation in independent cohorts.
Cross-cohort marker consistency, measured by marker similarity index (MSI), showed similar trends to the modeling analysis
We also evaluated the consistencies of microbial markers (i.e., disease biomarkers) across cohorts of the same disease. The biomarkers often showed significant differences in their relative abundances between the case and control groups, and were targets for disease intervention and treatment. We identified the microbial markers using LEfSe (Linear discriminant analysis Effect Size; Methods), one popular method for disease marker identification in microbiome studies, and observed in general high consistencies among cohorts of intestinal diseases such as CRC, CD and IBD (Fig. S5). For example, markers showed excellent consistency among the seven mNGS cohorts for CRC (Figure S5); at the genus level, three genera were enriched in patients of all cohorts, including Peptostreptococcus, Parvimonas, Porphyromonas. At the species level, three species were enriched in patients of all cohorts, including Peptostreptococcus stomati, Fusobacterium nucleatum, Gemella morbillorum, followed by two disease-enriched species in six projects, including Solobacterium moore and Porphyromonas asaccharolytica. These results were consistent with previous studiesCitation1,Citation39,Citation69. Conversely, we observed low consistencies among cohorts of the non-intestinal diseases such as the ASD, RA and Adenoma (Figure S5). For example, microbial markers of ASD showed poor consistency across the six 16S cohorts (Figure S5): out of a total of 44 markers, most were either cohort-specific, or enriched/depleted in only two or three cohorts. The only genus, Collinsella that was identified as a marker in four cohorts, showed disease-enrichment in three projects, but health-enrichment in one other project (Fig. S5).
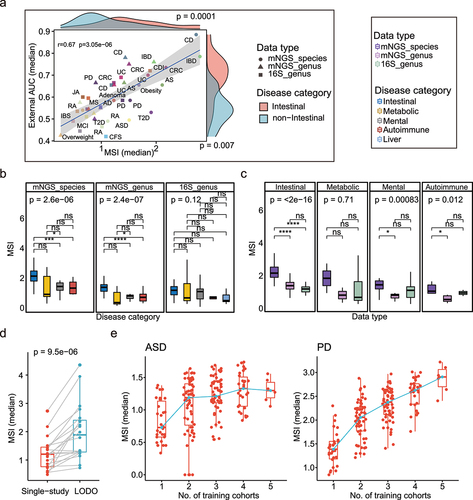
To quantify the cross-cohort marker consistency, we created a Marker Similarity Index (MSI) defined by the adjusted Euclidean distance between the Linear Discriminant Analysis (LDA) scores of the biomarkers from two cohorts (Methods). Higher (lower) MSI scores indicate higher (lower) cross-cohort marker consistencies. As expected, the median MSI scores significantly positively correlated with external validation AUCs of diseases (; Spearman Correlation Coefficient r = 0.67, p = 3.05e − 06), the same was true when training data organization under LODO modeling method (Fig. S6A; Spearman Correlation Coefficient r = 0.48, p = 3.11e − 02). Consistent with the modeling analysis, the MSIs of the intestinal diseases were significantly higher than the other three disease categories ( left two and Fig. S6B, p < 0.05, Kruskal Wallis test); in addition, the MSIs at the species level were significantly higher than the genus-level (, all Kruskal Wallis test p < 0.05 except Metabolic disease category). Moreover, we observed significantly increased MSI scores when dataset organization under combined-cohort analysis, including both the LODO and cohort cumulative methods (, Fig. S6C).
Figure 5. Association between external validation results and Marker Similarity Index (MSI) results. (a) Correlation between the median MSIs and external validation AUCs using intra-cohort modeling of each disease (Spearman r = 0.67 p = 3.05e − 06); the shape and color represent different data types and diseases. The x-axis value of each point represents the median of MSI when dataset under organization of intra-cohort modeling in each disease, and the y-axis value represents the median external validation AUC using intra-cohort modeling in each disease. The density distributions of x- and y-axis between intestinal and non-intestinal diseases were shown at the top and right. Two-side paired Wilcoxon rank sum test was used for pairwise group comparisons. (b) Boxplots of MSIs under different disease categories in each data type. The colors represent the different disease categories. Kruskal–Wallis test was used for multiple-group comparisons and p value was shown at the top of the picture. Multiple pairwise Wilcoxon rank sum test comparisons were adjusted and p values were shown above the line segment. Box elements show the median and upper and lower quartiles. (c) Boxplots of MSIs between different data types in each disease category. Dataset only included disease with all three data types. (d) Comparation of median MSIs when dataset under organization of intra-cohort and LODO modeling method in each disease. Two-side paired Wilcoxon rank sum test was used for pairwise group comparisons. (e) Median MSIs calculated from dataset under organization of CCM. The green line linked the median MSI at each number of training datasets. Non-intestinal diseases with more than or equal to 5 were shown here (including ASD and PD).
Of note, we obtained similar results using MSI scores calculated from other microbial marker identification tools, including ALDEx2 and MaAsLin2, which were recommended by recent two publicationsCitation90,Citation91 in which a total of 38 and 11 such methods were evaluated respectively. As shown in Fig. S7, we observed significant positive correlations between the external AUCs and the MSI scores calculated from the makers identified by ALDEx2 or MaAsLin2 (Fig. S7A); in fact, the MSI scores based on all the three marker identification methods, namely LEfSe, ALDEx2 and MaAsLin2 showed similar trend across disease categories and data types (Fig. S7BC), and had strong pairwise positive correlations (Fig. S7D) regardless of difference of them (Fig. S7E). However, we did obtain the highest correlation between the LEfSe-based MSIs and the external AUCs (r = 0.67 as comparing 0.43 and 0.46 for the other two tools, respectively). Nevertheless, our MSI calculation was robust regardless of the maker identification methods.
Together, our results indicated that microbial marker consistencies across cohorts were generally low for non-intestinal diseases, but could be significantly improved by the combined-cohort analysis, consistent with the modeling analyses above.
Discussion
Due to its relevance in human diseases, the human gut microbiome has been increasingly used as biomarkers for noninvasive disease prescreening, and targets for disease intervention. However, because the gut microbiome can be significantly affected by many factors, controversies exist with regard to the reproducibility of gut dysbiosis in different cohorts. In this study, we comprehensively evaluated the reproducibility of gut microbiome as diagnostic prescreening tools in 83 disease-control cohorts for 20 diseases. We built machine learning classifiers using taxonomic species- and/or genus-level taxonomic relative abundances of the gut microbes, and performed intra-cohort, cross-cohort and combined-cohort predictive validations for each of the diseases. We focused on the external validations, i.e., applying the classifiers in independent cohorts, and identified three significant influential factors (i.e., the determinants), namely the disease category, the data type, and the sample size. First, single-cohort classifiers of all but the intestinal diseases in general failed to accurately predict diseases in cross-cohort validation analysis, with averaging AUCs of 0.64 (0.73 for the intestinal diseases, 0.54 for the non-intestinal diseases). Second, mNGS data that were known to provide higher taxonomic resolution than the 16S amplicon data, could significantly improve external validation performance, but only for the intestinal diseases. Last, using increased number of samples as the training data, e.g., by pooling samples from multiple cohorts, could substantially improve the predictive performances of the resulting classifiers in external validations, especially for the non-intestinal diseases. However, to reach a practical AUC of 0.70, much larger numbers of samples would be required for the non-intestinal diseases such as ASD and PD. Our results were consistent with previous studies that reported high cross-cohort validation results for CRCCitation39,Citation69 and CDCitation83, low external AUCs in T2DCitation69 and AdenomaCitation39, and supported that the combined-cohort analyses including LODO and cohort-cumulation could improve external AUCsCitation39,Citation69,Citation70. We also analyzed the consistency of disease biomarkers across cohorts of the same diseases, and found essentially the same trends (i.e., markers in general did not agree across cohorts with the except for intestinal diseases) and determinants (i.e., disease category and sample size). Overall, our results support the use of gut microbiome as independent, cross-cohort diagnostic tools for only handful intestinal diseases.
The gut microbiome is known to be significantly affected by many factors, including diseasesCitation39,Citation92, dietCitation56, drugsCitation57,Citation58,Citation63, seasonal changesCitation93, regional differencesCitation59, genetic backgroundsCitation94–96, sample preprocessing and data analysis methodsCitation60–62. We argue that factors that have consistent gut microbial signatures and significantly affect the gut microbiota, can greatly promote cross-cohort predictive validation of the gut microbiome-derived classifiers. One such factor is the intestinal diseases such as CRC and CD (or IBD). These diseases are associated with significant and global changes of the intestine that render direct and significant effects on the gut microbiota, and mask the effects of other environmental and technical factors; in addition, they also have consistent gut microbiome signatures such as the P. stomatis, F. nucleatum, G. morbillorum in the CRC, and Ruminococcus gnavus, and Veillonella species in the CD. Consequently, classifiers based on relatively small sizes of samples (~less than 100) validated well in independent cohorts (Fig. S3BTable S2). This was more evident in the sample-cumulation analysis that as few as 40 samples randomly selected from multiple cohorts could achieve high predictive performance of 0.73 and 0.86 AUCs for CRC and CD, respectively (Fig. S4C). Part of the reason was that sampling from multiple cohorts could help combine common characteristics between multiple cohorts, and generated classifiers with improved generalization ability. This line of reasoning correctly predicted the low cross-cohort validation performance of Adenoma (Fig. S3A), which did not cause global changes of the intestine, and IBS, which did not significantly affect the gut microbiota when dormant (Fig. S3A). The other such factor includes drugs such as proton pump inhibitors (PPI) and metformin that have distinctive gut microbiome signatures. In the present study, we did not specifically analyze the impacts of drug usage on cross-cohort validations, because treatment information was largely unavailable for most cohorts due to ethical reasons. However, there were plenty of related discussions in the literatureCitation12,Citation58,Citation65,Citation66. These drugs often dominated the alterations in gut microbiome whose signatures showed cross-cohortCitation12,Citation42,Citation66, and even cross-disease consistenciesCitation58. For example, PPI is commonly used to treat liver diseasesCitation97 and multiple types of cancersCitation98, and causes significant increase of oral bacterial species in the gut microbiota, especially those belonging to the genera of Veillonella and StreptococcusCitation58,Citation65,Citation66,Citation99.
Conversely, factors that do not have consistent gut microbiota signatures often undermine the cross-cohort predictive performance, such as diet, age, BMI, sample preprocessing, and batch effects. These factors are either too complicated to quantify in general (e.g., diet) or have inconclusive effects on the gut microbiota according to the literatureCitation59,Citation69. In addition, disease definition, and diagnostic criteria could be different for complex diseases such as ASD, PD in different cohorts; for diseases with subtypes, the relative proportions of the subtypes could also be different across cohorts. These will further undermine the cross-cohort validation results. Unfortunately, these detailed meta-data are often unavailable for most cohortsCitation100. Thus, although we had adjusted within and cross-cohort confounding factors, our results represented the lower limits of the cross-cohort validation performance of gut microbiome-based disease classifiers, which could be certainly improved if above-discussed factors were properly recorded and controlled.
Despite being the largest meta-analysis on disease-related gut microbiomes to date, our study had the following limitations. First, we were only able to include a small fraction of human gut microbiota research published. Especially for combined-cohort analysis, only few diseases were available. This was in part due to the lack of reporting guidelines for human gut microbiome researches that were only publicly available in late 2021Citation101, and central repositories to enforce the guidelines and accommodate essential meta-data such as age, gender, BMI, health and disease statuses. Consequently, over two-thirds of the human gut microbiome samples deposited to general-purpose sequence archives such as NCBI SRA (Sequence Read Archive)Citation102 and ENA (European Nucleotide Archive)Citation103 lacked the essential information such as age, gender or BMICitation100. Microbiome-centric databases including MGnifyCitation104, MG-RASTCitation105, and gcMetaCitation106 only partly solved the issues but did not enforce characteristics essential for understanding human health and diseases. Recently, databases and resources with consistently analyzed human gut microbiomes and manually curated meta-data were made available by several research groups, including HumanMetagenomeDBCitation107, GMrepoCitation68,Citation100 and curatedMetagenomicDataCitation108. These would significantly promote meta-analysis of disease-related human gut microbiomes, but systematic efforts are still needed in the future. Second, we were only able to control limited numbers of known confounding factors for the intra-cohort and cross-cohort analyses, due to lack of metadata in most cohorts (Table S1). Third, we were not able to reevaluate the excellent validation results in independent cohorts reported for several diseases, including Hepatocellular Carcinoma (HCC)Citation109, and ASDCitation84, due to unavailable discovery sequencing data and/or corresponding meta-data (Table S5). Further efforts would be required to include more datasets and diseases. Finally, more advanced data pre-processing methods should be tested thoroughly and consequently apply to microbiome analysis. For example, the taxonomical composition from a metagenomic sample is often sparse and compositionalCitation110, with the taxa being phylogenetically and/or functionally relatedCitation111. Conventional linear regression model may not perform well and require more computational power when the predictor variables (taxa) are high dimensional and highly related. However, the Lasso algorithm with the penalty term and RF outperformed many others such as SVM and deep learning when applied to human disease stratification, likely because of its excellent ability to handle small datasetsCitation37,Citation112 (e.g., with 50 samples or less). Recently, researchers proposed to aggregate the sparse signals based on either phylogenetic relatednessCitation111,Citation113,Citation114, or functional similaritiesCitation115, and some could perform better than Lasso in terms of feature selection although their applicability in disease stratification is yet to be tested. Regardless, these data-processing methods should be systemically evaluated in the near future. In addition, we encourage more comprehensive guidelines of microbiome public resource and analysis, which promotes meta-analyses to get reproducible findings.
In conclusion, we systematically evaluated the reproducibility of gut microbiome as disease markers and diagnostic prescreening tools for 20 diseases, and identified their dormant factors. We supported strongly the feasibility for gut microbiome as independent, cross-cohort diagnostic tools for several intestinal diseases, and recommended strategies to improve the cross-cohort predictive performances for non-intestinal diseases.
Material & methods
Study collection
We first compiled a comprehensive list of human disease related case–control studies on gut metagenome by searching in public databases including MGnify (https://www.ebi.ac.uk/metagenomics/)Citation104, NCBI Sequence Read Archive (SRA) (https://www.ncbi.nlm.nih.gov/sra)Citation102 and GMrepo (a curated database of gut human metagenomes; https://gmrepo.humangut.info)Citation68,Citation100, which included 361 case–control studies on 134 different diseases (Table S1, the run-level data included 34,702 cases and 45,429 controls). Studies that contained more than two different diseases were only counted once. We excluded projects that had incomplete disease phenotype metadata, or contained<15 samples in the case or control groups (Table S1). We synthesized the supplementary samples by using an over-sampling technique known as SMOTE (Synthetic Minority Oversampling TEchnique) when the ratio between case and control was out of balanceCitation116 (see details below).
We divided the qualified projects into two subcategories according to their sequencing strategies, namely 16S ribosomal RNA gene amplicon sequencing (16S) and shotgun metagenomic next-generation sequencing (mNGS). In each subcategory, we also excluded diseases that had only one study, in order to perform cross-study/cohort comparisons. In the end, we retained in total 69 studies on 20 diseases, including 41 16S studies on 15 diseases (sample-level: 3,573 cases, 2,090 controls), and 28 mNGS studies on 12 diseases (sample-level: 2,411 cases, 1,634 controls) (Table S1 all_models_data, ). Among these, seven diseases had both multiple 16S and mNGS studies (Table S1, ).
We divided the 20 diseases into five disease categories according to the Medical Subject Headings (MeSH, https://meshb.nlm.nih.gov/) database and Human Disease Ontology (DO) databaseCitation77, including Intestinal, Autoimmune, Metabolic, Mental and Liver disease types. Intestinal diseases included those associated with the intestinal tract, whereas the Mental diseases here represent Mental and Nervous System disorders.
Sequencing data processing and taxonomic annotation
Raw sequencing data were downloaded from the NCBI SRACitation102 or European Nucleotide Archive (ENA)Citation117. TrimmomaticCitation118 was used to trim the reads to remove sequencing vectors and low-quality bases; reads shorter than 50 bps after trimming were also removed. The remaining reads were referred to as ‘clean reads’.
For mNGS data, putative human reads were identified by aligning the ‘clean reads’ to the human reference genome (hg19) using Bowtie2Citation119 with default parameters, and removed from subsequent analysis. Multiple sequencing runs corresponding to the same sample were merged. MetaPhlAn2Citation120 (with default parameters) was used for taxonomic profiling and to calculate the relative abundances of recognizable taxa at various clades from phylum to species. In the end, we retained the relative abundance information at genus and species levels for each sample for downstream analysis.
For 16S data, QIIME2 version 2021.2 pipelineCitation121 was used. Raw data were denoised to amplicon sequence variants (ASVs) tables by DADA2 version 1.18.0Citation122. Taxonomic assignment of the individual dataset was classified against the Greengenes database version 13.8Citation123. Genus-level relative abundance results were retained for subsequent analyses. We also annotated the 16S data for three diseases which had more cohorts (including ASD, T2D, PD) for taxonomy information using the Silva database (https://www.arb-silva.de, version 138) (Table S2) and found similar model performance (i.e., both the internal and external AUCs) to the Greengenes-based annotations (Fig. S8A). Thus, the taxon abundance data classified against the Greengenes database were used in the subsequent analyses.
Then, samples with two taxa or fewer were also removed from further analyses. To avoid noises caused by low abundant taxa, those with relative abundance<0.001 across all samples were filtered.
Removal of confounders and batch effects
Before disease marker identification and disease prediction modeling, we identified confounding factors for each cohort and subsequently removed their effects on the taxonomic relative abundance profiles. To do so, we checked all available factors in the metadata such as age, gender, body mass indexes (BMI), disease stage and geography, and tested whether they were significantly different between the case and control groups of a cohort. We used the Fisher’s exact test for qualitative variables (including age, BMI), and the non-parametric Wilcoxon rank sum test for quantitative variables (including gender, disease stage and geography). Factors with p values<0.05 were adjusted in the study using removeBatchEffect function implemented in the ‘limma’ R packageCitation124 (v.3.46.0, significant qualitative and quantitative variables as covariates and batch respectively, others with default).
To facilitate cross-study/cohort comparison, we also removed batch effects using the adjust_batch function implemented in the ‘MMUPHin’ R packageCitation125 (v.1.4.2) by using project id and co-confounders as the controlling factors.
Subsequent analyses were performed on the relative abundance data after either the removal of confounders (for LEfSe) or the removal of both confounders and batch effects (for intra-cohort modeling and combined-cohort modeling).
Modeling data preprocessing, machine learning modeling, and performance evaluation
The ‘SIAMCAT’ R package v.1.9.0 (https://bioconductor.org/packages/SIAMCAT)Citation83 was used to build disease-stratification classifiers (or models). Briefly, the following parameters were used as recommended by the authors: (1) use default feature cutoff of 0.001 to filter lowly abundant taxa in filter.features function; (2) set norm.method = ‘log.std’ and default norm.param (log.n0 = 1e-06, sd.min.q = 0.1) to normalize filtered relative abundances in normalize.features function, which means log-transforms (after addition of pseudocounts) and applying z-score standardization; (3) the num.folds and num.resample parameters in create.data.split function were adjusted for different data combination methods such as intra-cohort, combined-cohort modeling.
Predictions were performed using the make.predictions function. Prediction performances were evaluated by the area under the receiver operating characteristic curve (AUROC or AUC) scores using the ‘pROC’ R package (implemented in the evaluate.predictions function in ‘SIAMCAT’ package).
For comparison, we also calculated two other performance measurements including the area under the precision-recall curve (AUC-PR) and Mathews Correlation Coefficient (MCC). The AUC-PR was calculated by the evaluate.predictions function with default parameters implemented in the ‘SIAMCAT’ R package. The MCC was calculated using the mcc function with default parameters implanted in the ‘mltools’ (v.0.3.5) R package (https://github.com/ben519/mltools), which also calculated the true positive (TP), false positive (FP), true negative (TN) and false negative (FN) rates.
Selection of machine learning algorithm for disease modeling
To select the best machine learning algorithm for disease modeling, we compared four such methods including Elastic Net (Enet)Citation78, LassoCitation79, Random Forest (RF)Citation80 and Ridge Regression (Ridge)Citation81 implemented in SIAMCAT. The method parameter (‘lasso’, ‘enet’, ‘ridge’, ‘randomForest’) in train.model function controlled the choice of the machine learning algorithm.
Dealing with imbalanced cohorts
An imbalanced cohort refers to those with significantly more cases (e.g., three times in this paper) than the controls, and vice versa. Modeling on unbalanced cohorts often leads to biased classification toward the majority class samplesCitation126. In this study, an over-sampling method called SMOTECitation116 was used to increase the rare group samples. This method was based on a k-nearest neighbor (KNN) algorithm, and implemented in the ‘smotefamily’ (v.1.3.1) R package SMOTE function (https://CRAN.R-project.org/package=smotefamily). We took dup_size parameter to be the maximum between three and half ratio of large group number to small one, which represents the desired times of synthetic minority instances over the original number of majority instances. And other parameters with default. We compared the AUCs (internal and external) calculated by the microbiome data processed by SMOTE before and after (Fig. S8B, Table S1–2). We found AUCs calculated by data processed after SMOTE were significantly higher than that original data (Fig. S8B, internal: p = 0.002, external: p = 0.0067, paired Wilcoxon rank sum test).
Internal validation versus external validation
Internal validation was referred to as training on the part of the dataset and testing on the left part from the same cohort. On the other hand, external validation was referred to as training on one dataset and testing on independent cohort(s) (also referred as cross-cohort validation). To make full use of the samples and get strict cross-validation results with best hyper parameters, a nested cross-validation strategy was used as recommended by the authors of the ‘SIAMCAT’ R packageCitation83. For example, nested 5 folds cross-validation was: first, the dataset was randomly split into 5 outer folds, then 4 folds samples were combined to train and the left 1 fold to test, and then performed a grid search on the 4 outer folds training dataset through inner 5-fold cross-validation in order to find the best hyperparametersCitation85. We referred the training models as single-cohort models. The model performances were measured by AUC scores. Notably, in external validation, the absent features which presented in the training set but not in the testing set were supplemented by 0.
Intra-cohort modeling and validation
The intra-cohort modeling (i.e., single-cohort classifiers) was carried out for each cohort using five-fold three times cross-validation. The model was built using the train_model function (num.folds = 5, num.resample = 3 in create.data.split function) implemented in the ‘SIAMCAT’ R packageCitation83. The prediction (or validation) used make.predictions and evaluate.predictions functions. The intra-cohort validation was internal validation.
Combined-cohort modeling and validation
In this study, three combined-cohort modeling and validation strategies were performed for diseases with required numbers of available cohorts, including the leave-one-dataset out (LODO) analysis, cohort-cumulation modeling (CCM), and sample-cumulation modeling (SCM).
First, a LODO analysisCitation39 was applied to diseases with 3 cohorts, which trained classifiers on n-1 datasets combined, and validated them on the one left-out cohort, for each cohort in turnCitation89. Here, the n referred the number of cohorts for a given disease. The LODO analysis examines whether combining multiple cohorts for modeling training can improve the predictive performance of the resulting classifiers.
Second, a cohort-cumulation modeling (CCM) was applied to diseases with 5 cohorts, which randomly selected and combined a certain number of cohorts for training, and tested the remaining cohorts in the same disease. The diseases that met this requirement included ASD, AD, CRC and CD. The CCM analysis examines whether the model performance can be improved with the increasing number of training cohorts.
Last, a sample-cumulation modeling (SCM) was also applied to diseases with 5 cohorts, which randomly combined increasing numbers of samples selected from the LODO training dataset and then testing on the remaining cohort of the same disease. The ratio of case to control when selecting training samples was set to 1:1. We showed the increasing number from 16 to 40 with interval of 6 and from 60 to maximum with interval of 20. The SCM analysis examines whether the model performance increases with the increasing number of samples in modeling training.
For the above combined-cohort modeling, we used ten folds three times repeated cross-validation (num.folds = 10, num.resample = 3 in the create.data.split function) and only noted external (cross-cohort) validation AUCs. For CD and CRC which were mNGS data type, species level data was used to model for CCM and SCM. Otherwise, 16S datasets genus level was used for modeling.
The list of diseases used for the above analyses could be found in Table S1.
Disease marker identification using linear discriminant analysis effect size (LEfSe)
Disease marker taxa were identified using LEfSe analysisCitation127 implemented in the ‘microbiomeMarker’ R package run.lefse function (v.1.0.2, downloaded from https://github.com/yiluheihei/microbiomeMarker)Citation128. The effect size score output, i.e., the linear discriminant analysis (LDA) score, can reflect the extent of the differences, with the larger value indicating the more significant differences.
Taxa with LDA scores 2 were considered markers. In this study, we assigned a plus (minus) sign to the score to indicate the corresponding marker was enriched in the case (control) group.
Measuring the similarity of disease markers between cohorts of the same disease
To measure the marker similarity between two cohorts, a Marker Similarity Index (MSI) was created. The MSI was calculated using the following equation by taking the two corresponding LDA score vectors of the markers as inputs. Let and
be the two cohorts, and the vectors
and
be the LDA scores of their markers. The two vectors should be equal in size and aligned according to the
markers in
(considering
). Therefore, markers that are not in
will be removed from
, whereas those that are not in
will be supplemented with LDA scores of zero. The final MSI score will be calculated as the Euclidean distance of two vectors. When A only had one or no marker, the
is defined as 0.
Thus, the MSI is asymmetrical: and
can have different values considering different references.
regards
cohort as the reference, which can be analogous to training sets in cross-cohort validations.
To examine the effects of LDA cutoffs on the MSI, we calculated the MSIs with different LDA cutoffs ranging from 0 to 4. We found that the MSIs were stable between 0 and 2 (Fig. S9A) and then decreased rapidly after LDA>2 because fewer markers were retained (Fig. S9B). We randomly chose the MSI values calculated from several LDA cutoffs between 0 and 2, and found significant positive correlations between MSIs and external AUCs (Fig. S9C). Thus, the LDA cutoffs do not affect our main conclusion. In this study, taxa were considered as markers with LDA scores≥2.
For comparison, we also examined if our MSI calculation was robust against different marker identification methods. We selected two such methods, including ‘ALDEx2’ (implemented in the ‘ALDEx2’ R package (v.1.26.0)), and ‘MaAsLin2’ (implemented in the ‘MaAsLin2’ R package (v.1.26.0)), which were recommended by two recent publications in which a total of 38 and 11 such methods were evaluatedCitation90,Citation91. For ‘ALDEx2’ and ‘MaAsLin2’, we selected features with Benjamini-Hochberg (BH) FDR-corrected p-value<0.1 as markers and used the output effect (the median of the ratio of the between group difference and the larger of the variance within groups) and coef (the coefficient from the fit model) values to calculate the MSIs, respectively. As mentioned before, we obtained the highest correlation between the LEfSe-based MSIs and the external AUCs, we used the LEfSe-based MSI calculations in the subsequent analyses.
Comparing model performance with or without feature selection
To avoid over-fitting issues caused by label leakage, a nested feature selection strategy was used as recommended by Wirbel et al.Citation83. Briefly, a specific number of top features were selected during cross validation for the training set by calculating the single feature absolute AUC and sorting the resulting AUCs decreasingly. The parameters perform.fs = TRUE, param.fs=list(thres.fs=num, method.fs=“AUC”, direction=‘absolute’) were set in train_model function, where num was the number of top features (11, 15, 20, 25, 30, 35, 40). Then, we compared the validation AUCs between modeling by a certain number of top features and all features to determine whether feature selection procedure should be used for this study. We used five diseases to perform the feature selection analysis, including AD, ASD, CD, CRC, and PD.
Please note, we only did the feature selection to test the performance of the classifiers and compare to that of the all-feature classifiers. In the end, we did not use feature selection because the all-feature classifiers performed the best in cross-cohort validation
Comparing model performance with or without functional annotation of mNGS samples
To explore whether the pathway data can help improve the modeling performance, we collected the microbiome taxon and pathway abundance data from the curatedMetagenomicData (https://waldronlab.io/curatedMetagenomicData/) R packageCitation108, because the GMrepo v2 database did not include functional annotations. We retained four diseases that had at least three cohorts in curatedMetagenomicData, including Adenoma, IBD, T1D and T2D (Fig. S10A). We found that both the internal (Fig. S10B) and external (Fig. S10C) AUCs were comparable between the taxon-based models and those used the combination of the taxon and the pathway data (p > 0.05; Wilcoxon Rank Sum Test; see also Table S7 for details), suggesting that adding functional profile did not significantly improve the model performance. The results were similar to Wirbel et al. ( in corresponding reference)Citation39 and Thomas et al. ( in corresponding reference)Citation129 on CRC. Thus, we used the taxon abundance to build models in the subsequent analyses.
Statistics and other bioinformatics analyses
All processed data, if not otherwise stated, were loaded into R (version 4.1.2, https://www.r-project.org/), analyzed and visualized. Wilcoxon rank sum test and corresponding pair test for pairwise data were used for two-group comparisons, while the Kruskal–Wallis test was used for multiple-group comparisons by using ‘ggpubr’ (v.0.4.0) package (https://github.com/kassambara/ggpubr) in stat_compare_means function with default parameters. The Wilcoxon rank sum test p values were corrected using ‘ggpubr’ package compare_means function with default parameters when performing multiple hypothesis tests. The Spearman correlation test was used for correlation analysis. All tests of significance were two-sided, and p-value < 0.05 (when the two groups were compared) or corrected p-value < 0.05 (when comparing multiple groups) was considered statistically significant.
Author contributions
W.H.C and X.M.Z designed and directed the research. J.Z, H.W., C.S. and N.L.G. helped with the sample collection. M.L and J.L analyzed the data, performed modeling and wrote the paper with results from all authors. W.H.C and X.M.Z. polished the manuscript through multiple iterations of discussions with all authors. All authors read and approved the final manuscript.
Ethics approval
This study did not receive nor require ethics approval, as it reused the publicly available data.
Supplemental Material
Download Zip (8.4 MB)Disclosure statement
No potential conflict of interest was reported by the authors.
Data availability statement
The processed data and codes that support the findings of this study are available in GitHub repository at https://github.com/whchenlab/GMModels. These data were derived from the following resources available in the public domain: NCBI (https://www.ncbi.nlm.nih.gov/sra), ENA (https://www.ebi.ac.uk/ena/browser/), MGnify (https://www.ebi.ac.uk/metagenomics/), GMrepo v2 (https://gmrepo.humangut.info), and the accession codes were in TableS1.
Supplementary material
Supplemental data for this article can be accessed online at https://doi.org/10.1080/19490976.2023.2205386.
Additional information
Funding
References
- Zeller G, Tap J, Voigt AY, Sunagawa S, Kultima JR, Costea PI, Amiot A, Böhm J, Brunetti F, Habermann N, et al. Potential of fecal microbiota for early-stage detection of colorectal cancer. Mol Syst Biol. 2014;10(11):10.
- Zuo T, Wong SH, Lam K, Lui R, Cheung K, Tang W, Ching JYL, Chan PKS, Chan MCW, Wu JCY, et al. Bacteriophage transfer during faecal microbiota transplantation in clostridium difficile infection is associated with treatment outcome. Gut. 2018;67(4):634–26.
- Pozuelo M, Panda S, Santiago A, Mendez S, Accarino A, Santos J, Guarner F, Azpiroz F, Manichanh C. Reduction of butyrate- and methane-producing microorganisms in patients with irritable bowel syndrome. Sci Rep. 2015;5:12693.
- Garrett WS. The gut microbiota and colon cancer. Science. 2019;364:1133–1135.
- Franzosa EA, Sirota-Madi A, Avila-Pacheco J, Fornelos N, Haiser H, Reinker S, Vatanen T, Hall AB, Mallick H, McIver LJ, et al. Gut microbiome structure and metabolic activity in inflammatory bowel disease. Nat Microbio. 2019;4(2):293–305.
- Lloyd-Price J, Arze C, Ananthakrishnan AN, Schirmer M, Avila-Pacheco J, Poon TW, Andrews E, Ajami NJ, Bonham KS, Brislawn CJ, et al. Multi-omics of the gut microbial ecosystem in inflammatory bowel diseases. Nature. 2019;569(7758):655–662.
- Zhang X, Zhang DY, Jia HJ, Feng Q, Wang DH, Liang D, Wu X, Li J, Tang L, Li Y, et al. The oral and gut microbiomes are perturbed in rheumatoid arthritis and partly normalized after treatment. Nat Med. 2015;21(8):895–905.
- Wen CP, Zheng ZJ, Shao TJ, Liu L, Xie ZJ, Le Chatelier E, He Z, Zhong W, Fan Y, Zhang L, et al. Quantitative metagenomics reveals unique gut microbiome biomarkers in ankylosing spondylitis. Genome Biol. 2017;18:142.
- Smith K, Topçuolu BD, Holden J, Kivisäkk P, Chitnis T, De Jager PL, Patel B, Mazzola MA, Liu S, Glanz BL, et al. Alterations of the human gut microbiome in multiple sclerosis. Nat Commun. 2016;7(1)12015.
- Liu R, Hong J, Xu X, Feng Q, Zhang D, Gu Y, Shi J, Zhao S, Liu W, Wang X, et al. Gut microbiome and serum metabolome alterations in obesity and after weight-loss intervention. Nat Med. 2017;23(7):859–868.
- Ma OC, Kramna L, Mazankova K, Odeh R, Alassaf A, Ibekwe MU, Ahmadov G, Elmahi BME, Mekki H, Lebl J, et al. The bacteriome at the onset of type 1 diabetes: a study from four geographically distant African and Asian countries. Diabetes Res Clin Pract. 2018;144:144.
- Forslund K, Hildebrand F, Nielsen T, Falony G, Le Chatelier E, Sunagawa S, Prifti E, Vieira-Silva S, Gudmundsdottir V, Krogh Pedersen H, et al. Disentangling type 2 diabetes and metformin treatment signatures in the human gut microbiota. Nature. 2015;528(7581):262–266.
- Le Chatelier E, Nielsen T, Qin J, Prifti E, Hildebrand F, Falony G, Almeida M, Arumugam M, Batto JM, Kennedy S, et al. Richness of human gut microbiome correlates with metabolic markers. Nature. 2013;500(7464):541–546.
- Yu R, Wu Z, Wang S, Zhang M, Zhou G, Li B. Isolation, identification and characterization of propionic acid bacteria associated with autistic spectrum disorder. Microb Pathog. 2020;147:104371.
- Ling Z, Zhu M, Yan X, Cheng Y, Shao L, Liu X, Jiang R, Wu S. Structural and functional dysbiosis of fecal microbiota in Chinese patients with alzheimer’s disease. Front Cell Dev Biol. 2020;8:634069.
- Wang M, Wan J, Rong H, He F, Wang H, Zhou J, Cai C, Wang Y, Xu R, Yin Z, et al. Alterations in gut glutamate metabolism associated with changes in gut microbiota composition in children with autism spectrum disorder. Msystems. 2019;4(1):4.
- Scheperjans F, Aho V, Pereira PAB, Koskinen K, Paulin L, Pekkonen E, Haapaniemi E, Kaakkola S, Eerola-rautio J, Pohja M, et al. Gut microbiota are related to parkinson’s disease and clinical phenotype. Movement Disord. 2015;30(3):350–358.
- Rose DR, Yang H, Serena G, Sturgeon C, Ma B, Careaga M, Hughes HK, Angkustsiri K, Rose M, Hertz-Picciotto I, et al. Differential immune responses and microbiota profiles in children with autism spectrum disorders and co-morbid gastrointestinal symptoms. Brain Behav Immun. 2018;70:354–368.
- Averina OV, Kovtun AS, Polyakova SI, Savilova AM, Rebrikov DV, Danilenko VN. The bacterial neurometabolic signature of the gut microbiota of young children with autism spectrum disorders. J Med Microbiol. 2020;69:558–571.
- Shi K, Zhang L, Yu J, Chen Z, Lai S, Zhao X, Li WG, Luo Q, Lin W, Feng J, et al. A 12-genus bacterial signature identifies a group of severe autistic children with differential sensory behavior and brain structures. Clin Transl Med. 2021;11(2):e314.
- L Y, Jin Y, Li J, Zhao L, Li Z, Xu J, Zhao F, Feng J, Chen H, Fang C, et al. Small bowel transit and altered gut microbiota in patients with liver cirrhosis. Front Physiol. 2018;9:470.
- Jiang W, Wu N, Wang X, Chi Y, Zhang Y, Qiu X, Hu Y, Li J, Liu Y. Dysbiosis gut microbiota associated with inflammation and impaired mucosal immune function in intestine of humans with non-alcoholic fatty liver disease. Sci Rep. 2015;5:8096.
- Jie Z, Xia H, Zhong SL, Feng Q, Li S, Liang S, Zhong H, Liu Z, Gao Y, Zhao H, et al. The gut microbiome in atherosclerotic cardiovascular disease. Nat Commun. 2017;8(1):845.
- Dubinkina VB, Tyakht AV, Odintsova VY, Yarygin KS, Kovarsky BA, Pavlenko AV, Ischenko DS, Popenko AS, Alexeev DG, Taraskina AY, et al. Links of gut microbiota composition with alcohol dependence syndrome and alcoholic liver disease. Microbiome. 2017;5(1):141.
- Quince C, Walker AW, Simpson JT, Loman NJ, Segata N. Shotgun metagenomics, from sampling to analysis. Nat Biotechnol. 2017;35:833–844.
- Liu YX, Qin Y, Chen T, Lu MP, Qian XB, Guo XX, Bai Y. A practical guide to amplicon and metagenomic analysis of microbiome data. Protein Cell. 2021;12:315–330.
- Knight R, Vrbanac A, Taylor BC, Aksenov A, Callewaert C, Debelius J, Gonzalez A, Kosciolek T, McCall LI, McDonald D, et al. Best practices for analysing microbiomes. Nat Rev Microbiol. 2018;16(7):410–422.
- Sharon G, Cruz NJ, Kang DW, Gandal MJ, Wang B, Kim YM, Zink EM, Casey CP, Taylor BC, Lane CJ, et al. Human gut microbiota from autism spectrum disorder promote behavioral symptoms in mice. Cell. 2019;177(6):1600–1618.
- Kim N, Jeon SH, Ju IG, Gee MS, Do J, Oh MS, Lee JK. Transplantation of gut microbiota derived from alzheimer’s disease mouse model impairs memory function and neurogenesis in C57BL/6 mice. Brain Behav Immun. 2021;98:357–365.
- Chen C, Liao JM, Xia YY, Liu X, Jones R, Haran J, McCormick B, Sampson TR, Alam A, Ye K. Gut microbiota regulate alzheimer’s disease pathologies and cognitive disorders via PUFA-associated neuroinflammation. Gut. 2022;71:2233–2252.
- Ridaura VK, Faith JJ, Rey FE, Cheng J, Duncan AE, Kau AL, Griffin NW, Lombard V, Henrissat B, Bain JR, et al. Gut microbiota from twins discordant for obesity modulate metabolism in mice. Sci. 2013;341(6150):1241214.
- Koren O, Goodrich Julia K, Cullender Tyler C, Spor A, Laitinen K, Bäckhed HK, Gonzalez A, Werner J, Angenent L, Knight R, et al. Host remodeling of the gut microbiome and metabolic changes during pregnancy. Cell. 2012;150(3):470–480.
- Wang SA, Xu MQ, Wang WQ, Cao XC, Piao MY, Khan S, Yan F, Cao H, Wang B. Systematic review: adverse events of fecal microbiota transplantation. Plos One. 2016;11:e0161174.
- Huang HL, Chen HT, Luo QL, Xu HM, He J, Li YQ, Zhou YL, Yao F, Nie YQ, Zhou YJ. Relief of irritable bowel syndrome by fecal microbiota transplantation is associated with changes in diversity and composition of the gut microbiota. J Digest Dis. 2019;20:401–408.
- Kang DW, Adams JB, Coleman DM, Pollard EL, Maldonado J, McDonough-Means S, Caporaso JG, Krajmalnik-Brown R. Long-term benefit of microbiota transfer therapy on autism symptoms and gut microbiota. Sci Rep. 2019;9:5821.
- Ghannam RB, Techtmann SM. Machine learning applications in microbial ecology, human microbiome studies, and environmental monitoring. Comput Struct Biotechnol J. 2021;19:1092–1107.
- Marcos-Zambrano LJ, Karaduzovic-Hadziabdic K, Loncar Turukalo T, Przymus P, Trajkovik V, Aasmets O, Berland M, Gruca A, Hasic J, Hron K, et al. Applications of machine learning in human microbiome studies: a review on feature selection, biomarker identification, disease prediction and treatment. Front Microbiol. 2021;12:634511.
- Curry KD, Nute MG, Treangen TJ. It takes guts to learn: machine learning techniques for disease detection from the gut microbiome. Emerg Topics Life Sci. 2021;5:815–827.
- Wirbel J, Pyl PT, Kartal E, Zych K, Kashani A, Milanese A, Fleck JS, Voigt AY, Palleja A, Ponnudurai R, et al. Meta-analysis of fecal metagenomes reveals global microbial signatures that are specific for colorectal cancer. Nat Med. 2019;25:679.
- Jiang P, Wu S, Luo Q, Zhao XM, Chen WH Metagenomic analysis of common intestinal diseases reveals relationships among microbial signatures and powers multidisease diagnostic models. mSystems. 2021;6:e00112–21.
- Qin N, Yang F, Li A, Prifti E, Chen Y, Shao L, Guo J, Le Chatelier E, Yao J, Wu L, et al. Alterations of the human gut microbiome in liver cirrhosis. Nature. 2014;513:59–64.
- Oh TG, Kim SM, Caussy C, Fu T, Guo J, Bassirian S, Singh S, Madamba EV, Bettencourt R, Richards L, et al. A universal gut-microbiome-derived signature predicts cirrhosis. Cell Metab. 2020;32:878–888.
- Kartal E, Schmidt TSB, Molina-Montes E, Rodríguez-Perales S, Wirbel J, Maistrenko OM, Akanni WA, Alhamwe BA, Alves RJ, Carrato A, et al. A faecal microbiota signature with high specificity for pancreatic cancer. Gut. 2022;71:1359–1372. gutjnl-2021-324755.
- Nagata N, Nishijima S, Kojima Y, Hisada Y, Imbe K, Miyoshi-Akiyama T, Suda W, Kimura M, Aoki R, Sekine K, et al. Metagenomic identification of microbial signatures predicting pancreatic cancer from a multinational study. Gastroenterol. 2022;163:222–238.
- Dan Z, Mao X, Liu Q, Guo M, Zhuang Y, Liu Z, Chen K, Chen J, Xu R, Tang J, et al. Altered gut microbial profile is associated with abnormal metabolism activity of autism spectrum disorder. Gut Microbes. 2020;11:1246–1267.
- Liu P, Wu L, Peng G, Han Y, Tang R, Ge J, Zhang L, Jia L, Yue S, Zhou K, et al. Altered microbiomes distinguish alzheimer’s disease from amnestic mild cognitive impairment and health in a Chinese cohort. Brain Behav Immun. 2019;80:633–643.
- Li BY, He YX, Ma JF, Huang P, Du JJ, Cao L, Wang Y, Xiao Q, Tang H, Chen S. Mild cognitive impairment has similar alterations as alzheimer’s disease in gut microbiota. Alzheimers Dement. 2019;15:1357–1366.
- Wei Y, Li Y, Yan L, Sun C, Miao Q, Wang Q, Xiao X, Lian M, Li B, Chen Y, et al. Alterations of gut microbiome in autoimmune hepatitis. Gut. 2020;69:569.
- Lu H, Gao NL, Tong F, Wang J, Li H, Zhang R, Ma H, Yang N, Zhang Y, Wang Y, et al. Alterations of the human lung and gut microbiomes in non-small cell lung carcinomas and distant metastasis. Microbiol Spectr. 2021;9:e0080221.
- Shi Z, Hu G, Li MW, Zhang L, Li X, Li L, Wang X, Fu X, Sun Z, Zhang X, et al. Gut microbiota as non-invasive diagnostic and prognostic biomarkers for natural killer/T-cell lymphoma. Gut. 2022.
- Wilck N, Matus MG, Kearney SM, Olesen SW, Forslund K, Bartolomaeus H, Haase S, Mähler A, Balogh A, Markó L, et al. Salt-responsive gut commensal modulates TH17 axis and disease. Nature. 2017;551:585–589.
- Montalban-Arques A, Katkeviciute E, Busenhart P, Bircher A, Wirbel J, Zeller G, Morsy Y, Borsig L, Garzon JF, Müller A, et al. Commensal clostridiales strains mediate effective anti-cancer immune response against solid tumors. Cell Host & Microbe. 2021;29:1573–88.e7.
- Duan Y, Llorente C, Lang S, Brandl K, Chu H, Jiang L, White RC, Clarke TH, Nguyen K, Torralba M, et al. Bacteriophage targeting of gut bacterium attenuates alcoholic liver disease. Nature. 2019;575:505–511.
- Gorski A, Miedzybrodzki R, Wegrzyn G, Jonczyk-Matysiak E, Borysowski J, Weber-Dabrowska B. Phage therapy: current status and perspectives. Med Res Rev. 2020;40:459–463.
- Zhao L, Zhang F, Ding X, Wu G, Lam YY, Wang X, Fu H, Xue X, Lu C, Ma J, et al. Gut bacteria selectively promoted by dietary fibers alleviate type 2 diabetes. Sci. 2018;359:1151–1156.
- Wu GD, Chen J, Hoffmann C, Bittinger K, Chen YY, Keilbaugh SA, Bewtra M, Knights D, Walters WA, Knight R, et al. Linking long-term dietary patterns with gut microbial enterotypes. Sci. 2011;334:105–108.
- Vujkovic-Cvijin I, Sklar J, Jiang L, Natarajan L, Knight R, Belkaid Y. Host variables confound gut microbiota studies of human disease. Nature. 2020;587:448–454.
- Forslund SK, Chakaroun R, Zimmermann-Kogadeeva M, Marko L, Aron-Wisnewsky J, Nielsen T, Moitinho-Silva L, Schmidt TS, Falony G, Vieira-Silva S, et al. Combinatorial, additive and dose-dependent drug-microbiome associations. Nature. 2021;600:500–505.
- He Y, Wu W, Zheng HM, Li P, McDonald D, Sheng HF, Chen MX, Chen ZH, Ji GY, Zheng ZD, et al. Regional variation limits applications of healthy gut microbiome reference ranges and disease models. Nat Med. 2018;24:1532–1535.
- Costea PI, Zeller G, Sunagawa S, Pelletier E, Alberti A, Levenez F, Tramontano M, Driessen M, Hercog R, Jung FE, et al. Towards standards for human fecal sample processing in metagenomic studies. Nat Biotechnol. 2017;35:1069–1076.
- McKnight DT, Huerlimann R, Bower DS, Schwarzkopf L, Alford RA, Zenger KR. Methods for normalizing microbiome data: an ecological perspective. Methods Ecol Evol. 2019;10:389–400.
- Ling WD, Zhao N, Plantinga AM, Launer LJ, Fodor AA, Meyer KA, Wu MC. Powerful and robust non-parametric association testing for microbiome data via a zero-inflated quantile approach (ZINQ). Microbiome. 2021;9:181.
- Yap CX, Henders AK, Alvares GA, Wood DLA, Krause L, Tyson GW, Restuadi R, Wallace L, McLaren T, NK H, et al. Autism-related dietary preferences mediate autism-gut microbiome associations. Cell. 2021;184:5916–31.e17.
- Wu H, Esteve E, Tremaroli V, Khan MT, Caesar R, Manneras-Holm L, Ståhlman M, Olsson LM, Serino M, Planas-Fèlix M, et al. Metformin alters the gut microbiome of individuals with treatment-naive type 2 diabetes, contributing to the therapeutic effects of the drug. Nat Med. 2017;23:850–858.
- Jackson MA, Goodrich JK, Maxan ME, Freedberg DE, Abrams JA, Poole AC, Sutter JL, Welter D, Ley RE, Bell JT, et al. Proton pump inhibitors alter the composition of the gut microbiota. Gut. 2015;65:749–756.
- Wu S, Jiang P, Zhao XM, Chen WH. Treatment regimens may compromise gut-microbiome-derived signatures for liver cirrhosis. Cell Metab. 2021;33:455–456.
- Vieira-Silva S, Falony G, Belda E, Nielsen T, Aron-Wisnewsky J, Chakaroun R, Forslund SK, Assmann K, Valles-Colomer M, Nguyen TT, et al. Statin therapy is associated with lower prevalence of gut microbiota dysbiosis. Nature. 2020;581:310–315.
- Dai D, Zhu J, Sun C, Li M, Liu J, Wu S, Ning K, He LJ, Zhao XM, Chen WH, et al. Gmrepo v2: a curated human gut microbiome database with special focus on disease markers and cross-dataset comparison. Nucleic Acids Res. 2022;50:D777–84.
- Que Y, Cao M, He J, Zhang Q, Chen Q, Yan C, Lin A, Yang L, Wu Z, Zhu D, et al. Gut bacterial characteristics of patients with type 2 diabetes mellitus and the application potential. Front Immunol. 2021;12:722206.
- Nikolova VL, Smith MRB, Hall LJ, Cleare AJ, Stone JM, Young AH. Perturbations in gut microbiota composition in psychiatric disorders a review and meta-analysis. Jama Psychiat. 2021;78:1343–1354.
- Metwaly A, Reitmeier S, Haller D. Microbiome risk profiles as biomarkers for inflammatory and metabolic disorders. Nat Rev Gastro Hepat. 2022;19:383–397.
- Bisanz JE, Upadhyay V, Turnbaugh JA, Ly K, Turnbaugh PJ. Meta-analysis reveals reproducible gut microbiome alterations in response to a high-fat diet. Cell Host & Microbe. 2019;26:265–72.e4.
- McGuinness AJ, Davis JA, Dawson SL, Loughman A, Collier F, O’Hely M, Simpson CA, Green J, Marx W, Hair C, et al. A systematic review of gut microbiota composition in observational studies of major depressive disorder, bipolar disorder and schizophrenia. Mol Psychiatr. 2022;27:1920–1935.
- Tierney BT, Tan Y, Kostic AD, Patel CJ. Gene-level metagenomic architectures across diseases yield high-resolution microbiome diagnostic indicators. Nat Commun. 2021;12:2907.
- Abbas-Egbariya H, Haberman Y, Braun T, Hadar R, Denson L, Gal-Mor O, Amir A. Meta-analysis defines predominant shared microbial responses in various diseases and a specific inflammatory bowel disease signal. Genome Biol. 2022;23:61.
- Tierney BT, Tan Y, Yang Z, Shui B, Walker MJ, Kent BM, Kostic AD, Patel CJ. Systematically assessing microbiome–disease associations identifies drivers of inconsistency in metagenomic research. PLoS Biol. 2022;20:e3001556.
- Schriml LM, Munro JB, Schor M, Olley D, McCracken C, Felix V, Baron JA, Jackson R, Bello SM, Bearer C, et al. The human disease ontology 2022 update. Nucleic Acids Res. 2022;50:D1255–61.
- Zou H, Hastie T. Regularization and variable selection via the elastic net. J Royal Statistical Soc Ser B Statistical Methodol. 2005;67:301–320.
- Tibshirani R. Regression shrinkage and selection via the lasso. J Royal Statistical Soc Ser B Methodol. 1996;58:267–288.
- Ho TK. Random decision forests. Proc 3rd Int Conf Document Analysis Recognit. 1995;11:278–282.
- Goldstein M, Smith AFM. Ridge-type estimators for regression analysis. J Royal Statistical Soc Ser B Methodol. 1974;36:284–291.
- Halfvarson J, Brislawn CJ, Lamendella R, Vázquez-Baeza Y, Walters WA, Bramer LM, D’Amato M, Bonfiglio F, McDonald D, Gonzalez A, et al. Dynamics of the human gut microbiome in inflammatory bowel disease. Nat Microbio. 2017;2:17004.
- Wirbel J, Zych K, Essex M, Karcher N, Kartal E, Salazar G, Bork P, Sunagawa S, Zeller G. Microbiome meta-analysis and cross-disease comparison enabled by the SIAMCAT machine learning toolbox. Genome Biol. 2021;22:93.
- Wan Y, Zuo T, Xu Z, Zhang F, Zhan H, Chan D, Dorothy CH, Leung TF, Yeoh YK, Chan FK, et al. Underdevelopment of the gut microbiota and bacteria species as non-invasive markers of prediction in children with autism spectrum disorder. Gut. 2021;71:910–918.
- Shi L, Muthu N, Shaeffer GP, Sun Y, Ruiz Herrera VM, Tsui FR. Using data-driven machine learning to predict unplanned ICU transfers with critical deterioration from electronic health records. Stud Health Technol Inform. 2022;290:660–664.
- Giloteaux L, Goodrich JK, Walters WA, Levine SM, Ley RE, Hanson MR. Reduced diversity and altered composition of the gut microbiome in individuals with myalgic encephalomyelitis/chronic fatigue syndrome. Microbiome. 2016;4:30.
- Dickinson BT, Kisiel J, Ahlquist DA, Grady WM. Molecular markers for colorectal cancer screening. Gut. 2015;64:1485.
- Hector A, von Felten S, Schmid B. Analysis of variance with unbalanced data: an update for ecology & evolution. J Anim Ecol. 2010;79:308–316.
- Riester M, Wei W, Waldron L, Culhane AC, Trippa L, Oliva E, Kim SH, Michor F, Huttenhower C, Parmigiani G, et al. Risk prediction for late-stage ovarian cancer by meta-analysis of 1525 patient samples. J Natl Cancer Inst. 2014;106:dju048.
- Nearing JT, Douglas GM, Hayes MG, MacDonald J, Desai DK, Allward N, Jones CM, Wright RJ, Dhanani AS, Comeau AM, et al. Microbiome differential abundance methods produce different results across 38 datasets. Nat Commun. 2022;13:342.
- Yang L, Chen J Benchmarking differential abundance analysis methods for correlated microbiome sequencing data. Brief Bioinform. 2023;24:bbac607.
- Duvallet C, Gibbons SM, Gurry T, Irizarry RA, Alm EJ. Meta-analysis of gut microbiome studies identifies disease-specific and shared responses. Nat Commun. 2017;8:1784.
- Smits SA, Leach J, Sonnenburg ED, Gonzalez CG, Lichtman JS, Reid G, Knight R, Manjurano A, Changalucha J, Elias JE, et al. Seasonal cycling in the gut microbiome of the hadza hunter-gatherers of Tanzania. Science. 2017;357:802–806.
- Yang H, Wu J, Huang X, Zhou Y, Zhang Y, Liu M, Liu Q, Ke S, He M, Fu H, et al. ABO genotype alters the gut microbiota by regulating GalNAc levels in pigs. Nature. 2022;606:358–367.
- Qin Y, Havulinna AS, Liu Y, Jousilahti P, Ritchie SC, Tokolyi A, Sanders JG, Valsta L, Brożyńska M, Zhu Q, et al. Combined effects of host genetics and diet on human gut microbiota and incident disease in a single population cohort. Nat Genet. 2022;54:134–142.
- Lopera-Maya EA, Kurilshikov A, van der Graaf A, Hu S, Andreu-Sanchez S, Chen L, Vila AV, Gacesa R, Sinha T, Collij V, et al. Effect of host genetics on the gut microbiome in 7,738 participants of the Dutch microbiome project. Nat Genet. 2022;54:143–151.
- Eusebi LH, Rabitti S, Artesiani ML, Gelli D, Montagnani M, Zagari RM, Bazzoli F. Proton pump inhibitors: risks of long-term use. J Gastroenterol Hepatol. 2017;32:1295–1302.
- Numico G, Fusco V, Franco P, Roila F. Proton pump inhibitors in cancer patients: how useful they are? A review of the most common indications for their use. Crit Rev Oncol Hematol. 2017;111:144–151.
- Vila AV, Collij V, Sanna S, Sinha T, Imhann F, Bourgonje AR, Mujagic Z, Jonkers DM, Masclee AA, Fu J, et al. Impact of commonly used drugs on the composition and metabolic function of the gut microbiota. Nat Commun. 2020;11:362.
- Wu S, Sun C, Li Y, Wang T, Jia L, Lai S, Yang Y, Luo P, Dai D, Yang YQ, et al. Gmrepo: a database of curated and consistently annotated human gut metagenomes. Nucleic Acids Res. 2020;48:D545–53.
- Mirzayi C, Renson A, Genomic Standards C, Massive A, Quality Control S, Zohra F, Elsafoury S, Geistlinger L, Kasselman LJ, Eckenrode K, et al. Reporting guidelines for human microbiome research: the STORMS checklist. Nat Med. 2021;27:1885–1892.
- Katz K, Shutov O, Lapoint R, Kimelman M, Brister JR, O’Sullivan C. The sequence read archive: a decade more of explosive growth. Nucleic Acids Res. 2022;50:D387–90.
- Cummins C, Ahamed A, Aslam R, Burgin J, Devraj R, Edbali O, Gupta D, Harrison PW, Haseeb M, Holt S, et al. The European nucleotide archive in 2021. Nucleic Acids Res. 2022;50:D106–10.
- Mitchell AL, Almeida A, Beracochea M, Boland M, Burgin J, Cochrane G, Crusoe MR, Kale V, Potter SC, Richardson LJ, et al. Mgnify: the microbiome analysis resource in 2020. Nucleic Acids Res. 2020;48:D570–8.
- Meyer F, Paarmann D, D’Souza M, Olson R, Glass EM, Kubal M, Paczian T, Rodriguez A, Stevens R, Wilke A, et al. The metagenomics RAST server - a public resource for the automatic phylogenetic and functional analysis of metagenomes. BMC Bioinform. 2008;9:386.
- Shi W, Qi H, Sun Q, Fan G, Liu S, Wang J, Zhu B, Liu H, Zhao F, Wang X, et al. gcMeta: a global catalogue of metagenomics platform to support the archiving, standardization and analysis of microbiome data. Nucleic Acids Res. 2019;47:D637–48.
- Kasmanas JC, Bartholomaus A, Correa FB, Tal T, Jehmlich N, Herberth G, von Bergen M, Stadler PF, Carvalho AC, Nunes da Rocha U. HumanMetagenomeDB: a public repository of curated and standardized metadata for human metagenomes. Nucleic Acids Res. 2021;49:D743–50.
- Pasolli E, Schiffer L, Manghi P, Renson A, Obenchain V, Truong DT, Beghini F, Malik F, Ramos M, Dowd JB, et al. Accessible, curated metagenomic data through ExperimentHub. Nat Methods. 2017;14:1023–1024.
- Ren Z, Li A, Jiang J, Zhou L, Yu Z, Lu H, Xie H, Chen X, Shao L, Zhang R, et al. Gut microbiome analysis as a tool towards targeted non-invasive biomarkers for early hepatocellular carcinoma. Gut. 2019;68: gutjnl-2017-315084.
- Zhou H, He K, Chen J, Zhang X. LinDA: linear models for differential abundance analysis of microbiome compositional data. Genome Biol. 2022;23:95.
- Zhang L, Shi Y, Jenq RR, Do KA, Peterson CB. Bayesian compositional regression with structured priors for microbiome feature selection. Biometrics. 2021;77:824–838.
- Su Q, Liu Q, Lau RI, Zhang J, Xu Z, Yeoh YK, Leung TW, Tang W, Zhang L, Liang JQ, et al. Faecal microbiome-based machine learning for multi-class disease diagnosis. Nat Commun. 2022;13:6818.
- Wang T, Zhao H Structured subcomposition selection in regression and its application to microbiome data analysis. Ann Appl Stat. 2017;11:711–791.
- Bien J, Yan X, Simpson L, Muller CL. Tree-aggregated predictive modeling of microbiome data. Sci Rep. 2021;11:14505.
- Wu G, Zhao N, Zhang C, Lam YY, Zhao L. Guild-based analysis for understanding gut microbiome in human health and diseases. Genome Med. 2021;13:22.
- Chawla NV, Bowyer KW, Hall LO, Kegelmeyer WP. SMOTE: synthetic minority over-sampling technique. J Artif Intell Res. 2002;16:321–357.
- Harrison PW, Ahamed A, Aslam R, Alako BT, Burgin J, Buso N, Courtot M, Fan J, Gupta D, Haseeb M, et al. The european nucleotide archive in 2020. Nucleic Acids Res. 2021;49:D82–5.
- Bolger AM, Lohse M, Usadel B. Trimmomatic: a flexible trimmer for Illumina sequence data. Bioinformat. 2014;30:2114–2120.
- Langmead B, Salzberg SL. Fast gapped-read alignment with Bowtie 2. Nat Methods. 2012;9:357–359.
- Segata N, Waldron L, Ballarini A, Narasimhan V, Jousson O, Huttenhower C. Metagenomic microbial community profiling using unique clade-specific marker genes. Nat Methods. 2012;9:811–814.
- Bolyen E, Rideout JR, Dillon MR, Bokulich NA, Abnet CC, Al-Ghalith GA, Alexander H, Alm EJ, Arumugam M, Asnicar F, et al. Reproducible, interactive, scalable and extensible microbiome data science using QIIME 2. Nat Biotechnol. 2019;37:852–857.
- Callahan BJ, McMurdie PJ, Rosen MJ, Han AW, Johnson AJA, Holmes SP. DADA2: high-resolution sample inference from Illumina amplicon data. Nat Methods. 2016;13:581–583.
- McDonald D, Price MN, Goodrich J, Nawrocki EP, DeSantis TZ, Probst A, Andersen GL, Knight R, Hugenholtz P. An improved greengenes taxonomy with explicit ranks for ecological and evolutionary analyses of bacteria and archaea. Isme J. 2012;6:610–618.
- Ritchie ME, Phipson B, Wu, Hu Y, Law CW, Shi W, Smyth GK. Limma powers differential expression analyses for RNA-sequencing and microarray studies. Nucleic Acids Res. 2015;43(7):e47.
- Ma S, Shungin D, Mallick H, Schirmer M, Nguyen LH, Kolde R, Franzosa E, Vlamakis H, Xavier R, Huttenhower C. Population structure discovery in meta-analyzed microbial communities and inflammatory bowel disease. bioRxiv. 2020;23:208.
- Cordón I, García S, Fernández A, Herrera F. Imbalance: oversampling algorithms for imbalanced classification in R. Knowledge-Based Systs. 2018;161:329–341.
- Segata N, Izard J, Waldron L, Gevers D, Miropolsky L, Garrett WS, Huttenhower C. Metagenomic biomarker discovery and explanation. Genome Biol. 2011;12:1–18.
- Cao Y, Dong Q, Wang D, Zhang P, Liu Y, Niu C. microbiomeMarker: an R/Bioconductor package for microbiome marker identification and visualization. Bioinformat. 2022;38: 4027–4029.
- Thomas AM, Manghi P, Asnicar F, Pasolli E, Armanini F, Zolfo M, Beghini F, Manara S, Karcher N, Pozzi C, et al. Metagenomic analysis of colorectal cancer datasets identifies cross-cohort microbial diagnostic signatures and a link with choline degradation. Nat Med. 2019;25:667.