
ABSTRACT
An association has been suggested between altered gut microbiota, and attention deficit hyperactivity disorder (ADHD), and autism spectrum disorder (ASD), respectively. Thus, we analyzed the gut microbiota composition in children and adolescents with or without these disorders and evaluated the systemic effects of these bacteria. We recruited study participants diagnosed with ADHD, ASD, and comorbid ADHD/ASD, while the control groups consisted both of siblings and non-related children. The gut microbiota was analyzed by 16S rRNA gene sequencing of the V4 region, while the concentration of lipopolysaccharide-binding protein (LBP), cytokines, and other signaling molecules were measured in plasma. Importantly the gut microbiota compositions of cases with ADHD and ASD were highly similar for both alpha- and beta-diversity while differing from that of non-related controls. Furthermore, a subset of ADHD and ASD cases had an increased LBP concentration compared to non-affected children, which was positively correlated with interleukin (IL)-8, 12, and 13. These observations indicate disruption of the intestinal barrier and immune dysregulation among the subset of children with ADHD or ASD.
Introduction
Attention deficit hyperactivity disorder (ADHD) and autism spectrum disorder (ASD) are common neurodevelopmental disordersCitation1,Citation2, with poorly understood etiologies. Despite differences in the clinical manifestations, overlapping symptomatologyCitation3 and heritabilityCitation4 have been reported, suggesting shared developmental pathwaysCitation5. While both have clear genetic involvementCitation6–8, heritability alone does not fully explain the development of the disorders. Instead, it has been suggested that ADHD and ASD may arise as a result of complex interactions between genetic and environmental factorsCitation6,Citation9. The treatment for both disorders is based on a bio-psycho-social approachCitation10,Citation11, which in the case of ADHD includes pharmacological treatmentCitation11. In both disorders, attempts have been made to complement the treatment with non-pharmacological strategies, including dietary interventionsCitation12,Citation13. These have yielded interesting, but inconsistent results on ADHD or ASD symptoms. Furthermore, the mechanisms of action are not fully understoodCitation13–15.
Recent studies have suggested that the composition of bacteria in the gastrointestinal tract, termed the gut microbiota, may influence brain development through a bidirectional interaction between the gut microbiota and the brainCitation16,Citation17. For both ADHD and ASD, gastrointestinal symptoms like constipation and abdominal pain are commonCitation18–20, suggesting that dysfunction of the gastrointestinal tract may be an element of the disordersCitation21,Citation22. Combined with the reported observations from dietary interventionsCitation13,Citation15, these findings have prompted studies investigating the involvement of the gut microbiota in ADHD and ASD (for a recent systematic review, seeCitation23).
In 2000, Sandler et al.Citation24 reported short-term improvements in behavioral symptoms in children with ASD, following vancomycin treatment for diarrhea, suggesting that gut bacteria may be involved in the symptoms of ASD. This finding was supported by a number of studies showing that children with ASD possessed a gut microbiota that differed from non-affected controlsCitation21,Citation25–34. Sharon et al.Citation35 also reported that the transfer of gut microbiota from people with ASD could introduce autism-like behavior in mice. Attempts have been made to utilize this clinically, by transplanting feces from non-affected children to children with ASD. Both studies observed improvements in both ASD and gastrointestinal symptomsCitation26,Citation33, while a follow-up study observed that the beneficial effects were maintained for at least two yearsCitation36. Similarly, a recent study demonstrated that oral intake of an adsorbent, with affinity for small aromatic and phenolic molecules, could reduce the level of several bacterial metabolites in humans as it passes through the gastro-intestinal tract. Furthermore, it led to clinically relevant improvements in core symptoms of ASD, as well as reduced anxiety and irritabilityCitation37. Despite these promising findings, a recent, large study by Yap et al.Citation38 demonstrated that several of the gut microbial variations associated with ASD could be explained by variations in dietary preferences. Furthermore, the reported microbiota variations in children with ASD have been highly heterogeneous and the role of the gut bacteria in the pathophysiology of the disorder remains poorly understoodCitation23,Citation38.
The gut microbiota of patients with ADHD is, comparatively, not well definedCitation23. A study by Pärtty et al.Citation39 observed that children with ADHD had a lower relative abundance of Bifidobacterium compared to non-affected children. More recent studies investigating the microbiota composition of childrenCitation40–42, adolescentsCitation40,Citation42–44, or adultsCitation43–45 diagnosed with ADHD have yielded mixed resultsCitation23. Three studies have reported that ADHD was associated with a different gut microbiota compared to controlsCitation40,Citation43,Citation44, whereas another three studies did not find any differencesCitation41,Citation42,Citation45. Interpretations of the results are complicated by variations in age and ethnicity of study participants, as well as differences in study methodology. Despite some inconsistency in previous association studies, a role of gut microbiota in relation to ADHD has been emphasized in a recent animal studyCitation46. Here, Tengeler et al.Citation46 showed that transfer of gut microbiota from individuals diagnosed with ADHD into mice could elicit behavioral modifications which were not observed when using gut microbiota from individuals without ADHD.
For both disorders, low-grade systemic inflammation has been detectedCitation21,Citation47,Citation48, possibly due to translocation of bacterial products across the gastrointestinal epithelial barrierCitation49. Indeed, increased intestinal permeability has been described for both ADHDCitation50 and ASDCitation49,Citation51. For ADHD, a higher concentration of zonulin was observed in serumCitation50. This protein can reduce intestinal epithelial tight junction binding, thus increasing epithelial permeabilityCitation52. Furthermore, lipopolysaccharide (LPS), a surface marker of gram-negative bacteriaCitation53, has been identified in blood samples of children with ASD, indicating translocation of bacterial products from the intestinal lumenCitation49,Citation51. The association of these observations with gut microbial variations or immune activity is, however, not understood.
While previous studies have demonstrated the potential involvement of the gut microbiota in the development of both ADHD and ASD, the results are still not consistent regarding which bacteria are involved. Furthermore, despite the clinical overlap between the two neurodevelopmental disordersCitation3, the microbiota variations associated with them have not been investigated in parallel and never in comorbid ADHD/ASD groups.
In this study, we profiled the gut microbiota in children and adolescents with ADHD, ASD, and comorbid ADHD/ASD compared to both non-affected siblings and non-related controls. Furthermore, we sought to assess whether the intestinal barrier and immune system were affected in ADHD and/or ASD, as potential mechanisms of action of the gut microbiota.
Results
Demographics and clinical characteristics
A total of 95 study participants, aged 5–17 years (median age 10), were included in this study (). These were children and adolescents with ADHD (n = 32), ASD (n = 12), comorbid ADHD/ASD (n = 11), sibling controls (n = 14, 5, and 4 for sibling participants with ADHD, ASD, and comorbid ADHD/ASD, respectively), and non-related controls (n = 17). No significant differences were observed between age of cases and controls, however, ADHD siblings were found to be significantly younger than ASD cases and siblings (p = 0.0176 and 0.0123, effect size (Cohen’s d) = −1.59 and −2.24, respectively). None of the children that completed the study, were diagnosed with mood disorders or anxiety. No significant difference was observed in the frequency of gastrointestinal problems between cases and controls, with the most common problem being constipation, followed by abdominal pain and reflux. No study participants suffered from diarrhea during, or immediately prior to, the study period. These findings were reflected in the parentally reported Bristol Stool Chart typesCitation54 of the sampled feces. Here, most of the fecal samples were rated as normal consistency (Bristol Stool Chart 3–5) with no significant differences between cases and controls. Atypical diet was most common among children with ASD (50.0% compared to 5.9% in non-related controls, p = 0.022, odds ratio = 0.070). This was mostly in the form of a diet that did not vary between days, as well as one child with ASD presenting with a flexitarian diet. Only a single non-related control presented with a diet different from the norm (flexitarian). None of the participants received probiotic supplements. ADHD medication was given to 46.9% of children with ADHD and 36.4% of children with comorbid ADHD/ASD (p < 0.05 compared to either non-affected siblings or non-related controls), with methylphenidate being the most commonly used drug. Apart from these variables, the study groups were comparable for all other investigated variables.
Table 1. Demographic and clinical features of study participants. IQ were only available for around half the cases, and only one of the non-affected children (ADHD sibling with an IQ of 116). Three cases (one each of ADHD, ASD, and comorbid ADHD+ASD) furthermore had the diagnosis mental retardation (F70F71), while one ADHD case were diagnosed with borderline intellectual functioning (R41.8). Feces consistency described the fecal sample that was investigated and was rated by the parents according to the Bristol stool chart. All participants using Polyethylene Glycol 3350 (MovicolTM) were diagnosed with chronic constipation. No other medications targeting gastrointestinal symptoms were utilized by the study participants. Study participants were in some cases, evaluated with more than one diagnostic instrument. For a few study participants, the diagnostic instrument used for diagnosis, or the specific type of ADHD medication were not specified. ADOS2: the Autism Diagnostic Observation Schedule 2nd edition. ADHD-RS: ADHD rating scale. T.O.V.A: Test of Variables of Attention. KSADS-COMP: Kiddie Schedule for Affective Disorders and Schizophrenia, Computer version. Only the specified ADHD medications were utilized amongst children included in this manuscript, which corresponds to the most commonly used ADHD medications prescribed to children and adolescents in Denmark. Statistical significance is presented as □ = p < 0.05 compared to ADHD cases, ○ = p < 0.05 compared to ASD cases, ▲= p < 0.05 compared to comorbid ADHD/ASD.
Gut microbial communities in children with ADHD and ASD had comparable richness and diversity
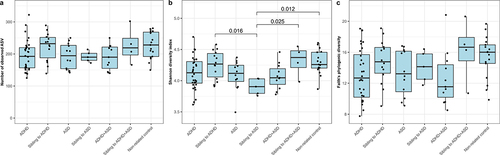
Following sequencing, we obtained 5,761,785 reads, with an average number of reads per study group of: 60,727 ± 11,020 for ADHD; 62,897 ± 10,394 for ADHD siblings; 59,154 ± 8,057 for ASD; 54,963 ± 8,949 for ASD siblings; 60,095 ± 7,306 for comorbid ADHD/ASD; 56,287 ± 14,493 for siblings to comorbid ADHD/ASD; and 62,771 ± 11,988 for non-related controls. A total of 2,255 amplicon sequence variants (ASVs) were identified following singleton removal, with taxonomy assigned for 98.9%, 97.5%, and 91.7% of ASVs at phylum, family, and genus levels, respectively. To investigate bacterial alpha-diversity we calculated ASV richness, Shannon diversity index, and Faith’s phylogenic diversity (). No significant differences were observed for ADHD, ASD, or comorbid ADHD and ASD, compared to each other or to non-affected children (p > 0.05, effect sizes between −1.70 and 1.53, ). Only the Shannon diversity for ASD siblings was observed to be significantly lower compared to non-related children, ADHD siblings, and comorbid siblings (p = 0.012, 0.016, and 0.025, effect sizes = −2.88, 2.62, and −3.15, respectively, ). In order to investigate overall variations of cases compared to non-affected children, we next compared children with ADHD, ASD, and comorbid ADHD/ASD with a combined control group, consisting of non-affected siblings and non-related children (supplementary figure S1). Compared to these, cases tended to have a lower bacterial richness, although only significantly so for ADHD compared to non-affected children (p = 0.036, effect size = −0.86 and p = 0.027, effect size = −0.88, for ASV richness and Faith’s phylogenic diversity, respectively, supplementary figure S1a and c). Adding atypical diet, gastrointestinal complaints, or ADHD medication as fixed effects, did not improve the model nor did it change the overall results (p > 0.05, data not shown).
Figure 1. Alpha-diversity of each diagnostic group. The alpha diversity is determined using a) ASV richness, b) Shannon diversity index, and c) Faith’s Phylogenic Diversity. P-values are based on linear mixed effect models, with sibling pairs as random effects and pairwise testing adjusted for multiple comparisons using Tukey’s method. Cases were compared to non-affected siblings and non-related children, while non-affected siblings were compared to non-related children.
The gut microbiota compositions of ADHD and ASD were highly similar but differed from non-related controls
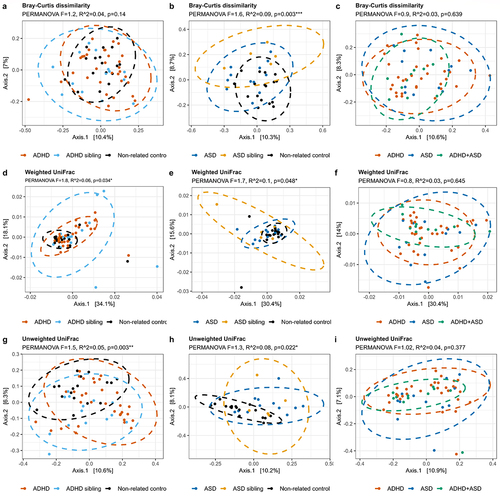
To assess variations in bacterial communities, we next visualized the beta-diversity of gut microbiota in the included children using principal coordinates analysis (PCoA), and tested variance using permutational multivariate analysis of variance (PERMANOVA) ( and supplementary figure S2, pairwise PERMANOVA in supplementary data S1). Children with ADHD or ASD differed from non-related controls based on both Bray-Curtis dissimilarity as well as weighted and unweighted UniFrac (p < 0.05, a,b,d,e,g and h and supplementary data S1, all adjusted p < 0.005). No significant differences were observed in beta-diversity between cases and their respective siblings (, Supplementary data S1). As for alpha-diversity, we also compared children with either ADHD or ASD to the combined group of siblings and non-related controls, and identified no differences between cases and controls (supplementary figure S2). However, siblings differed highly from each other as well as from non-related controls (p = 0.024, 0.136, and 0.046 for Bray-Curtis dissimilarity, weighted and unweighted UniFrac, respectively, supplementary figure S2 c, f, and i). Notably, children with ADHD, ASD, or comorbid ADHD/ASD could not be distinguished based on beta-diversity in any explored indices (p > 0.05, , and supplementary data S1). Confounders were added as fixed effects to a subsequent PERMANOVA model (Supplementary data S2), including atypical diet, use of ADHD medication or Polyethylene Glycol 3350, presence of constipation, and information regarding matched siblings. Importantly, the significant effects of diagnostic groups compared to non-related controls were maintained for all beta-diversity distances (R2 between 0.03 and 0.06, adjusted p < 0.05). For all groups and measures, sibling similarity in gut microbiota variation was larger than other variables, although it did not obscure the effects of diagnostic groupings. This was especially true when we compared cases to each other, where the sibling effects were the main cause of variance for all PERMANOVA results.
Figure 2. Beta-diversity of each diagnostic group. The beta-diversity is presented using principal coordinate analysis (PCoA), with either Bray-Curtis dissimilarities (a-c), weighted UniFrac (d-f), or unweighted UniFrac (g-i). The individual groups were analyzed as either ADHD (a, d, and g) or ASD (b, e, and h) compared to the non-related children, or as ADHD, ASD, and comorbid ADHD/ASD compared to each other (c, f, and i). Ellipses depict 95% confidence intervals. PERMANOVA results are indicated with adjusted p-values and R2 and represent the overall differences in beta-diversity. For cases compared to siblings and non-related children combined, see supplementary figure S2. Pairwise PERMANOVA comparisons can be seen in Supplementary data S1, while confounders as fixed effects are found in supplementary data S2.
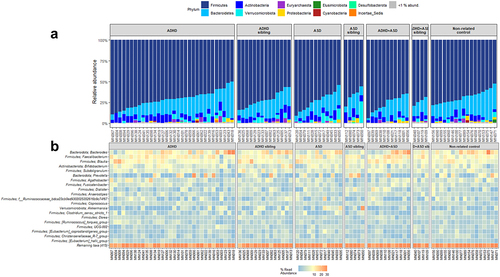
To further evaluate the bacterial variations, we performed compositional analyses (). All groups were dominated by the phylum Firmicutes, with notable contributions from the phyla Bacteroidetes, Actinobacteria, and Verrucomicrobiota (). Several children with ADHD, ASD, or comorbid ADHD/ASD had a low relative abundance of the Bacteroidetes phylum, with Actinobacteria being more dominant. For genera, we observed that most samples from all groups were dominated by the genera Bacteroides, Faecalibacterium, Blautia, and Bifidobacterium, with some individuals presenting with high Prevotella ().
Figure 3. Composition of bacteria in each diagnostic group. Relative abundance of the individual bacterial at the taxonomic levels phylum (a) and genus (b), depicted as percentage of total bacteria per sample. For phylum, data are represented as a barplot, with a grouping of phyla that comprise<1% of total relative abundance. For ease of interpretation, genera are represented using a heatmap, with the 20 most abundant genera listed.
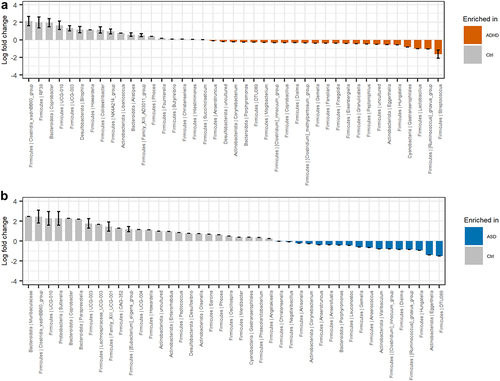
Analysis of compositions of microbiomes with bias correction (ANCOM-BC)Citation55 was used to further evaluate the variations in beta-diversity between children with ADHD, ASD, and non-related children (). Compared to ADHD, non-related children had a higher relative abundance of the Clostridia_vadinBB60 group and the genera Coprobacter, Bilophila, Howardella, and Colidextribacter among others. Conversely, the relative abundance of the genera Streptococcus, Lactobacillus, Hungatella, Eggerthella, and Ruminococcus gnavus group were higher among children with ADHD (). For ASD (), the relative abundance of several genera, including Sutterella, Coprobacter, Paraprevotella, Bilophila, as well as the Clostridia_vadinBB60 group were higher in non-related controls, whereas the relative abundance of the genera Eggerthella, Hungatella, Dielma, and the Ruminococus gnavus group were higher in children with ASD.
Figure 4. Differential abundant bacterial genera based on the ANCOM-BC analysis. Genera that differentiate significantly between the groups are displayed when adjusting for sibling effects, with effect size (log fold change) and 95% confidence error bars. All effect sizes with Benjamini-Hochberg corrected p-values<0.05 are displayed. A) Pairwise differential abundance analysis of children with ADHD compared to non-related controls. B) Pairwise differential abundance analysis of children with ASD compared to non-related controls. No significant bacterial differences were observed when comparing children with ADHD or ASD to each other supplementary data S3.
Finally, we compared ADHD and ASD (supplementary data S3). In line with the beta-diversity data, the bacterial compositions of the two disorders were highly similar. While some variations were initially observed, none reached significance after adjusting for the effects of siblings.
A subset of children with ADHD or ASD possessed higher blood plasma concentrations of LPS-binding protein (LBP)
A possible interaction between gut microbiota and the host was assessed, using blood LBP and fecal calprotectin as indicators (). While no significant differences were observed, a subset of ADHD, ASD, and comorbid ADHD/ASD cases had higher plasma LBP concentrations compared to non-related children (, adjusted p = 0.20, 0.15, and 0.24, effect sizes = 0.94, 1.28, and 0.69, respectively). The variation observed in these cases was neither explained by the presence of constipation (p = 0.105, effect size = 0.67, supplementary figure S3) nor by an atypical diet (p = 0.179, effectsize = −0.59, supplementary figure S3). As LBP is rapidly produced in response to the presence of the gram-negative surface molecule LPS in the circulationCitation53, this observation indicates that these children may have an increased translocation of bacterial products across the gastrointestinal epithelium. No differences between cases and controls were observed in fecal calprotectin (), suggesting that inflammatory bowel disorders did not explain differences in gut barrier permeability. Some outliers were observed with high fecal calprotectin values for several diagnostic groups. However, neither LBP nor the fecal calprotectin measure was correlated with gut microbial alpha- or beta-diversity ( and supplementary data S4), indicating that disruptions in the gastrointestinal epithelium were not directly associated with the variations observed for beta-diversity. Overall, the results suggest that a subset of children with ADHD and ASD had disruptions of the normal gut barrier function.
Figure 5. Immunoproteomic measurements of systemic involvement in ADHD and ASD. a) ELISA-based measures of blood plasma LBP in triplicate. A single outlier was observed and removed from statistical tests (non-related control MN154 duplicate 1). We defined outliers as measures outside of Quartiles 1 and 3 ± 1.5× interquartile range (IQR), where outliers were removed if only one of the replicates was defined as an outlier with more than the IQR between the two measures. b ELISA-based measure of fecal calprotectin performed as singletons. Notably, the child with the highest fecal calprotectin concentration was subsequently diagnosed with Crohn’s disease. Excluding this child from the statistics did not affect the results. c-f) Duplicate measures of Meso Scale-based measures of immune markers. Meso Scale results are displayed as median normalized and log2 transformed signal intensities, with averaged technical replicas. The red line indicates the measured log2 signal of blank controls, consisting of buffer. Only measures with noteworthy variations between cases and controls are analyzed here, with additional figures found in supplementary figures S4–7. Cases were compared to other cases, the matching sibling group or to non-related children, with sibling pair as random effect.
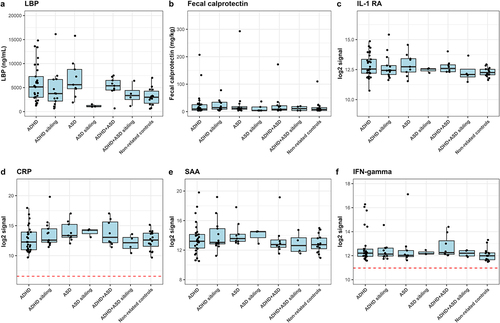
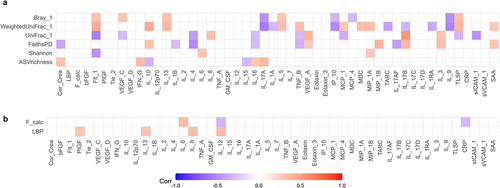
Figure 6. Multilevel correlation-testing of gut microbiota and intestinal permeability compared to systemic inflammatory markers. Multilevel Spearman’s correlation analysis of the correlation between a) bacterial alpha-and beta-diversity and b) fecal calprotectin and LBP compared to immunoproteomic markers, with sibling pair as random effect. Only correlations with Benjamini-Hochberg adjusted p-values<0.05 are displayed. Blue values indicate a negative correlation (rho−1–0), while red values indicate a positive correlation (rho 0–1). Raw values can be found in supplementary data S4–5. Only study participants with matching feces and plasma samples were include in the analysis.
Increased gut barrier permeability correlated with immune dysregulation in children with ADHD and, especially ASD
To evaluate if increased gut barrier permeability resulted in systemic effects for the included children, we next analyzed the plasma level of cytokines, chemokines, and other signaling molecules, as well as morning urine concentrations of cortisol ( and supplementary figures S5–8). Due to inconsistencies with controls across different plates, analytes from the TH17 panel were not investigated further. For the remaining analytes, only Eotaxin-3 was observed to differ significantly, having a higher concentration in ASD cases compared to ADHD cases (p = 0.009, effect size = 1.26, supplementary figure S6e). In addition, some tendencies were observed. Several ADHD and ASD cases had higher IL-1RA compared to non-related controls (), while five ADHD cases and one ASD case had much higher IFN-γ concentrations compared to controls (). Neither of these ADHD cases corresponded to participants with constipation or an atypical diet. The child with ASD and a high IFN-γ concentration did have an atypical diet, although overall diet was not associated with higher IFN-γ concentration (p = 0.542, effect size=+0.29, supplementary figure S4). Further analyses revealed a weak but significant positive correlation between LBP and Interleukin (IL)-8 (rho = 0.34, adjusted p = 0.023), IL-12 (rho = 0.35, adjusted p = 0.018), IL-13 (rho = 0.32, adjusted p = 0.035), and PlGF (rho = 0.31, adjusted p = 0.045)( and supplementary data S5). This suggests that disruption of the gut barrier function resulted in immune dysregulation. We further observed that weighted UniFrac, but also unweighted UniFrac as well as Bray-Curtis dissimilarity were correlated with several immune markers (, supplementary data S4), indicating an interaction between bacterial variation and immune dysregulation.
Discussion
In this study, we demonstrated for the first time, that children with ADHD and ASD share gut microbiota signatures that differ from non-related controls. We observed a lower relative abundance of the genera Coprobacter, Howardella, as well as members of the Clostridia class for both disorders compared to non-related controls. In addition, the relative abundance of Eggerthella, Hungatelle, and the Ruminococcus gnavus group were increased for both ADHD and ASD cases. It is unclear whether these bacterial changes represent a pathological change in gut microbiota, or whether they reflect an altered functionality of the gastrointestinal tract amongst children with ADHD or ASD. However, a higher relative abundance of Eggerthella has previously been associated with delayed development of childrenCitation56 and depressionCitation57. Furthermore, Wang et al.Citation58 observed variations in the metabolites of the neurotransmitter glutamate in children with ASD, that were associated with a higher relative abundance of Eggerthella lenta. Overall, the similarities in gut microbiota composition between ADHD and ASD coincide with other similarities observed between these two disorders, such as overlapping clinical presentation, symptomatologyCitation3,Citation5, and heritabilityCitation4.
When looking at children with ADHD separately, these tended to have a lower bacterial richness compared to non-related children, significantly so compared to the combined non-affected control group. This is in marked contrast to previous studies that did not detect any variations in alpha-diversity between ADHD cases and controlsCitation23,Citation40–45,Citation59. The cause of this discrepancy might be due to methodological differences between studies as well as population-based differencesCitation60. A reduced bacterial alpha-diversity has previously been associated with a dysbiotic and inflammatory phenotypeCitation61. Indeed, we observed that ASV richness were correlated with several immune markers. This could indicate, that children with neurodevelopmental disorders, and especially children with ADHD, are more susceptible to immune dysregulations, which fits with a previously described higher frequency of immune disorders in children with ADHDCitation62–64. Looking at the bacterial composition in ADHD cases,, we observed changes in several low-abundant ASVs, which is in agreement with a study by Prehn-Kristensen et al.Citation40. Previous studies investigating the gut microbiota in childrenCitation40–42 or adolescents and adultsCitation43–45 support our findings of a different gut microbiota composition in ADHD compared to non-related controls. This included an increased relative abundance of Eggerthella in agreement with Aarts et al.Citation43. However, no single bacteria has been consistently reported to differ between ADHD and non-related controls across all published studiesCitation23,Citation40–44. The increased relative abundance of Streptococcus is interesting though, considering an observation by Leslie et al.Citation65, who reported an increased frequency of previous streptococcal infections in children with ADHD.
Compared to ADHD, children with ASD displayed more pronounced microbial variations than controls, which is consistent with previous observations of gut microbiota variations in children with ASDCitation23,Citation66,Citation67. In a recent study, Yap et al.Citation38 suggested that differences in diet might explain the majority of gut microbiota variations observed among children with ASD. While we did not collect as detailed information on diet as Yap et al., we similarly observed that the presence of an atypical diet significantly affected the beta-diversity of study participants. Despite this, the diagnostic group was still found to be more important than presence of atypical diet in explaining variation in gut microbial beta-diversity. Several bacterial genera were observed to be differentially abundant in ASD compared to non-related controls. In agreement with previous studies, we found an increased relative abundance of the families EnterobacteriaceaeCitation31,Citation68 and PeptostreptococcaceaeCitation69. Noteworthy, differences between this study and previous studies include the increased relative abundance of EggerthellaCitation28, as well as the reduced relative abundance of the genera SutterellaCitation70,Citation71. Furthermore, despite previous studies often observing a reduced relative abundance of StreptococcusCitation27,Citation28,Citation68,Citation70,Citation72,Citation73, EscherichiaCitation27,Citation66,Citation70,Citation73, DialisterCitation66,Citation69,Citation72–74, and BifidobacteriumCitation27,Citation28,Citation33,Citation69,Citation72,Citation73 in children with ASD compared to non-affected controls, we did not observe any significant differences among these genera for children with ASD. Importantly, these previous studies have targeted different hypervariable regions of the 16S rRNA gene compared to our study, clustered reads as operational taxonomic units (OTUs) as opposed to using ASVs, and, with a few exceptionsCitation27,Citation71,Citation74, did not utilize bead-beating during DNA extraction. These are all factors that can influence which bacteria are identifiedCitation60. Importantly, despite different bacterial profiles in ADHD and ASD compared to non-related controls, only minor variations were observed when comparing the gut microbiota of ADHD and ASD.
Our findings of elevated plasma LBP in a subset of children with ADHD and/or ASD are in line with previous observations for cases with ASDCitation51. The implications are unclear, although since high LBP levels are an indicator of increased gastrointestinal permeability and translocation of the strongly immune-stimulating molecule LPS to the bloodCitation49,Citation53, the increased LBP concentration in children with ADHD and/or ASD may be related to previous observations of increased proinflammatory cytokines in children with ADHDCitation47 and ASDCitation21,Citation48. Indeed, we observed that increased LBP was positively correlated with IL-8, IL-12, and IL-13. Furthermore, we observed significant correlations between the bacterial beta-diversity and several immune markers, indicating that the gut microbiota variations we observed in the children with ADHD and/or ASD, may be related to an imbalance in the regulation of the immune system in the children. However, many of the correlations were weak, and several confounders exist, and thus more studies are needed to investigate whether the variations in gut microbiota facilitate increased translocation of bacterial products into the blood, as well as the impact on the immune system in children with ADHD and/or ASD.
Proper selection of control groups is essential in studies investigating the gut microbiota in disease. Multiple lifestyle factors can influence the gut microbiotaCitation38,Citation75,Citation76, and thus the control group needs to resemble the case group as much as possible. Previous studies of gut microbiota in ADHD or ASD have often used either non-related controlsCitation22,Citation31,Citation40,Citation44,Citation68,Citation69,Citation71,Citation74,Citation77, or siblingsCitation25,Citation27,Citation29,Citation43,Citation44,Citation78, with other studies reporting that the gut microbiota composition of siblings to children with ASD tended to be closer to that of their siblings as compared to non-related controlsCitation25,Citation79. In our study, we reported that the microbial differences observed in children with ADHD and/or ASD were less pronounced compared to siblings as opposed to non-related children, which is in agreement with the findings of Ahmed et al.Citation79. Furthermore, sibling effects were found to be a major effect on gut microbial beta-diversity. The siblings tended to be significantly different from that of non-related children. As such, several of the reported microbial variations between ADHD and ASD compared to non-related controls may be caused by differences in lifestyle instead, as indicated by Yap et al.Citation38. However, while siblings are expected to have environmental factors, lifestyles, and genetics closer to that of the cases, the heritable nature of both disordersCitation6,Citation7 increases the risk of including children with undiagnosed ADHD or ASD in the control group. This was also observed in our study, as one control sibling was diagnosed with ADHD briefly before this article was submitted for publication. We further observed for Shannon diversity and immunoproteomics measurements, that ASD siblings tended to be highly dissimilar from the other non-affected group. Thus, while we consider siblings to be an excellent control population in studies investigating microbiota, they introduce other confounders and thus we recommend that care should be taken to ensure that they are indeed non-affected by the disorder studied.
Strengths and limitations
Some study limitations need to be addressed. Compared to ADHD, the number of children with ASD or comorbid ADHD/ASD was low, limiting our ability to observe minor variations in gut microbiota. This problem was especially evident for immunoproteomic observations where several tendencies were observed that did not, however, reach significance. This was even more pronounced for siblings to these two groups. Importantly, previous studies have been able to discern differences in gut microbiota for children with ASD with even lower sample sizesCitation27,Citation28. Secondly, while 16S rRNA amplicon sequencing is widely used for microbiota studies, it lacks accuracy for species identification compared to whole-genome sequencing, which may hide underlying microbial differencesCitation80. While the effects of atypical diet did not obscure the effects of diagnostic groups in this study we only had limited dietary information, unlike Yap et al.Citation38. Thus, we have a lower resolution of the effects of dietary preference on gut microbiota variation. The choice to only include binary information on diet was taken to reduce the strain on the included families. In this study, gastrointestinal disorders were assessed based on the clinical history of the study participants, an initial interview with the parents, as well as through a 14-day fecal diary. However, no standardized physical examinations were performed on the patients, and thus we might have missed participants with smaller gastrointestinal disorders not manifesting in altered feces passage time. Finally, selection bias is a common issue in case-control studies, as demonstrated by Russel et al.Citation81, with families experiencing more severe disorders or social problems being less likely to volunteer to participate in scientific studies. Attempts were made to accommodate problems raised by the individual families, although we could not eliminate the impact of selection bias completely.
The study also has several strengths. It is the first study to investigate the gut microbiota of children with ADHD and ASD in parallel with identical collection protocol and sequencing technology, allowing a better understanding of the similarities and differences between these disorders. In addition, the use of ASVs instead of clustering based on similarity as for OTUs allows higher resolution when analyzing bacterial compositionCitation82. The use of well-known and widely used diagnostic instruments to ensure that the children included as cases fulfill the diagnostic criteria, thus ensuring the inclusion of true cases with ADHD and ASD. Finally, the inclusion of markers of gut microbiota, gastrointestinal permeability, and systemic immune response allows a better understanding of the interaction between these factors in children with ADHD and/or ASD.
Conclusion
We demonstrated for the first time that children and adolescents diagnosed with ADHD and ASD share gut microbiota signatures different from non-related controls. These variations were characterized by a lower relative abundance of the genera Coprobacter and Howardella, and an increased relative abundance of Eggerthella, Hungatelle, and the Ruminococcus gnavus group. Furthermore, we have shown that beta-diversity variations as well as increases in LBP were associated with changes in the balance between pro-and anti-inflammatory signals. Overall, further studies are still needed to elucidate how variations in gut microbiota, gastrointestinal permeability, and immune dysregulation may affect the behavioral, immunological, and gastrointestinal symptoms of children with ADHD and/or ASD.
Materials and methods
Study participants
Children and adolescents aged 5–17 years were recruited through the Clinic for Child and Adolescent Psychiatry at Aalborg University Hospital, Denmark as well as social media, and patient organizations. Inclusion criteria were ADHD and/or ASD according to the diagnostic criteria described in the 10th revision of the International Statistical Classification of Diseases and Related Health Problems (ICD-10)Citation83. Study cases were divided into the following three groups: 1. Children diagnosed with ADHD (F90.0, F90.1, or F98.8c), 2. Children diagnosed with ASD (F84.0, F84.1, F84.10, F84.11, F84.12, F84.5, or F84.8), and 3. Children diagnosed with comorbid ADHD/ASD. As controls, we included two groups of children without neurodevelopmental disorders: one consisting of siblings to the three case groups and another consisting of non-related children. The participants were divided into groups based on their diagnosis at the time of data acquisition or within the following three months. The diagnoses of ADHD and/or ASD were made at a multidisciplinary clinical conference after psychiatric examinations and tests have been performed. Regarding ADHD, the ADHD rating scale (ADHD-RS)Citation84 and Test of Variables of Attention (T.O.V.A)Citation85 were utilized, whereas, for ASD, the Autism Diagnostic Observation Schedule 2nd edition (ADOS2Citation86 was used. Participants were diagnosed if they were above the clinical cutoff level in the specified diagnostic instruments for ADHD or ASD. For ADHD-RS, this is based on normative data on Danish school childrenCitation87, while for ADOS2Citation88, a calibrated severity score above three was used as inclusion criteria. Cognitive testing was also performed when it was considered relevant as part of the normal process for children with ADHD or ASD. This was done either in the clinic as part of the psychiatric assessment, or by school psychologists prior to referral to child and adolescent psychiatry. Based on ethical considerations concerning the risk of applying a diagnosis to otherwise healthy children, the non-affected children were not tested for neurodevelopmental disorders.
Exclusion criteria included antibiotic treatment within three months of the inclusion date and active treatment with antipsychotics or selective serotonin receptor inhibitors due to previous reports of antimicrobial effects of these medicationsCitation89,Citation90. Other psychotropic medications like serotonin-norepinephe reuptake inhibitors and clonidine are not being used in children and adolescents in Denmark. Other exclusion criteria included organic, including symptomatic, mental disorders (F00-F09 of the ICD-10), schizophrenia (F20), manic episode (F30), bipolar affective disorder (F31), mental and behavioral disorders due to psychoactive substance use (F10-F19), or eating disorders (F50).
The study was approved by the North Denmark Regional Ethical Committee (reference: N-20170064) and registered with the Danish Data Protection Agency. Informed consent was obtained from parents or legal guardians of the included children.
Gastrointestinal symptoms, diet, and medical history
The parents of all participants were asked to describe the typical diet of the participating children in general and for the week preceding inclusion into the study. The diet was defined as atypical if it did not vary between days or if several common food items were excluded (e.g., vegetarian or other selected diets). During the study period, the parents were further asked to describe defecation frequency and consistency (according to the Bristol Stool ChartCitation54 for 14 days before sample delivery, as well as to rate the consistency of the feces from which samples were collected. Constipation was defined as less than three defecations/weekCitation91. Further information on the clinical history and medication use were obtained through medical records.
Sample collection
Fecal and urine samples were available from all included study participants (n = 95), whereas blood samples were only available from 85 study participants (). Fecal and urine samples were collected at the home of study participants, with parents instructed in collecting samples using written, oral, and video guides to ensure correct sample handling. Fecal samples were stored for up to three days at −20 ° before being transported frozen in cooler bags to the Departments of Clinical Biochemistry at Aalborg University Hospital or North Denmark Regional Hospital. Here, peripheral blood was drawn into Vacuette® tubes containing K2-EDTA (Greiner Bio-One GmbH, Cat. No: 456043). These tubes were then centrifuged at 2200×g for 10 min at 4°C to produce blood plasma. Following collection, fecal, urine, and plasma samples were aliquoted and stored at −80°C at the Centre for Clinical Research, North Denmark Regional Hospital.
Bacterial DNA extraction, 16S rRNA gene sequencing, and bioinformatics
Bacterial DNA was isolated from 250 ± 25 mg feces or, in the case of negative controls, nuclease-free water, using the QIAamp Powerfecal DNA kit (QIAGEN®, Cat. No. 51804) automated on a QIAcube® (QIAGEN, Cat. No. 9001293), following the manufacturer’s protocol. DNA samples were transported on dry ice to DNAsense ApS (Denmark) for 16S rRNA gene sequencing. Library generation and sequencing were performed as a two-step polymerase chain reaction (PCR), as previously describedCitation92. First, the 16S rRNA V4 region was amplified using the 515F (Parada)Citation93/806 R(Appril) Citation94 primer set. Next, unique barcoded primers were added. The resulting DNA were sequenced (2×300 bp) on a MiSeq platform using the MiSeq Reagent kit V3 (Illumina, cat. No. MS-102-3001), with a 10% PhiX control library (Illumina, Cat. No. FC-110-3001) added to estimate error rate.
Following sequencing, read pairs were demultiplexed and filtered for PhiX sequences using the usearch v11 pipelineCitation95. The resulting sequences were imported into the QIIME2 2020.8 bioinformatics platformCitation96. Forward reads were filtered for primers, truncated to 250 base pairs, and denoised using DADA2 with standard parameters to form ASVs. Samples with less than 40,000 reads, corresponding to negative controls, were removed from downstream analysis. All ASVs were aligned with mafft through q2-alignment and used for the construction of a phylogenetic tree using fasttree2. Taxonomy was assigned using the Naïve Bayesian classifier, implemented in the q2-feature-classifier, and trained against the SILVA 138 SSU reference databaseCitation97. Feature tables were then exported for downstream analyses in R version 4.0.3 (https://www.r-project.org/). 16S rRNA amplicon data were investigated using the packages phyloseq v1.32.0 (https://github.com/joey711/phyloseq) and ampvis2 v2.6.6 (https://github.com/KasperSkytte/ampvis2). Alpha-diversity metrics included ASV richness, Faith’s phylogenetic diversity, and Shannon diversity index. Beta-diversity was visualized using principal coordinate analysis (PCoA) with Bray-Curtis dissimilarity, weighted and unweighted UniFrac, and analyzed through PERMANOVA with 999 permutations and siblings as strata, as implemented in ADONIS and tested for variability using Betadisper. The ANCOM-BCCitation55 was used to determine the most differentially abundant taxa between the different diagnostic groups, using siblings as random effects and, with a Benjamini-Hochberg adjusted p-value<0.05 considered significant.
Enzyme-linked immunosorbent assay (ELISA)-based measurement of fecal calprotectin, urinary cortisol, and LBP
Fecal calprotectin was measured using modular components for the ELIATM Calprotectin 2 kit (Thermo Fisher Scientific, Cat. No. 14-6748-01, 83-1147-01, 83-1023-01, 83-1128-01, and 14-5651-01) automated on the Phadia 250 instrument (Thermo Fisher Scientific, Cat. No. 12-3900-01) with corresponding reagents (Thermo Fisher, Cat. No. 10-9440-01, 10-9441-01, 10-9442-01, 10-9479-01, and 10-9422-01), according to the manufacturer’s instructions. The concentration of LBP in peripheral blood plasma samples was measured in duplicates using the RayBio® Human LBP ELISA Kit (RayBiotech, Cat. No. ELH-LBP) according to the manufacturer’s instructions with plasma samples diluted 1:1000 with assay diluent. Morning urinary cortisol concentration was measured using the Cortisol Competitive ELISA kit (Thermo Fisher Scientific, Cat. No. EIAHCOR). This was normalized to the urinary creatinine concentration, which was measured using the Creatinine Urinary Detection kit (Thermo Fisher Scientific, Cat. No. EIACUN), to obtain cortisol per creatinine in duplicates of morning urine from all participants. Briefly, urine samples were diluted at 1:30 for both cortisol and creatinine measures, and the immunoassay was performed according to the manufacturer’s instructions, although with six washes following each incubation step for cortisol. For LBP and cortisol measures, all incubation steps were performed at room temperature using an orbital shaker (Thermo Fisher Scientific, Cat. No. 16514622) set at 150 rpm. Signal intensity was measured at 450 nm for LBP and cortisol and 490 nm for creatinine, using a Fluostar Omega Plate Reader (BMG Labtech, Germany). LBP, cortisol, and creatinine concentrations were subsequently calculated by comparing signaling intensity with standard curves generated from kit controls, using the four-parameter logistic regression method, as per the manufacturer’s recommendation. Assay diluent was used as a negative control.
Meso scale-based measurements of blood plasma immune markers
Concentrations of 56 immune markers (53 unique) were analyzed in blood plasma, using electrochemiluminescent immunoassays (Meso Scale Diagnostics). A combination of seven panels was used, including V-PLEX Angiogenesis Panel 1 Human (Cat. No. K15190D), V-PLEX Chemokine Panel 1 Human (Cat. No. K15047D), V-PLEX Cytokine Panel 1 Human (Cat. No. K15050D), V-PLEX Cytokine Panel 2 Human (Cat. No. K15084D), V-PLEX Proinflammatory Panel 1 Human (Cat. No. K15049D), V-PLEX Vascular Injury Panel 2 Human (Cat. No. K15198D), and V-PLEX TH17 Panel 1 Human (Cat. No. K15085D). Analyses were performed according to the manufacturer’s protocol. All panels were analyzed on the Meso QuickPlex SQ 120 platform (Meso Scale Diagnostics, Cat. No. AI0AA–0) that uses electrochemiluminescence. Samples were analyzed in triplicates, and positions on plates were randomized. Results were displayed as log2 transformed fluorescent intensity. To adjust for variations across plates, signal intensities were median transformed between the individual plates. Assay diluent was used as a negative control.
Statistics
All statistical analyses were performed in R version 4.2.2 (https://www.r-project.org/) through RStudio IDE (http://www.rstudio.com/). For continuous data, like alpha-diversity, ELISA, or Meso Scale results, distribution and variance were determined using the Shapiro-Wilks test and Bartlett’s test, respectively. Subsequently, results were analyzed using linear mixed effect models (continuous data) or generalized linear mixed models (categorical data) to adjust for random effects of siblings in the study, while pairwise comparisons were performed using the emmeans package (https://github.com/rvlenth/emmeans) utilizing Tukey’s method for multiple-comparison testing. Effect sizes were estimated using Cohen’s d and odds ratio. The relationship between microbial alpha- and beta-diversity, as well as LBP and fecal calprotectin, compared to immunoproteomic markers, was assessed using multilevel Spearman’s correlation, as implemented in the correlation package (https://github.com/easystats/correlation). Here, siblings were entered as random effects, while Benjamini-Hochberg’s procedure was used to adjust for the false-discovery rate due to multiple comparisons. Children with ADHD, ASD, or comorbid ADHD/ASD were compared to each other, to the matching sibling groups, to non-related children, and to a combined control group consisting of siblings and non-related children. The null hypothesis was rejected if the p-value or the adjusted p-value was<0.05. Technical replicates were averaged before analyses.
Author contribution
CBN, MBL, PL, SH, MN, and SS designed the study. CBN recruited participants, with supervision from MBL. CBN performed sample collection and ELISA experiments. PH and MHL performed calprotectin and Meso Scale analyses, respectively. CBN performed data analysis, with assistance from JKK, MHL, MN, LR, ABV, and SS. All authors assisted in the interpretation of data. MBL, SH, MN, and SS supervised CBN. CBN drafted the manuscript, while CBN, MBL, PL, SH, MN, and SS finalized the manuscript. All authors read and approved the final manuscript.
Supplemental Material
Download MS Excel (185.5 KB)Supplemental Material
Download MS Word (2.9 MB)Acknowledgments
The authors would like to thank laboratory technicians Ann-Maria Jensen, Bente Markstrøm Jensen, and Signe Agerlin Klitgaard Poulsen for excellent technical assistance, as well as medical secretary Heidi Hattmann Hjortshøj for assistance with the collection and interpretation of medical histories of participants. Furthermore, we would like to thank the clinical and research staff at the Clinic for Child and Adolescent Psychiatry and the Research Unit for Child and Adolescent Psychiatry, Aalborg University, for assistance with the recruitment of study participants as well as discussions. Finally, we would like to thank Carlos Gonzales, Justin Shaffer, and Cameron Martino from the University of California San Diego for their advice on multi-omics analyses.
Disclosure statement
No potential conflict of interest was reported by the authors.
Data availability statement
The 16S rRNA sequencing data that support the findings of this study, are freely available in NCBI SRA at https://www.ncbi.nlm.nih.gov/bioproject/?term=PRJNA701402, Bioproject ID PRJNA701402.
Supplementary material
Supplemental data for this article can be accessed online at https://doi.org/10.1080/19490976.2023.2211923.
Additional information
Funding
References
- Zeidan J, Fombonne E, Scorah J, Ibrahim A, Durkin MS, Saxena S, Yusuf A, Shih A, Elsabbagh M. Global prevalence of autism: a systematic review update. Autism Res. 2022;15:778–20. doi:10.1002/aur.2696.
- Thomas R, Sanders S, Doust J, Beller E, Glasziou P. Prevalence of attention-deficit/hyperactivity disorder: a systematic review and meta-analysis. Pediatrics. 2015;135:e994–1001. doi:10.1542/peds.2014-3482.
- Avni E, Ben-Itzchak E, Zachor DA. The presence of comorbid ADHD and anxiety symptoms in autism spectrum disorder: clinical presentation and predictors. Front Psychiatry. 2018;9:717. doi:10.3389/fpsyt.2018.00717.
- Cross-Disorder Group of the Psychiatric Genomics Consortium. Identification of risk loci with shared effects on five major psychiatric disorders: a genome-wide analysis. Lancet (London, England). 2013;381:1371–1379. doi:10.1016/S0140-6736.
- Antshel KM, Russo N. Autism spectrum disorders and ADHD: overlapping phenomenology, diagnostic issues, and treatment considerations. Curr Psychiatry Rep. 2019;21:34. doi:10.1007/s11920-019-1020-5.
- Gaugler T, Klei L, Sanders SJ, Bodea CA, Goldberg AP, Lee AB, Mahajan M, Manaa D, Pawitan Y, Reichert J, et al. Most genetic risk for autism resides with common variation. Nat Genet. 2014;46:881–885. doi:10.1038/ng.3039.
- Faraone SV, Mick E. Molecular genetics of attention deficit hyperactivity disorder. Psychiatr Clin North Am. 2010;33:159–180. doi:10.1016/j.psc.2009.12.004.
- Tick B, Bolton P, Happé F, Rutter M, Rijsdijk F. Heritability of autism spectrum disorders: a meta-analysis of twin studies. J Child Psychol Psychiatry. 2016;57:585–595. doi:10.1111/jcpp.12499.
- Faraone SV, Larsson H. Genetics of attention deficit hyperactivity disorder. Mol Psychiatry. 2019;24:562–575. doi:10.1038/s41380-018-0070-0.
- DeFilippis M, Wagner KD. Treatment of Autism spectrum disorder in children and adolescents. Psychopharmacol Bull. 2016;46:18–41.
- Chan E, Fogler JM, Hammerness PG. Treatment of attention-deficit/hyperactivity disorder in adolescents: a systematic review. JAMA. 2016;315:1997–2008. doi:10.1001/jama.2016.5453.
- O’Callaghan P. Adherence to stimulants in adult ADHD. Atten Defic Hyperact Disord. 2014;6:111–120. doi:10.1007/s12402-014-0129-y.
- Whiteley P, Haracopos D, Knivsberg A-M, Reichelt KL, Parlar S, Jacobsen J, Seim A, Pedersen L, Schondel M, Shattock P. The ScanBrit randomised, controlled, single-blind study of a gluten- and casein-free dietary intervention for children with autism spectrum disorders. Nutr Neurosci. 2010;13:87–100. doi:10.1179/147683010X12611460763922.
- Pelsser LMJ, Frankena K, Toorman J, Savelkoul HFJ, Pereira RR, Buitelaar JK. A randomised controlled trial into the effects of food on ADHD. Eur Child Adolesc Psychiatry. 2009;18:12–19. doi:10.1007/s00787-008-0695-7.
- Pelsser LM, Frankena K, Toorman J, Rodrigues Pereira RD, ADHD. Reviewing the evidence: a systematic review of meta-analyses of double-blind placebo-controlled trials evaluating the efficacy of diet interventions on the behavior of children with ADHD. PLos One. 2017;12:e0169277. doi10.1371/journal.pone.0169277.
- Slykerman RF, Coomarasamy C, Wickens K, Thompson JMD, Stanley TV, Barthow C, Kang J, Crane J, Mitchell EA. Exposure to antibiotics in the first 24 months of life and neurocognitive outcomes at 11 years of age. Psychopharmacol (Berl). 2019;236:1573–1582. doi:10.1007/s00213-019-05216-0.
- Lu J, Lu L, Yu Y, Cluette-Brown J, Martin CR, Claud EC. Effects of intestinal microbiota on brain development in humanized gnotobiotic mice. null. 2018;8:5443. doi:10.1038/s41598-018-23692-w.
- McElhanon BO, McCracken C, Karpen S, Sharp WG Gastrointestinal symptoms in autism spectrum disorder: ameta-analysis. Pediatrics peds. 2014: 2013–3995.10.1542/peds.2013-3995
- McKeown C, Hisle-Gorman E, Eide M, Gorman GH, Nylund CM. Association of constipation and fecal incontinence with attention-deficit/hyperactivity disorder. Pediatrics. 2013;132:e1210–5. doi:10.1542/peds.2013-1580.
- Holingue C, Newill C, Lee LC, Pasricha PJ, Daniele Fallin M. Gastrointestinal symptoms in autism spectrum disorder: a review of the literature on ascertainment and prevalence. Autism Res. 2018;11:24–36. doi:10.1002/aur.1854.
- Carissimi C, Laudadio I, Palone F, Fulci V, Cesi V, Cardona F, Alfonsi C, Cucchiara S, Isoldi S, Stronati L. Functional analysis of gut microbiota and immunoinflammation in children with autism spectrum disorders. Dig Liver Dis. 2019;51:1366–1374. doi:10.1016/j.dld.2019.06.006.
- Rose DR, Yang H, Serena G, Sturgeon C, Ma B, Careaga M, Hughes HK, Angkustsiri K, Rose M, Hertz-Picciotto I .Differential immune responses and microbiota profiles in children with autism spectrum disorders and co-morbid gastrointestinal symptoms. Brain Behav Immun. 2018;70:354–368. doi:10.1016/j.bbi.2018.03.025.
- Bundgaard-Nielsen C, Knudsen J, Leutscher PDC, Lauritsen MB, Nyegaard M, Hagstrøm S, Sørensen S. Gut microbiota profiles of autism spectrum disorder and attention deficit/hyperactivity disorder: a systematic literature review. Gut Microbes. 2020;11:1172–1187. doi:10.1080/19490976.2020.1748258.
- Sandler RH, Finegold SM, Bolte ER, Buchanan CP, Maxwell AP, Väisänen M-L, Nelson MN, Wexler HM. Short-term benefit from oral vancomycin treatment of regressive-onset autism. J Child Neurol. 2000;15:429–435. doi:10.1177/088307380001500701.
- Finegold SM, Dowd SE, Gontcharova V, Liu C, Henley KE, Wolcott RD, Youn E, Summanen PH, Granpeesheh D, Dixon D. Pyrosequencing study of fecal microflora of autistic and control children. Anaerobe. 2010;16:444–453. doi:10.1016/j.anaerobe.2010.06.008.
- Li N, Chen H, Cheng Y, Xu F, Ruan G, Ying S, Tang W, Chen L, Chen M, Lv LL. Fecal microbiota transplantation relieves gastrointestinal and autism symptoms by improving the gut microbiota in an open-label study. Front Cell Infect Microbiol. 2021;11:1–13. doi:10.3389/fcimb.2021.759435.
- De Angelis M, Piccolo M, Vannini L, Siragusa S, De Giacomo A, Serrazzanetti DS, Cristofori F, Guerzoni ME, Gobbetti M, Francavilla R. Fecal microbiota and metabolome of children with autism and pervasive developmental disorder not otherwise specified. PLos One. 2013;8:e76993. doi:10.1371/journal.pone.0076993.
- Coretti L, Paparo L, Riccio MP, Amato F, Cuomo M, Natale A, Borrelli L, Corrado G, De Caro C, Comegna M. Gut microbiota features in young children with autism spectrum disorders. null. 2018;9:3146. doi:10.3389/fmicb.2018.03146.
- Pulikkan J, Maji A, Dhakan DB, Saxena R, Mohan B, Anto MM, Agarwal N, Grace T, Sharma VK. Gut microbial dysbiosis in Indian children with autism spectrum disorders. Microb Ecol. 2018;76:1102–1114. doi:10.1007/s00248-018-1176-2.
- Ma B, Liang J, Dai M, Wang J, Luo J, Zhang Z, Jing J. Altered gut microbiota in Chinese children with autism spectrum disorders. Front Cell Infect Microbiol. 2019;9:40. doi:10.3389/fcimb.2019.00040.
- Plaza-Díaz J, Gómez-Fernández A, Chueca N, Torre-Aguilar M, Gil Á, Perez-Navero J, Flores-Rojas K, Martín-Borreguero P, Solis-Urra P, Ruiz-Ojeda F, et al. Autism spectrum disorder (ASD) with and without mental regression is associated with changes in the fecal microbiota. Nutrients. 2019;11:337. doi:10.3390/nu11020337.
- Averina OV, Kovtun AS, Polyakova SI, Savilova AM, Rebrikov DV, Danilenko VN. The bacterial neurometabolic signature of the gut microbiota of young children with autism spectrum disorders. J Med Microbiol. 2020;69:558–571. doi:10.1099/jmm.0.001178.
- Kang DW, Adams JB, Gregory AC, Borody T, Chittick L, Fasano A, Khoruts A, Geis E, Maldonado J, McDonough-Means S, et al. Microbiota transfer therapy alters gut ecosystem and improves gastrointestinal and autism symptoms: an open-label study. Microbiome. 2017;5:1–16. doi:10.1186/s40168-016-0225-7.
- Li N, Tang J, Zhang J, Liang C, Wang Y, Chen B, Zhao C, Wang J, Zhang G, Zhao D. Correlation of gut microbiome between ASD children and mothers and potential biomarkers for risk assessment. Genomics, Proteomics Bioinforma. 2019;17:26–38. doi:10.1016/j.gpb.2019.01.002.
- Sharon G, Cruz NJ, Kang DW, Gandal MJ, Wang B, Kim YM, Zing EM, Casey CP, Taylor BC, Lane CJ. Human gut microbiota from autism spectrum disorder promote behavioral symptoms in mice. Cell. 2019;177:1600–1618.e17. doi:10.1016/j.cell.2019.05.004.
- Kang D-W, Adams JB, Coleman DM, Pollard EL, Maldonado J, McDonough-Means S, Caporaso JG, Krajmalnik-Brown R. Long-term benefit of microbiota transfer therapy on autism symptoms and gut microbiota. null. 2019;9:5821. doi:10.1038/s41598-019-42183-0.
- Stewart Campbell A, Needham BD, Meyer CR, Tan J, Conrad M, Preston GM, Bolognani F, Rao SG, Heussler H, Griffith R, et al. Safety and target engagement of an oral small-molecule sequestrant in adolescents with autism spectrum disorder: an open-label phase 1b/2a trial. Nat Med. 2022;28:528–534. doi:10.1038/s41591-022-01683-9.
- Yap CX, Henders AK, Alvares GA, Wood DLA, Krause L, Tyson GW, Restuadi R, Wallace L, McLaren T, Hansell NK. Autism-related dietary preferences mediate autism-gut microbiome associations. Cell. 2021;184:5916–5931.e17. doi:10.1016/j.cell.2021.10.015.
- Pärtty A, Kalliomäki M, Wacklin P, Salminen S, Isolauri E. A possible link between early probiotic intervention and the risk of neuropsychiatric disorders later in childhood: a randomized trial. Pediatr Res. 2015;77:823–828. doi:10.1038/pr.2015.51.
- Prehn-Kristensen A, Zimmermann A, Tittmann L, Lieb W, Schreiber S, Baving L, Fischer A. Reduced microbiome alpha diversity in young patients with ADHD. PLos One. 2018;13:e0200728. doi:10.1371/journal.pone.0200728.
- Jiang H, Zhou Y-Y, Zhou G-L, Li Y-C, Yuan J, Li X-H, Ruan B. Gut microbiota profiles in treatment-naïve children with attention deficit hyperactivity disorder. Behav Brain Res. 2018;347:408–413. doi:10.1016/j.bbr.2018.03.036.
- Wang L-J, Yang C-Y, Chou W-J, Lee M-J, Chou M-C, Kuo H-C, Yeh Y-M, Lee S-Y, Huang L-H, Li S-C. Gut microbiota and dietary patterns in children with attention-deficit/hyperactivity disorder. Eur Child Adolesc Psychiatry. 2019;29:287–297. doi:10.1007/s00787-019-01352-2.
- Aarts E, Ederveen THA, Naaijen J, Zwiers MP, Boekhorst J, Timmerman HM, Smeekens SP, Netea MG, Buitelaar JK, Franke B. Gut microbiome in ADHD and its relation to neural reward anticipation. PLos One. 2017;12:e0183509. doi:10.1371/journal.pone.0183509.
- Szopinska-Tokov J, Dam S, Naaijen J, Konstanti P, Rommelse N, Belzer C, Buitelaar J, Franke B, Aarts E, Vasquez AA. Investigating the gut microbiota composition of individuals with attention-deficit/hyperactivity disorder and association with symptoms. Microorganisms. 2020;8:406. doi:10.3390/microorganisms8030406.
- Richarte V, Sánchez-Mora C, Corrales M, Fadeuilhe C, Vilar-Ribó L, Arribas L, Garcia E, Rosales-Ortiz SK, Arias-Vasquez A, Soler-Artigas M. Gut microbiota signature in treatment-naïve attention-deficit/hyperactivity disorder. Transl Psychiatry. 2021;11. doi:10.1038/s41398-021-01504-6.
- Tengeler AC, Dam SA, Wiesmann M, Naaijen J, van Bodegom M, Belzer C, Dederen PJ, Verweij V, Franke B, Kozicz T. Gut microbiota from persons with attention-deficit/hyperactivity disorder affects the brain in mice. Microbiome. 2020;8:44. doi:10.1186/s40168-020-00816-x.
- Oades RD, Myint A-M, Dauvermann MR, Schimmelmann BG, Schwarz MJ. Attention-deficit hyperactivity disorder (ADHD) and glial integrity: an exploration of associations of cytokines and kynurenine metabolites with symptoms and attention. Behav Brain Funct. 2010;6:32. doi:10.1186/1744-9081-6-32.
- Hu C-C, Xu X, Xiong G-L, Xu Q, Zhou B-R, Li C-Y, Qin Q, Liu CXL, Li H-P, Sun Y-J. Alterations in plasma cytokine levels in Chinese children with autism spectrum disorder. Autism Res. 2018;11:989–999. doi:10.1002/aur.1940.
- Careaga M, Rogers S, Hansen RL, Amaral DG, Van de Water J, Ashwood P. Immune endophenotypes in children with autism spectrum disorder. Biol Psychiatry. 2015;81:434–441. doi:10.1016/j.biopsych.2015.08.036.
- Özyurt G, Öztürk Y, Appak YÇ, Arslan FD, Baran M, Karakoyun İ, Tufan AE, Pekcanlar AA. Increased zonulin is associated with hyperactivity and social dysfunctions in children with attention deficit hyperactivity disorder. Compr Psychiatry. 2018;87:138–142. doi:10.1016/j.comppsych.2018.10.006.
- Emanuele E, Orsi P, Boso M, Broglia D, Brondino N, Barale F, di Nemi SU, Politi P. Low-grade endotoxemia in patients with severe autism. Neurosci Lett. 2010;471:162–165. doi:10.1016/j.neulet.2010.01.033.
- Wang W, Uzzau S, Goldblum SE, Fasano A. Human zonulin, a potential modulator of intestinal tight junctions. J Cell Sci. 2000;113(24):4435–4440. doi:10.1242/jcs.113.24.4435.
- Kiecolt-Glaser JK, Wilson JS, Bailey ML, Andridge R, Peng J, Jaremka LM, Fagundes CP, Malarkey WB, Laskowski B, Belury MA. Marital distress, depression, and a leaky gut: translocation of bacterial endotoxin as a pathway to inflammation. Psychoneuroendocrinology. 2018;98:52–60. doi:10.1016/j.psyneuen.2018.08.007.
- Lewis SJ, Heaton KW. Stool form scale as a useful guide to intestinal transit time. Scand J Gastroenterol. 1997;32:920–924. doi:10.3109/00365529709011203.
- Lin H, Peddada SD. Analysis of compositions of microbiomes with bias correction. Nat Commun. 2020;11:1–11. doi:10.1038/s41467-020-17041-7.
- Zhang W, Sun Z, Zhang Q, Sun Z, Su Y, Song J, Wang B, Gao R. Preliminary evidence for an influence of exposure to polycyclic aromatic hydrocarbons on the composition of the gut microbiota and neurodevelopment in three-year-old healthy children. BMC Pediatr. 2021;21:1–13. doi:10.1186/s12887-021-02539-w.
- Kelly JR, Borre Y, O' Brien C, Patterson E, El Aidy S, Deane J, Kennedy PJ, Neers S, Scott K, Gerard M. Transferring the blues: depression-associated gut microbiota induces neurobehavioural changes in the rat. J Psychiatr Res. 2016;82:109–118. doi:10.1016/j.jpsychires.2016.07.019.
- Wang M, Wan J, Rong H, He F, Wang H, Zhou J, Cai C, Wang Y, Xu R, Yin Z. Alterations in gut glutamate metabolism associated with changes in gut microbiota composition in children with autism spectrum disorder. mSystems. 2019;4. doi:10.1128/mSystems.00321-18.
- Wan L, Ge W-R, Zhang S, Sun Y-L, Wang B, Yang G. Case-control study of the effects of gut microbiota composition on neurotransmitter metabolic pathways in children with attention deficit hyperactivity disorder. Front Neurosci. 2020;14:127. doi:10.3389/fnins.2020.00127.
- Albertsen M, Karst SM, Ziegler AS, Kirkegaard RH, Nielsen PH. Back to basics - the influence of DNA extraction and primer choice on phylogenetic analysis of activated sludge communities. PLos One. 2015;10:1–15. doi:10.1371/journal.pone.0132783.
- Le Chatelier E, Nielsen T, Qin J, Prifti E, Hildebrand F, Falony G, Almeida M, Arumugam M, Batto JM, Kennedy S. Richness of human gut microbiome correlates with metabolic markers. Nature. 2013;500:541–546. doi:10.1038/nature12506.
- Schmitt J, Buske-Kirschbaum A, Roessner V. Is atopic disease a risk factor for attention-deficit/hyperactivity disorder? A systematic review. Allergy. 2010;65:1506–1524. doi:10.1111/j.1398-9995.2010.02449.x.
- Miyazaki C, Koyama M, Ota E, Swa T, Mlunde LB, Amiya RM, Tachibana Y, Yamamoto-Hanada K, Mori R. Allergic diseases in children with attention deficit hyperactivity disorder: a systematic review and meta-analysis. Bmc Psychiatry. 2017;17:1–12. doi:10.1186/s12888-017-1281-7.
- Çetin FH, Uçaryılmaz H, Uçar HN, Artaç H, Güler HA, Duran SA, Kılınç K, Türkoğlu S. Regulatory T cells in children with attention deficit hyperactivity disorder: a case-control study. J Neuroimmunol. 2022;367:577848. doi:10.1016/j.jneuroim.2022.577848.
- Leslie, Leslie DL, Kozma L, Martin A, Landeros A, Katsovich L, King RA, Leckman JF. Neuropsychiatric disorders associated with streptococcal infection: a case-control study among privately insured children. J Am Acad Child Adolesc Psychiatry. 2008;47:1166–1172. doi:10.1097/CHI.0b013e3181825a3d.
- Zou R, Xu F, Wang Y, Duan M, Guo M, Zhang Q, Zhao H, Zheng H. Changes in the gut microbiota of children with autism spectrum disorder. Autism Res. 2020;13:1614–1625. doi:10.1002/aur.2358.
- Zurita MF, Cárdenas PA, Sandoval ME, Peña MC, Fornasini M, Flores N, Monaco MH, Berding K, Donovan SM, Kuntz T. Analysis of gut microbiome, nutrition and immune status in autism spectrum disorder: a case-control study in Ecuador. Gut Microbes. 2019;00:1–12.
- Liu S, Li E, Sun Z, Fu D, Duan G, Jiang M, Yu Y, Mei L, Yang P, Tang Y. Altered gut microbiota and short chain fatty acids in Chinese children with autism spectrum disorder. Scientific reports. 2019;9:287. doi:10.1038/s41598-018-36430-z.
- Berding K, Donovan SM. Diet can impact microbiota composition in children with autism spectrum disorder. Front Neurosci. 2018;12:515. doi:10.3389/fnins.2018.00515.
- Zhang M, Ma W, Zhang J, He Y, Wang J. Analysis of gut microbiota profiles and microbe-disease associations in children with autism spectrum disorders in China. null. 2018;8:13981. doi:10.1038/s41598-018-32219-2.
- Zhai Q, Cen S, Jiang J, Zhao J, Zhang H, Chen W. Disturbance of trace element and gut microbiota profiles as indicators of autism spectrum disorder: a pilot study of Chinese children. Environ Res. 2019;171:501–509. doi:10.1016/j.envres.2019.01.060.
- Finegold SM. Desulfovibrio species are potentially important in regressive autism. Med Hypotheses. 2011;77:270–274. doi:10.1016/j.mehy.2011.04.032.
- Ye F, Gao X, Wang Z, Cao S, Liang G, He D, Lv Z, Wang L, Xu P, Zhang Q. Comparison of gut microbiota in autism spectrum disorders and neurotypical boys in China: a case-control study. Synth Syst Biotechnol. 2021;6:120–126. doi:10.1016/j.synbio.2021.03.003.
- Strati F, Cavalieri D, Albanese D, De Felice C, Donati C, Hayek J, Jousson O, Leoncini S, Renzi D, Calabrò A. New evidences on the altered gut microbiota in autism spectrum disorders. Microbiome. 2017;5:24. doi:10.1186/s40168-017-0242-1.
- De Filippo C, Cavalieri D, Di Paola M, Ramazzotti M, Poullet JB, Massart S, Collini S, Pieraccini G, Lionetti P. Impact of diet in shaping gut microbiota revealed by a comparative study in children from Europe and rural Africa. Proc Natl Acad Sci US A. 2010;107:14691–14696. doi:10.1073/pnas.1005963107.
- David LA, Materna AC, Friedman J, Campos-Baptista MI, Blackburn MC, Perrotta A, Erdman SE, Alm EJ. Host lifestyle affects human microbiota on daily timescales. Genome Biol. 2014;15:R89. doi:10.1186/gb-2014-15-7-r89.
- Kang D-W, Ilhan ZE, Isern NG, Hoyt DW, Howsmon DP, Shaffer M, Lozupone CA, Hahn J, Adams JB, Krajmalnik-Brown, R. Differences in fecal microbial metabolites and microbiota of children with autism spectrum disorders. Anaerobe. 2018;49:121–131. doi:10.1016/j.anaerobe.2017.12.007.
- Son JS, Zheng LJ, Rowehl LM, Tian X, Zhang Y, Zhu W, Litcher-Kelly L, Gadow KD, Gathungu G, Robertson CE. Comparison of fecal microbiota in children with autism spectrum disorders and neurotypical siblings in the Simons simplex collection. PLos One. 2015;10:1–19. doi:10.1371/journal.pone.0137725.
- Ahmed SAS, Elhefnawy AM, Azouz HG, Roshdy YS, Ashry MH, Ibrahim AE, Meheissen MA. Study of the gut microbiome profile in children with autism spectrum disorder: a single tertiary hospital experience. J Mol Neurosci. 2020;70:887–896. doi:10.1007/s12031-020-01500-3.
- Edgar RC. Accuracy of taxonomy prediction for 16S rRNA and fungal ITS sequences. PeerJ. 2018;6:e4652. doi:10.7717/peerj.4652.
- Russell G, Mandy W, Elliott D, White R, Pittwood T, Ford T. Selection bias on intellectual ability in autism research: a cross-sectional review and meta-analysis. Mol Autism. 2019;10(1). doi:10.1186/s13229-019-0260-x.
- Callahan BJ, McMurdie PJ, Holmes SP. Exact sequence variants should replace operational taxonomic units in marker-gene data analysis. Isme J. 2017;11:2639–2643. doi:10.1038/ismej.2017.119.
- World Health Organization. ICD-10 : international statistical classification of diseases and related health problems. Tenth revision. France: World Health Organization; 2004.
- Pappas D. ADHD rating scale-IV: checklists, norms, and clinical interpretation. J Psychoeduc Assess. 2006;24:172–178. doi:10.1177/0734282905285792.
- Leark RA, Dupuy TR, Greenberg LM, Kindschi CL, Hughes S. T.O.V.A. professional manual: test of variables of attention continuous performance test. Langley (WA), USA: T.O.V.A Company; 2016.
- Gotham K, Risi S, Pickles A, Lord C. The autism diagnostic observation schedule: revised algorithms for improved diagnostic validity. J Autism Dev Disord. 2007;37:613–627. doi:10.1007/s10803-006-0280-1.
- Poulsen L, Jørgensen SL, Dalsgaard S, Bilenberg N. Danish standardization of the attention deficit hyperactivity disorder rating scale. Ugeskr Laeger. 2009;171:1500–1504.
- Gotham K, Pickles A, Lord C. Standardizing ADOS scores for a measure of severity in autism spectrum disorders. J Autism Dev Disord. 2009;39:693–705. doi:10.1007/s10803-008-0674-3.
- Ait Chait Y, Mottawea W, Tompkins TA, Hammami R. Unravelling the antimicrobial action of antidepressants on gut commensal microbes. null. 2020;10:17878. doi:10.1038/s41598-020-74934-9.
- Fung TC, Vuong HE, Luna CDG, Pronovost GN, Aleksandrova AA, Riley NG, Vavilina A, McGinn J, Rendon T, Forrest LR. Intestinal serotonin and fluoxetine exposure modulate bacterial colonization in the gut. Nat Microbiol. 2019;4:2064–2073. doi:10.1038/s41564-019-0540-4.
- van den Berg MM, Benninga MA, Di Lorenzo C. Epidemiology of childhood constipation: a systematic review. Am J Gastroenterol. 2006;101:2401–2409. doi:10.1111/j.1572-0241.2006.00771.x.
- Bundgaard-Nielsen C, Hagstrøm S, Sørensen S. Interpersonal variations in gut microbiota profiles supersedes the effects of differing fecal storage conditions. null. 2018;8:17367. doi:10.1038/s41598-018-35843-0.
- Parada AE, Needham DM, Fuhrman JA. Every base matters: assessing small subunit rRNA primers for marine microbiomes with mock communities, time series and global field samples. Environ Microbiol. 2016;18:1403–1414. doi:10.1111/1462-2920.13023.
- Apprill A, McNally S, Parsons R, Weber L. Minor revision to V4 region SSU rRNA 806R gene primer greatly increases detection of SAR11 bacterioplankton. Aquat Microb Ecol. 2015;75:129–137. doi:10.3354/ame01753.
- Edgar RC. Search and clustering orders of magnitude faster than BLAST. Bioinformatics. 2010;26:2460–2461. doi:10.1093/bioinformatics/btq461.
- Bolyen E, Rideout JR, Dillon MR, Bokulich NA, Abnet CC, Al-Ghalith GA, Alexander H, Alm EJ, Arumugam M, Asnicar F. Reproducible, interactive, scalable and extensible microbiome data science using QIIME 2. Nat Biotechnol. 2019;37:852–857. doi:10.1038/s41587-019-0209-9.
- Quast C, Pruesse E, Yilmaz P, Gerken J, Schweer T, Yarza P, Peplies J, Glöckner FO. The SILVA ribosomal RNA gene database project: improved data processing and web-based tools. Nucleic Acids Res. 2013;41:590–596. doi:10.1093/nar/gks1219.