
ABSTRACT
Epithelial ovarian cancer (EOC) is the most lethal gynecological cancer, which remains a threat to female health at all ages. Hypotheses for EOC development include the continuous presence of inflammation, in which microbiota and inflammatory cytokines participate in cancer-related signaling pathway activation. Hedgehog (Hh) signaling is prominent for EOC progression, and interacts with inflammation response related to gut microbiota (GM). However, the precise roles of GM during this process are unknown. Here, we showed that the GM from patients with EOC differed from that of healthy women and had GM dysbiosis. We found that EOC modeling may lead to GM changes in mice, and it restored after the administration of GM from healthy controls, while GM from patients with EOC further exacerbated GM dysbiosis. Furthermore, we found that GM from EOC markedly promoted tumor progression and activated Hh signaling; meanwhile, it increased the extent of inflammation and activated NF-κB signaling, but GM from healthy controls improved them. Our results demonstrate how GM dysbiosis promoted EOC progression by activating Hh signaling mediated by TLR4/NF-κB signaling. We anticipate our assay to be a new thought for exploring the role of GM in EOC development. Furthermore, improving GM dysbiosis is a novel therapeutic approach for delaying EOC development.
1. Introduction
Epithelial ovarian cancer (EOC) is the most prevalent subtypes of ovarian cancer (OC), which originates from the canceration of ovarian surface epithelium (OSE) or tubal epitheliumCitation1,Citation2. With an estimated 313,959 (1.6%) new cases and 207,252 (2.1%) deaths worldwide in 2020, EOC remains the leading cause of death from gynecologic cancersCitation3. Primary cytoreductive surgery combined with adjuvant chemotherapy remains the standard front-line regimen for EOC with an unsatisfactory clinical efficacy, due to the fact that EOCs are generally diagnosed at advanced stages as a result of occult onset and followed by rapid progressionCitation4. Therefore, exploration of the underlying molecular mechanism of EOC development is urgent and significant for developing novel therapeutic approaches and improving prognosis for EOC.
The mechanism of EOC development may be related to genetic mutations, continuous presence of inflammation, and signaling pathway activationCitation5,Citation6. In recent years, more and more researches indicated that Hedgehog (Hh) signaling pathway played a pivotal role in EOC developmentCitation7. The Hh signaling pathway was initially identified by Nüsslein-Volhard in Drosophila in the early 1980s and contributed to embryonic development and tissue patterningCitation8, while many studies have demonstrated that the aberrantly activated Hh signaling pathway raised the cancer risk and promoted the progression of numerous cancers via enhancing cell proliferation, invasion, and migrationCitation9. In our previous studies, the Hh signaling pathway has been proven to extraordinarily activate in EOC compared with normal ovarian tissue. Suppression of Hh signaling such as inhibitor Gli‑antagonist 61 (GANT61) restrained the growth, invasion, and migratory capability of EOC both in vitro and in vivo by targeting the Gli transcription factor and its downstream proteins ITGB4, CD24, and MMP7Citation10–12. Previous evidence indicated that inflammation cytokines, insulin-like growth factor−1 (IGF−1), as well as epidermal growth factor (EGF) could modulate Hh signaling pathwayCitation13–15, and these factors could be regulated by gut microbiota (GM); however, whether GM influenced the activation of Hh signaling pathway to promote EOC progression so far remains unknown.
In recent years, increasing studies have indicated that GM exerted an important effect on the development and treatment of inflammatory bowel disease, diabetes, Parkinson’s disease, and cancersCitation16,Citation17. As the ecosystem with dynamic equilibriums, GM participates in food digestion, nutrient intake, and vitamin production, being crucial for maintaining human health. GM homeostasis is beneficial to maintain the integrity of the intestinal barrier and enhance the activity of the anti-cancer immune response. However, the imbalance of GM characterized by the reduction in beneficial bacteria (Bifidobacterium et al.)Citation18 and the increase in the pathogens (Peptostreptococcus et al.)Citation19 reduces the thickness of intestinal mucosa and increases permeability. Weak integrity of the intestinal barrier promotes the generation of pro-inflammatory cytokines such as tumor necrosis factor-alpha (TNF-α), triggers a cascade of inflammatory processes, and consequently causes cancer tumorigenesis and deteriorationCitation20. It has been shown that GM dysbiosis has a strong connection with the development of colorectal cancer (CRC)Citation21, lung cancerCitation22, and breast cancerCitation23, mostly by accumulating microbiota-derived toxin and metabolite, promoting local and systemic inflammation, regulating anti-cancer immunity, and activating signaling pathways associated with cancerCitation24,Citation25. Nevertheless, considerably fewer studies have aimed at exploring the effect of GM on EOC development.
In the present study, therefore, 20 EOC patients, 20 patients with epithelial benign ovarian tumor (EBOT) were enrolled, and the high-throughput 16S ribosomal RNA (rRNA) sequencing method was applied to compare the intestinal microbial diversity between them; meanwhile, their physical status was evaluated by blood biochemical tests, electrocardiogram, and imaging examinations. In addition, we constructed a mouse EOC model, and made use of fecal microbiota transplantation (FMT) and inhibitor intervention to demonstrate the impact of GM on EOC and further reveal its potential mechanism. In conclusion, the study may provide insights on EOC assessment and clinical therapy, which is of great significance for EOC patients.
2. Results
2.1. Subjects enrollment and baseline of participants’ characteristics
Sixty participants were recruited into our study, including 20 patients with EOC, 20 patients with EBOT, and 20 healthy cancer-free female controls. The race of all subjects included is Asian, with ages ranging from 18 to 75. No significant difference in ages and body mass indexes (BMI) among three groups was found. In addition, the smoking history, menstrual history, reproductive history, tubal ligation history, and the use of oral contraceptive pill (OCP) in EOC group and the non-EOC group were matched, but the serum CA125 level from EOC patients was remarkably elevated compared to the EBOT patients (). The EOC stage was judged based on the International Federation of Gynecology and Obstetrics (FIGO) 2021 staging systemCitation26. Altogether, approximately 65% of EOC patients (13 of 20) were diagnosed as advanced (stage IIB or greater), while 70% of EOC patients (14 of 20) were epithelial serous ovarian cancer, and all patients showed ovarian epithelial neoplasms by pathologic examination ().
Figure 1. Gut microbiota (GM) Comparison between healthy controls, patients with epithelial benign ovarian tumor (EBOT) and epithelial ovarian cancer (EOC). (a) the typical pathological examination results of EBOT and EOC patients (10 × 40 magnification). The fibrous connective tissue was indicated by a yellow arrow, while the ovarian cancer cells were indicated by red arrow. (b) Comparison of alpha diversity indices (Chao1 and Shannon index) among three groups. (c) Venn map representation of amplicon sequence variants (ASVs). (d) principal coordinates analysis (PCoA) with Bray–Curtis distance of β diversity index. (e-g) Microbial composition at the phylum level. The relative abundances of Proteobacteria and Actinobacteria in three groups were analyzed. (h-j) Microbial composition at the genus level. The relative abundances of Bifidobacterium and Ruminococcaceae_ruminococcus in three groups were analyzed. H: healthy controls (n = 20); B: patients with EBOT (n = 20); E: patients with EOC (n = 20). Data are presented in means ± SD. One-way analysis of variance (ANOVA) with Tukey’s test for multiple comparisons. *P < 0.05, **P < 0.01, ****P < 0.0001.
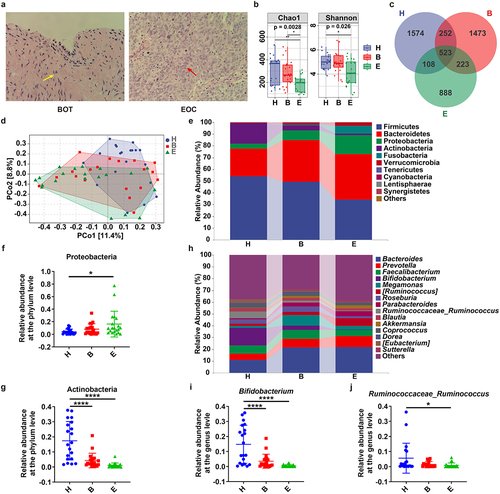
Table 1. Baseline characteristics of patients with EOC and EBOT and healthy controls.
2.2. GM difference between patients with EOC and healthy women or patients with EBOT
The comparison of GM composition among the EOC group, EBOT group, and healthy control group was conducted by utilizing high-throughput sequencing method (). As shown in , the Chao1 index (for community diversity detection) and Shannon index (for total species estimation) of alpha diversity in patients with EOC were notably reduced (p = 0.0028 and p = 0.026). The Venn diagram () showed that there were 2457, 2471, and 1742 amplicon sequence variants (ASVs) in the H (healthy controls), B (patients with EBOT), and E (patients with EOC) groups, and 523 common ASVs were identified from all groups, whose percentage in each group was 21.3% (523/2457), 21.2% (523/2471), and 30.0% (523/1742), respectively. Moreover, the principal coordinates analysis (PCoA) indicated that the GM of E group differed significantly from that of H group (). Next, we further analyzed the GM composition at the phylum and genus levels (). The result in reveals that Firmicutes, Bacteroidetes, and Actinobacteria were the three most predominant phyla in the H group (0.54 vs. 0.23 vs. 0.17), while Firmicutes, Bacteroidetes, and Proteobacteria were the three prominent phyla in the B group (0.49 vs. 0.35 vs. 0.08) and E group (0.34 vs. 0.39 vs. 0.16), indicating that EOC significantly decreased the relative abundance of Actinobacteria, and observably increased the relative abundance of Proteobacteria (). The genus-level analysis suggested that EOC decreased the relative abundance of the beneficial bacteria Bifidobacterium and Ruminococcaceae_Ruminococcus and increased the relative abundance of Bacteroides and Prevotella in the E group (). Except diversity, linear discriminant analysis Effect Size (LEfSe) analysis was used to identify the most discriminative bacterial taxa among three groups (Histogram of the linear discriminant analysis (LDA) score >3) (). Actinobacteria, Bifidobacterium, Ruminococcaceae_Ruminococcus, and Collinsella were identified to be preferentially more abundant in healthy controls, while a significant enrichment of Proteobacteria, Fusobacteria, Bacteroides, Gardnerella, and Peptostreptococcus was seen in EOC samples. Veillonellaceae, Enterococcaceae, Faecalibacterium, Roseburia, and Halomonas were enriched in feces of patients with EBOT. In addition, analyses stratified according to EOC stages and subtypes were conducted to examine the strata effect, in which stage IIB or greater was defined advanced, and EOC was divided into epithelial serous ovarian cancer and no-serous epithelial ovarian cancer according to pathologic examination. We found that GM distribution correlated with EOC stage and subtype, while GM dysbiosis was more obvious in advanced EOC patients or patients with epithelial serous ovarian cancer. As shown in , the Chao1 index and Shannon index of alpha diversity were more notably reduced in advanced EOC patients (p = 0.007 and p = 0.017), and compared with early EOC patients, the GM in advanced EOC patients was more far away from that in healthy controls. Likewise, changes in GM composition at the phylum and genus levels were more significant in advanced EOC patients, such as increasing the relative abundance of Proteobacteria and reducing the relative abundance of Actinobacteria, Bifidobacterium and Coprococcus. Moreover, GM of patients with serous ovarian cancer similarly was more remarkable in increase of Proteobacteria, and reduction of Chao1 index, Shannon index, and the relative abundance of Actinobacteria, Bifidobacterium, and Ruminococcaceae_Ruminococcus (Figure. S3).
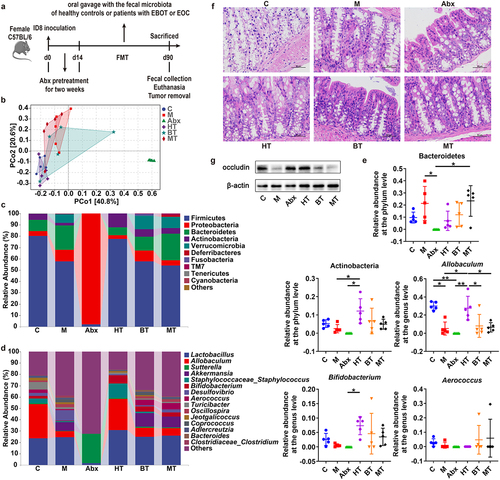
Figure 2. Effects of Abx and FMT on GM and intestinal barrier of the EOC model. (a) After depleting the original GM using mixed broad-spectrum antibiotics (Abx) for 2 weeks, EOC model mice received oral gavage of normal saline (M and Abx group) or fecal microbiota of healthy controls (HT) or patients with EBOT (BT) or patients with EOC (MT) for 11 weeks (three times a week). (b) 16S rRNA sequencing analysis of stool samples at day 90 after treatments of mice described in Fig. 2a (C: controls; M: EOC modeling; Abx: mixed antibiotic feeding after modeling; HT: oral gavage with fecal microbiota of healthy controls after modeling; BT: oral gavage with fecal microbiota of EBOT patients after modeling; MT: oral gavage with fecal microbiota of EOC patients after modeling). PCoA with weighted_Unifrac distance of β diversity index (n = 5). (c) Relative abundance of gut bacterial phylum after treatments with modeling, Abx and FMT versus controls. (d) Microbial composition at the genus level after treatments above six groups. (e) the relative abundance of Bacteroidetes, Actinobacteria, Allobaculum, Bifidobacterium and Aerococcus within each group was analyzed. (f) H&E staining images of intestine tissues were displayed after treatments of mice described in Fig. 2a. (g)Western blot analysis of occludin expression in intestine tissues (n = 3/group). Data are presented in means ± SD. One-way analysis of ANOVA with Tukey’s test for multiple comparisons. *P < 0.05, **P < 0.01.
2.3. Effects of EOC modeling and FMT on the GM and changes of GM caused by FMT affected the intestinal barrier
To investigate the effect of GM on the progression of EOC in the host, C57BL/6 mice were, respectively, transplanted with fecal microbiota from healthy controls or patients with EBOT or EOC through oral gavage after depleting the original GM by broad-spectrum antibiotics (Abx) for 14 days (). 16S rRNA high-throughput sequencing technology was used to assess alterations in mice GM composition after EOC modeling, Abx, and FMT treatment. PCoA analysis showed that GM of EOC modeling mice (M group) differed significantly from that of controls (C group), and GM composition significantly changed after antibiotic treatment (Abx group), while no significant difference was seen between GM of mice in controls (C group) and that of mice treated by fecal microbiota from healthy controls (HT group). Similarly, GM of mock mice (M group) and mice treated with fecal microbiota from patients with EOC (MT group) displayed a close proximity, but remained distant from the C, Abx, and HT groups, indicating that the microbial diversity in M and MT groups was obviously different from that in either C or HT groups. However, no significant differences between GM of mice treated with fecal microbiota from patients with EBOT (BT group) and GM of C, M, HT, and MT groups were observed (). Next, further analyses were performed to explore the alterations of GM composition at the phylum and genus levels and found significant differences among each group (). Our results identified Firmicutes and Bacteroidetes as the most dominant phyla in mice among each group except Abx group whose dominant phylum was Proteobacteria, and the EOC model significantly augmented the relative abundance of Bacteroidetes but abated that of Firmicutes and Actinobacteria. In addition, there was similarly a greater level of the Bacteroidetes population and a lower of Firmicutes and Actinobacteria in mice consumed GM from patients with EOC, but GM from healthy controls could restore the disturbed GM, decreasing Bacteroidetes and increasing Firmicutes and Actinobacteria (). Furthermore, the changing trend of genus level was consistent with that in human study (), and the abundance of Bifidobacterium was significantly greater in mice consumed GM from healthy controls compared with model mice. We also found that the abundance of Allobaculum was significantly decreased in mice after EOC modeling and recovered in mice consumed GM from healthy controls. However, treatment with GM from EOC greatly increased the relative abundances of the Akkermansia, Desulfovibrio, and Aerococcus in MT group (). In addition, we performed H&E staining to intestine of mice after treatments (), as well as the Western blot of the occludin protein () in the colon to determine the extent of intestinal inflammation and barrier damage. Interestingly, the increased number of neutrophil granulocytes and a lower expression of occludin after EOC modeling was observed. Furthermore, treatment with GM from patients with EOC or EBOT greatly increased the number of neutrophil granulocyte, and treatment with GM from healthy controls reduced that compared with EOC modeling mice. We also discovered that treatment with GM from either EOC or EBOT resulted in a lower level of occludin protein and aggravated intestinal barrier damage compared with mock mice, while treatment with GM from healthy controls alleviated this damage.
2.4. The GM affected cancer progression of EOC
As shown in , there was no significant difference in the extent of tumor growth between M group and Abx group. Compared to the M group, both GM from EBOT (BT group) and EOC (MT group) promoted tumor growth (presented with an increase in tumor weight and volume), while GM from healthy controls (HT group) repressed tumor growth (presented with a decrease in tumor weight and volume). However, no significant difference in body weight was seen among each group (). The survival test suggested that all mice in the MT group died on the 100th day, the BT group on the 145th day, and the M group on the 178th day, with survival rates of 14.82% and 33.33% in Abx and HT groups being obtained, respectively, on the 180th day (, P < 0.05). The median survival times were 100, 126, 165.5, 97, and 46 days for M, Abx, HT, BT, and MT groups, respectively. These experiments suggested that GM from EOC patients promoted the progression of EOC.
Figure 3. The GM affected cancer progression of EOC model in vivo. (a) Images of tumor with different treatments of mice described in Fig. 2a on 90 day (M: EOC modeling; Abx: mixed antibiotic feeding after modeling; HT: oral gavage with fecal microbiota of healthy controls after modeling; BT: oral gavage with fecal microbiota of patients with EBOT after modeling; MT: oral gavage with fecal microbiota of patients with EOC after modeling). (b) The tumorous weight in M, Abx, HT, BT and MT group on 90 day (n = 5). (c) Changes in tumor volume over time in M, Abx, HT, BT and MT group (n = 5). (d) Changes in body weight of mice over time in M, Abx, HT, BT and MT group (n = 5). (e) Kaplan-Meier survival curves of C57BL/6 mice EOC models in M, Abx, HT, BT, and MT group (n = 9). (f) H&E and immunohistochemistry (IHC) staining images of tumor tissues were presented. Top panel: H&E staining of tumor; Middle panel: Ki67 expression detected by IHC; Bottom panel: Gli1 expression detected by IHC. g Western blot analysis of Shh, Gli1 and Gli2 protein expression in tumor tissues (n = 3/group). Data are presented as means ± SD. Two-way repeated-measures ANOVA, together with Tukey’s test for multiple comparisons, and Log-rank test were performed for survival data e. *P < 0.05, **P < 0.01.
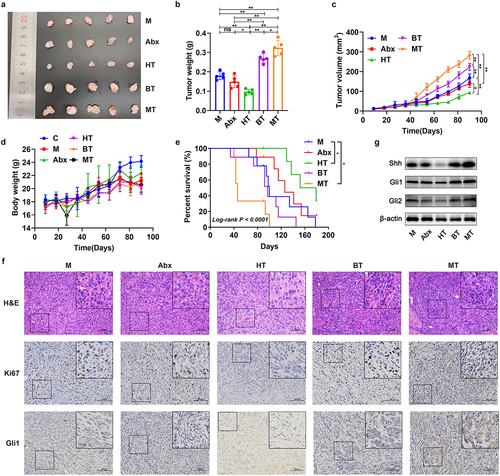
Previous studies in our laboratory have also demonstrated a strong correlation between Hh signaling pathway and rapid tumor progression in EOC. H&E staining and immunohistochemistry technologies were applied to reveal the mechanisms that impacted the EOC progression. At the level of histocyte, H&E staining displayed that tumor cells in MT mice and BT mice were dense and homogeneous, with deeply stained and more pronounced abnormalities in nuclei, especially in the MT mice ( top panel). Cell proliferation was assessed and consistent with their size, and tumors from MT mice had obviously more Ki67-positive EOC cells, which were regarded as active proliferation markers than tumors from M and Abx mice ( middle panel). Furthermore, Gli1 was examined as an indicator of the aberrantly activated Hh signaling pathway that drives EOC growth, and Hh signaling activation from MT mice consumed GM from EOC tended to be more pronounced than those of mock mice, whereas tumors from HT mice consumed GM from healthy controls had thinner positive areas ( Bottom panel). Finally, crucial proteins in Hh signaling were further evaluated by Western blot, and GM from EOC significantly increased the levels of Shh, Gli1, and Gli2 (). These results collectively indicated that GM from EOC promoted the tumor growth and progression by activating Hh signaling pathway.
2.5. GM dysbiosis promote EOC progression by Hh signaling pathway
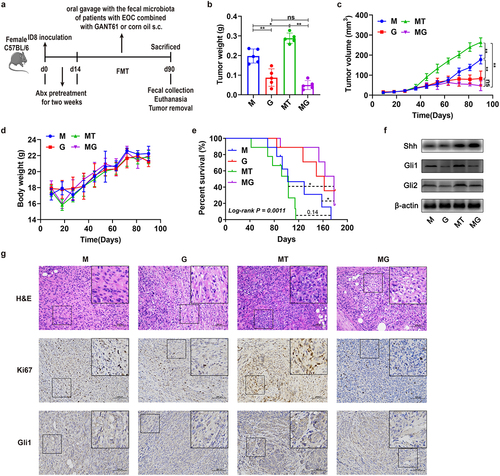
In view of the above results, the role of Hh signaling pathway in EOC progression caused by GM dysbiosis was evaluated, GANT61 was applied to suppress the Hh signaling pathway for 11 weeks, with or without oral gavage of fecal microbiota of patients with EOC (). As mentioned, GM from EOC promoted tumor growth, but no matter whether GM from EOC was received, inhibition of Hh signaling pathway by GANT61 could significantly restrain the tumor progression of EOC. The tumor weight and volume were significantly lower, and the survival was also better after GANT61 administration, but no significant difference in body weight was observed among each group (). The median survival times were 102, 162, 103, and 178 days for M, G, MT, and MG groups, respectively. As the Western blot and IHC results showed that the Hh signaling pathway in EOC tumor was suppressed by GANT61, and after GANT61 subcutaneously injected (s.c.), the expression of Gli1 and Gli2 was significantly reduced, while Shh was not (). The H&E staining images indicated that GANT61 led to sparse tumor cells, and the nucleus abnormalities were becoming rarer in G or MG group ( Top panel). Moreover, GANT61 could inhibit EOC proliferation, and the expression of Ki67 was also reduced after GNAT61 s.c. ( Middle panel). Overall, these results demonstrated that GM dysbiosis promoted EOC progression by Hh signaling pathway.
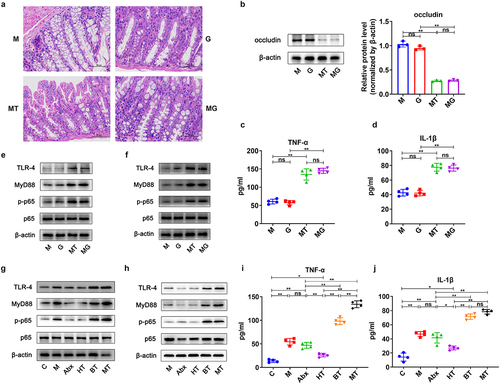
Figure 4. Effects of GANT61 inhibiting Hedgehog signaling on tumor of the EOC model. (a) After depleting the original GM using mixed broad-spectrum antibiotics (Abx) for 2 weeks, EOC model mice received oral gavage of normal saline (M and G groups) or fecal microbiota of patients with EOC (MT and MG groups) for 11 weeks (three times a week) meanwhile corn oil (M and MT groups) or GANT61 peritumoral subcutaneous injection (s.C.) (G and MG groups) were conducted. (b) the weight of tumor in M, G, MT and MG groups on 90 day (n = 5) (M: EOC modeling; G: GANT61 s.C. after modeling; MT: oral gavage with fecal microbiota of patients with EOC meanwhile corn oil s.C. after modeling; MG: oral gavage with fecal microbiota of patients with EOC meanwhile GANT61 s.C. after modeling). (c) Changes in tumor volume over time in M, G, MT and MG groups (n = 5). (d) Changes in body weight of mice over time in M, G, MT and MG groups (n = 5). (e) Kaplan-Meier survival curves of C57BL/6 mice EOC models in M, G, MT and MG groups (n = 9). (f) Western blot analysis of Shh, Gli1 and Gli2 expression in tumor tissues (n = 3/group). (g) H&E and IHC staining images of tumor tissues from each group were presented. Top panel: H&E staining of tumor; Middle panel: Ki67 expression detected by IHC; Bottom panel: Gli1 expression detected by IHC. Data are presented as means ± SD. Two-way repeated-measures ANOVA, together with Tukey’s test for multiple comparisons, and Log-rank test were performed for survival data e. *P < 0.05, **P < 0.01.
Surprisingly, the extent of intestinal inflammation and intestinal barrier damage was uninhibited by GANT61 (). Hence, it is possible that additional factors caused by GM dysbiosis contribute to the change of Hh signaling pathway activation. We further measured serum concentrations of TNF-α and IL−1β, the common pro-inflammatory cytokines, by ELISA kits to determine the extent of systemic inflammation, and found that the concentrations of TNF-α and IL−1β in serum increased markedly after receiving GM from patients with EOC, but not significantly differ in mice with and without GANT61 (); moreover, similar changes in the levels of interleukin 6 (IL−6) mRNA in intestine and tumor tissues were shown in . In addition, evidence showed that engagement in crosstalk with inflammation signaling mediated by TNF-α activated Hh signaling pathway; TNF-α acted as a common pro-inflammation and was closely linked with NF-κB signaling. Western blotting experiments showed that GM from patients with EOC upregulated the levels of TLR4, MyD88, and p-p65 protein in intestine and tumor tissues (). Although the activity of the Hh signaling pathway in EOC tumor tissues could be suppressed by GANT61, there were no obvious change in NF-κB signaling activation neither for intestine nor for tumor tissues (). Finally, crucial proteins in NF-κB signaling among each group in were further studied. Compared with controls (C group), the protein expression of TLR4, MyD88, and p-p65 was significantly increased in EOC modeling mice (M group). Similarly, GM from healthy controls contributed to a significantly decreased expression of TLR4, MyD88, and p-p65, while GM from patients with EBOT or EOC, especially EOC, significantly enhanced expression of these proteins in intestine and tumor tissues (). We simultaneously measured the serum concentrations of TNF-α and IL−1β and found that the mice consumed GM from healthy controls had less TNF-α and IL−1β compared with the mock mice, while GM from EBOT and EOC increased them, and the concentration of TNF-α in mice consumed GM from EOC was higher than that from EBOT (); moreover, similar changes in the levels of IL−6 mRNA were shown in . Altogether, these data indicated that GM from patients with EOC promoted intestinal mucosal barrier damage and inflammation and regulated Hh signaling pathway and EOC progression via NF-κB signaling.
Figure 5. Effects of GANT61 on intestinal barrier damage and NF-κB signaling of EOC model. a H&E staining images of intestine tissues were displayed after treatments of mice in M, G, MT and MG groups. b Western blot analysis of occludin expression in intestine tissues (n = 3/group). The relative expression of proteins occludin were quantified by Image J. c-d Concentrations of TNF-α and IL − 1β in serum from each group described in Fig. 4a at day 90. e Western blot analysis in the expression of TLR − 4, MyD88, p-p65 and p65 in intestine tissues (n = 3). f Western blot analysis in the expression of TLR − 4, MyD88, p-p65 and p65 in tumor tissues (n = 3/group). g-h Western blot analysis of TLR − 4, MyD88, p-p65 and p65 expression in intestine and tumor tissues from each group described in Fig. 2a (n = 3/group). i-j Serum concentrations of TNF-α and IL − 1β from each group described in Fig. 2a at day 90. Data are presented as means ± SD. One-way ANOVA with Tukey’s test for multiple comparisons; ANOVA, analysis of variance. *P < 0.05, **P < 0.01.
2.6. GM dysbiosis promote inflammation and EOC progression by NF-κB signaling pathway
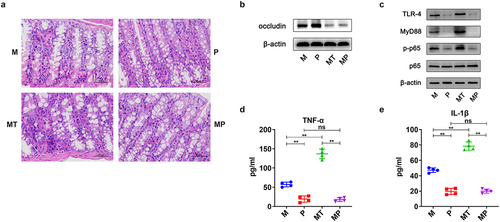
To verify the role of NF-κB signaling pathway in EOC progression caused by GM dysbiosis, we used parthenolide (PTL) to suppress the NF-κB signaling for 11 weeks, with or without oral gavage of fecal microbiota of patients with EOC (). Consistent with the previously described experimental results, GM from patients with EOC promoted cancer progression. Moreover, we discovered that the inhibition of NF-κB signaling pathway by PTL could significantly restrain EOC progression. The tumor weight and volume were significantly lower after PTL treatment (P group and MP group) compared with M or MT group (), but the comparison in body weight among each group showed no significant difference (). Meanwhile, the survival time in mice treated with PTL was similarly longer than that in mock mice and mice consumed GM from EOC, and the median survival times were 109, 158.5, 53, and 158 days for M, P, MT, and MP groups, respectively (). Next, the crucial proteins of NF-κB signaling in tumor tissues were assessed by Western blot, and we found that PTL significantly down-regulated the expression of TLR4, MyD88, and p-p65/p65 (). The H&E staining results revealed tumor cells in P or MP groups were sparse, the cell nucleus was lightly stained, and the nucleus abnormalities were becoming rarer ( Top panel). Moreover, PTL could inhibit EOC proliferation, and mice treated with PTL had significantly less tumor cells that were Ki67 positive than tumors from mock mice ( Middle panel). Furthermore, it was surprising to observe the reduced levels of crucial proteins Shh, Gli1, and Gli2 in the Hh signaling after PTL treatment according to IHC and Western blot (). Although the expression of occludin in intestine could not be increased by PTL (), the extent of inflammation was significantly lower, for example, the number of neutrophil granulocyte was lower in P or MP group (), and the expression of crucial proteins in NF-κB signaling in intestine could also be inhibited by PTL (), and PTL could reverse the overexpression of pro-inflammation cytokines TNF-α, IL−1β, and IL−6 which were manifested in mice consumed GM from EOC (, Fig. S4e-f). Consequently, these data showed that GM dysbiosis promoted EOC progression via activating Hh signaling pathway mediated by NF-κB signaling.
Figure 6. Effects of parthenolide (PTL) inhibiting NF-κB signaling on tumor of the EOC model. (a) After depleting the original GM using mixed broad-spectrum antibiotics (Abx) for 2 weeks, EOC model mice received oral gavage of normal saline (M and P groups) or fecal microbiota of patients with EOC (MT and MP groups) for 11 weeks (three times a week) meanwhile PBS (M and MT groups) or PTL intraperitoneal injection (i.P.) (P and MP groups) were conducted. (b) the weight of tumor in M, P, MT and MP groups on 90 day (n = 5) (M: EOC modeling; P: PTL i.P. after modeling; MT: oral gavage with fecal microbiota of patients with EOC after modeling; MP: oral gavage with fecal microbiota of patients with EOC meanwhile PTL i.P. after modeling). (c) Changes in tumor volume over time in M, P, MT and MP groups (n = 5). (d) Changes in body weight of mice over time in M, P, MT and MP groups (n = 5). (e) Kaplan-Meier survival curves of C57BL/6 mice EOC models in M, P, MT and MP groups (n = 9). (f) Western blot analysis in the expression of TLR − 4, MyD88, p-p65 and p65 in tumor tissues (n = 3/group). (g) H&E and IHC staining images of tumor tissues were displayed. Top panel: H&E staining of tumor; Middle panel: Ki67 expression detected by IHC; Bottom panel: Gli1 expression detected by IHC. (h) Western blot analysis in the expression of Shh, Gli1 and Gli2 protein in tumor tissues (n = 3/group). Data are presented as means ± SD. Two-way repeated-measures ANOVA, together with Tukey’s test for multiple comparisons, and Log-rank test were performed for survival data e. *P < 0.05, **P < 0.01.
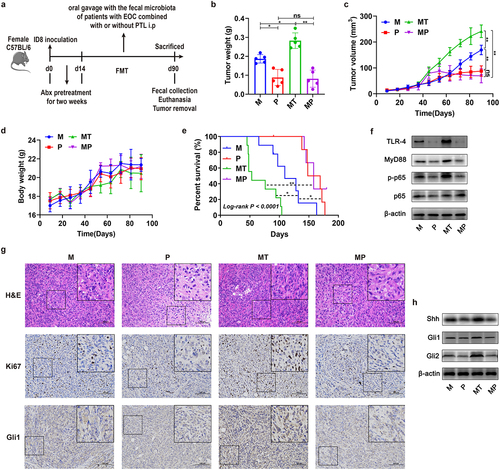
Figure 7. Effects of PTL on intestinal barrier damage of the EOC model. a H&E staining images of intestine tissues were presented after treatments of mice from M, P, MT and MP groups. b Western blot analysis in the expression of occludin in intestine tissues (n = 3/group). c Western blot analysis in the expression of TLR − 4, MyD88, p-p65 and p65 in intestine tissues (n = 3/group). d-e Serum concentrations of TNF-α and IL − 1β from each group described in Fig. 6a at day 90. Data are presented as means ± SD. One-way ANOVA with Tukey’s test for multiple comparisons. *P < 0.05, **P < 0.01.
3. Discussion
EOC is a serious, multifactorial solid tumor in the female reproductive system mainly manifested by nonspecific symptoms, such as ascites, abdominal bump, and bloating, which remains the cancer with the highest mortality rate in gynecological malignancies due to diagnosis at advanced stage and lack of efficient treatment, and seriously endangers health of women of all agesCitation27. Although many hypotheses, such as fallopian tube origin, genetic mutations, and metabolic abnormalitiesCitation28, have been proposed to articulate the tumorigenesis and development of EOC, they could not be fully applicable to clarify the progression of all EOC subtypes. Therefore, it is essential to investigate whether there are other potential factors that influence the EOC pathogenesis and development. This research explored the relationship between EOC and GM and then demonstrated the effects and mechanism of GM on EOC, which may contribute to motivate the advancement of novel therapeutic approaches and the improvement of current treatment dilemma.
The correlation between GM and EOC remained to be still indefinite. In the present study, 16S rRNA high-throughput sequencing was performed to compare the diversity in GM composition among patients with EOC and with EBOT and healthy controls. We confirmed that GM dysbiosis was observed in EOC patients, including reduced diversity, increased opportunistic pathogens, and decreased beneficial bacteria (). The results indicated that α-diversity in GM from EOC patients was significantly reduced compared with healthy women, while no significant differences were shown between the EBOT group and the healthy control group. This observation was comparable to that seen in colon cancerCitation29 and breast cancerCitation30, and Jacobson et al. also indicated that biodiversity was lower in GM of EOC patients with the platinum resistance than that of benign tumors and platinum-sensitive patientsCitation31. In addition, the significant alteration of microbial composition was observed in patients with EOC. Compared to healthy controls, it presented an increase in relative abundance of Bacteroidetes (especially Bacteroides and Prevotella) and Proteobacteria but a decrease in abundance of Firmicutes (especially Ruminococcaceae_Ruminococcus) and Actinobacteria (especially Bifidobacterium). The results were consistent with the research of Zhou et al., which noted a substantially higher proportion of Proteobacteria-to-Firmicutes was greatly increased in OC tissues compared with normal fallopian tube specimensCitation32. Interestingly, similar GM alterations were observed in patients with gastrointestinal cancer, including a depletion of the Bifidobacterium genus and a growth of Bacteroides and Akkermansia generaCitation33. Bifidobacterium genus is a predominant beneficial microbiota to promote nutrient absorption, delay intestinal inflammation, maintain GM homeostasis, and enhance intestinal barrier function. Researchers have reported that the combination of Bifidobacterium and anti-cancer agents worked well in suppressing tumorous growth and preventing or attenuating adverse reactionsCitation34, while upregulating the relative abundance of Bacteroides could induce cancer developmentCitation35. In addition, researchers also revealed that tumors (CRC, cervical cancer, and endometrial cancer) were associated with the high level of Prevotella genus, which disrupt vagina homeostasis and contribute to bacterial vaginosisCitation36,Citation37. We also found that the abundance of Peptostreptococcus was significantly increased in EOC patients, which is an opportunistic pathogen and has been proven by Zhou et al., to promote cervical cancer development via inducing macrophage polarization, which secreted VEGF to benefit the angiogenesisCitation38. Although we observed the significant growth in these pathogenic bacteria (Bacteroides, Prevotella, and Peptostreptococcus) and the reduction in probiotics (Bifidobacterium), the specific mechanism of these bacteria in EOC progression awaits further investigation.
To investigate the effect of GM on the progression of EOC in the host, we transplanted the GM from healthy controls or patients with EBOT or EOC into mice with subcutaneous tumor model. Mice inoculated subcutaneously with ID8 cells showed obvious GM alteration and intestinal barrier damage, including increased relative abundance of harmful bacteria, reduced that of beneficial bacteria and lower expression of occludin protein. Our results also found that GM from patients with EOC further aggravated GM dysbiosis and intestinal barrier injury, while GM from healthy controls improved them (). Consistent with that in human studies, the abundance of Bifidobacterium was significantly enriched in mice that consumed GM from healthy controls compared with mice treated by GM from EBOT or EOC patients. Recent studies have also underlined the correlation between Bifidobacterium and anti-cancer therapy efficacy and adverse effects via generating metabolites and regulating signaling transductionCitation39. In addition, we demonstrated that GM from patients with EOC showed significant tumor-promoting impacts on EOC model mice, while GM from healthy controls delayed tumor growth and prolonged survival time (). This result matched most experimental observations, which showed that GM dysbiosis promotes OC progression by linking it to systemic inflammatory responsesCitation40,Citation41. Chen et al. demonstrated that altering vaginal and gut microbiome could inhibit tumorigenesis of oviductal high-grade serous carcinomaCitation42. Meanwhile, Chambers et al. indicated that GM dysbiosis led to reduce apoptosis, increase DNA damage, and enhance angiogenesis and consequently conferred chemotherapy resistance in EOCCitation43.
Further study was performed due to the effect of GM compositional change on EOC development is not fully understood. Our previous evidence has demonstrated that Hh signaling pathway extraordinarily activated in EOC and played a vital role in carcinogenesis and progression of EOCCitation12. Thus, we tested the activation of Hh signaling in EOC and wondrously found that the GM from patients with EOC not only significantly promoted EOC tumor growth and development but also activated Hh signaling pathway in this study, while GM from healthy controls inhibited them (). In Hh signaling pathway, Patched−1 (Ptch1) protein releases its inhibitory effect on the Smoothened (Smo) after ligand binding, such as Sonic Hedgehog (Shh), thereby triggering downstream signaling transductionCitation44. The Hh signaling pathway exerted multiple patterning and regulatory effects during organogenesis and intestinal homeostasis and was also involved in cell differentiation and proliferation; furthermore, aberrant Hh signaling is implicated in birth defects or cancer initiation and developmentCitation45. To further confirm the role of Hh signaling pathway in EOC progression caused by GM dysbiosis, GANT61 was subsequently used to suppress Hh signaling, and ultimately, we found that it could significantly inhibit aberrant Hh signaling activated by GM dysbiosis, restrain the growth and progression of EOC, and effectively prolong the survival time of mock mice and mice consumed GM from patients with EOC (). However, GANT61 may not be effective in improving the aggregation of inflammatory cells in the colon and the disruption of intestinal barrier function after treatment of GM from EOC (), so it is possible that other factors caused by GM dysbiosis contribute to the activation of Hh signaling pathway, thus leading to EOC progression. Researchers showed that the interactions between inflammation-related signaling pathway and Hh signaling are closely associated with the mechanism of cancer progressionCitation46. Wang et al. noted that pro-inflammation cytokines could promote Gli1 expression via NF-κB, activate Hh signaling pathway, and promote malignant cell migration and invasion as wellCitation47. Thus, we measured the serum concentrations of pro-inflammation cytokines TNF-α and IL−1β by ELISA kits to evaluate the extent of systemic inflammation and found that GM from patients with EOC greatly elevated the expression of TNF-α and IL−1β, which could also not be suppressed by GANT61 (). Vecchiotti et al. confirmed that the activation of NF-κB was positively associated with Sonic Hedgehog pathways (SHh) in advanced prostate cancer, illustrating the critical role of NF-κB – SHh interplay axis in cancerCitation48. Evidence supported that SHh is a transcriptional target of NF-κB (p65), and NF-κB activation by TNF-α or p65 overexpression stimulates Shh promoter activity and p65 binds to Shh promoter, leading to Hh signaling pathway activationCitation49. Based on these, certain key proteins in NF-κB pathway were studied. As expected, those mice treated with GM from patients with EOC did upregulate the key proteins in the pathway of TLR4/MyD88/NF-κB signaling, which also could not be suppressed by GANT61 either in the intestine or tumor (). Moreover, we went back to investigate the expression of TLR4/MyD88/NF-κB pathway in mice of each group in a previous FMT experiment as described in . Similar results were obtained that GM from patients with EOC promoted expression of pro-inflammation cytokines and crucial proteins in this signaling, while GM from healthy controls inhibited them (). So we proposed that GM from patients with EOC promoted EOC development via activating Hh signaling pathway mediated by NF-κB signaling.
The NF-κB signaling pathway seems to exert a major influence on cell growth, proliferation, and invasion, and the NF-κB transcription proteins are crucial regulators for immune responses, inflammation, and tumorigenesis and cancer progressionCitation50. The heterodimeric NF-κB1 (p50)/RelA (p65) complex is a classic structure of NF-κB, which enters the nucleus to enhance target gene transcription after degrading phospho-IκBCitation51. For further confirmation of the effect of NF-κB signaling pathway on Hh signaling pathway activation and EOC progression caused by GM dysbiosis, PTL was subsequently used to suppress NF-κB signaling, and we found that it could significantly inhibit not only NF-κB signaling but also Hh signaling activated by GM dysbiosis, and even restrain EOC progression in mock mice or mice consumed GM from patients with EOC (); furthermore, it could also reduce the accumulation of inflammatory cells in colon and alleviate local and systemic inflammation but will not restore the expression of tight junction protein to the levels observed in mock mice ().
On the whole, a murine EOC ID8 model was established in the present study, and the GM dysbiosis showed impressive effects in promoting EOC progression via activating Hh pathway mediated by NF-κB signaling. Nevertheless, further studies are required to investigate exactly how the GM dysbiosis produces local and systemic inflammation and the detailed mechanism of interaction between NF-κB signaling and Hh signaling. Also, due to the multifactorial characteristics of FMT, EOC progression, Hh signaling, and NF-κB signaling pathway, more researches will be needed to further explore if other factors or pathways mediate EOC progression after GM dysbiosis.
4. Materials and methods
4.1. Subjects enrollment and ethical approval
The clinical trials were conducted between August 2020 and June 2022 in the Second Affiliated Hospital of Nanchang University, China. Totally, 60 women, including 20 EOC patients, 20 patients with EBOT, and 20 healthy controls of Chinese ancestry, aged 18–75, were recruited into the trial. The inclusion criteria included (1) first-time diagnosis of EOC was confirmed by percutaneous needle biopsy, (2) high suspicion of EOC involvement based on preoperative imaging such as computed tomography (CT) and verified by postoperative pathology, (3) no antibiotics, other medications and probiotics were used within 3 months, (4) no serious complications before operation, (5) no radiotherapy or chemotherapy were received. The exclusion criteria included the following: (1) complications with serious cardiopulmonary, hepatic or renal dysfunction, and metabolic diseases; (2) had infectious disease, immunosuppressive diseases, blood diseases, acrosthesia, and other cancers; (3) patients with chronic inflammation, such as inflammatory bowel disease; (4) pregnant women; (5) antibiotics and Traditional Chinese medicine had been taken in the past 3 months. The healthy controls from the physical examination center matched age to EOC group, without family history of cancer. Patients were evaluated by medical history collection, physical examination, blood biochemical test, and color Doppler ultrasonography before enrollment. Collecting the feces of all participants was used for 16S rRNA high-throughput sequencing to outline fecal microbial diversity in a follow-up study.
This trial has been reviewed and approved by the Ethics Committee of the Second Affiliated Hospital of Nanchang University (No. 2020016), and all research procedures were carried out in compliance with the requirements of the committee. All enrollees were fully informed of the process, meaning, and precautions during the implementation of this study prior to recruitment, voluntarily participated in the study and written informed consent was obtained from them. The project has also been registered and approved by the China Clinical Trial Registration Center (ChiCTR2000034627).
4.2. Human fecal sample collection
The stool of all participants (prior to therapy for patients) were collected using culture sterile swabs (0802210702, sterile swab, Jiangsu Kangjian Medical Apparatus Co., Ltd., China), which were placed in 1 mL of 30% glycerin and stored in a refrigerator at −80°C within 1 h of sample collection until DNA extraction. Sterile culture swab and tube with no media were used to collect a few samples, which were the internal not superficial compositions of posterior stool after defecation. All fecal samples were prevented from urine and blood contamination and were processed within 1 year after collection.
4.3. Preparation of fecal microbiota from patients or healthy controls
Donors for fecal microbiota transplantation (FMT) were patients or healthy controls in a clinical study, and fresh feces of human were collected. Fecal suspension was obtained by mixing 200 mg of each sample in triploid sterile saline followed by centrifugation at 300 rpm for 5 min (min), then the supernatant was collected and centrifuged, and finally the precipitate was stored in 30% glycerin at −80°C for follow-up gavage treatments.
4.4. EOC animal model and treatments
ID8 cells were purchased from Shanghai Fuxiang Biotechnology (China), culturing at 37°C in DMEM Medium (Gibco, USA) with 10% fetal bovine serum (Gibco, USA) in 5% CO2 to prepare cell suspension with cell density of 3 × 10Citation7/mL was prepared for tumor inoculation. One hundred and thirty female 6–8 weeks old C57BL/6 mice were purchased from Hunan SJA Laboratory Animal Co., Ltd. (Changsha, Hunan, China) and maintained under standard specific-pathogen-free conditions (humidity 51 ± 13%, temperature 23 ± 3°C, 12 h light/dark cycle) and adaptively fed for 1 week with standard mice maintain diet. The female mice were then subcutaneously inoculated with 3 × 10Citation6 ID8 cells in the dorsal aspect of the right lumbar, which had been shaved and sterilized.
To investigate the effect of GM on EOC progression, 54 female C57BL/6 mice were randomly assigned into six groups and were treated as follows: (1) C group: oral gavage of 100 μL saline twice a week, n = 9; (2) M group: EOC modeling (establishing EOC model) as described above (mice were subcutaneously inoculated with 3 × 10Citation6 ID8 cells in the right lumbar) and oral gavage of 100 μL saline twice a week, n = 9; (3) Abx group: oral administration of a mixture of antibiotics (ampicillin (1 g/L), vancomycin (0.5 g/L), neomycin (1 g/L), metronidazole (1 g/L)) after modeling, n = 9; (4) HT group (transplanted fecal microbiota from healthy controls): oral gavage of 100 μl of the fecal suspension from healthy controls twice a week until the endpoint of the experiment after modeling and depleting the GM via antibiotic cocktail treatment 2 weeks, n = 9; (5) BT group (transplanted fecal microbiota from patients with EBOT): oral gavage of 100 μl of the fecal suspension from patients with EBOT twice a week until the endpoint after modeling and antibiotic cocktail treatment 2 weeks, n = 9; (6) MT group (transplanted fecal microbiota from patients with EOC): oral gavage of 100 μl the fecal suspension from patients with EOC twice a week after modeling and antibiotic cocktail treatment 2 weeks, n = 9. The weight and tumor size of mice were measured with weighing scale or calipers once every other day. After 11 weeks of treatment, 5 mice in each group were euthanized for follow-up experiments, and the remaining mice were kept to observe the survival time. Tumor volume was presented by the formula of length * width * width × 0.5. Recording continuously the survival time of each group, stool and blood samples of mice were collected before euthanization. At the termination of the experiment, tumors were excised and weighed, and then the tumors and colon tissues of mice were collected, fixed in 4% paraformaldehyde for morphology and immunohistochemical analyses, or stored at −80°C for future molecular biology experiments such as western blot.
To determine the role of Hh signaling pathway in EOC progression caused by GM dysbiosis, 36 female C57BL/6 mice were randomly assigned into four groups after modeling and were treated as follows: (1) M group: EOC model; (2) G group: GANT61 (Cat# HY‑13901, MCE, USA) (25 mg/kg) were subcutaneously injected near tumors once every other day after tumors reaching a median size of 100 mm3 for 15 days, n = 9; (3) MT group: 100 μl the fecal suspension from patients with EOC were intragastrically administrated twice a week, n = 9; (4) MG group: 100 μl the fecal suspension from patients with EOC were intragastrically administrated twice a week, meanwhile GANT61 (25 mg/kg) s.c. once every other day, n = 9. Blood, tumor and colon tissue samples were collected and processed as described above; besides, tumor size, body weight, and survival times were similarly recorded.
To confirm the function of NF-κB signaling pathway in EOC progression caused by GM dysbiosis, 36 female C57BL/6 mice were randomly assigned into four groups after modeling and were treated as follows: (1) M group: EOC model; (2) P group: parthenolide (PTL; Cat# HY-N0141, MedChemExpress (MCE), USA) (10 mg/kg) were intraperitoneally injected (i.p.) three times a week, n = 9; (3) MT group: 100 μl the fecal suspension from patients with EOC were intragastrically administrated twice a week, n = 9; (4) MP group: 100 μl the fecal suspension from patients with EOC were intragastrically administrated twice a week, meanwhile PTL (10 mg/kg) i.p. three times a week, n = 9. Blood, tumor and colon tissue samples were collected and processed as described above; besides, tumor size, body weight, and survival times were similarly recorded.
All procedures related to animal experiments were approved by the Experimental Animal Welfare Ethics Committee of Nanchang Leyou Biotechnology Co., Ltd (No. RYE2020091401) and were carried out in compliance with the approved guidelines.
4.5. Hematoxylin-Eosin (H&E) staining
Tumor and colon tissues were collected, fixed in 4% paraformaldehyde, dehydrated, and embedded in paraffin. The tissues were longitudinally and serially cut into 5 μm sections (CM1850, Leica, Germany) followed by staining with hematoxylin and eosin; sections were mounted on slides and examined morphological features of tissues under a light microscope (NIS-Elements 3.2, Nikon Eclipse 80i, Nikon, Japan).
4.6. Immunohistochemistry
Immunohistochemistry of paraffin-embedded formalin-fixed slides of tumor was performed using anti-Gli1 antibody (1:1000, Cat# 66905–1-Ig, Proteintech, USA) or anti-Ki65 antibody (1:1000, GB11499, Servicebio, China). After rinsing with PBS, the sections were incubated with the secondary antibody HRP (1:200, G23303, Servicebio, China) for 50 min. The slides were dehydrated and then sealed, after chromogenic detection by adding 3,3’-Diaminobenzidine. The images were acquired using Olympus I × 71 (Olympus, Japan). The immunohistochemical staining score was graded according to the German semi-quantitative scoring systemCitation52.
4.7. Western blot
The added RIPA lysis buffer (R0010, Solarbio, China) was mixed with a protease inhibitor to tissue, which was centrifuged at 4°C after homogenization on the ice. The supernatant was collected to measure protein concentration by the BCA protein quantitative kit. SDS-polyacrylamide gel electrophoresis separated proteins, which were subsequently transferred to nitrocellulose membranes. They were co-incubated with primary and secondary antibodies after defat milk blockage. The primary antibodies against β-actin (1:1000, Cat# 4970S, Cell Signaling Technology, USA), toll-like receptors 4 (TLR−4) (1:1000, Cat# 14358S, Cell Signaling Technology, USA), MyD88 (1:1000, Cat# 4283S, Cell Signaling Technology, USA), p65 (1:1000, Cat# 8242S, Cell Signaling Technology; USA), phosphorylated-p65 (p-p65) (1:1000, Cat# ab76302, Abcam, USA), Shh (1:500, Cat# S8321, Sigma, USA), Gli1 (1:1000, Cat# 66905–1-Ig, Proteintech, USA), Gli2 (1:1000, Cat# 18989–1-AP, Proteintech, USA), and occludin (1:1000, Cat# 91131S, Cell Signaling Technology, USA) were incubated with the membrane overnight at 4°C. The appropriate secondary antibody (1:10000, Cat# 31460, Thermo, USA) (1:10000, Cat# PA1–28555, Thermo, USA) was incubated with the membrane. Finally, these specific proteins were detected and photographed using a chemiluminescence detection system (Tanon−5200, 20T12NPFLI6–10111) after treating by chemiluminescence solution (Thermo Fisher, 32209). The target band was quantified and analyzed by Image J software (v1.8.0, National Institutes of Health, https://imagej.net/software/fiji/) to calculate the density determination.
4.8. Quantitative real time (RT) – PCR
The total RNA was extracted. Firstly, 50–100 mg of tissue was finely chopped with surgical scissors, and then submerged in 1 ml TRIzol reagent (Cat# 15596026, Invitrogen, USA) in tube and centrifuged at 12,000 rpm for 15 min at 4°C after homogenization and adding 200 μl of chloroform. Then, the uppermost aqueous phase was transferred to a clean tube where 500 μl of isopropanol was added. Finally, the precipitated and dried RNA was re-suspended in nuclease-free water (R1600, Solarbio, China) after centrifuging at 4°C and washing twice with 75% ethanol. The cDNA was synthesized using a commercial reverse transcription kit (RR047A, Takara, Japan). Then, qRT-PCR was performed with TB GreenⓇ Premix Ex TaqTM (Tli RNaseH Plus) Kit (RR420A, Takara, Japan) on the ViiA 7 Real-Time PCR System (Applied Biosystems, USA) to detect the mRNA expressions of IL−6 and glyceraldehyde−3-phosphate dehydrogenase (GAPDH), and the following cycler conditions were used: initial denaturation at 95°C for 30 s (sec), followed by 40 cycles with denaturation at 95°C for 5 sec, annealing at 60°C for 34 sec, followed by dissociation stage (95°C for 15 sec and 60°C for 1 min and 95°C for 15 sec). After normalization to those of GAPDH, the relative amount of target gene transcripts in each cDNA sample was quantified using the 2−ΔΔCT methodCitation53 and each experiment was repeated three times. The primer sequences were as follows:
IL−6: forward primer 5’-TAGTCCTTCCTACCCCAATTTCC−3’, reverse primer 5’-TTGGTCCTTAGCCACTCCTTC−3’;
GAPDH: forward primer 5’-GGTGAAGGTCGGTGTGAACG−3’, reverse primer 5’-CTCGCTCCTGGAAGATGGTG−3’.
4.9. Serum analysis
Following anesthesia, the blood samples were collected and centrifuged at 4°C after solidification to acquire the upper serum, which was stored at −80°C for subsequent serum cytokine measurement. The enzyme-linked immunosorbent assay (ELISA) kits of TNF-α (EK0527, Boster, USA; detection range: 15.6–1000 pg mL−1; protein concentrations used to construct standard curves: 0, 15.6, 31.3, 62.5, 125, 250, 500, and 1000 pg mL−1) and IL−1β (EK0394, Boster, USA; detection range: 12.5–800 pg mL−1; protein concentrations used to construct standard curves: 0, 12.5, 25, 50, 100, 200, 400, and 800 pg mL−1) were used to measure the levels of them in serum for mice, with reference manufacturer’s protocol. The absorbance was measured at 450 nm using a multi-detection microplate reader (SpectraMax M5, Molecular Devices, USA).
4.10. DNA extraction and 16S rRNA gene sequencing
Stool samples were stored at −80°C after collection for DNA extraction, which was implemented using genomic DNA kits (M5636–02, Omega, USA) (D6356–03, Magen, China) under manufacturer’s instructions. DNA concentrations and purity were measured by NanoDrop system (Thermo Fisher Scientific, USA). The V4 region of the 16S ribosomal DNA (rDNA) genes was amplified using barcoded primers (5′-AYTGGGYDTAAAGNG−3′ and 5′-TACNVGGGTATCTAATCC−3′, respectively) and sequenced by Illumina Novaseq platform. All raw reads fastq files are available in the online database of NCBI (GenBank accession number PRJNA900393 and PRJNA900513) (https://www.ncbi.nlm.nih.gov/).
4.11. Data analysis
Paired-end sequencing of DNA fragments was conducted using the Illumina Novaseq platform. The FLASH software (v 1.2.11, http://ccb.jhu.edu/software/FALSJ/) was utilized to map overlapped reads, while low-quality sequences were eliminated using Quantitative Insights into Microbial Ecology (QIIME2) (v 2019.4, http://qiime.org/) and the chimeric ones were checked and removed by the UPARSE package (v 7.1, http://drive5.com/uparse/). The Greengenes reference database (v 13.8, http://greengenes.secondgenome.com/) was used to align and taxonomically classify the sequences. The ASVs produced by clustering methods are defined as real biological significance sequences, which distinguish the difference between sequences in the accuracy of single nucleotides and the relative abundance of each ASV represented by a fraction of the sum of sequences in each sample. The α-diversity, Chao1 (represented richness), and Shannon indices (represented diversity) were calculated and visualized by QIIME2 and R software (v 3.6.3, R Foundation for Statistical Computing). β-diversity was represented by PCoA, based on Bray–Curtis or weighted_unifrac diversity distance matrix, which were calculated and visualized by QIIME2 and R software. A Venn diagram was made to analyze the amplicon sequencing variant using R software. The taxonomic composition distributions at two taxonomic levels of phylum and genus were analyzed and visualized by QIIME2, and results were displayed in the form of histograms. Proteobacteria, Actinobacteria, Bifidobacterium, Ruminococcaceae_Ruminococcus, tumor weight, tumor volume, body weight, and survival analysis were separately analyzed and graphed using GraphPad Prism software 8.3 (GraphPad Software Inc., https://www.graphpad.com/scientific-software/prism/).
Statistical analysis was conducted using GraphPad Prism software 8.3 or SPSS 17.0 (IBM SPSS Inc., https://www.ibm.com/analytics/spss-statistics-software). Continuous variables of normality distributions were expressed as means ± standard deviation (SD), and one-way ANOVA with Tukey’s multiple comparison test was used to compare the differences between groups. In case groups did not pass the normality test, analysis was performed using the Kruskal – Wallis test with Dunn’s multiple comparisons, and were described with the median and interquartile range. Shapiro–Wilk normality test (small sample size) and D’Agostino & Pearson test (larger sample size) were used to evaluate their normality distributions. However, categorical variables were compared using χ2 analysis, and were expressed as percentages. The survival curve analysis was evaluated using the Kaplan – Meier method, and its statistical difference was analyzed using the log-rank (Mantel – Cox) test by GraphPad Prism software 8.3. Statistical significance was set at P < 0.05.
Author contributions
T.C. contributed Conceptualization; X.H. and Q.C. contributed methodology; X.H. contributed software; Q.C. and T.C. contributed validation; T.C. contributed formal analysis; X.X., S.W., H.J., Y.T. and G.C. contributed investigation; Q.C. and J.W. contributed resources; X.H. contributed data curation; T.C., X.H., and X.Z. contributed writing – original draft preparation; T.C., Q.C., X.H., and X.X. contributed writing – review and editing; X.H. and X.X. contributed visualization; T.C. and Q.C. contributed supervision; T.C. contributed project administration; Q.C. contributed funding acquisition. All authors have read and agreed to the published version of the manuscript.
Institutional review board statement
The study was conducted in accordance with the Declaration of Helsinki and approved by the Institutional Review Board (or Ethics Committee) on medical research of the Second Affiliated Hospital of Nanchang University (Examination and approval No. is Review [2020] No. (016)).
Supplemental Material
Download Zip (7.5 MB)Acknowledgments
This research was supported by grants from National Natural Science Foundation of China (Grant no. 82260507 to Q.C., 82060638 to T.C.), and Jiangxi Provincial Department of Science and Technology (20202ACB206008 to Q.C., Double Thousand Talents Program to T.C.). Thanks for all the reviewers and editor for the support of publication of our manuscript.
Disclosure statement
No potential conflict of interest was reported by the authors.
Data availability statement
The data used to support the findings of this study are available from the corresponding author upon request, and the raw data of 16S rRNA sequencing generated in this study has been deposited under NCBI SRA BioProject numbers PRJNA900393 (https://www.ncbi.nlm.nih.gov/bioproject/PRJNA900393) and PRJNA900513 (https://www.ncbi.nlm.nih.gov/bioproject/PRJNA900513).
Supplementary material
Supplemental data for this article can be accessed online at https://doi.org/10.1080/19490976.2023.2221093
Additional information
Funding
References
- Siegel RL, Miller KD, Fuchs HE, Jemal A. Cancer statistics, 2022. CA Cancer J Clin. 2022;72(1):7–21. doi:10.3322/caac.21708.
- Labidi-Galy SI, Papp E, Hallberg D, Niknafs N, Adleff V, Noe M, Bhattacharya R, Novak M, Jones S, Phallen J, et al. High grade serous ovarian carcinomas originate in the fallopian tube. Nat Commun. 2017;8(1):1093. doi:10.1038/s41467-017-00962-1.
- Sung H, Ferlay J, Siegel RL, Laversanne M, Soerjomataram I, Jemal A, Bray F. Global cancer statistics 2020: gLOBOCAN estimates of incidence and mortality worldwide for 36 cancers in 185 countries. A Cancer J Clin. 2021;71(3):209–249. doi:10.3322/caac.21660.
- Lheureux S, Gourley C, Vergote I, Oza AM. Epithelial ovarian cancer. Lancet. 2019;393(10177):1240–1253. doi:10.1016/s0140-6736(18)32552-2.
- Lapke N, Chen CH, Chang TC, Chao A, Lu YJ, Lai CH, Tan KT, Chen HC, Lu HY, Chen SJ. Genetic alterations and their therapeutic implications in epithelial ovarian cancer. Bmc Cancer. 2021;21(1):499. doi:10.1186/s12885-021-08233-5.
- Savant SS, Sriramkumar S, O’Hagan HM. The role of inflammation and inflammatory mediators in the development, progression, metastasis, and chemoresistance of epithelial ovarian cancer. Cancers (Basel). 2018;10(8):251. doi:10.3390/cancers10080251.
- Sneha S, Nagare RP, Sidhanth C, Krishnapriya S, Garg M, Ramachandran B, Murhekar K, Sundersingh S, Ganesan TS. The hedgehog pathway regulates cancer stem cells in serous adenocarcinoma of the ovary. Cell Oncol (Dordr). 2020;43(4):601–616. doi:10.1007/s13402-020-00504-w.
- Walton KD, Gumucio DL. Hedgehog signaling in intestinal development and homeostasis. Annu Rev Physiol. 2021;83(1):359–380. doi:10.1146/annurev-physiol-031620-094324.
- Pan Y, Zhou J, Zhang W, Yan L, Lu M, Dai Y, Zhou H, Zhang S, Yang J. The sonic hedgehog signaling pathway regulates autophagy and migration in ovarian cancer. Cancer Med. 2021;10(13):4510–4521. doi:10.1002/cam4.4018.
- Chen Q, Xu R, Zeng C, Lu Q, Huang D, Shi C, Zhang W, Deng L, Yan R, Rao H, et al. Down-regulation of Gli transcription factor leads to the inhibition of migration and invasion of ovarian cancer cells via integrin beta4-mediated FAK signaling. PLos One. 2014;9(2):e88386. doi:10.1371/journal.pone.0088386.
- Zeng C, Chen T, Zhang Y, Chen Q. Hedgehog signaling pathway regulates ovarian cancer invasion and migration via adhesion molecule CD24. J Cancer. 2017;8(5):786–792. doi:10.7150/jca.17712.
- Zhang H, Wang Y, Chen T, Zhang Y, Xu R, Wang W, Cheng M, Chen Q. Aberrant activation of hedgehog signalling promotes cell migration and invasion via matrix metalloproteinase-7 in ovarian cancer cells. J Cancer. 2019;10(4):990–1003. doi:10.7150/jca.26478.
- Zhang J, Fan J, Zeng X, Nie M, Luan J, Wang Y, Ju D, Yin K. Hedgehog signaling in gastrointestinal carcinogenesis and the gastrointestinal tumor microenvironment. Acta Pharm Sin B. 2021;11(3):609–620. doi:10.1016/j.apsb.2020.10.022.
- Ferreira Mendes JM, de Faro Valverde L, Torres Andion Vidal M, Paredes BD, Coelho P, Allahdadi KJ, Coletta RD, Souza BSF, Rocha CAG. Effects of IGF-1 on proliferation, angiogenesis, tumor stem cell populations and activation of AKT and hedgehog pathways in oral squamous cell carcinoma. Int J Mol Sci. 2020;21(18):6487. doi:10.3390/ijms21186487.
- Wang F, Dan Z, Luo H, Huang J, Cui Y, Ding H, Xu J, Lin Z, Gao Y, Zhai X, et al. ALCAM regulates multiple myeloma chemoresistant side population. Cell Death Disease. 2022;13(2):136. doi:10.1038/s41419-022-04556-8.
- de Vos WM, Tilg H, Van Hul M, Cani PD. Gut microbiome and health: mechanistic insights. Gut. 2022;71(5):1020–1032. doi:10.1136/gutjnl-2021-326789.
- Zhou X, Lu J, Wei K, Wei J, Tian P, Yue M, Wang Y, Hong D, Li F, Wang B, et al. Neuroprotective effect of ceftriaxone on MPTP-induced parkinson’s disease mouse model by regulating inflammation and intestinal microbiota. Oxid Med Cell Longev. 2021;2021(1):1–15. doi:10.1155/2021/9424582.
- He BL, Xiong Y, Hu TG, Zong MH, Wu H. Bifidobacterium spp. as functional foods: a review of current status, challenges, and strategies. Crit Rev Food Sci Nutr. 2022;1–18. doi:10.1080/10408398.2022.2054934.
- Costa CPD, Vieira P, Mendes-Rocha M, Pereira-Marques J, Ferreira RM, Figueiredo C. The tissue-associated microbiota in colorectal cancer: a systematic review. Cancers (Basel). 2022;14(14):3385. doi:10.3390/cancers14143385.
- Chung L, Thiele Orberg E, Geis AL, Chan JL, Fu K, DeStefano Shields CE, Dejea CM, Fathi P, Chen J, Finard BB, et al. Bacteroides fragilis toxin coordinates a pro-carcinogenic inflammatory cascade via targeting of colonic epithelial cells. Cell Host & Microbe. 2018;23(2):203–214 e205. doi:10.1016/j.chom.2018.01.007.
- Clay SL, Fonseca-Pereira D, Garrett WS. Colorectal cancer: the facts in the case of the microbiota. J Clin Invest. 2022;132(4):e155101. doi:10.1172/JCI155101.
- Zheng Y, Fang Z, Xue Y, Zhang J, Zhu J, Gao R, Yao S, Ye Y, Wang S, Lin C, et al. Specific gut microbiome signature predicts the early-stage lung cancer. Gut Microbes. 2020;11(4):1030–1042. doi:10.1080/19490976.2020.1737487.
- Teng NMY, Price CA, McKee AM, Hall LJ, Robinson SD. Exploring the impact of gut microbiota and diet on breast cancer risk and progression. Int J Cancer. 2021;149(3):494–504. doi:10.1002/ijc.33496.
- Hong J, Guo F, Lu SY, Shen C, Ma D, Zhang X, Xie Y, Yan T, Yu T, Sun T, et al. F. nucleatum targets lncRNA ENO1-IT1 to promote glycolysis and oncogenesis in colorectal cancer. Gut. 2021;70(11):2123–2137. doi:10.1136/gutjnl-2020-322780.
- Wong SH, Yu J. Gut microbiota in colorectal cancer: mechanisms of action and clinical applications. Nat Rev Gastroenterol Hepatol. 2019;16(11):690–704. doi:10.1038/s41575-019-0209-8.
- Berek JS, Renz M, Kehoe S, Kumar L, Friedlander M. Cancer of the ovary, fallopian tube, and peritoneum: 2021 update. Int J Gynaecol Obstet. 2021;1(Suppl 1):61–85. doi:10.1002/ijgo.13878. 55 Suppl 1.
- Eisenhauer EA. Real-world evidence in the treatment of ovarian cancer. Ann Oncol. 2017;28(suppl_8):viii61–viii65. doi:10.1093/annonc/mdx443.
- Craig ER, Londoño AI, Norian LA, Arend RC. Metabolic risk factors and mechanisms of disease in epithelial ovarian cancer: a review. Gynecol Oncol. 2016;143(3):674–683. doi:10.1016/j.ygyno.2016.10.005.
- He T, Cheng X, Xing C. The gut microbial diversity of colon cancer patients and the clinical significance. Bioengineered. 2021;12(1):7046–7060. doi:10.1080/21655979.2021.1972077.
- Yu W, Xie Z, Chen K, Cai Z, Li J, Ma M, Su Z, Che Y, Wang P, Wu Y, et al. Variations in the gut microbiota in breast cancer occurrence and bone metastasis. Front Microbiol. 2022;13:894283. doi:10.3389/fmicb.2022.894283.
- Jacobson D, Moore K, Gunderson C, Rowland M, Austin R, Honap TP, Xu J, Warinner C, Sankaranarayanan K, Lewis Jr CM Jr. Shifts in gut and vaginal microbiomes are associated with cancer recurrence time in women with ovarian cancer. PeerJ. 2021;9:e11574. doi:10.7717/peerj.11574.
- Zhou B, Sun C, Huang J, Xia M, Guo E, Li N, Lu H, Shan W, Wu Y, Li Y, et al. The biodiversity composition of microbiome in ovarian carcinoma patients. Sci Rep. 2019;9(1):1691. doi:10.1038/s41598-018-38031-2.
- Li N, Bai C, Zhao L, Sun Z, Ge Y, Li X. The relationship between gut microbiome features and chemotherapy response in gastrointestinal cancer. Front Oncol. 2021;11:781697. doi:10.3389/fonc.2021.781697.
- Lee SH, Cho SY, Yoon Y, Park C, Sohn J, Jeong JJ, Jeon BN, Jang M, An C, Lee S, et al. Bifidobacterium bifidum strains synergize with immune checkpoint inhibitors to reduce tumour burden in mice. Nat Microbiol. 2021;6(3):277–288. doi:10.1038/s41564-020-00831-6.
- Kordahi MC, Stanaway IB, Avril M, Chac D, Blanc MP, Ross B, Diener C, Jain S, McCleary P, Parker A, et al. Genomic and functional characterization of a mucosal symbiont involved in early-stage colorectal cancer. Cell Host & Microbe. 2021;29(10):1589–1598 e1586. doi:10.1016/j.chom.2021.08.013.
- Han JX, Tao ZH, Qian Y, Yu CY, Li J, Kang ZR, Lu S, Xie Y, Hong J, Chen H, et al. ZFP90 drives the initiation of colitis-associated colorectal cancer via a microbiota-dependent strategy. Gut Microbes. 2021;13(1):1–20. doi:10.1080/19490976.2021.1917269.
- Li C, Gu Y, He Q, Huang J, Song Y, Wan X, Li Y. Integrated analysis of microbiome and transcriptome data reveals the interplay between commensal bacteria and fibrin degradation in endometrial cancer. Front Cell Infect Microbiol. 2021;11:748558. doi:10.3389/fcimb.2021.748558.
- Zhou G, Zhou F, Gu Y, Zhang M, Zhang G, Shen F, Hua K, Ding J. Vaginal microbial environment skews macrophage polarization and contributes to cervical cancer development. J Immunol Res. 2022;2022:3525735. doi:10.1155/2022/3525735.
- Mager LF, Burkhard R, Pett N, Cooke NCA, Brown K, Ramay H, Paik S, Stagg J, Groves RA, Gallo M, et al. Microbiome-derived inosine modulates response to checkpoint inhibitor immunotherapy. Science. 2020;369(6510):1481–1489. doi:10.1126/science.abc3421.
- Mahoney DE, Chalise P, Rahman F, Pierce JD. Influences of gastrointestinal microbiota dysbiosis on serum proinflammatory markers in epithelial ovarian cancer development and progression. Cancers (Basel). 2022;14(12):3022. doi:10.3390/cancers14123022.
- Xu S, Liu Z, Lv M, Chen Y, Liu Y. Intestinal dysbiosis promotes epithelial-mesenchymal transition by activating tumor-associated macrophages in ovarian cancer. Pathog Dis. 2019;77(2):ftz019. doi:10.1093/femspd/ftz019.
- Chen L, Zhai Y, Wang Y, Fearon ER, Nunez G, Inohara N, Cho KR. Altering the microbiome inhibits tumorigenesis in a mouse model of oviductal high-grade serous carcinoma. Cancer Res. 2021;81(12):3309–3318. doi:10.1158/0008-5472.CAN-21-0106.
- Chambers LM, Rhoades EL, Bharti R, Braley C, Tewari S, Trestan L, Alali Z, Bayik D, Lathia JD, Sangwan N, et al. Disruption of the gut microbiota confers cisplatin resistance in epithelial ovarian cancer. Cancer Res. 2022;CAN-22–0455. doi:10.1158/0008-5472.CAN-22-0455/3213123/can-22-0455.pdf.
- Qi X, Li X. Mechanistic insights into the generation and transduction of hedgehog signaling. Trends Biochem Sci. 2020;45(5):397–410. doi:10.1016/j.tibs.2020.01.006.
- Kong JH, Young CB, Pusapati GV, Hernán Espinoza F, Patel CB, Beckert F, Ho S, Patel BB, Gabriel GC, Aravind L, et al. Gene-teratogen interactions influence the penetrance of birth defects by altering Hedgehog signaling strength. Development. 2021;148(19):dev199867. doi:10.1242/dev.199867.
- Jiang J. Hedgehog signaling mechanism and role in cancer. Semin Cancer Biol. 2022;85:107–122. doi:10.1016/j.semcancer.2021.04.003.
- Wang Y, Jin G, Li Q, Wang Z, Hu W, Li P, Li S, Wu H, Kong X, Gao J, et al. Hedgehog signaling non-canonical activated by pro-inflammatory cytokines in pancreatic ductal adenocarcinoma. J Cancer. 2016;7(14):2067–2076. doi:10.7150/jca.15786.
- Vecchiotti D, Verzella D, Di Vito Nolfi M, D’Andrea D, Flati I, Di Francesco B, Cornice J, Alesse E, Capece D, Zazzeroni F. Elevated NF-kappaB/shh/gli1 signature denotes a worse prognosis and represent a novel potential therapeutic target in advanced prostate cancer. Cells. 2022;11(13):2118. doi:10.3390/cells11132118.
- Kasperczyk H, Baumann B, Debatin KM, Fulda S. Characterization of sonic hedgehog as a novel NF-kappaB target gene that promotes NF-kappaB-mediated apoptosis resistance and tumor growth in vivo. Faseb J. 2009;23(1):21–33. doi:10.1096/fj.08-111096.
- Zhao H, Wu L, Yan G, Chen Y, Zhou M, Wu Y, Li Y. Inflammation and tumor progression: signaling pathways and targeted intervention. Signal Transduct Target Ther. 2021;6(1):263. doi:10.1038/s41392-021-00658-5.
- De Simone V, Franze E, Ronchetti G, Colantoni A, Fantini MC, Di Fusco D, Sica GS, Sileri P, MacDonald TT, Pallone F, et al. Th17-type cytokines, IL-6 and TNF-alpha synergistically activate STAT3 and NF-Kb to promote colorectal cancer cell growth. Oncogene. 2015;34(27):3493–3503. doi:10.1038/onc.2014.286.
- Bencze J, Szarka M, Koti B, Seo W, Hortobagyi TG, Bencs V, Modis LV, Hortobagyi T. Comparison of semi-quantitative scoring and artificial intelligence aided digital image analysis of chromogenic immunohistochemistry. Biomolecules. 2021;12(1). doi:10.3390/biom12010019.
- Livak KJ, Schmittgen TD. Analysis of relative gene expression data using real-time quantitative PCR and the 2(-Delta Delta C(T)) Method. Methods. 2001;25(4):402–408. doi:10.1006/meth.2001.1262.