
ABSTRACT
Both growth hormone (GH) and gut microbiota play significant roles in diverse physiological processes, but the crosstalk between them is poorly understood. Despite the regulation of GH by gut microbiota, study on GH’s influence on gut microbiota is limited, especially on the impacts of tissue specific GH signaling and their feedback effects on the host. In this study, we profiled gut microbiota and metabolome in tissue-specific GHR knockout mice in the liver (LKO) and adipose tissue (AKO). We found that GHR disruption in the liver rather than adipose tissue affected gut microbiota. It changed the abundance of Bacteroidota and Firmicutes at phylum level as well as abundance of several genera, such as Lactobacillus, Muribaculaceae, and Parasutterella, without affecting α-diversity. Moreover, the impaired liver bile acid (BA) profile in LKO mice was strongly associated with the change of gut microbiota. The BA pools and 12-OH BAs/non-12-OH BAs ratio were increased in the LKO mice, which was due to the induction of CYP8B1 by hepatic Ghr knockout. Consequently, the impaired BA pool in cecal content interacted with gut bacteria, which in turn increased the production of bacteria derived acetic acid, propionic acid, and phenylacetic acid that were possible to participate in the impaired metabolic phenotype of the LKO mice. Collectively, our findings suggested that the liver GH signaling regulates BA metabolism by its direct regulation on CYP8B1, which is an important factor influencing gut microbiota. Our study is significant in exploring gut microbiota modification effects of tissue-specific GH signaling as well as its involvement in gut microbiota–host interaction.
Introduction
The homeostatic relationship between host and gut microbiota is of significant importance for the host’s health, and the dysbiosis of gut microbiota is associated with many metabolic diseases, such as nonalcoholic fatty liver disease (NAFLD) and obesity.Citation1 Previous studies have highlighted the roles of the liver-, muscle- and adipose tissue-gut microbiota axes in host metabolism.Citation2–4 Notably, all of these tissues are targets of growth hormone (GH), which prompted us to explore whether there is a crosstalk between GH signaling and gut microbiota and the mediators involved in their interaction.
GH has profound effects on regulating growth, metabolism, immunity, homeostatic processes, and aging.Citation5–8 It functions by directly binding to its membrane receptor (GHR) that activates several signaling cascades and exerts the pleiotropic effects synergistically with or independent of insulin-like growth factor 1 (IGF1).Citation7 The impaired GH signaling is considered to cause many metabolic diseases. It has been identified that people with lower serum GH has higher prevalence of NAFLD and obesity,Citation9,Citation10 and Laron syndrome patients caused by GHR mutation also develop NAFLD.Citation11 Although the association of GH signaling with metabolic diseases has been proposed previously, GH’s functional roles especially that involved in the host–gut microbiota interaction are still undefined. In spite of the GH/IGF1 regulation by gut microbiota in many animal models including mice, chicken, lamb, and Drosophila,Citation12–18 the effects of GH signaling on gut microbiota were less studied. Emerging evidences has implied that fluctuation of GH level can influence the gut microbiota. Jensen et al. demonstrated that global GH excess and deficiency affected the gut microbiota in mature adult and middle-aged mice.Citation19,Citation20 Moreover, the gut microbiota in patients with GH-secreting pituitary adenoma is significantly altered and strongly associated with GH/IGF-1 axis.Citation21 Therefore, exploring the roles of GH signaling in gut microbiota regulation can provide a better understanding of the pathophysiological process of diseases related to impaired GH axis. However, the mechanism by which GH signaling influences gut microbiota is still unclear.
Bile acids produced in the liver can affect gut microbial growth in both direct and indirect ways,Citation22,Citation23 thus mediating the interaction between the host and gut microbiota. Bile acids are synthesized via cytochrome P450 (CYP) enzyme-mediated oxidation of cholesterol. CYP7A1 and CYP8B1 are key enzymes in bile acid synthesis with the former as the rate-limiting enzyme and the latter as a crucial regulator that determines the ratio of 12-OH bile acids to non-12-OH bile acids.Citation24 Accumulating studies have reported that the increased 12-OH bile acid ratio or upregulation of CYP8B1 leads to human diseases, such as NAFLD, obesity, and inflammatory bowel disease (IBD),Citation25–27 which makes CYP8B1 a viable therapeutic target for metabolic diseases. GH signaling has been regarded to regulate the cholesterol and lipid metabolism. However, its role in bile acid metabolism is not clear. Therefore, investigating the mechanisms of bile acid metabolism regulation by GH signaling and its subsequent effects on gut microbiota may extend our understanding of pathophysiological roles of GH signaling and facilitate the exploration of therapeutic targets for metabolic diseases.
The liver and adipose tissue are import target of GH, but the GH effects mediated by GHR are tissue specific. For example, Ghr disruption in the adipose tissue resulted in fat mass increase, while it was resistant to high fat induced hepatic steatosis.Citation28 However, the hepatic Ghr disruption led to the spontaneous fatty liver under regular chow.Citation29,Citation30 The tissue-specific Ghr knockout mice have become useful tools to better understand the direct actions of GH in individual tissue.Citation31 However, the effect of tissue-specific GH signaling on gut microbiota is unknown. In this study, by employing the GHR knockout mice specifically in the adipose tissue and liver, we demonstrated the effects of tissue-specific GH signaling on gut microbiota and the role of liver GHR in regulating bile acid metabolism. Our data uncovered the mechanism of liver GHR in modulating gut microbiota by bile acid metabolism regulation as well as the potential feedback of the altered gut microbiota.
Results
Absence of liver Ghr affects the gut microbiota
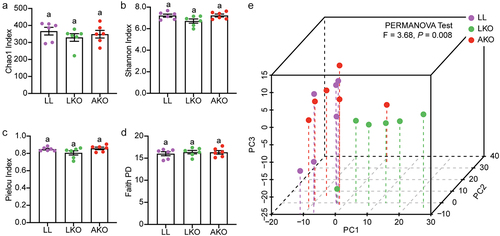
To determine the effects of tissue-specific GH signaling on gut microbiota, the diversities of gut bacterial community from GHRflox/flox (LL), AKO and LKO mice were compared. Neither the adipose tissue nor the liver Ghr knockout affected the α-diversity, including Chao1, Shannon, Pielou, and Faith PD indices, compared with the LL group (). For the β-diversity based on ASVs abundance, the samples in the LKO group were clustered together, while those in the LL and AKO groups formed the other cluster in the PCA plot (). PERMANOVA test result indicated that the bacterial community structure in LKO was significantly different from both the LL and AKO groups, but the difference between LL and AKO groups was minor and not significant, which was indicated by the lowest F value with a P value of 0.431 (Table S1).
Figure 1. Analysis of the α-diversity (a-d) and beta-diversity (e) of gut bacterial community. Lowercase letters above the error bars indicate significant differences among groups.
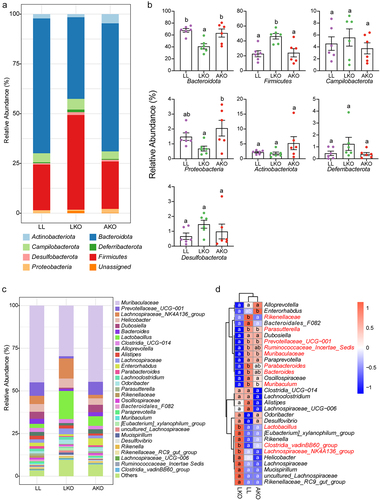
The taxonomic composition variation in bacterial community was analyzed at the phylum and genus levels. Seven phyla were detected in the cecum, and all the bacterial communities were dominated by Bacteroidota and Firmicutes, followed by Campilobacterota, Actinobacteriota, and Proteobacteria (). There was no significant difference in the abundances of all the detected phyla between the LL and AKO groups (). However, the abundance of Bacteroidota was significantly decreased, and that of Firmicutes was significantly increased in the LKO group. In addition, the abundance of Proteobacteria was significantly lower in the LKO group than in the AKO group. The composition and proportion of the top 30 most abundant genera was shown in , and Muribaculaceae was the most abundant in all the groups. The genus composition in LL and AKO groups was similar, since they were in the same branch based on the cluster analysis in the heatmap (). In addition, compared with the LL group, the abundances of several genera were significantly altered in the LKO group. Lactobacillus, Clostridia vadinBB6 group and Lachnospiraceae NK4A136 group were significantly enriched, while the abundances of Rikenellaceae, Parasutterella, Prevotellaceae UCG-001, Ruminococcaceae, Muribaculaceae, Parabacteroides, Bacteroides and Muribaculum were significantly decreased in the LKO group. Similar with that at the phylum level, there was also no significant difference in these genera except for Rikenellaceae between the LL and AKO groups.
Figure 2. Taxonomic composition of gut bacterial community in LL, LKO, and AKO mice. (a) Composition of the bacterial community in different mouse groups at the phylum level. (b) Comparison of the relative abundance of these phyla among different mouse groups. (c) Composition of the top 30 most abundant genera in different mouse groups. (d) Heatmap illustrating the variations in top 30 genera among different mouse groups. The significantly altered genus were shown in red in the heatmap. Different lowercase letters above the error bars and in the heatmap indicate significant differences among groups.
Variation of gut microbiota is correlated with the impaired metabolism in hepatic GHR deletion mice
Deletion of GHR in the liver and adipose tissue both affected the metabolism. The LKO mice were characterized by heavier liver, and AKO mice were characterized by heavier brown and white adipose tissue, although there was no difference among their body weight (Figure S1A-C). Moreover, the level of serum TG, TCHO, LDLC, and HDLC as well as liver TG was significantly increased in the LKO mice, while there was no difference between the LL and AKO mice (Figure S1D-E). The H&E staining of WAT and liver was consistent with the above results, which showed that the AKO mice had expanded adipocytes and the LKO mice had significant increase in hepatic steatosis (Figure S1H-I). In addition, the glucose homeostasis was also changed by tissue-specific Ghr knockout. Compared with the LL mice, the insulin tolerance test (ITT) was significantly impaired in the LKO mice, while improved in the AKO mice (Figure S1F-G). The correlation between the metabolic phenotype and gut microbiota was analyzed. In the LKO mice, many genera, such as Muribaculum, Parabacteroides, and Parasutterella were significantly negatively correlated with most of the metabolic indices, especially with those related to lipid metabolism. Lactobacillus was positively correlated with the BAT weight, ITT, and the lipid metabolism related indices (Figure S1J). Moreover, all of these bacteria were significantly altered in the LKO mice. In the AKO mice, only a few genera were correlated with a small number of metabolic indices (Figure S2), but their abundance was not significantly different from that in the LL mice. Therefore, the results suggested that the change of gut microbiota in the LKO mice was correlated with its impaired metabolic phenotype.
Hepatic bile acid profile is associated with gut microbiota shifts
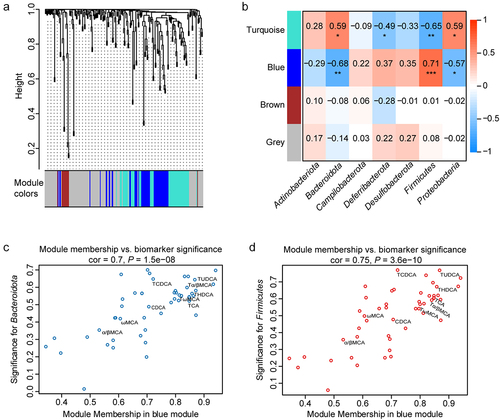
GH plays an important role in regulating the metabolism in adipose tissue and liver. Therefore, targeted metabolomics assay for adipose tissue and liver of all the mouse groups were performed to investigate the mechanisms involved in gut bacterial community shifts mediated by tissue-specific Ghr knockout. A total of 214 and 196 metabolites were detected in the liver and adipose tissue, respectively (Table S2 and Table S3). WGCNA was performed to identify metabolic modules clustering and explore the correlation of bacterial phyla and metabolites. For the liver metabolic profile, there were four modules obtained using the clustering algorithm (), and 54.1% of the metabolites were included in the color modules, while the others that did not displayed the obvious co-expression trend were included in the gray module. The associations between the modules and bacterial phyla indicated that the blue module had the most significant and strongest correlation with the phyla of Bacteroidota and Firmicutes (). In-module analysis () also showed highly significant correlation between the module membership and biomarker significance of Bacteroidota and Firmicutes. In addition, 47.3% (9/19) of the total bile acids were clustered in the blue module, and most of them had high correlation with the changes of Bacteroidota and Firmicutes, which were indicated by their distribution in the top right quarter of the module membership vs. biomarker significance plots (). There were also four modules obtained by WGCNA from the metabolites in adipose tissue, and the brown module had the significant correlation with Bacteroidota and Firmicutes (Figure S3A-B). However, the correlations between the module membership and gene significance were not significant. Even so, most of the bile acids showed relatively high correlation with the changes of Bacteroidota and Firmicutes (Figure S3C-D). These results suggested that the hepatic bile acids were associated with the variation of gut bacterial community.
Figure 3. Correlation analysis of gut bacterial phyla and liver metabolites by WGCNA. (a) Metabolite modules obtained based on the 214 metabolites in the liver in LL, LKO, and AKO mice. (b) Heatmap presenting module–trait relationships based on the Pearson method. Each row corresponds to a module eigengene (ME) and each column to the abundance of a bacterial phylum. The corresponding correlation coefficient is displayed at the top of the cell, and corresponding P value for each module is displayed by the star. *: P < 0.05, **: P < 0.01, ***: P < 0.001. (c-d) The relationship between module membership (MM) in blue module and biomarker significance (BS) of Bacteroidota (c) and Firmicutes (d). The MM of a node represents the correlation between the node profile and the ME, and the BS of a node represents the correlation between the node profile and a given trait. The greater absolute value of the MM indicates the node is more highly representative of the module, and the greater absolute value of the BS represents the node is more biologically significant.
Bile acid metabolism is disturbed by hepatic Ghr absence
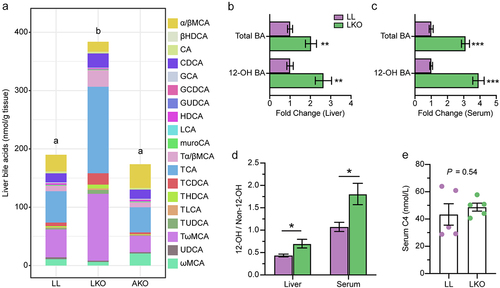
Bile acid is synthesized by hepatocyte, hence we further analyzed the bile acid profile in the liver of the three mouse groups based on the targeted quantitative metabolomics data. Nineteen bile acids were detected in the liver, and the total bile acid content was significantly higher in the LKO group than in the LL and AKO group (). PCA plot and PERMANOVA test indicated that there was no significant difference in the bile acid profile between LL and AKO groups, whereas the bile acid profile in the LKO group was significantly different from the other two groups (Figure S4A-B). Consistent with the PCA analysis, the heatmap showed that many conjugated bile acids were significantly enriched in the LKO group rather than the AKO group (Figure S4C-D), while the unconjugated bile acids were not varied among these groups (Figure S4E). Furthermore, the 12-OH bile acids were significantly enriched in both the liver and serum of LKO mice. Although content of total bile acid was increased in the LKO mice, the fold change of 12-OH bile acids was higher (). Moreover, the ratio of 12-OH bile acids to non-12-OH bile acids was significantly higher in both the liver and serum of the LKO mice () and the content of serum 7α-hydroxy-4-cholesten-3-one (C4) (a marker for CYP7A1 activity) was not changed ().
Figure 4. Change of the bile acid profile in different mice. (a) Composition of the liver bile acid pool in LL, LKO, and AKO mice. (b-c): Fold change of total bile acid and 12-OH bile acids in the liver (b) and serum (c) between the LL and LKO group. (d) Ratio of 12-OH bile acids to non-12-OH bile acids in the liver and serum of LL and LKO mice. (e) Content of serum C4 in LL and LKO mice. *: P < 0.05, **: P < 0.01, ***: P < 0.001.
Hepatic GHR regulates Cyp8b1 expression
The expression level of genes related to bile acid metabolism was examined to explore the bile acid metabolism regulation of hepatic GHR. Consistent with the increased 12-OH/non-12-OH ratio, the expression of Cyp8b1 that determines the ratio of 12-OH bile acids to non-12-OH bile acids was significantly upregulated in the liver of LKO mice (). However, the expression level of Cyp7a1 encoding the rate-limiting enzyme for BA synthesis was not changed, which was in line with the serum C4 content. These results suggested that the highly induced bile acids in the LKO mice attributed to the upregulation of Cyp8b1. In addition, the expression of taurine biosynthesis-related cysteine dioxygenase gene (Cdo) and bile acid conjugation-related bile acid:CoA synthase gene (Bacs) was not changed, but the bile acid-CoA:amino acid N-acyltransferase gene (Bat) that conjugates bile salts to taurine or glycine was significantly induced. The bile salt export pump gene (Bsep) that is responsible for secreting conjugated bile acids into the bile canaliculiCitation32,Citation33 was significantly downregulated in the LKO group. The genes of sodium-dependent taurocholate cotransporting polypeptide (Ntcp) and organic anion-transporting polypeptide 1 (Oatp1) involved in bile acid uptake were significantly downregulated in the LKO group.
Figure 5. Analysis of bile acid metabolism regulation by hepatic GH signaling. (a) Expression level of genes related to bile acid metabolism in the liver of LL and LKO mice. (b-c) Expression level of Cyp8b1 in rhGH treated HFD fed mice (b) and HepG2 cells (c). (d) Expression level of hepatic Fxr and Shp in LL and LKO mice. (e) Expression level of hepatic Fxr and its downstream Shp and MafG in LKO mice after GW4064 treatment. (f) Expression level of hepatic Cyp8b1 in the GW4064 treated LKO mice. *: P < 0.05, **: P < 0.01, ***: P < 0.001.
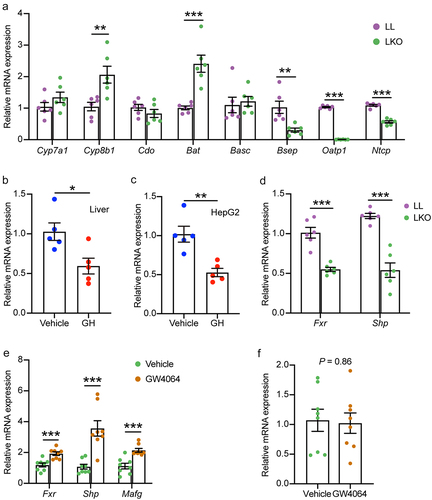
To further confirm the regulation of Cyp8b1 by GHR, we examined Cyp8b1 expression level in rhGH treated HFD-fed mice and human HepG2 cell line. Cyp8b1 expression was significantly reduced in both the rhGH treated mice and HepG2 cells (). It is well established that CYP8B1 is regulated by liver FXR, and the expression level of Fxr as well as its downstream Shp was decreased in the liver of LKO mice (). Therefore, we checked the response of Cyp8b1 to FXR activation in the LKO mice treated by FXR agonists GW4064. Although Fxr and its targeted genes Shp and MafG were induced by GW4064 (), the expression level of Cyp8b1 was not changed (). In contrast, although the expression level of Cyp7a1 was not changed in the rhGH treated mice and HepG2 cells, it was significantly induced in the GW4064 treated LKO mice (Figure S5A-C). Our results suggested that hepatic GH signaling directly regulates Cyp8b1 independent of FXR.
Hepatic Ghr absence influences gut bile acid profile
The bile acid profiles in the cecal content of LL and LKO mice were determined. The OPLS-DA plot displayed a clear discrimination between the two groups, which was verified by the PERMANOVA test with a P value of 0.002 (). Both the cecal bile acid pools of the two groups were dominated by the unconjugated bile acids, such as DCA, ωMCA, βMCA, αMCA, and LCA. The contents of these unconjugated bile acids were increased in the LKO group, which contributed to a significant increase of the total bile acid content (, Table S4). In addition, the abundance of the primary bile acid was significantly increased, and those of the secondary bile acid and conjugated bile acid were significantly decreased in the LKO group (). We further analyzed the expression level of bile acid transport-related genes in the cecum. It was found that the expression levels of apical sodium dependent BA transporter gene (Ibat), organic solute transporter β gene (Ostb) and ileal bile acid-binding protein gene (Ibabp) were significantly downregulated in the LKO group (). In addition, the expression level of Fxr as well as its downstream Fgf15 was reduced in the cecum of LKO mice (Figure S5D).
Figure 6. Bile acid metabolism in the cecum and its correlation with gut bacteria. (a) OPLS-DA plot showing the difference of bile acid profile between the LL and LKO mice. (b) Composition of the cecal bile acid pool in the LL and LKO mice. (c-e) Comparison of the abundance of primary bile acid (c), secondary bile acid (d) and conjugated bile acid (e) between the LL and LKO mice. (f) Expression level of the genes related to bile acid reabsorption. (g) Correlation between the bile acid and the top 30 most abundant bacterial genera. *: P < 0.05, **: P < 0.01, ***: P < 0.001.
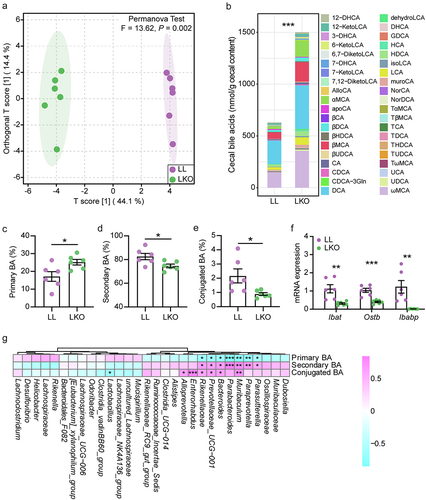
The correlation between the abundance of bacterial genus and bile acid was analyzed, and several genera were found to have significant association with the bile acid variation in the cecal content. Parasutterella, Paraprevotella, Muribaculum, Parabacteroides, Bacteroides, Paraprevotellaceae UCG-001 and Rikenellaceae were significantly negatively correlated with primary bile acid and significantly positively correlated with secondary bile acid. Muribaculum, Bacteroides, Paraprevotellaceae UCG-001, Rikenellaceae, Enterorhabdus, and Alloprevotella had the significantly positive correlation, while Lactobacillus had the significantly negative correlation with the conjugated bile acid ().
The putative function of gut microbiota is changed in hepatic Ghr knockout mice
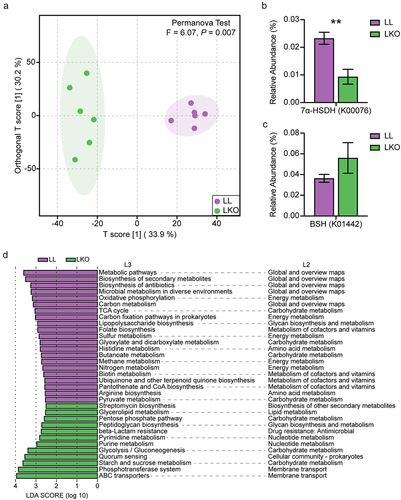
To assess the fluences of hepatic Ghr absence on the microbiota function, the function of gut microbiota was predicted by Tax4Fun2 based on the abundance of bacterial ASVs. The OPLS-DA along with PERMANOVA test at the KO level showed that the function of the microbial community was significantly different between the LL and LKO groups (). The abundance of bile acid metabolism-related pathway was analyzed. The abundance of microbial 7α-hydroxysteroid dehydrogenase (7α-HSDH) gene, which takes part in transforming the primary bile acid into the secondary bile acid, was significantly lower in the LKO groups compared with the LL group (). The abundance of microbial bile salt hydrolase (BSH) gene involved in the deconjugation of conjugated bile acid showed a trending increase in the LKO group (). Moreover, 33 significantly altered KEGG L3 pathways were identified between the LL and LKO groups by LDA analysis, and 29 of them affiliates with the “Metabolism” pathway at L1 category (), mainly including “Global and overview maps”, “Energy metabolism”, “Carbohydrate metabolism” pathways in the L2 category. Among them, several pathways associated with short chain fatty acid (SCFA) production were significantly downregulated in the LKO group, including “Glyoxylate and dicarboxylate metabolism”, “Butanoate metabolism”, and “Pyruvate metabolism”, which suggested the altered gut microbiota affected the gut SCFAs.
Figure 7. Prediction of gut microbiota function by Tax4Fun2. (a) OPLS-DA plot showing the difference of gut microbiota function at the KO level in the LL and LKO mice. (b-c) Comparison of the relative abundance of 7α-HSDH gene (b) and BSH gene (c) between the LL and LKO mice. *: P < 0.05, **: P < 0.01, ***: P < 0.001. (d) LDA analysis revealing the differentially enriched functional pathways between the LL and LKO mice.
Microbial metabolite levels are altered in hepatic Ghr knockout mice
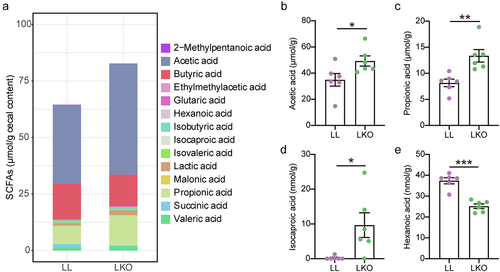
The SCFAs in cecal content were detected in the LL and LKO mice to confirm the Tax4Fun2 prediction. A total of 14 SCFAs were identified (Table S5), which was dominated by acetic acid, butyric acid and propionic acid, and there was a trending increase in the content of total SCFA in the LKO group without significance (). Moreover, the levels of four SCFAs were significantly changed. The contents of acetic acid, propionic acid and isocaproic acid were significantly increased, and that of hexanoic acid was significantly decreased in the LKO group ().
Figure 8. Analysis of the SCFA profile in cecal content of the LL and LKO mice. (a) Composition of SCFA pool in the LL and LKO mice. (b-e) Comparison of the individual SCFA content in the LL and LKO mice. *: P < 0.05, **: P < 0.01, ***: P < 0.001.
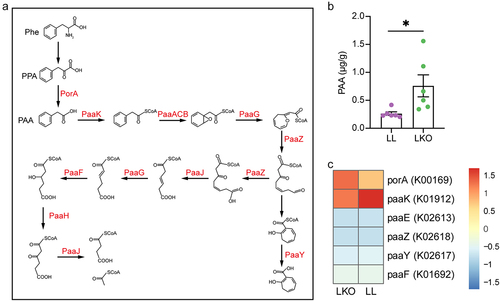
We also observed the alteration of another microbial metabolite – phenylacetic acid (PAA), which is closely related to fatty liver. PAA is produced by the bacterial fermentation of phenylalanine (Phe). It is metabolized from phenylpyruvic acid (PPA) by PorA and degraded by several enzymes or enzymatic subunits, such as PaaK, PaaABC, and PaaG, which are encoded by the genes in the paa operon (). In this study, PAA content was significantly increased in the liver of LKO mouse (). The abundances of genes involved in PAA metabolism in gut microbiota were analyzed based on Tax4Fun2 prediction. porA and paaK were abundant in both the LL and LKO group, but the abundance of paaK was relatively higher than porA in the LL group (), suggesting a stronger PAA degradation ability of the gut microbiome in the LL group.
Figure 9. PAA metabolism in the LL and LKO mice. (a) Schema of bacterial PAA metabolism pathway. (b) Comparison of liver PAA content between the LL and LKO mice. (c) Relative abundance of PAA metabolism genes predicted by Tax4Fun2 in the cecal content of LL and LKO mice.
Discussion
In this study, we characterized the gut bacterial community in mice with GHR deleted in the adipose tissue and liver that are the important targets of GH. Neither of them influenced the richness and evenness of the bacterial community compared with the LL control, which was consistent with the results in GH−/− mice.Citation19 Together with our finding, we concluded that the effect of GH action on gut microbiota α-diversity is mild. However, hepatic GHR absence led to significant change in the taxonomic composition of gut microbiota compared with LL and AKO groups. The abundances of Firmicutes and Bacteroidota dominated in murine gut microbiome as well as many genera belonging to them were significantly changed in the LKO mice. Interestingly, they were not changed in the global GH overexpress or GH gene knockout mice,Citation19,Citation20 which suggested the compensatory effect of GH action in different organs. Moreover, Parasutterella significantly reduced in the LKO mice showed the same and opposite trends with that in GH−/− and GH transgenic mice,Citation19 respectively. Parasutterella has been considered as a core member of the murine and human gut microbiota.Citation34 It was characterized to alter multiple biological processes and pathways, such as amino acids, SCFA, and bile acid metabolism, and was also implied to exert the protective effects on liver healthy.Citation35,Citation36 This was in line with our correlation analysis, which showed that Parasutterella together with several other genera was negatively correlated with the triglyceride and cholesterol levels in the LKO mice. Therefore, these features of Parasutterella renders it a potential target for the metabolic diseases associated with dysregulated GH signaling. Overall, GHR disruption in the liver rather than adipose tissue resulted in the significant variation of gut microbiota composition, and the variation of gut microbiota was closely associated with the disturbed lipid homeostasis in the LKO mice.
The disturbed bile acid metabolism in the LKO mice contributed to the gut microbiota variation. Hepatic GHR disruption resulted in the induction of bile acid, which was probably owed to the induction of CYP8B1, a crucial regulator determining the ratio of 12-OH bile acids to non-12-OH bile acids. FXR is an important regulator that negatively regulates CYP8B1. Although Fxr was downregulated in the LKO mice, the expression level of Cyp8b1 was not changed after GW4064 treatment, suggesting that the hepatic GH signaling directly regulates Cyp8b1 independent of FXR. Surprisingly, Cyp7a1 that is known to be inhibited by activated FXR was significantly induced in the GW4064 treated LKO mice, implying that there may be a crosstalk between GHR and FXR. The total bile acid content was increased in the gut, which probably attributed to the decreased expression of genes involved in bile acid reabsorption in the gut (Ibat, Ostb, and Ibabp) and uptake in the liver (Oatp1 and Ntcp). Bile acids can inhibit the bacterial growth, and some bacteria such as Lactobacillus and Clostridium, are resistant to bile acid.Citation22,Citation37 Therefore, the increased bile acid in the gut of LKO mice probably inhibited the growth of many bacteria, such as Muribaculum, Parabacteroides, Parasutterella, and Bacteroides. However, the abundance of Lactobacillus was significantly increased in the LKO group owing to its bile acid resistance. In addition, the suppressed cecal FXR was probably also involved in the disturbed microbiota, since it is regarded to regulate genes participating in enteroprotection.Citation23 Moreover, the variation of these bacteria in turn resulted in the lower abundance of secondary bile acid and conjugated bile acid in the LKO mice, since Muribaculum, Parabacteroides, Parasutterella, and Bacteroides have been found to produce secondary bile acidsCitation35,Citation38,Citation39 and Lactobacillus is the main genera involved in bile acid deconjugation.Citation24,Citation33 This was also in line with the correlation analysis and bacterial community function prediction and indicated that the abundance of 7α-HSDH and BSH genes was affected by the hepatic GHR disruption.
The altered gut microbiota may contribute to the disturbed metabolic phenotypes of the LKO mice through the microbial metabolites. Our results together with previous studiesCitation29,Citation40 have proved that both the congenital and adult-onset liver GHR disruption result in insulin resistance and hepatic steatosis. However, the underlying microbial mechanism was far from clear. In this study, many bacteria were correlated with the fatty liver phenotype, and several microbial metabolites including SCFAs and PAA that can regulate host metabolism were changed in the LKO mouse. Acetic acid and propionic acid were significantly enriched, while hexanoic acid level was significantly decreased in the LKO mice. Acetic acid and propionic acid are the most abundant SCFAs in the gut, and they were found to be enriched in NAFLD patients.Citation41 And, propionic acid was also considered to lead to insulin resistance and hyperinsulinemia.Citation42 Hexanoic acid has been reported to inhibit the colonization of potentially pathogenic bacteria in the gut,Citation43 and it is also negatively related with Crohn’s disease activity.Citation44,Citation45 Besides the SCFAs, the level of gut microbiota derived PAA was increased in the liver of LKO mice, which probably resulted from the inhibition of PAA degradation of the gut microbiota. In a human cohort study, PAA was found to be most strongly associated with hepatic steatosis and proved to induce the lipid accumulation in primary human hepatocytes by reducing the response to insulin via lowering AKT phosphorylation.Citation46 Our results suggested that the increased bacterial production of SCFAs and PAA may contribute to the insulin resistance and liver lipid accumulation in the LKO mice, and their detailed effects and underlying mechanisms need to be further studied.
In conclusion, our study proposed the role of hepatic GHR in modulating gut microbiota by regulating bile acid metabolism via CYP8B1. And, the altered gut microbiota in turn affects the bacterial metabolites that may contribute to the insulin resistance and liver lipid accumulation caused by liver GHR disruption. Our findings provide the metabolic basis related to gut microbiota dysbiosis driven by liver GH signaling, which extends our insight into functional roles of GH signaling and facilitates the investigation of GH-gut microbiota crosstalk.
Materials and methods
Animal studies
Three genotypes of male mice from a pure C57BL/6J background were used in this study. The adipose tissue-specific Ghr knockout mice (AKO) were generated by breeding the GHRflox/flox miceCitation47,Citation48 to Adipoq-Cre mice as previously described.Citation28 The hepatic tissue-specific Ghr knockout mice (LKO) were generated by breeding the GHRflox/flox mice to Albumin-Cre mice (B6.FVB(129)-Tg(Alb1-cre)1Dlr/J, Jackson Laboratory, Stock No. 016832). The GHRflox/flox (LL) mice were used as control. All the mice were fed on regular chow (1010009, 12.79% kcal from fat, Xietong Bioengineering Company, Nanjing, China) in IVC system with 12-hr light/12-hr dark cycles and given ad libitum access to food and water. Genotyping of the mice were performed 4 weeks after birth from tail snips by PCR using the primers listed in Table S6. The LKO mice were also treated with either vehicle or FXR agonist GW4064 (M2018, AbMole, TX, USA) by intraperitoneal injection once daily at 30 mg/kg body weight for 14 days.
Male wild type C57BL/6J mice were used for recombinant human growth hormone (rhGH) administration assay. Weaning mice of four-weeks old (Strain No. N000013) were purchased from GemPharmatech (Nanjing, China). After 1 week of acclimation, mice were fed a high fat diet (HFD) containing 60% kcal form fat (XTHF60–1, Xietong Bioengineering Company) for 12 weeks. Then, HFD-fed mice were divided into two groups: (1) the GH group treated by daily intraperitoneal injection with 0.75 IU/kg body weight rhGH (AnkeBio Co., Ltd, Anhui, China), and (2) the control group treated by intraperitoneal injection with normal saline. Mice were sacrificed after 4 weeks of rhGH administration assay. All animal experiments were performed under the guidelines for the treatment of laboratory animals and were approved by the Committee on the Ethics of Animal Experiments of Shandong Provincial Hospital Affiliated to Shandong First Medical University & Shandong Academy of Medical Sciences.
Sample collection and processing
Liver, adipose tissue, blood, cecum, and cecal content were sampled from the 20-week-old mice. The liver, cecum, white adipose tissue (WAT) and brown adipose tissue (BAT) were dissected. After being weighed, partial liver and subcutaneous fat were fixed with 10% formalin for histological observation, and the remaining liver and adipose tissue samples together with the cecum samples were snap-frozen in liquid nitrogen. Serum was separated from whole blood by centrifugation at 1000 g for 10 min at 4°C and stored at −80°C for further use. Cecal contents were collected and snap-frozen immediately and stored at −80°C for gut bacterial community analysis.
Body weight, organ weight, and biochemical parameters analysis
Body weight of each mouse was recorded before sacrifice. Liver and fat were weighed after dissection using an analytical balance. The content of triglyceride, total cholesterol, low-density lipoprotein cholesterol, and high-density lipoprotein cholesterol in the serum or liver was measured using the test kits (A110-1-1, A111-1-1, A113-1-1 and A112-1-1, Jian Cheng Biological Engineering Institute, Nanjing, China) according to the manufacturer’s instructions.
Insulin tolerance test
At the end of the experiment, insulin tolerance test (ITT) was performed as described previouslyCitation47. Briefly, blood glucose was first measured after the mice were fasted for 4 h. Subsequently, 0.75 international units (IU) per kg insulin (Humulin R, Eli Lily, Indianapolis, IN) was injected intraperitoneally into mice and blood glucose level was measured at 15-, 30-, 45- and 60-min post insulin injection. The area under the curve (AUC) was calculated as described previously.Citation49
Hematoxylin–Eosin (H&E) staining
Liver and fat tissues were fixed with 10% formalin for at least 24 h. Samples were sliced into 5 μm sections after embedding in paraffin and then stained with H&E. Digital images were captured with a Nikon NI-E light microscope (Nikon, Tokyo, Japan).
HepG2 cell treatments
Human HepG2 cell line was maintained in Dulbecco’s modified Eagle’s medium (11330032, Gibco, NY, USA) supplemented with 10% fetal bovine serum (GeminiBio, CA, USA). In rhGH treatment assay, cells were treated with rhGH at 160 ng/mL for 24 h, and those treated with normal saline were used as control.
High-throughput sequencing of 16S rRNA gene
The total DNA in the cecal content was extracted with the E.Z.N.A. stool DNA isolation kit (OMEGA Bio-tek, GA, USA) according to the manufacturer’s instruction. The hypervariable V3–V4 region of 16S rRNA gene was amplified with the universal primers of 343F (5′-TACGGRAGGCAGCAG-3′) and 798 R (5′-AGGGTATCTAATCCT-3′) using the purified DNA as template. The amplicons were then pair-end sequenced on the Illumina MiSeq PE250 platform by Majorbio Bio-pharm Technology Co., Ltd (Shanghai, China).
Analysis of bacterial community in cecal content
The raw sequencing data were processed in QIIME2Citation50 to analyze the diversity and taxonomic composition of the bacterial community. Briefly, the paired-end reads were denoised and stitched by DADA2 after demultiplexing and quality examination, which generated an amplicon sequence variant (ASV) table along with the representative sequences. In the diversity analysis, the ASV table was subsampled based on the minimum count of all the samples to avoid bias caused by different sequencing depths. The α- and β-diversity analyses were performed on the normalized ASV table. The β-diversity was illustrated by 3D plot based on the principal component analysis (PCA), and permutation on a multivariate analysis of variance (PERMANOVA) was conducted to test the statistical significance between different groups. The taxonomical classification was performed to analyze the relative abundance of bacterial species in different groups. The taxonomy was first assigned to the representative sequences with a classifier trained on Silva 138 99% 16S reference, and then the taxonomic composition of bacterial community in each sample was analyzed based on the ASV table. The taxonomic composition was visualized by stack bar charts and heatmap at phylum and genus level plotted by “ggplot2” and “pheatmap” in R software.
Prediction of the bacterial community function
The functional capabilities of bacterial community were predicted using Tax4Fun2 packageCitation51 in R software based on the ASVs and the representative sequences obtained by QIIME2. The Kyoto Encyclopedia of Gene and Genomes (KEGG) database was used as the reference, and the KEGG Orthologs (KOs) were predicted based on the relative abundance of all the ASVs. The KEGG pathway abundance was consequently inferred based on the KOs abundance. Orthogonal partial least-squares discrimination analysis (OPLS-DA) and PERMANOVA were performed to analyze the variation of the functional profile of the bacterial community. Linear discriminant analysis (LDA)Citation52 was conducted to identify the significantly altered functional pathways.
Targeted quantitative metabolomics, bile acid, and short chain fatty acid (SCFA) profile analyses
Frozen samples were sent to Metabo-Profile (Shanghai, China) for targeted metabolomics analysis. The adipose tissue and liver samples of LL, AKO, and LKO groups were evaluated by targeted quantitative metabolomics on the Q300TM primary targeted metabolic profiling platform using triple quadrupole mass spectrometer with an ultrahigh performance liquid chromatography (UPLC-QQQ-MS), which focuses on ~300 targeted metabolites such as amino acids, fatty acids, bile acids, organic acids, carbohydrates, lipids, etc. The bile acid profiles in the serum and cecal content of LL and LKO mice were determined by the ultrahigh performance liquid chromatography-tandem mass spectrometry (UPLC-MS/MS) using the BAP Ultra kit (Metabo-Profile, Shanghai, China). The detection of cecal SCFAs was also performed by Metabo-Profile using UPLC-MS/MS. OPLS-DA and principal component analysis (PCA) were performed to analyze the differences of metabolite profile between different groups, and PERMANOVA was used to determine the statistical significance.
RNA extraction and gene expression assessment
Total RNA was extracted from liver and cecum using TRIzol reagent (9109; Takara, Beijing, China), and then reverse-transcribed into cDNA using First Strand cDNA Synthesis Kit (SM134, Sevenbio, Beijing, China). The relative expression levels of genes involved in bile acid metabolism and transport were quantified by SYBR Green qPCR MasterMix (SM143, Sevenbio) with Gapdh gene as the reference on the QuantStudio 7 Pro Real-Time PCR System (Applied Biosystems, CA, USA). The primer sequences are listed in Table S6.
Statistical analysis
All values are shown as mean ± SEM. T-test between groups and one-way ANOVA analysis followed by Tukey’s post hoc test among LL, LKO, and AKO groups were performed. The statistical significance threshold was set at P < 0.05. The statistical significance was indicated by * (P < 0.05), ** (P < 0.01), and *** (P < 0.001).
The pairwise Pearson’s correlations between the abundances of bacterial genera and metabolic phenotype and bile acids were calculated by “psych” and visualized by “pheatmap” in R software.
Weighted gene co-expression network analysis (WGCNA)Citation53 was performed to identify the key gut bacteria-related metabolic modules and metabolites using the WGCNA package in R software. Firstly, the metabolites from adipose tissue and liver were, respectively, clustered using hierarchical clustering and topology overlap measures (TOM) based on co-expression correlation coefficient of each metabolite. Then, module-trait association analysis was conducted to calculate the Pearson correlation coefficient between metabolic modules and bacterial phyla, and the most relevant and significant metabolic module was selected and detailed. Next, the module membership (MM) and the biomarker significance (BS) were calculated for each node in each module.
Authors’ contributions
YW, LR, and ZY designed and conducted the experiments. ZY, YW, FZ, RM, XY, KY, AM, and LR collected the samples and performed the phenotypic and biochemical parameters analyses. AM and LR performed the histological observation. ZY, LR, and YW analyzed the microbiota data. ZY and LR analyzed the metabolome data. ZY and LR drafted the manuscript. LR and YW reviewed and edited the manuscript. All the authors read and approved the final manuscript.
Supplemental Material
Download Zip (5.5 MB)Acknowledgments
This work was supported by the Ministry of Science and Technology (“National Key R&D Program of China” No. 2021YFA0805100, 2021YFF0702100, and 2022YFE0132200), Shandong Provincial Natural Science Foundation (No. ZR2022MH057), and Youth Incubation Program of Shandong First Medical University & Shandong Academy of Medical Sciences (No. 202201-039). The authors thank Anhui Anke Biotechnology (Group) Co., Ltd. for kindly providing rhGH.
Disclosure statement
No potential conflict of interest was reported by the authors.
Data availability statement
The raw sequence data are available in the NCBI Sequence Read Archive database under accession number PRJNA913256 (http://www.ncbi.nlm.nih.gov/sra). The targeted metabolomics data are included in the supplementary files.
Supplementary material
Supplemental data for this article can be accessed online at https://doi.org/10.1080/19490976.2023.2221098
Additional information
Funding
References
- Schroeder BO, Bäckhed F. Signals from the gut microbiota to distant organs in physiology and disease. Nat Med. 2016;22(10):1079–19. doi:10.1038/nm.4185.
- Tripathi A, Debelius J, Brenner DA, Karin M, Loomba R, Schnabl B, Knight R . The gut–liver axis and the intersection with the microbiome. Nat Rev Gastro Hepat. 2018;15(7):397–411. doi:10.1038/s41575-018-0011-z.
- Lundgren P, Thaiss CA. The microbiome-adipose tissue axis in systemic metabolism. American Journal Of Physiology-Gastrointestinal And Liver Physiology. 2020;318(4):G717–G24. doi:10.1152/ajpgi.00304.2019.
- Ticinesi A, Lauretani F, Tana C, Nouvenne A, Ridolo E, Meschi T. Exercise and immune system as modulators of intestinal microbiome: implications for the gut-muscle axis hypothesis. Exerc Immunol Rev. 2019;25:84–95.
- Evans HM, Long JA. The effect of the anterior lobe administered intraperitoneally upon growth, maturity and oestrus cycles of the rat. Anat Rec. 1921;21:62–63.
- Strous GJ, Almeida ADS, Putters J, Schantl J, Sedek M, Slotman JA, Nespital T, Hassink GC, Mol JA . Growth hormone receptor regulation in cancer and chronic diseases. Front Endocrinol (Lausanne). 2020;11:597573. doi:10.3389/fendo.2020.597573.
- Nishad R, Mukhi D, Menon RK, Pasupulati AK. Growth hormone and metabolic homeostasis. Diabetes. 2018;6:78–87. doi:10.33590/emjdiabet/10313977.
- Colon G, Saccon T, Schneider A, Cavalcante MB, Huffman DM, Berryman D, List E, Ikeno Y, Musi N, Bartke A, et al. The enigmatic role of growth hormone in age-related diseases, cognition, and longevity. GeroScience. 2019;41(6):759–774. doi:10.1007/s11357-019-00096-w.
- Xu L, Xu C, Yu C, Miao M, Zhang X, Zhu Z, Ding X, Li Y . Association between serum growth hormone levels and nonalcoholic fatty liver disease: a cross-sectional study. PLos One. 2012;7(8):e44136. doi:10.1371/journal.pone.0044136.
- Hwang Y-A, Lee HW, Ahn SH, Lee EJ, Ku CR, Kim SU. Positive association between nonalcoholic fatty liver disease and growth hormone deficiency in patients with nonfunctioning pituitary adenoma. Front Endocrinol. 2023;9:1057769. doi:10.3389/fendo.2022.1057769.
- Laron Z, Ginsberg S, Webb M. Nonalcoholic fatty liver in patients with laron syndrome and GH gene deletion–preliminary report. Vol. 18, Growth Hormone & IGF Research; 2008. pp. 434–438.
- Schwarzer M, Makki K, Storelli G, Machuca-Gayet I, Srutkova D, Hermanova P, Martino ME, Balmand S, Hudcovic T, Heddi A, et al. Lactobacillus plantarum strain maintains growth of infant mice during chronic undernutrition. Science. 2016;351(6275):854–857. doi:10.1126/science.aad8588.
- Yan J, Herzog JW, Tsang K, Brennan CA, Bower MA, Garrett WS, Sartor BR, Aliprantis AO, Charles JF . Gut microbiota induce IGF-1 and promote bone formation and growth. Proceedings of the National Academy of Sciences 2016; 113:E7554–E63.
- Novince CM, Whittow CR, Aartun JD, Hathaway JD, Poulides N, Chavez MB, Steinkamp HM, Kirkwood KA, Huang E, Westwater C, et al. Commensal gut microbiota immunomodulatory actions in bone marrow and liver have catabolic effects on skeletal homeostasis in health. Sci Rep. 2017;7(1):5747. doi:10.1038/s41598-017-06126-x.
- Storelli G, Defaye A, Erkosar B, Hols P, Royet J, Leulier F. Lactobacillus plantarum promotes Drosophila systemic growth by modulating hormonal signals through TOR-dependent nutrient sensing. Cell Metab. 2011;14(3):403–414. doi:10.1016/j.cmet.2011.07.012.
- Shin SC, Kim S-H, You H, Kim B, Kim AC, Lee K-A, Yoon J-H, Ryu J-H, Lee W-J . Drosophila microbiome modulates host developmental and metabolic homeostasis via insulin signaling. Science. 2011;334(6056):670–674. doi:10.1126/science.1212782.
- Humam AM, Loh TC, Foo HL, Samsudin AA, Mustapha NM, Zulkifli I, Izuddin WI . Effects of feeding different postbiotics produced by lactobacillus plantarum on growth performance, carcass yield, intestinal morphology, gut microbiota composition, immune status, and growth gene expression in broilers under heat stress. Animals. 2019;9:644. doi:10.3390/ani9090644.
- Izuddin WI, Loh TC, Samsudin AA, Foo HL, Humam AM, Shazali N. Effects of postbiotic supplementation on growth performance, ruminal fermentation and microbial profile, blood metabolite and GHR, IGF-1 and MCT-1 gene expression in post-weaning lambs. BMC Vet Res. 2019;15(1):315. doi:10.1186/s12917-019-2064-9.
- Jensen EA, Young JA, Jackson Z, Busken J, List EO, Carroll RK, Kopchick JJ, Murphy ER, Berryman DE . Growth hormone deficiency and excess alter the gut microbiome in adult male mice. Endocrinology. 2020;161(4):bqaa026. doi:10.1210/endocr/bqaa026.
- Jensen EA, Young JA, Jackson Z, Busken J, Kuhn J, Onusko M, Carroll RK, List EO, Brown JM, Kopchick JJ, et al. Excess growth hormone alters the male mouse gut microbiome in an age-dependent manner. Endocrinology. 2022;163(7):bqac074. doi:10.1210/endocr/bqac074.
- Lin B, Wang M, Gao R, Ye Z, Yu Y, He W, Qiao N, Ma Z, Ji C, Shi C, et al. Characteristics of gut microbiota in patients with GH-secreting pituitary adenoma. Microbiology Spectrum. 2022;10(1):e00425–21. doi:10.1128/spectrum.00425-21.
- Tian Y, Gui W, Koo I, Smith PB, Allman EL, Nichols RG, Rimal B, Cai J, Liu Q, Patterson AD . The microbiome modulating activity of bile acids. Gut Microbes. 2020;11(4):979–996. doi:10.1080/19490976.2020.1732268.
- Inagaki T, Moschetta A, Lee Y-K, Peng L, Zhao G, Downes M, Yu RT, Shelton JM, Richardson JA, Repa JJ, et al. Regulation of antibacterial defense in the small intestine by the nuclear bile acid receptor. Proceedings of the National Academy of Sciences 2006; 103:3920–3925.
- Jia W, Xie G, Jia W. Bile acid–microbiota crosstalk in gastrointestinal inflammation and carcinogenesis. Nat Rev Gastro Hepat. 2018;15(2):111–128. doi:10.1038/nrgastro.2017.119.
- Puri P, Daita K, Joyce A, Mirshahi F, Santhekadur PK, Cazanave S, Luketic VA, Siddiqui MS, Boyett S, Min H-K, et al. The presence and severity of nonalcoholic steatohepatitis is associated with specific changes in circulating bile acids. Hepatology. 2018;67(2):534–548. doi:10.1002/hep.29359.
- Zhang F, Yuan W, Wei Y, Zhang D, Duan Y, Li B, Wang X, Xi L, Zhou Y, Wu X. The alterations of bile acids in rats with high-fat diet/streptozotocin-induced type 2 diabetes and their negative effects on glucose metabolism. Life Sci. 2019;229:80–92. doi:10.1016/j.lfs.2019.05.031.
- Mousa OY, Juran BD, McCauley BM, Vesterhus MN, Folseraas T, Turgeon CT, Ali AH, Schlicht EM, Atkinson EJ, Hu C, et al. Bile acid profiles in primary sclerosing cholangitis and their ability to predict hepatic decompensation. Hepatology. 2021;74(1):281–295. doi:10.1002/hep.31652.
- Ran L, Wang X, Mi A, Liu Y, Wu J, Wang H, Guo M, Sun J, Liu B, Li Y, et al. Loss of adipose growth hormone receptor in mice enhances local fatty acid trapping and impairs brown adipose tissue thermogenesis Science. iScience. 2019;16:106–121. doi:10.1016/j.isci.2019.05.020.
- Fan Y, Fang X, Tajima A, Geng X, Ranganathan S, Dong H, Trucco M, Sperling MA. Evolution of hepatic steatosis to fibrosis and adenoma formation in liver-specific growth hormone receptor knockout mice. Front Endocrinol (Lausanne). 2014;5:218. doi:10.3389/fendo.2014.00218.
- List EO, Berryman DE, Funk K, Jara A, Kelder B, Wang F, Stout MB, Zhi X, Sun L, White TA, et al. Liver-specific GH receptor gene-disrupted (LiGHRKO) mice have decreased endocrine IGF-I, increased local IGF-I, and altered body size, body composition, and adipokine profiles. Endocrinology. 2014;155(5):1793–1805. doi:10.1210/en.2013-2086.
- List EO, Berryman DE, Jensen EA, Kulkarni P, McKenna S, Kopchick JJ. New insights of growth hormone (GH) actions from tissue-specific GH receptor knockouts in mice. Archives Of Endocrinology And Metabolism. 2020;63(6):557–567. doi:10.20945/2359-3997000000185.
- Strautnieks SS, Bull LN, Knisely AS, Kocoshis SA, Dahl N, Arnell H, Sokal E, Dahan K, Childs S, Ling V, et al. A gene encoding a liver-specific ABC transporter is mutated in progressive familial intrahepatic cholestasis. Nat Genet. 1998;20(3):233–238. doi:10.1038/3034.
- Wahlström A, Sayin SI, Marschall H-U, Bäckhed F. Intestinal crosstalk between bile acids and microbiota and its impact on host metabolism. Cell Metab. 2016;24(1):41–50. doi:10.1016/j.cmet.2016.05.005.
- Willing BP, Dicksved J, Halfvarson J, Andersson AF, Lucio M, Zheng Z, Järnerot G, Tysk C, Jansson JK, Engstrand L. A pyrosequencing study in twins shows that gastrointestinal microbial profiles vary with inflammatory bowel disease phenotypes. Gastroenterology. 2010;139(6):1844–54. e1. doi:10.1053/j.gastro.2010.08.049.
- Ju T, Kong JY, Stothard P, Willing BP. Defining the role of Parasutterella, a previously uncharacterized member of the core gut microbiota. Isme J. 2019;13(6):1520–1534. doi:10.1038/s41396-019-0364-5.
- Llopis M, Cassard A, Wrzosek L, Boschat L, Bruneau A, Ferrere G, Puchois V, Martin JC, Lepage P, Le Roy T, et al. Intestinal microbiota contributes to individual susceptibility to alcoholic liver disease. Gut. 2016;65(5):830–839. doi:10.1136/gutjnl-2015-310585.
- Binder H, Filburn B, Floch M. Bile acid inhibition of intestinal anaerobic organisms. Am J Clin Nutr. 1975;28(2):119–125. doi:10.1093/ajcn/28.2.119.
- Li M, Wang S, Li Y, Zhao M, Kuang J, Liang D, Wang J, Wei M, Rajani C, Ma X, et al. Gut microbiota-bile acid crosstalk contributes to the rebound weight gain after calorie restriction in mice. Nat Commun. 2022;13(1):2060. doi:10.1038/s41467-022-29589-7.
- Wang K, Liao M, Zhou N, Bao L, Ma K, Zheng Z, Wang Y, Liu C, Wang W, Wang J, et al. Parabacteroides distasonis alleviates obesity and metabolic dysfunctions via production of succinate and secondary bile acids. Cell Rep. 2019;26(1):222–35. e5. doi:10.1016/j.celrep.2018.12.028.
- Cordoba-Chacon J, Majumdar N, List EO, Diaz-Ruiz A, Frank SJ, Manzano A, Bartrons R, Puchowicz M, Kopchick JJ, Kineman RD. Growth hormone inhibits hepatic de novo lipogenesis in adult mice. Diabetes. 2015;64(9):3093–3103. doi:10.2337/db15-0370.
- Rau M, Rehman A, Dittrich M, Groen AK, Hermanns HM, Seyfried F, Beyersdorf N, Dandekar T, Rosenstiel P, Geier A. Fecal SCFAs and SCFA-producing bacteria in gut microbiome of human NAFLD as a putative link to systemic T-cell activation and advanced disease. United Eur Gastroenterol J. 2018;6(10):1496–1507. doi:10.1177/2050640618804444.
- Tirosh A, Calay ES, Tuncman G, Claiborn KC, Inouye KE, Eguchi K, Alcala M, Rathaus M, Hollander KS, Ron I, et al. The short-chain fatty acid propionate increases glucagon and FABP4 production, impairing insulin action in mice and humans. Sci Transl Med. 2019;11(489):eaav0120. doi:10.1126/scitranslmed.aav0120.
- Van Immerseel F, De Buck J, Boyen F, Bohez L, Pasmans F, Volf J, Sevcik M, Rychlik I, Haesebrouck F, Ducatelle R. Medium-chain fatty acids decrease colonization and invasion through hilA suppression shortly after infection of chickens with Salmonella enterica serovar enteritidis. Appl Environ Microb. 2004;70(6):3582–3587. doi:10.1128/AEM.70.6.3582-3587.2004.
- Russo E, Cinci L, Di Gloria L, Baldi S, D’Ambrosio M, Nannini G, Bigagli E, Curini L, Pallecchi M, Andrea Arcese D, et al. Crohn’s disease recurrence updates: first surgery vs. surgical relapse patients display different profiles of ileal microbiota and systemic microbial-associated inflammatory factors. Front Immunol. 2022;13:886468. doi:10.3389/fimmu.2022.886468.
- De Preter V, Machiels K, Joossens M, Arijs I, Matthys C, Vermeire S, Rutgeerts P, Verbeke K. Faecal metabolite profiling identifies medium-chain fatty acids as discriminating compounds in IBD. Gut. 2015;64(3):447–458. doi:10.1136/gutjnl-2013-306423.
- Hoyles L, Fernández-Real J-M, Federici M, Serino M, Abbott J, Charpentier J, Heymes C, Luque JL, Anthony E, Barton RH, et al. Molecular phenomics and metagenomics of hepatic steatosis in non-diabetic obese women. Nat Med. 2018;24(7):1070–1080. doi:10.1038/s41591-018-0061-3.
- Wu Y, Liu C, Sun H, Vijayakumar A, Giglou PR, Qiao R, Oppenheimer J, Yakar S, LeRoith D. Growth hormone receptor regulates β cell hyperplasia and glucose-stimulated insulin secretion in obese mice. J Clin Invest. 2011;121(6):2422–2426. doi:10.1172/JCI45027.
- Wu Y, Wang C, Sun H, LeRoith D, Yakar S, Bergmann A. High-efficient FLPo deleter mice in C57BL/6J background. PLos One. 2009;4(11):e8054. doi:10.1371/journal.pone.0008054.
- Pacifici F, Arriga R, Sorice GP, Capuani B, Scioli MG, Pastore D, Donadel G, Bellia A, Caratelli S, Coppola A, et al. Peroxiredoxin 6, a novel player in the pathogenesis of diabetes. Diabetes. 2014;63(10):3210–3220. doi:10.2337/db14-0144.
- Bolyen E, Rideout JR, Dillon MR, Bokulich NA, Abnet CC, Al-Ghalith GA, Alexander H, Alm EJ, Arumugam M, Asnicar F, et al. Reproducible, interactive, scalable and extensible microbiome data science using QIIME 2. Nat Biotechnol. 2019;37(8):852–857. doi:10.1038/s41587-019-0209-9.
- Wemheuer F, Taylor JA, Daniel R, Johnston E, Meinicke P, Thomas T, Wemheuer B. Tax4fun2: prediction of habitat-specific functional profiles and functional redundancy based on 16S rRNA gene sequences. Environmental Microbiome. 2020;15(1):1–12. doi:10.1186/s40793-020-00358-7.
- Segata N, Izard J, Waldron L, Gevers D, Miropolsky L, Garrett WS, Huttenhower C. Metagenomic biomarker discovery and explanation. Genome Biol. 2011;12(6):1–18. doi:10.1186/gb-2011-12-6-r60.
- Langfelder P, Horvath S. WGCNA: an R package for weighted correlation network analysis. BMC Bioinform. 2008;9(1):559. doi:10.1186/1471-2105-9-559.