
ABSTRACT
The mammalian gut microbiota is a critical human health determinant with therapeutic potential for remediation of many diseases. The host diet is a key factor governing the gut microbiota composition by altering nutrient availability and supporting the expansion of distinct microbial populations. Diets rich in simple sugars modify the abundance of microbial subsets, enriching for microbiotas that elicit pathogenic outcomes. We previously demonstrated that diets rich in fructose and glucose can reduce the fitness and abundance of a human gut symbiont, Bacteroides thetaiotaomicron, by silencing the production of a critical intestinal colonization protein, called Roc, via its mRNA leader through an unknown mechanism. We have now determined that dietary sugars silence Roc by reducing the activity of BT4338, a master regulator of carbohydrate utilization. Here, we demonstrate that BT4338 is required for Roc synthesis, and that BT4338 activity is silenced by glucose or fructose. We show that the consequences of glucose and fructose on orthologous transcription factors are conserved across human intestinal Bacteroides species. This work identifies a molecular pathway by which a common dietary additive alters microbial gene expression in the gut that could be harnessed to modulate targeted microbial populations for future therapeutic interventions.
Introduction
The gut microbiota compositional changes associated with various human diseases potentiate therapeutic interventions that target distinct microbial populations.Citation1–8 Intriguingly, the abundance of individual microbial taxa can be dramatically altered through corresponding changes in the host diet, which directly supplies nutrients to gut microbes.Citation9–11 For example, dietary supplementation with arabinoxylan, a hemicellulose, can increase the intestinal abundance of Bacteroides cellulosilyticus (Bc)Citation12 and supplementation with the marine polysaccharide porphyran can increase the abundance of Bacteroides ovatus (Bo) strains.Citation13,Citation14 The advantages exhibited by Bc and Bo during administration of each respective dietary additive require glycan utilization machinery that enables bacterial consumption of these structurally distinct substrates.Citation15–17 Thus, microbial populations that can competitively access the available nutrients are favored and increase in abundance, while populations that cannot are disfavored and consequently decrease in abundance.Citation13,Citation14
Dietary components can also influence gut microbial populations by modulating the synthesis of factors necessary for intestinal colonization and host-microbial interactions independently of serving as nutrients.Citation13,Citation18–20 For example, the amount of Roc, a gut colonization factor from Bacteroides thetaiotaomicron (Bt), dramatically decreases upon host consumption of fructose and glucose-rich diets although Roc is dispensable for growth on either substrate.Citation19 Roc silencing occurs independently of transcription initiation at the roc promoter but requires the 54 nucleotide 5’ leader region of the roc mRNA.Citation19 Similarly, abundant dietary glucose consumption reduces the amount of BT4295, a Bt cell-surface protein that elicits beneficial host immune responses but is dispensable for intestinal colonization.Citation20 Roc and BT4295 are each encoded within distinct polysaccharide utilization loci that putatively target unknown host-derived glycans.Citation21,Citation22 Thus, human dietary components, such as glucose and fructose control both gut microbiota composition and behavior by altering gene expression in intestinal microbes. Glucose and fructose are highly abundant in the diets of industrialized populationsCitation23, can reduce the abundance of beneficial microbes, such as Bt,Citation19 and remodel gut microbial populations into those that elicit pathogenic consequences.Citation10,Citation24,Citation25 However, how these sugars exert their effects on gut microbes remains largely unknown.
Carbohydrate utilization genes are regulated by various mechanisms in intestinal Bacteroides species, including an extensive repertoire of glycan-responsive transcription factors,Citation26–31 an intricate network of sRNAs,Citation32–34 RNA-binding proteins,Citation35,Citation36 DNA inversions,Citation37,Citation38 and activation of the master regulator of carbohydrate utilization, called BT4338 in Bt (originally identified as MalR)Citation39, and is conserved in the Bacteroides genus.Citation26,Citation27 BT4338 controls the expression of many mono- and polysaccharide utilization genes and several other factors necessary for successful gut colonization.Citation26,Citation27 BT4338-dependent mRNAs dramatically increase when Bt is subjected to carbon limitation for 10 min in laboratory media, but only a fraction of the 464 differentially transcribed genes exhibit BT4338 binding to their putative promoter regions.Citation27 This suggests that BT4338 controls target gene transcription both directly and indirectly.
Here, we used Roc protein abundance as a reporter to elucidate how glucose and fructose target regulatory pathways in Bt and identified BT4338 as necessary for controlling Roc amounts following carbon limitation and during growth in substrates other than glucose or fructose. We establish that BT4338 indirectly controls Roc amounts via the roc mRNA leader, which is necessary for and sufficient to confer BT4338-dependent control to a heterologous gene. Furthermore, we show that BT4338 governs Roc abundance independently of an alternative translation elongation factor, EF-G2Citation40, whose mRNA levels are regulated by BT4338 and increase dramatically during carbon limitation.Citation27 Finally, we demonstrate that glucose and fructose exert rapid, dramatic, and dominant silencing of BT4338-dependent genes in vitro and that these effects are consistent across distinct gut Bacteroides species. Importantly, BT4338 protein levels remain stable, indicating that the metabolism of glucose or fructose alters the production of an unidentified signal that controls BT4338 activity. Our findings collectively indicate that abundant dietary sugar consumption by the host silences BT4338 activity in vivo, thereby modulating the production of microbial factors necessary for host interactions and fitness in the mammalian gut.
Results
BT4338 is necessary for Roc synthesis
We sought to determine how Bt controls Roc levels by identifying genes required for its synthesis. We screened 8,000 mutants harboring random transposon insertions for reduced Roc levels in vitro using colony blotting from strains cultured on solid media containing 0.25% each of rhamnose and galactose. This condition was selected because Roc levels are readily detectable () and mutations that could disable growth on one monosaccharide were unlikely to prevent growth on the other. We identified seven mutants exhibiting reduced Roc levels and subsequent semi-random PCR revealed that these strains contained an insertion in one of the three different open reading frames (ORF): BT1222, BT1221, or the master regulator of carbohydrate utilization, BT4338 ().Citation27 On solid media, BT1222 and BT1221 mutants exhibited heterogeneous signal intensity within and between colonies, suggesting local differences in Roc abundance, whereas BT4338 mutants displayed uniform reductions in Roc amounts in all colonies (). We engineered Bt strains with in-frame, chromosomal deletions of BT1222, BT1221, or BT4338 and measured Roc amounts by western blotting following carbon limiting conditions, which were previously shown to increase Roc levelsCitation19 and BT4338 binding to target promoters.Citation27
Figure 1. BT4338 is required for Roc synthesis. (a) Colony blot analysis of selected mutants harboring transposon insertions in BT1222 (GT3148), BT1221 (GT3150), or BT4338 (GT3151) compared to a control strain (GT1663) grown on solid minimal media containing rhamnose and galactose. Each strain is represented by at least 10 different isogenic colonies. (b) Western blot analysis of Roc from wild-type (GT593) or Bt strains deficient for BT4338 (GT1234) or fusA2 (GT1310) during growth in glucose (glu; −5) or 15-, 60-, and 180-minutes following exposure to carbon limitation (No C). (c) Quantified western blot analysis of wild-type (GT593; black), or Bt strains deficient for BT4338 (GT1234; gray), or fusA2 (GT1310; green) during growth in glucose (glu; −5) and 60-min following exposure to carbon limitation (No C) (n = 4 biological samples; error bars represent SEM; P values derived from two-way ANOVA; n.s. indicates P values ≥0.05; ***P < 0.001; ****P < 0.0001). (d) Western blot analysis of BT4338 (GT1481) during mid-exponential growth in glucose (glu; −5) or fructose (fru; −5) or 15-, and 60-minutes following exposure to carbon limitation (No C). (e) Western blot analysis of Roc from the strains described in (b) following mid-exponential growth in glucose (glu), fructose (fru), galactose (gal), or mannose (man). (f) Western blot analysis of BT4338 (GT1481) during mid-exponential growth in glucose (glu), fructose (fru), galactose (gal), or mannose (man). Blots were probed using anti-HA and anti-GroEL antibodies.
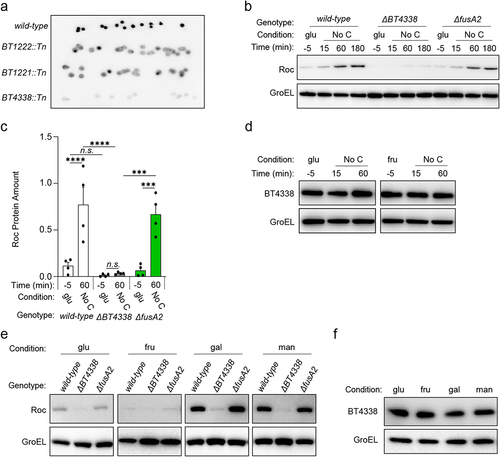
Roc amounts increased 5.8-fold and 15.6-fold, respectively, in wild-type Bt following a 60-min exposure to carbon limitation conditions following mid-exponential growth in media containing either glucose () or fructose (Fig. S1A and S1B) as the sole carbon source. Compared to wild-type Bt, an isogenic BT4338-deficient strain exhibited similar Roc levels during growth in glucose () or fructose (Fig. S1A), which increased 2.5- and 2.3-fold after 60 min in carbon limitation conditions ( and Fig. S1B, respectively). Conversely, strains lacking either BT1222 or BT1221, which putatively mediate two discreet steps in the oxidative pentose phosphate pathway (Fig. S2A), exhibited 5.6- and 7.3-fold increased Roc amounts after 60 min that were significantly lower than wild-type Bt under identical conditions (Fig. S2B and C). Additionally, a strain lacking BT1220, which is putatively required for an intermediate metabolic step between BT1221 and BT1222 (Fig. S2A), also exhibited lower Roc amounts than wild-type Bt following carbon limitation (Fig. S2C), indicating that the oxidative pentose phosphate pathway is involved in controlling Roc abundance. However, we focused our investigation on understanding how BT4338 controls Roc because it elicits the strongest effect across all conditions.
We determined that BT4338 protein amounts were similar during mid-exponential phase growth in either glucose or fructose, and subsequent exposure to carbon limiting conditions ( and Fig. S3A and S3B). These results indicate that carbon limitation increases Roc by stimulating BT4338 activity rather than increasing its protein amount and reciprocally suggests that growth in glucose or fructose reduce BT4338 activity. Consistent with this notion, relative to wild-type Bt cells grown in galactose and mannose, Roc amounts were 12.0- and 6.6-fold lower, respectively, in fructose grown cells and 5.8- and 3.2-fold lower, respectively, in glucose grown cells ( and Fig. S3C) agreeing with previous results.Citation19 By contrast, a BT4338-deficient strain exhibited similar Roc amounts across Bt cells grown in glucose, fructose, galactose, or mannose ( and Fig. S3C), which were 3.8-, 4.0-, 17.2-, and 10.3-fold lower than those from wild-type Bt in each respective condition (Fig. S3C). Finally, increased Roc amounts during growth in each monosaccharide are not the result of altered BT4338 protein abundance, which were identical during growth in all four carbon sources ( and Fig. S3D). Cumulatively, these data demonstrate that Bt controls Roc amounts in response to carbon limitation and carbohydrate metabolism by modulating BT4338 activity.
BT4338 indirectly controls Roc via its mRNA leader
We examined Roc amounts in BT4338-deficient strains harboring constructs encoding the roc ORF preceded either by its native leader or by the sugar-resistant leader upstream of the heterologous gene, BT3334, that enables Roc production even in the presence of fructose or glucose.Citation19 As previously demonstrated, the strain that includes the BT3334 leader displayed similar Roc amounts when grown in either glucose, fructose, galactose, or mannose ( and S4A).Citation19 This contrasts a strain encoding the roc ORF downstream of the native roc leader that exhibits 19.4- and 12.1-fold more Roc in galactose and mannose, respectively, compared to fructose grown cells and 3.8- and 2.4-fold more Roc compared to glucose grown cells ( and Fig. S4B). These results independently demonstrate that the silencing effect of fructose or glucose on Roc protein amounts requires its mRNA leader. The BT4338-deficient strain encoding roc downstream of its native promoter and leader displayed similar Roc amounts in glucose or fructose grown cells but 44.6- and 9-fold lower abundances in galactose and mannose, respectively, than those from a wild-type strain harboring an identical construct ( and Fig. S4A). Furthermore, a strain encoding the BT3334 promoter preceding the roc leader exhibited 34.9- and 11-fold greater Roc amounts in galactose and mannose, respectively, compared to fructose grown cells and 6.4- and 2-fold more Roc, compared to glucose grown cells ( and Fig. S4C). In this strain, increased Roc protein abundances in galactose or mannose compared to fructose or glucose grown cells required BT4338 ( and Fig. S4C), demonstrating that the roc leader is necessary for BT4338-dependent Roc production while the promoter is dispensable.
Figure 2. BT4338 governs Roc levels via its 5’ mRNA leader. (a) Western blot analysis of Roc from engineered strains harboring the roc leader and ORF positioned downstream of its native (GT530) or heterologous (GT670) promoters, or strains with the native roc promoter upstream of a heterologous 5’ leader region (GT665) in strains encoding BT4338 or a BT4338-deficient background (GT3509, GT3511, and GT3510, respectively) grown in minimal media containing 0.5% glucose (glu), fructose (fru), galactose (gal), or mannose (man) as the sole carbon source. (b) Western blot analysis of BT3334 from engineered strains harboring the BT3334 promoter and ORF flanking either the BT3334 (GT534) or roc (GT663) leaders in isogenic strains encoding BT4338 or in a BT4338-deficient background (GT3512 and GT3514, respectively) grown in minimal media containing 0.5% glucose (glu), fructose (fru), galactose (gal), or mannose (man). (c) Western blot analysis of Roc from strains described in (a) during mid-exponential growth in glucose (glu, −5) or 15-, and 60- minutes following exposure to carbon limitation conditions. (d) Western blot analysis of BT3334 from strains described in (b) during mid-exponential growth in glucose (glu, −5) or 15-, and 60-minutes following exposure to carbon limitation conditions. Blots were probed using anti-HA and anti-GroEL antibodies.
To determine whether the roc leader confers fructose- and glucose-dependent silencing to the heterologous gene, BT3334, which is synthesized in the presence of glucose or fructoseCitation19 independently of BT4338 ( and S4D), we used a strain where the BT3334 ORF was expressed by its native promoter but preceded by the roc leader. This strain exhibited BT3334 protein amounts that were 11- and 6.7-fold higher when grown in galactose or mannose, respectively, compared to fructose grown cells and 2.3- and 1.4-fold higher compared to glucose grown cells ( and S4E). Increased BT3334 amounts in this strain required BT4338 ( and S4E) demonstrating that the roc leader confers BT4338-dependent control of the downstream ORF, suggesting that growth in glucose or fructose reduce the corresponding protein abundances by silencing BT4338 activity. Accordingly, when either the roc or BT3334 ORFs were encoded immediately downstream of the roc leader, removing glucose from the medium increased the corresponding protein amounts by 20.2-fold ( and Fig. S4F) and 3.5-fold, respectively ( and Fig. S4G). Increased Roc amounts during carbon limitation required BT4338 when the roc ORF was preceded by its native leader regardless of the preceding promoter ( and Fig. S4H). While strains encoding the BT3334 leader upstream of the roc ORF exhibited 2.9-fold increased Roc abundance 60 min following exposure to carbon limitation, Roc amounts were increased in a BT4338-deficient background during growth in glucose ( and Fig. S4I), which resembled BT3334 protein amounts when the BT3334 ORF was positioned downstream of its native leader ( and Fig. S4J). Collectively, these data demonstrate the roc mRNA leader is sufficient to confer BT4338-dependent synthesis of the downstream ORF, which is silenced by glucose and fructose independently of the upstream promoter.
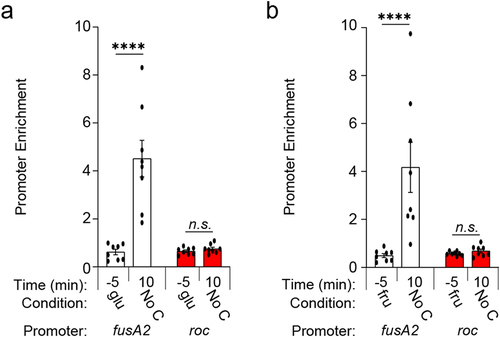
Carbon limitation increases Roc abundance ()Citation19 and stimulates BT4338 binding to chromosomal regions throughout the Bt genome.Citation27 While our previous RNAseq study revealed that roc transcript levels were 2.6-fold lower in a BT4338-deficient strain 10 minutes following carbon limitation, a corresponding ChIP-seq analysis did not detect BT4338 binding to regions upstream of the roc ORF under the same conditions.Citation27 This contrasts targets like fusA2, whose promoter occupancy dramatically increased 10 min after exposure to carbon limiting conditions, resulting in a BT4338-dependent 238-fold increase in the corresponding mRNA levels.Citation27 In agreement with these results, we determined that enrichment of the fusA2 promoter increased 7.3- and 8.4-fold by 10 min following carbon limitation compared to immunoprecipitation of BT4338 from glucose () or fructose () grown Bt. Although BT4338 levels remain constant throughout carbon limitation following growth in glucose or fructose (), roc promoter enrichment was not detected under these conditions () and the roc promoter lacks sequences resembling the BT4338 consensus.Citation41 Thus, BT4338 controls Roc amounts by a mechanism other than directing roc transcription initiation.
Figure 3. BT4338 DNA binding activity is stimulated during carbon starvation. (a – b) ChIP analysis of the fusA2 (BT2167; black) and roc (BT3172; red) promoter regions from wild-type Bt (GT1481) cells grown to mid-exponential phase in minimal media containing (a) glucose (glu; −5) or (b) fructose (fru; −5) and 10 minutes following exposure to carbon limitation conditions (n = 8 biological samples; error bars represent SEM; P values derived from two-way ANOVA; n.s. indicates P values ≥0.05; ****P < 0.0001).
EF-G2 and other BT4338 regulated products are dispensable for Roc synthesis
We hypothesized that BT4338 controls Roc amounts by regulating transcription of an unknown factor(s) involved in its synthesis. The most highly induced BT4338-dependent gene during carbon limitation conditions is fusA2 (BT2167), which encodes a non-essential, alternative translation elongation factor G (EF-G2) that enables GTP-independent translationCitation40 and is critical for mammalian intestinal colonization.Citation27 Because BT4338 is required for synthesis of both EF-G2 and Roc, and BT4338-dependent control of Roc protein is indirect and mediated via the roc 5’ mRNA leader, we reasoned that BT4338-dependent EF-G2 expression may control Roc amounts by governing its translation in a leader-dependent manner. However, a fusA2-deficient strain exhibited 10.3- and 9.3-fold increased Roc amounts following a 60-min exposure to carbon limitation from glucose or fructose, respectively, which resembled the 7.2- and 11.7-fold increases exhibited by wild-type Bt ( and Fig. S1A and S1B). Furthermore, a fusA2-deficient strain displayed similar Roc amounts as wild-type Bt in all growth conditions with 15.5- and 10.5-fold increases over fructose in either galactose or mannose, respectively ( and Fig. S3C). Cumulatively, these data demonstrate that EF-G2 is dispensable for Roc synthesis.
To explore the role of additional BT4338 regulated genes in controlling Roc abundance, we examined the consequences of inactivating the BT4338-dependent polysaccharide utilization locus (PUL), BT4299-BT4295, and putative methylmalonyl-CoA biosynthetic genes, BT1450-BT1448. However, both mutants displayed similarly increased Roc amounts compared to wild-type Bt after carbon limitation for 60 min (Fig. S5A-C). We also examined Roc levels in strains lacking BT2131, which encodes a conserved hypothetical protein, that could putatively silence Roc levels in the absence of BT4338 because the BT2131 transcript increases 57.3-fold in a BT4338-deficient strain during growth in glucose.Citation27 However, Roc amounts were indistinguishable between a BT4338 mutant and a strain lacking both BT4338 and BT2131 (Fig. S5A and S5D), and between wild-type Bt and a strain lacking BT2131 alone (Fig. S5A and S5D). Thus, BT4338 controls Roc abundance by an unidentified gene product(s).
Candidate Bt sRNAs are insufficient to control Roc levels
Bt produces hundreds of small RNAs (sRNA) that have established roles in regulating gene products involved in carbohydrate utilization.Citation32–34 Furthermore, a subset of Bt sRNAs increase in abundance following exposure to carbon limitation in vitroCitation34 and are positioned proximally to BT4338 binding sites.Citation27 Computational analysis revealed that three of these sRNAs, BTnc140, BTnc195, and BTnc364 exhibit complementarity to the roc leader (Fig. S6A), suggesting a role in controlling Roc amounts. However, Bt strains engineered to over-produce either BTnc140, BTnc195, or BTnc364 (Fig. S6B) exhibited indistinguishable Roc amounts compared to those of a control strain during mid-exponential phase growth in glucose (Fig. S6C and S6D). These data indicate that increased expression of three candidate sRNAs cannot increase Roc protein amounts.
Glucose and fructose rapidly and dominantly silence BT4338 activity
Host consumption of abundant dietary glucose and fructose reduce the levels of two BT4338-dependent products, RocCitation19 and BT4295 in vivo.Citation20 Because BT4338 is a critical determinant of mammalian intestinal colonization,Citation27 we hypothesized that host consumption of sugar-rich chow would silence BT4338 activity in wild-type Bt, thereby reducing the competitive defect exhibited by a BT4338-deficient strain. An independently constructed Bt strain lacking BT4338 was 1.3 × 10⁴-fold lower in abundance than wild-type Bt 10 days following introduction into germ-free mice fed a sugar-rich diet (). The introduction of a plasmid-borne copy of BT4338 complemented this mutant, which exhibited 1.5 × 10³-fold greater abundance than the BT4338-deficient strain (). The BT4338-deficient strain exhibited a 1.6 × 10⁶-fold lower abundance than the wild-type Bt strain in mice fed a standard, low sugar, high plant polysaccharide diet (), indicating that BT4338 is required for intestinal colonization regardless of host dietary sugar consumption. These results agree with previous reports demonstrating that Bt mutants harboring insertions in BT4338 exhibit severe competitive defects for murine gut colonization in hosts fed either standard low in sugar or glucose and fructose-rich chowsCitation12,Citation27. Thus, this transcription factor performs critical regulatory roles in the mammalian gut independently of dietary composition.Citation27
Figure 4. Dietary sugars silence BT4338 activity. (a & b) the relative abundances of bar-coded strains wild-type (GT3361; black) or BT4338-deficient Bt strains harboring an empty vector (GT3522; blue) or complementation plasmid (GT3363; pink) at the indicated times following gavage with equal cfus of each strain into germ-free mice fed (a) a sugar-rich diet or (b) a standard diet (n = 5; error bars represent SEM). (c) qPCR analysis of fusA2 (BT2167) or BT4295 transcript levels measured in wild-type (GT593; black) or BT4338-deficient (GT1234; gray) Bt strains during mid-exponential growth in 1% PMOG (n = 4 biological samples; error bars represent SEM, P values derived from two-way ANOVA; n.s. indicates P values ≥ 0.05; **P < 0.01 ***P < 0.001). (d – e). qPCR analysis of (d) fusA2 (BT2167) or (e) BT4295 transcript levels measured in wild-type Bt (GT23) during mid-exponential growth in either 0.5% glucose (glu) or 1% PMOG, and 10-minutes following the addition of 0.2% glucose to the PMOG grown cells. (n = 9 biological samples; error bars represent SEM, P values were calculated using two-way ANOVA; n.s. indicates P values ≥0.05; ***P < 0.001; ****P < 0.0001). (f) Western blot analysis of BT4338 from cells (GT1481) grown in 1% PMOG or 10 and 60-minutes following the addition of glucose to 0.2%. Blot was probed using anti-HA and anti-GroEL antibodies.
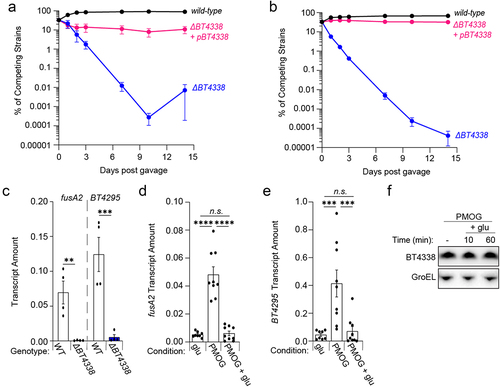
To determine whether fructose or glucose exert dominant silencing effects on BT4338 activity, thereby reducing target gene transcription, we compared fusA2 transcript abundances during growth on glucose or a glycan mixture derived from the porcine gastric mucosa (PMOGs). PMOGs support the growth of wild-type and BT4338-deficient Bt strains (Fig. S7A)Citation16 and elicit 9.3- and 9.1-fold increases in fusA2 and BT4295 transcripts, respectively, in a BT4338-dependent manner (). Glucose dominantly silences BT4338 activity because fusA2 and BT4295 transcripts decreased by 7.9- and 5.9-fold, respectively, 10 min following the introduction of 0.2% glucose to Bt cells grown to mid-exponential phase in 1% PMOGs (, respectively). Likewise, the addition of fructose to PMOG-grown Bt cells also decreased fusA2 and BT4295 transcripts by 5.4- and 14.8-fold, respectively, after 60 min although no change was detected by 10 min (Fig. S7B and S7C, respectively), likely because additional time is necessary for optimal synthesis of gene products necessary for fructose consumption.Citation17,Citation42 Importantly, BT4338 protein levels remained constant after 60 min following glucose addition, indicating that transcription factor activity is silenced ( and Fig. S7D). Collectively, these data indicate that available glucose and fructose can rapidly modulate BT4338 activity even in the presence of other growth substrates.
BT4338 orthologs govern a partially conserved regulon
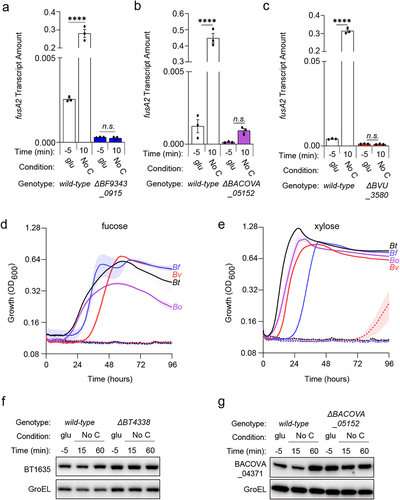
BT4338 is conserved among numerous Bacteroides speciesCitation12 including B. fragilis (Bf, BF9343_0915), B. ovatus (BACOVA_05152), and B. vulgatus (Bv, BVU_3580), which share 84.1, 96.1, and 77.3% amino acid sequence identity with BT4338, respectively. Exposing each species to carbon limitation for 10 minutes elicited 109.9-, 360.9-, and 75.6-fold increased transcription of their corresponding fusA2 orthologs, BF9343_3536, BACOVA_03178, and BVU_0017 (, respectively), whose products share 89.1, 97.9, and 86.9% amino acid sequence identity to BT2167, respectively. Bf, Bo, and Bv strains deficient for their respective BT4338-orthologs are unable to increase fusA2 transcription in response to carbon limitation conditions (, respectively).Citation27 Furthermore, Bf, Bo, and Bv mutants deficient for this transcription factor are unable to grow on fucose or xylose (, respectively) but can grow on glucose or fructose (Fig. S8A and S8B, respectively). Together, these data demonstrate a conserved regulon including control of fusA2 transcription and distinct carbon utilization genes across Bacteroides species.
Figure 5. BT4338-orthologs govern a conserved regulon among prominent Bacteroides species. (a) the transcript level of B. fragilis fusA2 (BF9343_3536) was measured in wild-type (ATCC 25285; black) or a BF9343_0915-deficient (GT2520; blue) B. fragilis strain grown in glucose (glu; −5) and 10-minutes after exposure to carbon limitation (No C) (n = 3 biological samples; error bars represent SEM, P values were calculated using two-way ANOVA; n.s. indicates P values ≥0.05; ****P < 0.0001). (b) the transcript level of B. ovatus fusA2 (BACOVA_03178) was measured in wild-type (ATCC 8483; black) or BACOVA_05152-deficient (GT2413; purple) strains grown in glucose (glu; −5) or 10-minutes after exposure to carbon limitation (No C) (n = 3 biological samples; error bars represent SEM, P values derived from two-way ANOVA; n.s. indicates P values ≥ 0.05; ****P < 0.0001). (c) the transcript level of B. vulgatus fusA2 (BVU_0017) was measured in wild-type (ATCC 8482; black) or BVU_3580-deficient (GT2399; red) strains grown in glucose (glu; −5) or 10-minutes after exposure to carbon limitation (No C) (n = 3 biological samples; error bars represent SEM, P values derived from two-way ANOVA; n.s. indicates P values ≥ 0.05; ****P < 0.0001). (d – e). Growth of bar-coded wild-type (solid lines) B. thetaiotaomicron (Bt; GT3361; black), B. fragilis (Bf; GT3551; blue), B. vulgatus (Bv; GT3367; red), or B. ovatus (Bo; GT3364; purple) or bar-coded isogenic BT4338-ortholog-deficient strains (dashed lines; GT3522, GT3555, GT3643, GT3553, respectively) in minimal media containing 0.5% (d) fucose or (e) xylose (n = 4 biological samples; error bars represent SEM). (f) Western blot analysis of BT1635 amounts from wild-type (GT4372) or a Bt strain deficient for BT4338 (GT4373) during growth in glucose (glu; −5) or 15-, or 60-minutes following exposure to carbon limitation (No C). (g) Western blot analysis of BACOVA_04371 from wild-type Bo (GT4362) or a strain deficient for BACOVA_05152 (GT4369) during growth in glucose (glu; −5) or 15-, or 60-minutes following exposure to carbon limitation (No C). Blots were probed using anti-HA and anti-GroEL antibodies.
To determine whether BT4338-orthologs control the abundances of Roc homologs, we examined the amounts of BT1635, which is a putative hybrid two-component system (HTCS) exhibiting 74.1% amino acid sequence identity to Roc. Like Roc, BT1635 regulates the expression of linked PUL genes in response to unknown glycans.Citation22,Citation43 In contrast to Roc, BT1635 protein amounts are similar during growth in 8 different substrates, including glucose or fructose.Citation19 Both wild-type and BT4338-deficient strains display indistinguishable BT1635 abundances either during mid-exponential phase growth in glucose or following carbon limitation for 60 min ( and S9A), indicating that BT4338 does not control this protein even though it shares high sequence identity to Roc. We also examined the abundance of BACOVA_04371, a HTCS in Bo that shares 73.3% identity to Roc and 80.6% identity to BT1635. In contrast to both BT1635 and Roc, BACOVA_04371 is not predicted to control PUL gene expressionCitation22,Citation43 and its abundance increased 3-fold in a BACOVA_05152-deficient strain compared to wild-type Bo grown in glucose ( and S9B). BACOVA_04371 levels remained constant following exposure to carbon limitation for 60 min, which was similar in wild-type Bo and the BACOVA_05152-deficient strain ( and S9B). This indicates that control of Roc-like protein amounts by BT4338-orthologs is unpredictable based on sequence identity across Bt and Bo, and the regulatory outcomes can differ between species.
Dietary sugar silences BT4338-ortholog activity across prominent bacteroides species
To determine if glucose and fructose dominantly silence the activity of BT4338 orthologs, we examined fusA2 transcript levels in Bf during mid-exponential phase growth in either glucose or PMOGs, which both support growth of wild-type and BF9343_0915-deficient strains (Fig. S10). We determined that fusA2 transcript levels in wild-type Bf are 42.2- and 44.9-fold lower during growth in glucose () or fructose (), respectively, compared to PMOGs as a sole carbon source. Additionally, the BF9343_0915-deficient strain exhibited indistinguishable fusA2 levels during growth in either glucose or PMOGs, which were 6.4- and 335-fold lower than wild-type Bf in each respective condition (). The addition of 0.2% glucose to Bf cells growing on 1% PMOGs as a sole carbon source reduced fusA2 transcript levels 24.5-fold after 10 min (), and 44.9-fold after 60 min following fructose addition (). Together, these results demonstrate that the introduction of glucose and fructose rapidly silence BT4338 ortholog activity and reduce target gene transcription in abundant intestinal Bacteroides species.
Figure 6. A BT4338-ortholog is silenced by dietary sugar addition in B. fragilis. (a) Bf fusA2 (BF9343_3536) transcript levels were measured in wild-type (ATCC 25285; black) or a BF9343_0915-deficient (GT2520; blue) B. fragilis strain grown in 0.5% glucose, 1% PMOG, or 1% PMOG 10-minutes after addition of 0.2% glucose (n = 3 biological samples; error bars represent SEM, P-values derived from two-way ANOVA; n.s. indicates P values ≥ 0.05; ****P < 0.0001). (b) the transcript level of B. fragilis fusA2 (BF9343_3536) was measured in wild-type (ATCC 25285) or a BF9343_0915-deficient (GT2520) strain during mid-exponential growth in either 0.5% fructose (fru) or 1% PMOG, and 60-minutes following the addition of fructose to 0.2% (n = 9 biological samples for fru and PMOG; n = 3 for PMOG + fru; error bars represent SEM, P values derived from one way ANOVA; n.s. indicates P values ≥ 0.05; *P < 0.05 ****P < 0.0001).
Discussion
We have established that a widely distributed transcription factor in human gut bacteria governs carbohydrate utilization () and transcription of the alternative translation elongation factor, EF-G2 (). Moreover, introduction of the abundant human dietary sugars, glucose and fructose, reduce the levels of BT4338-dependent transcripts and proteins including Bt gene products, Roc (), fusA2 ( and Fig. S7B) and BT4295 ( and Fig. S7C), that mediate host-microbial interactions and are silenced in vivo by host consumption of dietary sugars.Citation19,Citation20 Furthermore, the addition of glucose or fructose rapidly and dominantly exert these effects on cultured cells consuming host-derived glycans ( and Fig. S7B and S7C), and conversely, removing fructose or glucose from the growth media dramatically increase target promoter binding () and gene transcriptionCitation27 without altering transcription factor levels ( and Fig. S3A and S3B). Collectively, these data indicate that glucose and fructose modulate the activity of this transcription factor, which we propose to rename Cur (Carbohydrate utilization regulator), distinguishing this protein from analogous regulators in Proteobacteria and Firmicutes.Citation44 This work identifies a conserved mechanism governing gene expression in dominant human gut bacteria in response to abundant dietary additives, and highlights this pathway as a potential mediator of intestinal disease observed in animals fed a sugar-rich diet.Citation10
Cur is an important component of carbon catabolite repression (CCR) in the Bacteroidetes because Cur binds to Bt carbon utilization gene promoters,Citation27 is required for controlling transcription of downstream genes,Citation27 and growth on distinct monosaccharides across four representative Bacteroides species ().Citation26 In other gut bacterial phyla, CCR is mediated by similar transcription factors, such as Crp (also called CAP) in the Enterobacteriaceae and CcpA in Firmicutes, which recognize intracellular signaling molecules that modulate their target promoter-binding activities and direct transcription of genes required for “less-preferred” substrates.Citation45 For example, Crp binds cyclic-adenosine monophosphate (cAMP) and CcpA binds a phosphorylated form of HPr, which are differentially synthesized in response to metabolic cues resulting in increased catabolic gene expression.Citation45 The activation of Crp and CcpA require components of the phosphoenolpyruvate: sugar transferase system (PTS), which couple monosaccharide transport and phosphorylation to serve as an intracellular indicator of preferred substate availability.Citation46 Thus, the transport of preferred growth substrates reduces transcription of genes mediating utilization of “less-preferred” substrates present in the environment by decreasing the activation of Crp and CcpA.Citation45
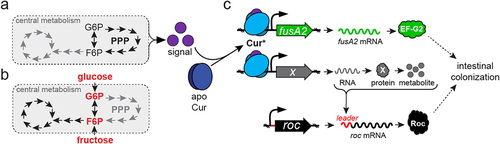
Bacteroides species impose CCR by a distinct mechanism(s) because: 1.) all sequenced Bacteroides species lack HPr, CcpA, and PTS orthologs, and 2.) although Bacteroides Cur is classified as a Crp/Fnr-like regulator, these transcription factors exhibit only 18% amino acid sequence identity.Citation27 Furthermore, neither cAMP nor its biosynthetic enzyme, adenylate cyclase, have been detected in the BacteroidetesCitation47,Citation48 indicating that Cur activity is controlled by unique signal(s) in this phylum. We hypothesize that perturbations in pentose phosphate pathway (PPP) intermediates modulate this signal () because cur is required for growth on pentose sugars (),Citation26 Roc levels increase during growth on pentose sugars,Citation19,Citation26 and many PPP genes are dispensable for in vitro growth but critical for intestinal colonization, which is similar to the cur gene.Citation12,Citation49,Citation50 Additionally, two independent genetic screens identified oxidative PPP genes as necessary for synthesis of Cur-dependent products (),Citation20 although a third screen identified PPP genes as regulators of Cur-independent gene expression.Citation51 We hypothesize that dietary sugars exert CCR by modulating cellular carbon metabolism, thereby reducing the production of the putative Cur signal (), which consequently lowers the synthesis of factors mediating host interactions, including those that function independently of carbohydrate utilization (). Thus, identifying the signal(s) that governs Cur activity in Bacteroides species is imperative to understand how CCR is imposed in vivo and to identify strategies to exploit this regulatory system for manipulation of intra-intestinal microbial abundance and metabolism.
Figure 7. Model depicting the consequences of glucose and fructose on Cur activity. (a) an unknown signal(s) (purple) is putatively synthesized in response to metabolic cues derived from the PPP pathway that converts apo-Cur (dark blue) to Cur* (light blue). (b) Introduction of fructose or glucose modulate central metabolism to reduce Cur signal(s), thereby hindering products necessary for intestinal colonization. (c) Cur* increases transcription of fusA2 (green) and an unidentified gene (gray), whose product(s) govern Roc abundance by interacting with the roc mRNA leader region (red).
Intestinally isolated Bacteroides species can harvest monosaccharides from various complex polysaccharides using expansive repertoires of coordinately regulated glycan detection, importation, and degradation enzymes encoded within PULs.Citation16,Citation30,Citation42,Citation52–54 PUL gene transcripts can also be silenced by glucose or fructose and exhibit prioritized expression by a myriad of mechanisms.Citation26,Citation55 Here, we demonstrate that in Bt, Cur indirectly controls the amount of the PUL-encoded sensor protein, Roc (), and that glucose and fructose silencing of Roc is mediated by a corresponding reduction in Cur activity (). Additionally, Cur is required for increased transcript levels of another PUL-encoded gene, BT4295, following exposure to carbon limitation conditions even though Cur does not bind to the putative promoter regions upstream of either roc () or BT4299, the gene initially transcribed in the PUL containing BT4295.Citation27 Thus, Cur likely regulates many more genes than previously estimated, including those facilitating polysaccharide utilization, permitting dynamic carbon source prioritization as conditions change within the host.Citation27,Citation41 We predict that Cur controls Roc synthesis indirectly by governing transcription of an unknown target gene(s) that interacts with the roc leader independently of transcription initiation (). In the Bacteroidetes phylum, mRNA leaders can control downstream gene product synthesis by functioning as riboswitches,Citation56–58 sRNA targets,Citation34,Citation59–61 and interacting with RNA binding proteins.Citation35,Citation36 Although the roc mRNA leader could function as a riboswitch,Citation62 we hypothesize that Cur is more likely to regulate an unknown RNA-binding protein or sRNA that controls Roc production via its leader. Future investigations are necessary to identify species-specific Cur regulons and determine how the abundance of distinct intestinal Bacteroides species are differentially altered in hosts fed glucose and fructose-rich diets.Citation10
Materials and methods
Bacterial culture conditions
Bacterial strains and plasmids used in this study are listed in Table S1. Escherichia Coli strains were cultured on Luria-Bertani (BD). Bt strains were cultured on solid brain heart infusion agar (Sigma) containing 5% defibrinated horse blood (Hardy), tryptone-yeast extract-glucose (TYG), or Bacteroides minimal medium, plus individual carbon sources (0.5% weight/volume unless otherwise noted) as previously described (24). All bacterial strains included the following antibiotics where appropriate: 100 μg/mL ampicillin (Sigma), 200 μg/mL gentamicin (Sigma), 2 μg/mL tetracycline (Sigma), or 25 μg/mL erythromycin (Sigma).
Construction of strains
pNBU2 plasmids were introduced by di-parental mating and att−1 site integration was verified by PCR as previously described.Citation19 Strains harboring chromosomal deletions of BT4338, BACOVA_05152, or BVU_3580 were constructed by allelic exchange as previously described.Citation63 A strain lacking BF9343_0915 was constructed by allelic exchange as previously described.Citation64 Strains harboring chromosomal deletions of BT1450-BT1448 or BT2131 were constructed by allelic exchange as previously described.Citation65 Epitope tagging of BACOVA_04371 and inactivation of BT4299 genes was performed using the pKNOCK-tetQ vector as described.Citation54 Overexpression of candidate sRNAs was achieved using the multicopy plasmid pLYL01 as described.Citation22 Primers used in this study are listed in Table S2.
Generation of Bt transposon insertion library
E. coli donor S17–1 strain harboring pSAM-Bt (GT671) and recipient Bt strain containing a multi-copy plasmid encoding epitope-tagged Roc (GT1663) were cultured overnight to stationary phase in LB and TYG, respectively, containing the appropriate antibiotics.Citation50 The E. coli strain was diluted 2000-fold into LB media containing ampicillin and the recipient Bt strain was diluted 250-fold into 10 ml pre-reduced TYG containing tetracycline. Upon reaching early exponential phase (OD600 ~0.3), 1 mL of donor was combined with 10 mL recipient, centrifuged at 7,200 × g for 2 min, and washed with 10 mL of PBS. The pellet was resuspended in the residual volume, spread onto solid BHI-B, incubated aerobically for 3 h, and then anaerobically overnight. 1.0 mL 1× PBS was added and the confluent growth was dislodged from the plate using a cell spreader. The suspension was increased to with 1× PBS to a final volume of 5.0 mL, homogenized by vortex, and 1.0 mL of the resulting cell suspension was spread onto five 245 mm square BioAssay dishes (Nunc) containing solid BHI-B containing 0.2% galactose and the appropriate antibiotics before 48 h of anaerobic incubation. The resulting colonies were collected using a plastic spreader and 12 mL 1× PBS containing 20% glycerol. All re-suspended cells were homogenized by vortex and stored at −80°C as 0.25 mL aliquots prior to colony blotting.
Colony blotting
One aliquot of the Bt library described above was thawed, diluted, and spread onto 150 mm petri dishes containing solid minimal media containing 0.25% galactose and 0.25% rhamnose such that each plate contained approximately 1,000 colonies. Plates were incubated anaerobically for 48 to 72 huntil colonies were readily visible by eye, transferred to nitrocellulose membranes, and immunoblotted as previously described.Citation19 Selected colonies were isolated on solid BHI-B prior to cryo-preservation.
Western blotting
Cell pellets were re-suspended in 375 μl 1× Tris-buffered saline (TBS) containing 1 mM EDTA and 0.5 mg/ml chicken egg lysozyme (Sigma). Cell suspensions were transferred to a 2.0 mL tube containing 0.1 mm Zirconia/Silica beads (BioSpec) and subject to disruption using a Mini-Beadbeater (BioSpec, Bartlesville, OK, USA) at 2,800 rpm for 5 cycles of 40 s with 5-min incubations at 4°C between each cycle. Samples were centrifuged for 2 min at 15,294 × g at 4°C to remove cell debris and the supernatant was reserved. Protein concentration was estimated by measuring absorbance at 280 nanometers using a NanoQuant plate in a Spark plate reader (Tecan, Männedorf, Switzerland). A volume corresponding to 30 μg of protein from each sample was combined with 3 μl 4× LDS buffer (ThermoFisher) containing 100 mM dithiothreitol and subject to heating at 95°C for 5 min. A modified protocol was used for PMOG grown cells to reduce reagent consumption. For this, equivalent 0.75 ODs were calculated from mid-exponential grown cells, pelleted, decanted, and flash frozen. Cell pellets were resuspended in 75 μl lysis buffer containing 50 mM Tris, 1% SDS, and 2× protease inhibitor (P8849, Sigma) before being boiled at 95°C for 5 min. After cooling samples on ice, 25 μl 4× LDS buffer (ThermoFisher) containing 100 mM dithiothreitol was added and samples were incubated at 75°C for 10 min. 15 μl of each sample were loaded onto a 4–12% Bis-tris NuPAGE gel (ThermoFisher) and fractionated for 60 min at 180 V in 1× MOPS running buffer (ThermoFisher) before transferring to a nitrocellulose membrane using an iBlot2 (Invitrogen, Waltham, Massachusetts, USA). The resulting membrane was cut below the 100 kD marker and both portions blocked for 1 hour in 1× TBS with 3% skim milk (BD). The top portion of the membrane was incubated with a 1 to 5,000 dilution of a rabbit anti-HA antibody (Sigma) followed by a 1 to 5,000 dilution of an HRP-conjugated anti-rabbit antibody (GE). GroEL was detected on the bottom portion of the membrane using a 1 to 5,000 dilution of a rabbit anti-GroEL antibody (Sigma) followed by a 1 to 5,000 dilution of an HRP-conjugated anti-rabbit antibody (GE). Membranes were washed before and after addition of secondary antibody with TBS containing 0.05% Tween−20 (Sigma) and rinsed with 1× TBS prior to detection with ECL Prime Western Blotting Detection Reagent Substrate (Cytiva). Blots were quantified using Image Studio Lite (LI-COR Biosciences, Lincoln, Nebraska, USA).
Quantitative PCR (qPCR)
mRNA was prepared from 1.0 mL of Bt cell culture pre-treated with RNA protect (Qiagen) using the RNeasy kit (Qiagen) according to the manufacturer’s instructions. Contaminating DNA was removed using on-column DNase treatment (Qiagen) during purification according to the manufacturer’s instructions. cDNA was synthesized from 1.0 μg of RNA using Superscript VILO IV master mix (ThermoFisher) according to the manufacturer’s instructions. mRNA levels were measured by quantification of cDNA using Fast SYBR Green PCR Master Mix (Applied Biosystems) and primers listed in Table S2 using a QuantStudio 12K Flex Real-Time PCR System (Applied Biosystems, Waltham, Massachusetts, USA). Data were normalized to 16s ribosomal RNA from 1,000-fold diluted cDNA as previously describedCitation26. qPCR primers are listed in Table S2.
Monitoring growth of bacterial strains in vitro
Bacteroides strains were growth in TYG medium anaerobically overnight before being diluted 1 to 200 into 100ul of Bacteroides minimal medium containing 0.5% of the carbon sources of interest. For PMOG growth curves, 1.0% PMOG was used. Growth was monitored for 96 h following dilution using an Infinite M Nano plate reader (Tecan, Männedorf, Switzerland) maintained anaerobically. Absorbance at OD600 was measured every 15 min after 5 s of orbital shaking.
Chromatin immunoprecipitation
ChIP was carried out as previously described.Citation27 The abundance of rpoD, fusA2, and roc promoters were measured in 50-fold-diluted input DNA and 2-fold-diluted IP or control samples by qPCR using primers listed in Table S2. The fold enrichment was calculated as previously described.Citation66
Carbon limitation experiments
Bt or Bo strains were grown in TYG medium anaerobically overnight before being diluted 1 to 400 into 2.0 mL of Bacteroides minimal medium containing 0.5% glucose. After reaching the stationary phase, the resulting culture was diluted 1 to 50 into pre-reduced medium containing 0.5% glucose or 0.5% fructose and grown to mid-exponential phase (OD600 = 0.45 to 0.6), at which time an aliquot was collected by centrifugation, decanted, and immediately placed on dry ice representing the “−5” time points in carbon limitation experiments. The remaining culture was centrifuged at 7,200 × g at room temperature for 3 min in sealed tubes and reintroduced into the anaerobic chamber where the tubes were unsealed, and the supernatant was decanted. Cell pellets were resuspended in an equivalent volume of pre-warmed, pre-reduced minimal medium lacking a carbon source and incubated at 37°C anaerobically. Aliquots were collected by centrifugation at indicated time points following incubation and the supernatant was decanted before the pellet was placed on dry ice and stored at −80°C.
Examining bacterial abundance in the murine gut
Germ-free C57BL/6J (JAX # 000664) mice were bred and maintained in gnotobiotic isolators with a 12-hr light/dark cycle at Penn State University. All experiments were carried out using, 8–12-week-old mice with males and females at similar ratios. Experimental groups contained 5 mice and each group was provided with autoclaved standard mouse chow (5021, Lab Diet) or an irradiated glucose-sucrose chow (S4944, Bio-Serv) ad libitum. Diet information is available in supplemental tables S3 and S4, respectively. Animal gavage, fresh fecal sample collection, and relative strain abundance measurements were carried out as previously described.Citation16 All experiments using mice were performed using protocols approved by the Penn State Institutional Animal Care and Use Committee
Measuring BT4338 ortholog silencing by dietary sugar addition
Bt and Bf were grown as described above in 0.5% glucose, 0.5% fructose or 1.0% PMOG. Once mid-exponential phase growth was reached, a 1 ml sample was collected for downstream RNA preparation and a 20% glucose or fructose solution was added to PMOG grown cells to 0.2% final weight/volume and incubated for the indicated times. Subsequently, 1 ml samples were collected 10 and 60 min after the addition of either sugar solution, mRNA was harvested as described above, and transcript abundance was measured by qPCR using primers 1050 and 1051 to measure Bt fusA2, 1958, and 1959 to measure Bf fusA2, and 1956 and 1957 to measure universal 16s to normalize both genes.
sRNA binding prediction using IntaRNA
In-silico analysis of putative sRNA interactions with the Roc mRNA leader was achieved using ThetaBase v2 to identify sRNAs upregulated during carbon limitation.Citation34 Upregulated sRNAs were compared to BT4338 binding as predicted by ChIP-seq.Citation27 Candidate sRNA binding analysis was performed using IntaRNA (v3.3.1) at default settings using the Vienna RNA package (2.5.0).Citation67
Statistical analysis
All data analysis was performed using Prism v9.3.1 (GraphPad, San Diego, California, USA). Western blot, ChIP, and qPCR experiments were conducted independently in at least biological triplicate. Data were expressed as mean ± standard error of the mean (SEM) and analyzed by one- or two-way ANOVA with Fisher’s Least Significant Difference test, or paired, two-tailed Student’s t-test where indicated and P values < 0.05 were statistically significant. Growth curves and in vivo bacterial abundance experiments were expressed as mean ± SEM with no additional statistical analysis conducted. Specific statistical tests, significance, and n are indicated in each figure legend.
Supplemental Material
Download MS Word (868.7 KB)Acknowledgments
We thank Townsend lab members, Jennifer L. Modesto and Asia Poudel, for generating reagents and thoughtful advice during manuscript preparation. We thank Bentley Lim for advice in designing and executing genetic manipulations. Plasmids pSIE1 and pRK231 were gifts from Andrew Goodman and pLGB13 was a gift from Laurie Comstock (Addgene plasmid #126618; http://n2t.net/addgene:126618; RRID:Addgene_126618). We thank Michelle Irish and Jacob Perryman for their assistance performing animal experiments at the Penn State gnotobiotic facility. Additionally, we thank Jordan Bisanz for assistance preparing animal inoculums.
Disclosure statement
No potential conflict of interest was reported by the author(s).
Data availability statement
The authors confirm that data supporting the findings in this study are available within the article and the indicated supplementary materials. Specific data points are openly available at doi: 10.17632/md44b9h2r5.1.
Supplementary material
Supplemental data for this article can be accessed online at https://doi.org/10.1080/19490976.2023.2221484
Additional information
Funding
References
- Matijašić M, Meštrović T, Perić M, Čipčić Paljetak H, Panek M, Vranešić Bender D, Ljubas Kelečić D, Krznarić Ž, Verbanac D. Modulating composition and metabolic activity of the gut microbiota in IBD patients. Int J Mol Sci. 2016;17(4):1–19. PubMed Central PMCID: PMC4849034. doi:10.3390/ijms17040578.
- Frank DN, St. Amand AL, Feldman RA, Boedeker EC, Harpaz N, Pace NR. Molecular-phylogenetic characterization of microbial community imbalances in human inflammatory bowel diseases. Proc Natl Acad Sci U S A. 2007;104(34):13780–13785. PubMed Central PMCID: PMC1959459. doi:10.1073/pnas.0706625104.
- Ott SJ, Musfeldt M, Wenderoth DF, Hampe J, Brant O, Fölsch UR, Timmis KN, Schreiber S. Reduction in diversity of the colonic mucosa associated bacterial microflora in patients with active inflammatory bowel disease. Gut. 2004;53(5):685–693. PubMed Central PMCID: PMC1774050. doi:10.1136/gut.2003.025403.
- Kowalska-Duplaga K, Gosiewski T, Kapusta P, Sroka-Oleksiak A, Wędrychowicz A, Pieczarkowski S, Ludwig-Słomczyńska AH, Wołkow PP, Fyderek K. Differences in the intestinal microbiome of healthy children and patients with newly diagnosed Crohn’s disease. Sci Rep. 2019;9(1):1–11. PubMed Central PMCID: PMC6906406. doi:10.1038/s41598-019-55290-9.
- Liu W, Zhang R, Shu R, Yu J, Li H, Long H, Jin S, Li S, Hu Q, Yao F, et al. Study of the relationship between microbiome and colorectal cancer susceptibility using 16SrRNA sequencing. Hindawi Biomed Res Int. 2020;2020:1–17. PubMed Central PMCID: PMC7011317. doi:10.1155/2020/7828392.
- Milani C, Ticinesi A, Gerritsen J, Nouvenne A, Lugli GA, Mancabelli L, Turroni F, Duranti S, Mangifesta M, Viappiani A, et al. Gut microbiota composition and clostridium difficile infection in hospitalized elderly individuals: a metagenomic study. Sci Rep. 2016;6(1):1–12. PubMed Central PMCID: PMC4863157. doi:10.1038/srep25945.
- Mathew S, Smatti MK, Al Ansari K, Nasrallah GK, Al Thani AA, Yassine HM. Mixed viral-bacterial infections and their effects on gut microbiota and clinical illnesses in children. Sci Rep. 2019;9(1):1–12. PubMed Central PMCID: PMC6351549. doi:10.1038/s41598-018-37162-w.
- Rao SSC, Rehman A, Yu S, de Andino NM. Brain fogginess, gas and bloating: a link between SIBO, probiotics and metabolic acidosis. Clin Transl Gastroenterol. 2018;9(6):1–9. PubMed Central PMCID: PMC6006167. doi:10.1038/s41424-018-0030-7.
- Desai MS, Seekatz AM, Koropatkin NM, Kamada N, Hickey CA, Wolter M, Pudlo NA, Kitamoto S, Terrapon N, Muller A, et al. A dietary fiber-deprived gut microbiota degrades the colonic mucus barrier and enhances pathogen susceptibility. Cell. 2016;167(5):1339–1353.e21. PubMed Central PMCID: PMC5131798. doi:10.1016/j.cell.2016.10.043.
- Shahanshah Khan SW, Godfrey V, Abdul Wadud Khan M, Ramachandran RA, Cantarel BL, Behrendt C, Peng L, Hooper LV, Zaki H, Zaki H. Dietary simple sugars alter microbial ecology in the gut and promote colitis in mice. Sci Transl Med. 2020;12(567). doi: 10.1126/scitranslmed.aay6218.
- David LA, Maurice CF, Carmody RN, Gootenberg DB, Button JE, Wolfe BE, Ling AV, Devlin AS, Varma Y, Fischbach MA, et al. Diet rapidly and reproducibly alters the human gut microbiome. Nature. 2014 Jan 23;505(7484):559–563. PubMed Central PMCID: PMC3957428. doi:10.1038/nature12820.
- Wu M, McNulty NP, Rodionov DA, Khoroshkin MS, Griffin NW, Cheng J, Latreille P, Kerstetter RA, Terrapon N, Henrissat B, et al. Genetic determinants of in vivo fitness and diet responsiveness in multiple human gut Bacteroides. Science. 2015;350(6256). PubMed Central PMCID: PMC4608238. doi:10.1126/science.aac5992.
- Shepherd ES, DeLoache WC, Pruss KM, Whitaker WR, Sonnenburg JL. An exclusive metabolic niche enables strain engraftment in the gut microbiota. Nature. 2018 May;557(7705):434–438. PubMed Central PMCID: PMC6126907. doi:10.1038/s41586-018-0092-4.
- Pudlo NAU, Karthik C, Ryan P, Ali A, Todd J, Roberto T, Nicolas H, Bernard P, Daniel Z, Cherie S, et al. Phenotypic and genomic diversification in complex carbohydrate-degrading human gut bacteria. mSystems. 2022;7(1). PubMed Central PMCID: PMC8845570. doi:10.1128/msystems.00947-21.
- Bjursell MK, Martens EC, Gordon JI. Functional genomic and metabolic studies of the adaptations of a prominent adult human gut symbiont, Bacteroides thetaiotaomicron, to the suckling period. J Biol Chem. 2006;281(47):36269–36279. doi:10.1074/jbc.M606509200.
- Martens EC, Chiang HC, Gordon JI. Mucosal glycan foraging enhances fitness and transmission of a saccharolytic human gut bacterial symbiont. Cell Host & Microbe. 2008 Nov 13;4(5):447–457. PubMed Central PMCID: PMC2605320. doi:10.1016/j.chom.2008.09.007.
- Sonnenburg ED, Zheng H, Joglekar P, Higginbottom SK, Firbank SJ, Bolam DN, Sonnenburg JL. Specificity of polysaccharide use in intestinal bacteroides species determines diet-induced microbiota alterations. Cell. 2010;141(7):1241–1252. PubMed Central PMCID: PMC2900928. doi:10.1016/j.cell.2010.05.005.
- Zmora N, Suez J, Elinav E. You are what you eat: diet, health and the gut microbiota. Nat Rev Gastroenterol Hepatol. 2019 Jan;16(1):35–56. doi:10.1038/s41575-018-0061-2.
- Townsend GE, Han W, Schwalm ND, Raghavan V, Barry NA, Goodman AL, Groisman EA. Dietary sugar silences a colonization factor in a mammalian gut symbiont. Proc Natl Acad Sci USA. 2018;116(1):233–238. PubMed Central PMCID: PMC6320540. doi:10.1073/pnas.1813780115.
- Wegorzewska MM, Glowacki RWP, Hsieh SA, Donermeyer DL, Hickey CA, Horvath SC, Martens EC, Stappenbeck TS, Allen PM. Diet modulates colonic T cell responses by regulating the expression of a Bacteroides thetaiotaomicron antigen. Sci Immunol. 2019;4(32):1–13. PubMed Central PMCID: PMC6550999. doi:10.1126/sciimmunol.aau9079.
- Sonnenburg ED, Sonnenburg JL, Manchester JK, Hansen EE, Chiang HC, Gordon JI. A hybrid two-component system protein of a prominent human gut symbiont couples glycan sensing in vivo to carbohydrate metabolism. Proc Natl Acad Sci U S A. 2006;103(23):8834–8839. PubMed Central PMCID: PMC1472243. doi:10.1073/pnas.0603249103.
- Townsend GE, Raghavan V, Zwir I, Groisman EA. Intramolecular arrangement of sensor and regulator overcomes relaxed specificity in hybrid two-component systems. Proc Natl Acad Sci U S A. 2013;110(2):E161–E169. PubMed Central PMCID: PMC3545799. doi:10.1073/pnas.1212102110.
- Cordain LE, Boyd S, Sebastian A, Mann N, Lindeberg S, Watkins BA, O’Keefe JH, Brand-Miller J. Origins and evolution of the western diet: health implications for the 21st century [Commentary]. Am J Clin Nutr. 2005 Feb 1; 81(2):341–354. doi:10.1093/ajcn.81.2.341.
- Fajstova A, Galanova N, Coufal S, Malkova J, Kostovcik M, Cermakova M, Pelantova H, Kuzma M, Sediva B, Hudcovic T, et al. Diet rich in simple sugars promotes pro-inflammatory response via gut microbiota alteration and TLR4 signaling. Cells. 2020 Dec 16;9(12):2701. PubMed Central PMCID: PMC7766268. doi:10.3390/cells9122701.
- Kawano Y, Edwards M, Huang Y, Bilate AM, Araujo LP, Tanoue T, Atarashi K, Ladinsky MS, Reiner SL, Wang HH, et al. Microbiota imbalance induced by dietary sugar disrupts immune-mediated protection from metabolic syndrome. Cell. 2022 Sep 15;185(19):3501–3519 e20. PubMed Central PMCID: PMC9556172. doi:10.1016/j.cell.2022.08.005.
- Schwalm ND, Townsend GE, Groisman EA, Comstock LE, Shuman HA. Multiple signals govern utilization of a polysaccharide in the gut bacterium Bacteroides thetaiotaomicron. mBio. 2016;7(5):1–9. PubMed Central PMCID: PMC5061871. doi:10.1128/mbio.01342-16.
- Townsend GE, Han W, Schwalm ND, Hong X, Bencivenga-Barry NA, Goodman AL, Groisman EA. A master regulator of bacteroides thetaiotaomicron gut colonization controls carbohydrate utilization and an alternative protein synthesis factor. mBio. 2020;11(1):1–14. PubMed Central PMCID: PMC6989115. doi:10.1128/mBio.03221-19.
- Schwalm ND, Townsend GE, Groisman EA. Prioritization of polysaccharide utilization and control of regulator activation in Bacteroides thetaiotaomicron. Mol Microbiol. 2017;104(1):32–45. doi:10.1111/mmi.13609.
- Glowacki RWP, Pudlo NA, Tuncil Y, Luis AS, Sajjakulnukit P, Terekhov AI, Lyssiotis CA, Hamaker BR, Martens EC. A ribose-scavenging system confers colonization fitness on the human gut symbiont bacteroides thetaiotaomicron in a diet-specific manner. Cell Host & Microbe. 2020;27(1):79–92.e9. PubMed Central PMCID: PMC7031954. doi:10.1016/j.chom.2019.11.009.
- Martens EC, Lowe EC, Chiang H, Pudlo NA, Wu M, McNulty NP, Abbott DW, Henrissat B, Gilbert HJ, Bolam DN, et al. Recognition and degradation of plant cell wall polysaccharides by two human gut symbionts. PLoS Biol. 2011;9(12):e1001221. PubMed Central PMCID: PMC3243724. doi:10.1371/journal.pbio.1001221.
- Lowe EC, Basle A, Czjzek M, Firbank SJ, Bolam DN. A scissor blade-like closing mechanism implicated in transmembrane signaling in a Bacteroides hybrid two-component system. Proc Natl Acad Sci U S A. 2012 May 8;109(19):7298–7303. PubMed Central PMCID: PMC3358863. doi:10.1073/pnas.1200479109.
- Ryan D, Jenniches L, Reichardt S, Barquist L, Westermann AJ. A high-resolution transcriptome map identifies small RNA regulation of metabolism in the gut microbe Bacteroides thetaiotaomicron. Nat Commun. 2020;11(1). PubMed Central PMCID: PMC7366714. doi:10.1038/s41467-020-17348-5.
- Cao Y, Förstner KU, Vogel J, Smith CJ. Cis-encoded small RNAs, a conserved mechanism for repression of polysaccharide utilization in Bacteroides. J Bacteriol. 2016;198(18):2410–2418. PubMed Central PMCID: PMC4999932. doi:10.1128/JB.00381-16.
- Ryan D, Bornet E, Prezza G, Alampalli SV, de Carvalho TF, Felchle H, Ebbecke T, Hayward R, Deutschbauer AM, Barquist L, Westermann AJ. An integrated transcriptomics-functional genomics approach reveals a small RNA that modulates Bacteroides thetaiotaomicron sensitivity to tetracyclines. bioRxiv. 2023 Feb 16. PubMed Central PMCID: PMC9949090. doi:10.1101/2023.02.16.528795.
- Adams AND, Azam MS, Costliow ZA, Ma X, Degnan PH, Vanderpool CK. A novel family of RNA-Binding proteins regulate polysaccharide metabolism in Bacteroides thetaiotaomicron. J Bacteriol. 2021 Oct 12;203(21):e0021721. PubMed Central PMCID: PMC8508124. doi:10.1128/JB.00217-21.
- Krypotou E, Townsend GE, Gao X, Tachiyama S, Liu J, Pokorzynski ND, Goodman AL, Groisman EA. Bacteria require phase separation for fitness in the mammalian gut. Science. 2023 Mar 17;379(6637):1149–1156. PubMed Central PMCID: PMC10148683. doi:10.1126/science.abn7229.
- Krinos CMC, Michael J, Weinacht K, Tzianabos G, Arthur O, Kasper DL, Comstock LE. Extensive surface diversity of a commensal microorganism by multiple DNA inversions. Nature. 2001;414(6863):555–558. doi:10.1038/35107092.
- Cerdeńo-Tãrraga AM, Patrick S, Crossman LC, Blakely G, Abratt V, Lennard N, Poxton I, Duerden B, Harris B, Quail MA, et al. Extensive DNA inversions in the B. fragilis genome control variable gene expression. Science. 2005 Mar 4;307(5714):1463–1465. PubMed PMID: 15746427. doi:10.1126/science.1107008.
- Cho KH, Cho D, Wang GR, Salyers AA. New regulatory gene that contributes to control of Bacteroides thetaiotaomicron starch utilization genes. J Bacteriol. 2001 Dec;183(24):7198–7205. PubMed Central PMCID: PMC95569. doi:10.1128/JB.183.24.7198-7205.2001.
- Han W, Peng BZ, Wang C, Townsend GE, Barry NA, Peske F, Goodman AL, Liu J, Rodnina MV, Groisman EA. Gut colonization by Bacteroides requires translation by an EF-G paralog lacking GTPase activity. EMBO J. 2022 Dec 6:e112372. PubMed Central PMCID: PMC9841332. doi:10.15252/embj.2022112372.
- Ravcheev DA, Godzik A, Osterman AL, Rodionov DA. Polysaccharides utilization in human gut bacterium Bacteroides thetaiotaomicron: comparative genomics reconstruction of metabolic and regulatory networks. Bmc Genom. 2013;14(1):1–17. PubMed Central PMCID: PMC3878776. doi:10.1186/1471-2164-14-873.
- Modesto JL, Pearce VH, Townsend GE. 2nd Harnessing gut microbes for glycan detection and quantification. Nat Commun. 2023 Jan 17;14(1):275. PubMed Central PMCID: PMC9845299. doi:10.1038/s41467-022-35626-2.
- Terrapon N, Lombard V, Drula E, Lapébie P, Al-Masaudi S, Gilbert HJ, Henrissat B. PULDB: the expanded database of polysaccharide utilization loci. Nucleic Acids Res. 2018 Jan 4;46(D1):D677–D683. PubMed Central PMCID: PMC5753385. doi:10.1093/nar/gkx1022.
- Busby SE, Richard H. Transcription activation by catabolite activator protein (CAP). J Mol Biol. 1999;293(2):199–213. doi:10.1006/jmbi.1999.3161.
- Iyer R, Baliga NS, Camilli A. Catabolite control protein a (CcpA) contributes to virulence and regulation of sugar metabolism in streptococcus pneumoniae. J Bacteriol. 2005 Dec;187(24):8340–8349. PubMed Central PMCID: PMC1317011. doi:10.1128/JB.187.24.8340-8349.2005.
- Deutscher J, Francke C, Postma PW. How phosphotransferase system-related protein phosphorylation regulates carbohydrate metabolism in bacteria. Microbiol Mol Biol Rev. 2006 Dec;70(4):939–1031. PubMed Central PMCID: PMC1698508. doi:10.1128/MMBR.00024-06.
- Siegel LS, Hylemon PB, Phibbs PV. Cyclic adenosine 3‘,5’-monophosphate levels and activities of adenylate cyclase and cyclic adenosine 3‘,5’-monophosphate phosphodiesterase in pseudomonas and Bacteroides. J Bacteriol. 1977;129(1):87–96. PubMed Central PMCID: PMC234899. doi:10.1128/jb.129.1.87-96.1977.
- Han S, Van Treuren W, Fischer CR, Merrill BD, DeFelice BC, Sanchez JM, Higginbottom SK, Guthrie L, Fall LA, Dodd D, et al. A metabolomics pipeline for the mechanistic interrogation of the gut microbiome. Nature. 2021 Jul;595(7867):415–420. PubMed Central PMCID: PMC8939302. doi:10.1038/s41586-021-03707-9.
- Liu H, Shiver AL, Price MN, Carlson HK, Trotter VV, Chen Y, Escalante V, Ray J, Hern KE, Petzold CJ. et al. Functional genetics of human gut commensal Bacteroides thetaiotaomicron reveals metabolic requirements for growth across environments. Cell Rep. 2021 Mar 2;34(9):108789. PubMed Central PMCID: PMC8121099. doi:10.1016/j.celrep.2021.108789.
- Goodman AL, McNulty NP, Zhao Y, Leip D, Mitra RD, Lozupone CA, Knight R, Gordon JI. Identifying genetic determinants needed to establish a human gut symbiont in its habitat. Cell Host & Microbe. 2009 Sep 17;6(3):279–289. PubMed Central PMCID: PMC2895552. doi:10.1016/j.chom.2009.08.003.
- Liou CS, Sirk SJ, Diaz CAC, Klein AP, Fischer CR, Higginbottom SK, Erez A, Donia MS, Sonnenburg JL, Sattely ES, et al. A metabolic pathway for activation of dietary glucosinolates by a human gut symbiont. Cell. 2020 Feb 20;180(4):717–728.e19. PubMed Central PMCID: PMC7515767. doi:10.1016/j.cell.2020.01.023.
- Wexler AG, Goodman AL. An insider’s perspective: Bacteroides as a window into the microbiome. Nat Microbiol. 2017;2(April):1–11. PubMed Central PMCID: PMC5679392. doi:10.1038/nmicrobiol.2017.26.
- Crouch LI, Liberato MV, Urbanowicz PA, Baslé A, Lamb CA, Stewart CJ, Cooke K, Doona M, Needham S, Brady RR. et al. Prominent members of the human gut microbiota express endo-acting O-glycanases to initiate mucin breakdown. Nat Commun. 2020 Aug 11;11(1):4017. PubMed Central PMCID: PMC7419316. doi:10.1038/s41467-020-17847-5.
- Raghavan V, Lowe EC, Townsend GE, Bolam DN, Groisman EA. Tuning transcription of nutrient utilization genes to catabolic rate promotes growth in a gut bacterium. Mol Microbiol. 2014 Sep;93(5):1010–1025. doi:10.1111/mmi.12714.
- Pudlo NA, Urs K, Kumar SS, German JB, Mills DA, Martens EC. Symbiotic human gut bacteria with variable metabolic priorities for host mucosal glycans. mBio. 2015;6(6):e01282–15. PubMed Central PMCID: PMC4659458. doi:10.1128/mBio.01282-15.
- Degnan PH, Barry NA, Mok KC, Taga M, Goodman A. Human gut microbes use multiple transporters to distinguish vitamin B12 analogs and compete in the gut. Cell Host & Microbe. 2014 Jan 15;15(1):47–57. PubMed Central PMCID: PMC3923405. doi:10.1016/j.chom.2013.12.007.
- Costliow ZA, Degnan PH, Vanderpool CK. Thiamine pyrophosphate riboswitches in Bacteroides species regulate reanscription or translation of tiamine transport and biosynthesis genes. bio Rxiv. 2019. doi:10.1101/867226.
- Costliow ZA, Degnan PH. Thiamine acquisition strategies impact metabolism and competition in the gut microbe Bacteroides thetaiotaomicron. mSystems. 2017;2(5). PubMed Central PMCID: PMC5613172. doi:10.1128/msystems.00116-17.
- King AM, Vanderpool CK, PH D, Ellermeier CD. sRNA target prediction organizing tool (SPOT) integrates computational and experimental data to facilitate functional characterization of bacterial small RNAs. mSphere. 2019 Jan 30;4(1). PubMed Central PMCID: PMC6354806. doi:10.1128/mSphere.00561-18.
- Donaldson GP, Chou WC, Manson AL, Rogov P, Abeel T, Bochicchio J, Ciulla D, Melnikov A, Ernst PB, Chu H, et al. Spatially distinct physiology of Bacteroides fragilis within the proximal colon of gnotobiotic mice. Nat Microbiol. 2020;5(5):746–756. PubMed Central PMCID: PMC7426998. doi:10.1038/s41564-020-0683-3.
- Comstock LE, Silhavy TJ. Small RNAs repress expression of polysaccharide utilization loci of gut Bacteroides species. J Bacteriol. 2016;198(18):2396–2398. PubMed Central PMCID: PMC4999925. doi:10.1128/jb.00514-16.
- McCown PJ, Corbino KA, Stav S, Sherlock ME, Breaker RR. Riboswitch diversity and distribution. RNA. 2017 Jul;23(7):995–1011. PubMed Central PMCID: PMC5473149. doi:10.1261/rna.061234.117.
- Bencivenga-Barry NA, Lim B, Herrera CM, Trent MS, Goodman AL. Genetic manipulation of wild human gut bacteroides. J Bacteriol. 2020;202(3). PubMed Central PMCID: PMC6964735. doi:10.1128/JB.00544-19.
- García-Bayona L, Comstock LE, Lemon KP. Streamlined genetic manipulation of diverse bacteroides and parabacteroides isolates from the human gut microbiota. mBio. 2019;10(4). PubMed Central PMCID: PMC6692515. doi:10.1128/mBio.01762-19.
- Koropatkin NM, Martens EC, Gordon JI, Smith TJ. Starch catabolism by a prominent human gut symbiont is directed by the recognition of amylose helices. Structure. 2008 Jul;16(7):1105–1115. PubMed Central PMCID: PMC2563962. doi:10.1016/j.str.2008.03.017.
- Perez JC, Shin D, Zwir I, Latifi T, Hadley TJ, Groisman EA. Evolution of a bacterial regulon controlling virulence and Mg(2+) homeostasis. PLoS Genet. 2009 Mar;5(3):e1000428. PubMed Central PMCID: PMC2650801. doi:10.1371/journal.pgen.1000428.
- Mann M, Wright PR, Backofen R. IntaRNA 2.0: enhanced and customizable prediction of RNA-RNA interactions. Nucleic Acids Res. 2017 Jul 3;45(W1):W435–W439. PubMed Central PMCID: PMC5570192. doi:10.1093/nar/gkx279.