
ABSTRACT
Current evidence indicates that the next-generation probiotic Akkermansia muciniphila (A. muciniphila) has therapeutic potential for nonalcoholic fatty liver disease (NAFLD), especially its inflammatory stage known as nonalcoholic steatohepatitis (NASH). However, the mechanisms of A. muciniphila in NASH prevention remain unknown. Here, A. muciniphila supplementation prevented hepatic inflammation in high-fat diet-induced NASH mice, characterized by reduced hepatic proinflammatory macrophages (M1) and γδT and γδT17 cells. Consistently, hepatic M1 and γδT cells were enriched in biopsy-proven NASH patients and high-fat/high-carbohydrate diet-induced NASH mice. Antibiotics reduced hepatic M1, γδT and γδT17 cells in NASH mice. Furthermore, A. muciniphila inhibited intestinal barrier disruption and accordingly downregulated hepatic Toll-like receptor 2 (TLR2) expression in NASH mice. The activation of TLR2 by lipoteichoic acid enriched hepatic γδT17 cells (not M1) in normal diet-fed mice and neutralized the γδT cell-lowering and liver inflammation-protecting effects of A. muciniphila in NASH mice. Additionally, activated γδT cells could promote macrophage polarization via IL−17. Our study first supported that A. muciniphila prevented NASH by modulating TLR2-activated γδT17 cells and further macrophage polarization, facilitating clinical therapeutic applications.
Introduction
Nonalcoholic fatty liver disease (NAFLD) is the hepatic manifestation of metabolic syndrome,Citation1 and has become a major epidemic liver disease worldwide.Citation2 NAFLD, especially its ‘inflammatory’ phenotype, nonalcoholic steatohepatitis (NASH), increases the risk of cirrhosis and further hepatocellular carcinoma. However, the understanding of the pathogenesis remains limited. Hepatic inflammation in NAFLD can be initiated by multiple mechanisms.Citation3 Previous evidence has regarded innate immune signaling as a driving force in NAFLD progression.Citation4 Given the unique anatomy of the enterohepatic circulation, the intestinal barrier serves as an important first-line guardian against microbiota-derived molecules entering the blood. Intestinal barrier dysfunction and the subsequent innate immune response activated by gut-derived signals have been reported to contribute to the development of NAFLD.Citation4,Citation5
Sound evidence supports the important role of two innate immune cell types, namely, macrophages and γδT cells, in NASH.Citation6,Citation7 For example, γδT cells, which account for 15% to 25% of total intrahepatic T cells,Citation8 can enhance the adaptive immune response by producing IL−17 (γδT17).Citation9 and promoting diet-induced NASH.Citation7 Interestingly, several studies have reported a close correlation between the gut microbiota and the activation of macrophages.Citation6 or γδT cells.Citation10 To date, the specific mechanism by which gut microbial signaling activates the hepatic innate immune response in NAFLD remains unclear.
Indeed, microbiota-derived molecules, which are either produced or metabolized by the gut microbiota, are major intermediates in the dialogue between immune cells and the host.Citation11 Classically, pathogen-associated molecular patterns (PAMPs) of the microbiota, including endotoxin, peptidoglycan (ligands of Toll-like receptor 2, TLR2), and lipid antigen, are recognized by the immune cells of the host and further trigger the innate immune system.Citation12 In addition, emerging data demonstrate that microbial metabolites, especially short-chain fatty acids (SCFAs), tryptophan metabolites, and bile acids (BAs), are implicated in immune system functions.Citation13 Hence, identifying the microbiota-derived molecules that trigger liver inflammation in the transition process to NASH is a noteworthy research direction in this field.
Notably, Akkermansia muciniphila (A. muciniphila), a genus of Verrucomicrobia, has recently been shown to protect intestinal barrier function. Given its intestinal barrier-promoting efficacy, A. muciniphila has the potential to prevent metabolic or inflammatory diseases such as T1DM,Citation14 obesity,Citation15 atherosclerosis,Citation16 and alcoholic steatohepatitis.Citation17 A. muciniphila has also been reported to ameliorate metabolic disorders in high-fat diet (HFD)-fed mice.Citation15,Citation18 Supplementation with pasteurized A. muciniphila could improve the metabolic parameters in overweight and obese human volunteers.Citation19 The connection between the gut microbiota and the hepatic immune response has been reported.Citation20,Citation21 However, its beneficial role in protecting against liver inflammation in NAFLD is rarely mentioned.
Hence, our study investigated the immune mechanism of A. muciniphila in preventing HFD-induced NASH and explored the dialog between gut microbiota-derived molecules and the hepatic immune response.
Results
A. muciniphila inhibited the HFD-induced NASH in mice
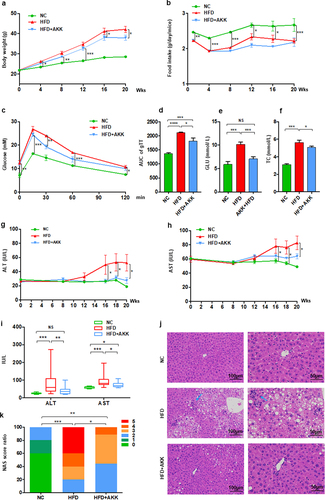
The baseline serum biochemistry profile data, including ALT, AST, TC, TG, LDL-C, HDL-C and GLU, showed no significant differences among the three groups of mice (Figure S1), which indicated the normalization of the basal condition among the groups. The mice exhibited an obvious increased body weight after four weeks high-fat diet (HFD) but a decreased food intake when compared with those fed control chow (). Then, A. muciniphila obviously reduced body weight but had no effects on food intake of HFD group mice at the 16th weeks of the experiment. The results of our study indicated that the body weight-decreasing effect of A. muciniphila was independent of food intake. Additionally, the biochemical test results at the 8th weeks showed that HFD induced an increase in serum GLU and TC levels, but were not improved by A. muciniphila (Figure S2a, b). At the 11th weeks, A. muciniphila treatment significantly improved the response to glucose administration, reflected in the decrease in blood glucose levels at 30 min and the AUC of the GTT (). At the 12th weeks, A. muciniphila improved the levels of serum GLU but not TC in model mice (Figure S2c, d). At the 18th weeks, both GLU and TC in model mice were reversed by A. muciniphila (). Further at twenty weeks, the increased ALT and AST levels (), increased liver steatosis and inflammatory cell infiltration (), and elevated NAFLD activity score (NAS) () were found in model mice compared to those of control mice, which were noteworthy improved by the A. muciniphila treatment (. Additionally, the histopathological analysis presented that the A. muciniphila decreased the lipid accumulation in liver of model mice (Supplementary Figure S2e). But we did not find obvious difference in genes involving in the fatty acid metabolism by RNA-seq analysis. At the 26th week, A. muciniphila treatment slightly improved the hepatic fibrosis in model mice (Supplementary Figure S3), which showed the protective effect of A. muciniphila on liver injury presenting with a time-dependent manner. Thus, these results of the study supported an effect of A. muciniphila against metabolic disorders and steatohepatitis in HFD-fed NASH model mice.
Figure 1. Akkermansia muciniphila protected against NASH in high-fat-diet mice. The body weight (a) and food intake (b) of mice were recorded. The blood glucose levels (c) and area under the curve (AUC) of the glucose tolerance test (GTT) at the 11th week (d) were recorded. The levels of fasting glucose (e) and TC (f) in serum were examined by biochemical tests at 18 weeks. (g-i) the levels of serum ALT and AST were measured at 8, 12, 16, 18 and 20 weeks. Data are shown as the mean ± SEM or the median with interquartile range. (j) Representative images of hepatic hematoxylin & eosin (H&E) staining. Scale bar, ×200 (left), ×400 (right). The blue arrows indicate the steatohepatitis foci of inflammation with clusters of inflammatory cells. (k) Liver NAFLD activity score (NAS) ratio. n = 8 mice/group. p values were determined using one-way ANOVA or the Kruskal‒Wallis test. *p < 0.05, **p < 0.01, ***p < 0.001. Groups: NC, normal chow control; HFD, high-fat diet; HFD + AKK, high-fat diet and oral treatment with Akkermansia muciniphila.
A. muciniphila controlled γδT accumulation and macrophage polarization in NASH model mice
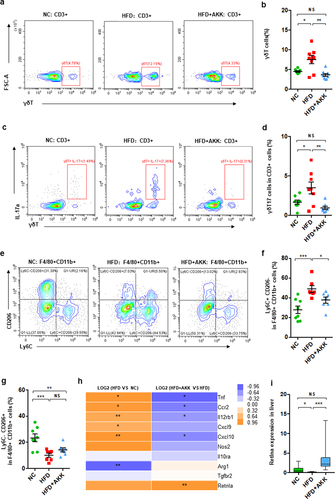
To further investigate the hepatic immune response, we isolated hepatic mononuclear cells and performed FACS in NASH mice after 20 weeks of treatment ( and Figure S4). Consistently, hepatic γδT cells (), IL−17-producing γδT cells (γδT17 cells) () and proinflammatory M1 macrophages (CD11b+ F4/80+ Ly6C+CD206−) (), together with CD3+ T cells (Figure S4a) and inflammatory NKT cells (Figure S4b), were enriched in HFD-induced NASH mice. Additionally, compared to that in control group mice, the number of anti-inflammatory M2 macrophages (CD11b+ F4/80+ Ly6C−CD206+) () was reduced in the livers of NASH mice. Importantly, A. muciniphila administration obviously protected against the accumulation of γδT cells, γδT17 cells and M1 cells but had no obvious effects on other hepatic immune cells ( and Figure S4). Additionally, liver RNA-seq analysis indicated alterations in macrophage polarization markers in HFD and HFD+AKK group mice. The livers of HFD mice showed an increase in the gene expression of M1 markers (Tnf, Ccr2, Cxcl9, and Cxcl10) and a decrease in that of an M2 marker (Arg1) compared to expression in the control group, which were partly regulated by A. muciniphila administration (). The qRT‒PCR analysis showed that when compared to that in the HFD group, cotreatment with A. muciniphila upregulated the expression of the M2 marker Retnla (). That is, γδT accumulation and macrophage polarization in the livers of NASH mice could be reversed by A. muciniphila administration.
Figure 2. Akkermansia muciniphila decreased hepatic γδT17 cells and proinflammatory macrophages in NASH mice. (a) Representative flow cytometric analysis and (b) percentages of hepatic γδT cells were quantified by flow cytometry. Plots were gated on CD3+ T cells. (c) Representative flow cytometric analysis and (d) percentages of hepatic IL − 17+ γδT cells were quantified by flow cytometry. (e) Representative flow cytometric analysis of proinflammatory macrophages (Ly6C+ CD206− cells) and anti-inflammatory macrophages (Ly6C− CD206+ cells). Plots were gated on macrophages (F4/80+ CD11b+ cells). Percentages of proinflammatory macrophages (f) and anti-inflammatory macrophages (g) among macrophages were quantified by flow cytometry. (a-g) n = 8 mice/group. (h) Heatmap of differentially expressed marker genes in macrophages between the HFD and HC groups or the HFD+AKK and HFD groups. The log2 (fold change) values were calculated from the fragments per kilobase of transcript per million (FPKM) values of RNA sequencing. n = 5 mice/group. (i) Qrt‒PCR analysis of Retlna expression in the liver. n = 8 mice/group. Data are shown as the mean ± SEM or the median with interquartile range. p values were determined using one-way ANOVA or the Kruskal‒Wallis test. *p < 0.05, ** p < 0.01, *** p < 0.001. Groups: NC, normal chow control; HFD, high-fat diet; HFD + AKK, high-fat diet and oral treatment with Akkermansia muciniphila.
Additionally, in our study, continuous administration of A. muciniphila for twenty weeks did not obviously affect body weight, food intake, glucose or lipid metabolism, as reflected by the levels of fasting GLU, GTT, TC and TG, liver enzymes (ALT and AST), and liver immune cells (such as CD45+ cells, T cells, macrophages and γδT cells) in normal diet-fed mice (Figure S5).
Hepatic macrophages and γδT cells are enriched in NASH patients
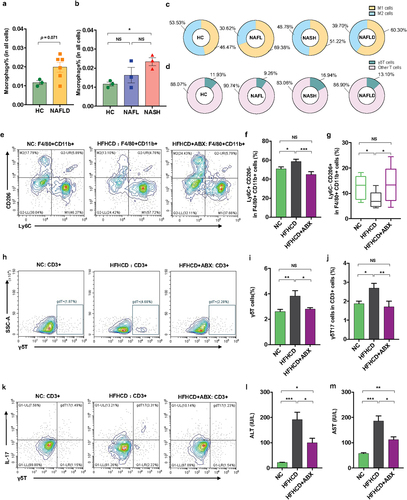
Additionally, we performed scRNA-seq to observe the changes in hepatic macrophages and γδT cells isolated from liver tissues of 9 patients (3 controls, 3 NAFL and 3 NASH patients). Analysis of typical marker genes revealed the presence of major cell populations, including B cells, T_NK cells and monocytes/macrophages (Mono_Macs), in both patient groups (Figure S6). Furthermore, according to a previous study,Citation22 we defined macrophages among clusters of monocyte/macrophage cells according to marker genes (S100A8, LYZ, S100A9, VCAN, S100A12, MARCO, CD5L, VCAM1 and CD163). The proportion of macrophages showed an increasing trend in NAFLD patients compared with controls (), while it was obviously enriched in NASH patients (), suggesting an increase in the severity of disease. More precisely, NAFLD patients (including NAFL and NASH) showed an increase in proinflammatory M1 macrophages (marker genes: S100A8, LYZ, S100A9, VCAN, S100A12, and so on) and a decrease in anti-inflammatory M2 macrophages (marker genes: MARCO, CD5L, VCAM1, CD163, and so on) (). Moreover, we defined the γδT cells within the clusters of T_NK cells according to the marker genes (GNLY, PTGDS, GZMB, FGFBP2, NKG7, PRF1, KLRF1, HOPX, KLRD1, SPON2, CLIC3, and TRDC). The NAFLD patients (especially those with NASH) showed an increased proportion of γδT cells (). Overall, NASH patients presented enrichment of hepatic proinflammatory M1 macrophages and γδT cells.
Figure 3. Hepatic γδT cells and proinflammatory macrophages were enriched in NASH patients and were controlled by antibiotics in HFHCD mice. (a and b) the percentages of hepatic macrophages were quantified by single-cell RNA sequencing. (c) the percentages of hepatic proinflammatory macrophages (M1 cells) and anti-inflammatory macrophages (M2 cells) and (d) the percentages of hepatic αβT cells and γδT cells in healthy controls and NAFL and NASH patients. Groups: HC, healthy controls, n = 3; NAFL, nonalcoholic fatty liver patients, n = 3; NASH, nonalcoholic steatohepatitis patients, n = 3. (e) Representative flow cytometric analysis of proinflammatory macrophages (Ly6C+ CD206− cells) and anti-inflammatory macrophages (Ly6C− CD206+ cells). Plots were gated on macrophages (F4/80+ CD11b+ cells). The percentages of proinflammatory macrophages (f) and anti-inflammatory macrophages (g) among macrophages were quantified by flow cytometry. (h) Representative flow cytometric analysis and (i) percentages of hepatic γδT cells were quantified by flow cytometry. Plots were gated on CD3+ T cells. (j) the percentages of hepatic IL − 17+ γδT cells were quantified by flow cytometry, and (k) representative flow cytometric analysis. n = 8 mice/group. (l and m) the levels of serum ALT and AST were measured at 18 weeks. (e-m) n = 10 mice/group. Groups: NC, normal chow control; HFHCD, high-fat high-carbohydrate diet; HFHCD + ABX, high-fat high-carbohydrate diet and oral treatment with antibiotics. Data are shown as the mean ± SEM or the median with interquartile range. p values were determined using one-way ANOVA or the Kruskal‒Wallis test. *p < 0.05, ** p < 0.01, *** p < 0.001.
Antibiotics decreased the proportion of hepatic macrophages and γδT cells in high-fat/high-carbohydrate diet-induced NASH mice.
To corroborate the changes in hepatic innate immune cells (including macrophages and γδT cells) in another mouse model of NAFLD and the role of the gut microbiota in these hepatic innate immune cells, we treated high-fat/high-carbohydrate diet (HFHCD)-fed mice with antibiotics. Consistently, the HFHCD obviously increased the proportion of hepatic proinflammatory M1 macrophages, γδT cells and γδT17 cells and reduced the proportion of anti-inflammatory M2 macrophages compared with those of control mice (). Microbial manipulation by antibiotics obviously reversed the proportion of hepatic M1, M2, γδT and γδT17 cells in HFHCD mice (). Accordingly, antibiotic treatment improved liver injury in HFHCD mice, reflected as a reduction in hepatic liver enzymes (ALT and AST) (). Thus, these results demonstrated the role of the gut microbiota in regulating hepatic macrophages and γδT cells in an NAFLD mouse mode.
A. muciniphila downregulated hepatic TLR2 expression in NASH model mice
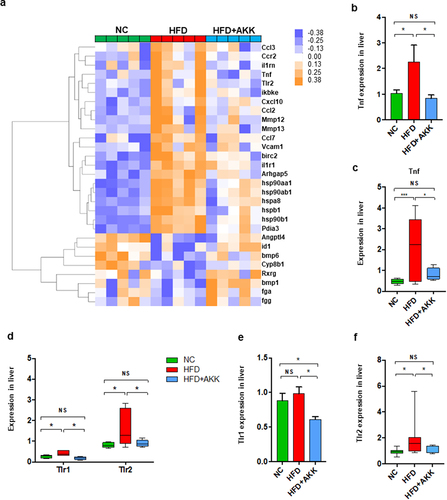
To further investigate the impacts of bacterial pathogenic components or immune metabolites on the hepatic immune response, we performed RNA sequencing (RNA-seq) analysis. The expression of hepatic inflammatory markers (such as Tnf, Ccl2, Ccl3, Ccl7, and Hsp90) was higher in HFD mice than in controls, which was partly reversed by A. muciniphila administration (). The qRT‒PCR analysis confirmed that A. muciniphila downregulated the HFD-induced enrichment of Tnf expression in the liver (). Then, we analyzed the liver gene expression of receptors that recognized the bacterial pathogenic components (such as TLRs and NODs) or immune metabolites (such as AhR, FRAR and FXR). HFD feeding enriched the gene expression of liver TLR1, TLR2, TLR3 and TLR7 and reduced that of CD1d and FXR ( and Figure S7a-i). Interestingly, both the RNA-seq and qRT‒PCR analyses confirmed that A. muciniphila only reversed the gene expression of TLR1/2 () in the livers of HFD mice. Thus, we hypothesized that the prevention efficacy of A. muciniphila on NASH might be attributed to the crosstalk between microbiota-derived TLR2 signals and hepatic macrophages or γδT cells.
Figure 4. Akkermansia muciniphila treatment decreased the hepatic expression of microbiota-related TLR2 in NASH mice. (a) the hierarchical cluster analysis of hepatic inflammation-related genes measured by RNA sequencing was based on the log2 fold change of the fragments per kilobase of transcript per million (FPKM) values in each sample divided by the group area of the NC. (b) the gene expression of hepatic TNF-α was measured by RNA sequencing. (a and b) n = 5 mice/group. (c) Qrt‒PCR analysis of TNF-α expression in the liver. n = 8 mice/group. (d) the gene expression of hepatic TLR1 and TLR2 was measured by RNA sequencing. n = 5 mice/group. (e and f) the expression of TLR1 and TLR2 in the liver was measured by Qrt‒PCR analysis. n = 8 mice/group. Data are shown as the mean ± SEM. p values were determined using one-way ANOVA. *p < 0.05, ** p < 0.01, *** p < 0.001. Groups: NC, normal chow control; HFD, high-fat diet; HFD + AKK, high-fat diet and oral treatment with Akkermansia muciniphila.
A. muciniphila promoted the flourishing of the intestinal barrier-protecting bacteria in NASH mice
We then explored the crosstalk between gut microbiota-derived signals and hepatic immune cells. First, we performed 16S rRNA gene sequencing to investigate the influence of A. muciniphila treatment on the gut microbiota. However, A. muciniphila supplementation did not regulate the commensal diversity and richness in HFD mice, as shown by the Simpson, Shannon, Chao1 and ACE indices (Figure S8a, b). The principal component analysis (PCA) plot indicated distinct clustering of microbiota composition among the groups, and the HFD+AKK group was close to the control group on PC2 (). Similar results were obtained according to the NMDS () and PCoA plot () analyses. PERMANOVA and ANOSIM highlighted an obvious difference between the HFD and control group or the HFD+AKK group (Table S1 and Figure S8c, d). Additionally, we analyzed the gene expression of colonic antibacterial peptides, which serve as the first line of defense against gut pathogens and maintain homeostasis of the gut microbiota.Citation23 Compared to the mice in the HFD group, A. muciniphila administration upregulated the gene expression of antibacterial peptides (such as Reg3a, Reg3b and Reg3g) (Figure S8e), highlighting a regulatory effect of A. muciniphila on the composition of the gut microbiota.
Figure 5. Recovery of Akkermansia muciniphila protected against intestinal barrier failure in HFD-fed NASH mice. (a) PCA score plot. (b) NMDS score plot. (c) PCoA score plot based on Bray‒Curtis distance matrices. Each spot represents one sample. Green, NC; Red, HFD; Blue, HFD+AKK. (d) Continuous monitoring to determine the colonization of Akkermansia muciniphila. (e) the relative abundance of Akkermansia muciniphila at 20 weeks was determined by qPCR. n = 8 mice/group. (f) in vivo gut permeability was determined by measurement of plasma concentrations of FITC-dextran (4 kDa) at 7, 14, and 18 weeks of treatment. (g) ELISA to measure serum LPS concentrations at 19 weeks of treatment. (a-d) n = 8 mice/group. (h and i) Quantitative analysis of mucus thickness (h) and representative image of mucin expression in the colon by immunofluorescent staining in paraffin sections (i). Muc2, green; DNA, blue. Scale bar, ×400 (left), ×800 (right). Pictures are representative of 5 biological replicates. (j) Heatmap of differentially expressed genes in the tight junction pathway between the HFD and HC groups or the HFD+AKK and HFD groups. The log2 (fold change) values were calculated from the fragments per kilobase of transcript per million (FPKM) values of RNA sequencing. n = 3/group. Data are shown as the mean ± SEM or the median with interquartile range. p values were determined using one-way ANOVA. *p < 0.05, ** p < 0.01, *** p < 0.001. Groups: NC, normal chow control; HFD, high-fat diet; HFD + AKK, high-fat diet and oral treatment with Akkermansia muciniphila.
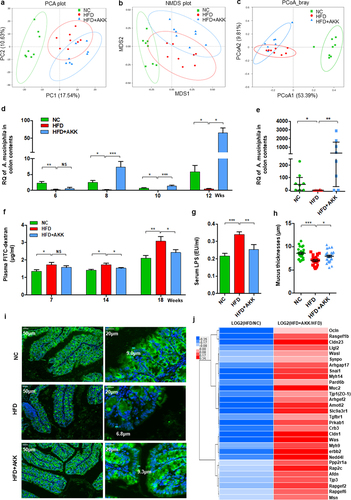
Comparisons of the microbiome composition at the phylum level showed a decrease in the abundances of Bacteroidetes and Verrucomicrobia and an increase in the abundance of Firmicutes in the HFD group compared to the control group (Figure S8f). LEfSe analysis revealed that HFD treatment enriched the relative abundance of the phylum Firmicutes, while it decreased that of the phylum Bacteroidetes and the phylum Verrucomicrobia and its subgroups, including the genus Akkermansia (Figure S8g). Notably, the phylum Firmicutes, composed of typical gram-positive bacteria,Citation24 was enriched in the gut of NASH mice (Figure S8f-h). Although A. muciniphila did not affect the relative abundance of the phylum Firmicutes in NASH mice, it caused the intestinal barrier-protecting bacteria (A. muciniphila) to flourish as assessed by continuous qPCR analysis ().
A. muciniphila enhanced intestinal barrier function in NASH mice
The emergence of A. muciniphila has been found to enhance repair of intestinal barrier failure.Citation25 Accordingly, we tested the intestinal barrier function in vivo by orally administering FITC-dextran at 7 weeks, 14 weeks and 18 weeks (). Challenge with oral administration of FITC-dextran led to an increase in intestinal permeability in HFD mice compared with controls after seven weeks of treatment (). The circulating bacterial product LPS also increased in the HFD group (), supporting intestinal barrier failure. The above damage was obviously improved by A. muciniphila administration after fourteen weeks (). Furthermore, the results of mucin immunostaining in the colon showed a loss of intestinal epithelial integrity in HFD mice compared with controls, and A. muciniphila administration promoted mucus production in HFD mice (). In addition, based on the RNA sequencing analysis, we focused on the gene expression of tight junction proteins with significant differences among the groups. HFD treatment downregulated the expression of tight junction proteins (such as Ocln, Cldn23, Muc2, ZO−1, Cldn1, and Tjp3), which was reversed by A. muciniphila administration (). These findings supported that A. muciniphila specifically rescues intestinal barrier function in HFD mice.
A. muciniphila increased the intestinal SCFA concentrations and tryptophan metabolism of NASH mice
We then explored the potential mechanism by which A. muciniphila protects the intestinal barrier. Previous studies have indicated that A. muciniphila produces SCFAs (such as propionate and acetate,Citation26 which are involved in maintaining intestinal immune homeostasis.Citation27,Citation28 We then determined the concentrations of SCFAs, including formic acid, acetic acid, propanoic acid, butyric acid, 2-methylbutyric acid, isovaleric acid and valeric acid, in the cecal contents. The concentrations of formic acid, acetic acid and propanoic acid were significantly reduced in HFD mice compared to those in the control group (). A. muciniphila supplementation induced the enrichment of propanoic acid, 2-methylbutyric acid, isovaleric acid and valeric acid and caused a trend toward an increase in formic acid, acetic acid and butyric acid in HFD mice (). The total SCFA concentration was decreased in HFD mice and reversed by supplementation (). Correspondingly, HFD obviously downregulated the gene expression of the SCFA receptor FFAR2 (GPR43) in the colon tissue, and A. muciniphila restored FFAR2 expression to the levels in the control group mice (). In addition, HFD upregulated the colonic gene expression of DPPIV, the enzyme that inactivates GLP−1, and reduced serum GLP−1 levels, which were reversed by A. muciniphila administration ().
Figure 6. Akkermansia muciniphila regulated intestinal SCFA and tryptophan metabolism in NASH mice. The concentrations of multiple (a) and total (b) SCFAs in the colonic contents were determined by GC/MS. N = 8 mice/group. (c) the gene expression of SCFA receptors in the colon was measured by RNA sequencing. N = 3 mice/group. (d) DPP4 expression in colon tissue was measured by RNA sequencing. N = 3 mice/group. (e) Serum GLP − 1 levels. n = 8 mice/group. (f) Heatmap of the differential tryptophan metabolites in feces between the HFD and HC groups or the HFD+AKK and HFD groups. The log2 (fold change) values were calculated from the normalized area values of untargeted metabolomics profiling. n = 8 mice/group. (g) the gene expression of colonic enzymes in the kynurenine pathway was measured by RNA sequencing. n = 3 mice/group. (h and i) AhR-responsive gene expression (Cyp1a1, Cyp1b1, Ahr and IL −22 r) was measured by RNA sequencing. n = 3 mice/group. Data are shown as the mean ± SEM or the median with interquartile range. p values were determined using one-way ANOVA or the Kruskal‒Wallis test. *p < 0.05, ** p < 0.01, *** p < 0.001. Groups: NC, normal chow control; HFD, high-fat diet; HFD + AKK, high-fat diet and oral treatment with Akkermansia muciniphila.
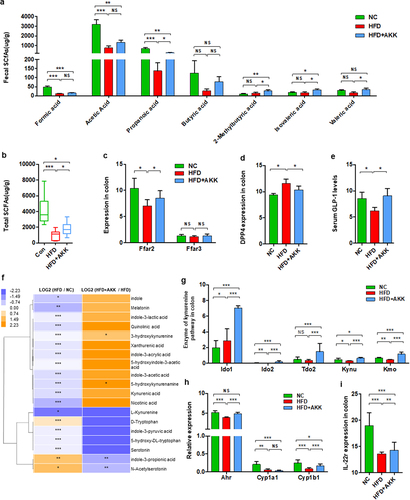
In addition to SCFAs, emerging data have demonstrated that the gut microbiota plays a role in intestinal barrier-protection through the modulating effects of metabolites including BAs and tryptophan metabolites.Citation13,Citation28 In the gut, tryptophan can be directly or indirectly metabolized by the microbiota through three major pathways: the indole pathway, kynurenine pathway and serotonin pathway.Citation29 Based on global metabolic profiling, we found that HFD treatment reduced most tryptophan metabolites in the gut, including indole, melatonin, indole−3-lactic acid, 3-hydroxykynurenine, indole−3-acetic acid, L-kynurenine, and serotonin (). Continuous administration of A. muciniphila partly reversed the levels of tryptophan metabolites, especially 3-hydroxykynurenine and 5-hydroxykynurenine (). Notably, A. muciniphila treatment upregulated the gene expression of the enzymes that mediate tryptophan degradation into kynurenine (Ido1, Ido2, Tdo2, Kynu and Kmo) in the gut of HFD mice (). We also analyzed the target genes of AhR activation (Cyp1a1, Cyp1b1 and Ahr) in the colon, together with the genes controlled by AhR activation (such as IL−22). A. muciniphila obviously reversed the gene expression of Ahr, Cyp1b1 and IL−22 in the gut of HFD mice (). That is, A. muciniphila also regulated tryptophan metabolism toward the kynurenine pathway in the gut of NASH mice. Further, we analyzed the serum levels of bile acids in NASH mice with or without A. muciniphila and normal chow control mice (Supplementary Figure S9a). Interestingly, there was a trend that the supplement of A. muciniphila only reversed the cholic acid level of the HFD-NASH mice model to the level of normal mice, but did not observe in the other bile acids. Moreover, the hepatic genes involved in BAs synthesis (Cyp7a1, Cyp7b1, Cyb8b1, Cyp27a1) were significantly decreased in HFD- NASH mice, and improved or reversed to normal levels by the supplement of A. muciniphila (Supplementary Figure S9b).
TLR2 agonist promoted hepatic γδT cell accumulation and abolished the protective effect of A. muciniphila against NASH in mice
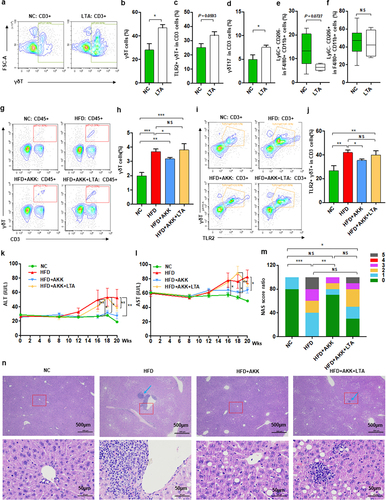
We further investigated the potential interplay between microbiota-derived TLR2 and hepatic macrophages or γδT cells via TLR2 agonist administration. Notably, lipoteichoic acid (LTA) alone enriched the proportion of liver γδT cells, TLR2+ γδT cells and γδT17 cells () but did not directly affect M1/M2 cells () in mice fed a normal chow diet. Interestingly, chronic infusion of LTA increased the proportions of liver γδT cells and TLR2+ γδT cells in A. muciniphila-treated HFD-induced NASH mice to proportions similar to those without the probiotic treated NASH mice (). TLR2 activation abolished the protective effect of A. muciniphila against HFD-induced liver injury, as demonstrated by histological analysis and measurement of blood markers for liver dysfunction (). HFD-induced NASH mice obviously were associated with the changed appearance of the liver, which exhibited a granular and yellow appearance, and was not improved by the combined treatment with A. muciniphila and LTA (Figure S10a). HE analysis and the NAS scores also revealed that chronic infusion of LTA abolished the protective effect of A. muciniphila against liver steatosis and inflammatory cell infiltration in HFD-induced NASH mice (). LTA altered the levels of ALT and AST in HFD+AKK group mice such that they were close to those in HFD group mice (), but it had no influence on food intake, body weight, TC and TG compared to those in mice in the HFD+AKK group (Figure S10b-e). LTA treatment alone did not alter the levels of ALT, AST, TC and TG in the control group mice (Figure S10f-i). Overall, our study indicated that A. muciniphila reduced hepatic inflammatory γδT cells by downregulating gut-derived TLR2 signals.
Figure 7. Akkermansia muciniphila decreased hepatic γδT cells by downregulating TLR2 in NASH mice. (a) Representative flow cytometric analysis. The percentages of hepatic γδT cells (b), IL − 17+ γδT cells (c), TLR − 2+ γδT cells (d), proinflammatory macrophages (e) and anti-inflammatory macrophages (f) after lipoteichoic acid (LTA) treatment alone were quantified by flow cytometry. Plots were gated on CD3+ T cells. n = 5 mice/group. (g) Representative flow cytometric analysis and (h) percentages of hepatic γδT cells after LTA and Akkermansia muciniphila treatment were quantified by flow cytometry. Plots were gated on CD45+ cells. (i) Representative flow cytometric analysis and (j) percentages of hepatic TLR − 2+ γδT cells were quantified by flow cytometry. Plots were gated on CD3+ T cells. (g-j) n = 8 or 5 mice/group. (k and l) the levels of serum ALT and AST were measured at 8, 12, 16, 18 and 20 weeks. (m) Representative images of hepatic hematoxylin & eosin (H&E) staining. Scale bar, ×40 (left), ×400 (right). The blue arrows indicate the steatohepatitis foci of inflammation with clusters of inflammatory cells. (n) Proportion chart diagram of the liver NAFLD activity score (NAS) ratio. Data are shown as the mean ± SEM or the median with interquartile range. p values were determined using one-way ANOVA or the Kruskal‒Wallis test. *p < 0.05, ** p < 0.01, *** p < 0.001. Groups: NC, normal chow control; HFD, high-fat diet; HFD + AKK, high-fat diet and oral treatment with Akkermansia muciniphila; HFD + AKK + LTA, high-fat diet and intraperitoneal injection with LTA and oral treatment with Akkermansia muciniphila; LTA, normal chow diet and intraperitoneal injection with LTA.
γδT cell likely interact with macrophage via IL−17 signaling
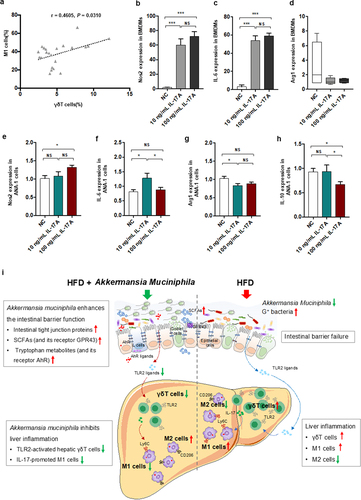
Since a modulation effect of A. muciniphila on liver inflammation via regulating γδT accumulation and macrophage polarization presenting in our NASH mice model, we measured the levels of hepatic γδT cells and M1 cells. Importantly, we found that hepatic γδT cells were positively correlated with M1 cells in our NASH mice (). These findings indicated a role of γδT cells in macrophage polarization. To further investigate whether γδT cell, a main type of IL−17-producing cell, had any regulating effect on macrophage polarization, we stimulated macrophage cells with recombinant IL−17A in vitro. We stimulated bone marrow-derived macrophage (BMDM) cells with 10 ng/mL or 100 ng/mL recombinant IL−17A. Interestingly, IL−17 significantly facilitated the gene expression of M1 markers (Nos2 and IL−6) by BMDMs () and slightly affected the gene expression of an M2 marker (Arg−1). Further to validate the interaction between IL−17 and macrophage cells, IL−17 significantly facilitated the gene expression of M1 markers (Nos2 and IL−6) and inhibited that of M2 markers (Arg−1 and IL−10) by macrophage Ana−1 cells () consistently. The results demonstrated that IL−17 could promote macrophage polarization into proinflammatory M1 cells. HFThese findings of our study supported that the activated γδT cells could promote macrophage polarization via IL−17, suggesting the direct communication between the two hepatic innate immune cells.
Figure 8. IL − 17 signals promoted macrophage polarization into proinflammatory M1 cells. (a) the relationship between hepatic γδT cells and M1 cells in HFD-induced NASH mice. n = 24 mice. Gene expression of Nos −1 (b), IL − 6 (c) and Arg −1 (d) in bone marrow-derived macrophages (BMDMs) after 10 or 100 ng/mL IL − 17 stimulation. Gene expression of Nos −1 (e), IL − 6 (f), Arg −1 (g) and IL − 10 (h) in Ana −1 cells after 10 or 100 ng/mL IL − 17 stimulation. Data are shown as the mean ± SEM or the median with interquartile range. p values were determined using one-way ANOVA or the Kruskal‒Wallis test. *p < 0.05, ** p < 0.01, *** p < 0.001. (i) Schematic showing the regulatory role of Akkermansia muciniphila in HFD-induced hepatic inflammation. Akkermansia muciniphila enriches intestinal tight junction proteins, SCFAs (and their receptor GPR43), and tryptophan metabolites (and their receptor AhR) and further enhances intestinal barrier function. Following the restoration of intestinal barrier function, Akkermansia muciniphila inhibits liver inflammation by downregulating gut-derived signals (TLR2) in the liver. Specifically, hepatic γδT cells activated by molecules of G+ bacteria (TLR2 ligands) were decreased in HFD mice. Moreover, Akkermansia muciniphila reduced IL − 17-promoted hepatic proinflammatory macrophages (M1 cells).
Discussion
First, we identified two key hepatic innate immune cells (γδT and macrophages) regulated by A. muciniphila. Then, we found that A. muciniphila protected the intestinal barrier and further downregulated microbiota-derived TLR2 signaling in the livers of NASH mice. Furthermore, by administration of a TLR2 agonist, we demonstrated that A. muciniphila reduced γδT17 cell levels by downregulating hepatic TLR2 signaling. The γδT cells contribute to macrophage polarization toward proinflammatory M1 cells via IL−17. Overall, A.muciniphila enhanced the intestinal barrier by modulating tight junction proteins and microbiota-derived metabolites, decreased hepatic γδT17 cells by downregulating TLR2, which further regulated hepatic macrophage polarization via IL−17, and finally inhibited nonalcoholic steatohepatitis (). To our knowledge, this study is the first to identify the immune-regulatory effects of A. muciniphila for NASH prevention.
In our study, A. muciniphila protected against not only glucose and lipid metabolic disorders but also liver inflammation in HFD-fed NASH mice model. The exploration on the beneficial role of A. muciniphila was mainly focused in metabolic disorders, especially glucose intolerance. In consistent with our findings, the supplementation with A. muciniphila or its extracellular vesicles tended to reverse insulin resistance and improve glucose intolerance of HFD-fed obese mice in previous studies.Citation15,Citation18,Citation30,Citation31 In agreements with our results, Kim et al. reported that A. muciniphila prevented fatty liver disease and decreased serum triglycerides.Citation32 In line with the protective effect on the liver function, previous study of Tilg et al. reported a protective effect of A. muciniphila against liver injury of alcoholic liver disease.Citation17 Importantly, the novelty of our results showed that daily oral gavage with A. muciniphila for twenty weeks could alleviate liver inflammation, and twenty-six weeks show the improving trend on liver fibrosis in HFD-fed NASH mice, which is the main clinical predictor for clinical outcome in clinical trials. Further validation studies should be conducted in several well-known diets for NASH model in rodents.
NASH is a complex disease driven by lipotoxicity and activation of the inflammation and innate immune pathways. Fatty acid metabolism change is also important for triggering the second hit-inflammation on NAFLD formation. Although A. muciniphila did not regulate the genes of fatty acid metabolism such as de novo lipogenesis, oxidation, transplantation, the A. muciniphila decreased the body weight and hepatic lipid accumulation in our HFD-fed NASH mice. Despite the unchanged hepatic genes of fatty acid metabolism, the improvement in hepatic steatosis and inflammation by A. muciniphila supplementation are likely not independent of weight loss,Citation33,Citation34 which could help head off lasting damage caused by NAFLD. Our data supported that oral supplementation of A. muciniphila is a promising prevention strategy for NASH liver inflammation. But we did not find the evidence for the link between weight loss and hepatic γδT17 cells/macrophages of A. muciniphila treated mice in the study, the exact mechanism of which is worthy of further study.
Notably, we identified two immune cell groups, namely, macrophages and γδT cells, that were enriched in NASH and reduced by A. muciniphila. The findings indicated that the effect of A. muciniphila on NASH might be attributed to the modulation on immune microenvironment. Macrophages.Citation6 and γδT cells.Citation7,Citation10 have been demonstrated to be important promotors of steatohepatitis. For example, macrophage depletion protected against the development of steatosis in mice fed a HFD or high-sucrose diet.Citation35 In addition, TCRδ knockout mice displayed reduced steatohepatitis in an HFD/HFHCD-induced NAFLD model.Citation10 Interestingly, we observed that A. muciniphila administration specifically reduced hepatic γδT (γδT17) cells and M1 cells in the livers of NASH mice. At present, studies have reported the regulatory effect of A. muciniphila on macrophages but not γδT cells. For example, A. muciniphila reduced macrophage infiltration in the colon.Citation36 Nevertheless, our study and other studies also confirmed that the gut microbiota regulates the pool of hepatic γδT17 cells in HFD-fed mice or normal chow diet-fed.Citation10 mice via antibiotic administration. Thus, we provided evidence that A. muciniphila downregulated hepatic γδT (γδT17) and M1 cells, which further contributed to NASH prevention.
Given the close association between the gut microbiota and two hepatic immune cells (γδT17 and M1 cells) demonstrated by antibiotics treatment, we investigated the changes in microbiota-related signals in the liver of NASH and identified the key molecule TLR2 that was downregulated by A. muciniphila. Similarly, live and pasteurized A. muciniphila (including its AmEVs) were also reported to reduce hepatic TLR2 expression in HFD/CCl4-induced fibrotic mice.Citation37 A previous study reported that TLR2 knockout could suppress NASH progression.Citation38 Hence, we then explored whether hepatic immune cells (γδT17 and M1 cells) were activated by TLR2 signaling in NASH mice. Our results demonstrated that the gut-derived signal TLR2 could activate hepatic γδT cells (not M1 cells), and A. muciniphila inhibited hepatic γδT cell accumulation via TLR2 in NASH mice. γδT cells can be activated by antigen-presenting cell-released cytokines (such as IL−23),Citation39,Citation40 as well as microbiota-derived pathogen-associated molecular patterns (PAMPs), such as lipid antigens and LPS.Citation10,Citation41 However, our study showed that A. muciniphila did not decrease the typical PAMP receptors, including CD−1d, NOD−1 and TLR4, but did decrease TLR2. TLR2 ligand has been demonstrated to induce a high number of γδT cells derived from lymphocytes in vivo and vitro.Citation41 That is, A. muciniphila reduced hepatic γδT17 cells by downregulating TLR2 signaling in NASH mice.
Because the TLR2 agonist did not obviously affect the proportion of hepatic macrophages, we explored other possible mechanisms by which A. muciniphila regulates macrophage polarization in NASH mice. Interestingly, IL−17, which can be secreted by γδT cells, has been reported to regulate innate immune cells (such as Kupffer cells and neutrophils).Citation42–44 Notably, exposure to both IL−17A and GM-CSF could induce macrophage necroptosis.Citation45 Another study found that IL−17A controlled the recruitment of inflammatory macrophages to the liver.Citation46 Notably, γδT cells can regulate myeloid cell recruitment (inflammatory monocytes) in NASH mice.Citation7 Our data supported that IL−17 promoted macrophage polarization toward proinflammatory M1 cells in vitro. It is likely that A. muciniphila modulated the IL−17 signals of γδT cells to affect macrophage polarization in NASH mice. Thus, A. muciniphila regulates the crosstalk between the two hepatic immune cells (γδT17 and M1 cells). It is noteworthy to further investigate whether A. muciniphila can direct or influence hepatic macrophages.
Additionally, our study provided the extensive evidence for the intestinal barrier-protecting effect of A. muciniphila in HFD-fed NASH mice. A. muciniphila, as the only representative of the phylum Verrucomicrobia in human, was reduced in obese adults.Citation47 and patients with NAFLD-related cirrhosis.Citation48 In consistent with these studies,Citation47,Citation48 a decreased Verrucomicrobia and increased Firmicutes were found in our continuous HFD-fed NASH mice. The latter can provide TLR2 ligands (e.g., LTA) that are recognized by the innate immune system.Citation24 Although it did not reduce the relative abundance of intestinal bacteria that provide TLR2 ligands in our NASH mice, the supplementation of A. muciniphila exerted a gut barrier-protecting effect. First, in line with previous findings,Citation14 A. muciniphila enriched the gene expression of colonic antibacterial peptides (including Reg3a, Reg3b and Reg3g). Second, A. muciniphila upregulated the intestinal expression of tight junction proteins, the therapeutic effect of which was reported for metabolic disorders in others’ study.Citation30 The novelty findings of our study demonstrated that A. muciniphila shifted the intestinal contents of microbial metabolites (SCFAs and tryptophan metabolites) and associated signaling pathways in NASH mice. Among them, SCFAs are usually derived from dietary fibers by microbial fermentation, and degraded from mucin by A. muciniphila.Citation49 In agreement with previous report on the role of SCFAs in the maintenance of intestinal homeostasis,Citation28,Citation50 our results demonstrated that A. muciniphila reversed the contents of intestinal reduced SCFA and GPR43 expression in HFD-fed NASH mice. Further, A. muciniphila upregulated AhR activity.Citation51 and enzymes of the kynurenine pathway (such as IDO1 and IDO2) in the colon of HFD-induced NASH mice. IDO metabolization of tryptophan into AhR ligands,Citation52 and AhR activation in the gut exert barrier-protective effects.Citation53 Thus, our study supported a potentially causative role of A. muciniphila in protecting the intestinal barrier function in NASH mice via regulating the microbial metabolites, which might further prevent intestine-derived TLR2 ligands from entering the circulation. In future investigations, the mutant A. muciniphila, the intestinal injury and AhR or GPR 43/41 knockout model could be used to confirm the involved metabolic pathways.
In conclusion, our study first provided evidence that A. muciniphila inhibits nonalcoholic steatohepatitis by orchestrating TLR2-activated γδT17 cell levels and further macrophage polarization.
Materials and methods
Animal experiments
Six-week-old wild-type male C57BL/6 mice were purchased from Shanghai SLAC Laboratory Animal, Co., Ltd. Mice were fed a normal chow diet, acclimated for 1 week, and then randomly divided into groups according to the basal level of serum ALT. Mice were maintained with four or five mice per cage and had access to water and food (normal chow or high-fat diet) ad libitum in a controlled SPF environment for 20 weeks. The high-fat diet (HFD, Research Diets, D12492, New Brunswick, NJ, USA) provides 60% kcal from fat, 20% kcal from carbohydrates and 20% kcal from proteins. A. muciniphila (10.Citation9 CFU) was suspended in 200 µL of sterile anaerobic PBS containing 2.5% glycerol and was administered daily by gavage for 20 weeks. A TLR2 agonist (LTA, Sigma, 10 µg/kg) in saline was administered daily by intraperitoneal injection for 20 weeks. An AhR agonist (6-formylindolo[3,2-b] carbazole, FICZ, MedChemExpress, 1 µg/mouse) in sterile water containing 0.0125% DMSO was administered daily by intraperitoneal injection from week 16 until euthanasia.
The high-fat high-carbohydrate diet (HFHCD) consisted of 60% kcal from fat, 20% kcal from protein, 20% kcal from carbohydrate (Research Diets, D12492, New Brunswick, NJ, USA), and carbohydrates (23.1 g/L fructose and 18.9 g/L sucrose) in drinking water.Citation54 A portion of the HFHCD mice were treated daily with a cocktail of antibiotics (including 1.86 mg of neomycin sulfate, 0.96 mg of vancomycin, 1.86 mg of ampicillin and 1.2 mg of metronidazole) (Sigma‒Aldrich, USA) or not by oral gavage for 18 weeks.
The culture of Akkermansia muciniphila
A. muciniphila (Cat. No. BAA−835, ATCC) was grown in brain heart infusion medium (Oxoid, England) under strictly anaerobic conditions (10% H2, 10% CO2, and 80% N2) using AW300SG anaerobic workstations (Electrotek, England). The concentration of bacteria was measured by a spectrophotometer (Biotek, Vermont, USA) at an excitation wavelength of 600 nm.Citation16
Cell culture
Mouse primary bone marrow-derived macrophage (BMDM) and Ana−1 cells were purchased from Procell Life Science & Technology Co., Ltd. (Wuhan, China). The cells were plated in 24-well plates and stimulated with RPMI medium containing 10 ng/ml or 100 ng/ml recombinant IL−17 (MedChemExpress, USA). After 24 h of stimulation, the cultured cells were collected for RNA extraction.
Analysis of serum parameters
Serum alanine aminotransferase (ALT) activity, aspartate transaminase (AST) activity and lipid indicators, including total cholesterol (TC), triglyceride (TG), low-density lipoprotein (LDL), and high-density lipoprotein (HDL), were measured using a 7600–210 automatic analyzer (Hitachi 7600–210; Hitachi, Tokyo, Japan). The level of serum endotoxin (LPS) was detected by the limulus amoebocyte lysate (LAL) chromogenic endpoint assay (HIT302, Hycult Biotech, Plymouth Meeting, PA) according to the manufacturer’s instructions.
Glucose tolerance test (GTT)
After fasting for 16 h, the baseline fasting blood glucose level was measured in tail vein blood using an Accu-Check glucometer (Roche, Basel, Switzerland). Then, mice were injected intraperitoneally with glucose (1 g glucose/kg bw in sterile PBS) for a glucose tolerance test as described in our previous protocol.Citation55 Blood glucose was subsequently measured at 15, 30, 60, and 120 min after the glucose injection.
In vivo intestinal barrier permeability
A fluorescein isothiocyanate (FITC)-labeled dextran method.Citation56 was performed to evaluate intestinal barrier function in vivo. Mice were deprived of all food for 6 h and then orally gavaged with the permeability tracer FITC-dextran (FD4-1 G, Sigma‒Aldrich, St. Louis, MO) (600 mg/kg body weight). Plasma was collected retroorbitally after 4 h and mixed with PBS (1:1). The fluorescence intensity was detected by a fluorescence spectrophotometer (Varioskan™ Flash, Thermo Fisher Scientific, USA) at excitation/emission wavelengths of 485 nm/535 nm.
Immunostaining of intestinal mucins
Mucus immunofluorescence was performed on paraffin-embedded colon sections (4 μm). Slides were incubated with primary Mucin 2 antibody (GTX100664, GeneTex, 1:200) and then Alexa Fluor® 488-conjugated secondary antibody (Servicebio GB2530, Wuhan, China; 1:400), followed by DAPI staining. Images were acquired with an inverted microscope (NIKON ECLIPSE TI-SR, Japan). All morphometric analyses were performed by Image-Pro Plus 6.0 software (Media Cybernetics, Rockville, Md, USA). For quantification, 5 randomly selected 400× fields from each sample were measured.
Liver tissue histology
Liver tissue was dissected, fixed in 4% paraformaldehyde (wt/vol), dehydrated, cleared and embedded in paraffin successively. Sections (4 μm) were obtained and stained with hematoxylin and eosin (H&E) to assess morphology. Tissue analyses were performed by two independent pathologists for steatosis, inflammation and ballooning, which were combined to generate the NAFLD activity score (NAS).Citation57
RNA extraction and quantitative real-time PCR (qPCR)
Colon and liver tissues were collected and quick-frozen in liquid nitrogen. Total RNA of tissue and cells was extracted using an RNeasy Plus mini kit (Qiagen, Germany) following the manufacturer’s protocol. The extracted RNA was analyzed with a Nanodrop 1000 spectrophotometer (Thermo Fisher Scientific, USA) for concentration and purity analysis, followed by reverse transcription into cDNA using a QuantiTect Reverse Transcription Kit (Qiagen, Hilden, Germany). qPCR was performed using a QuantiFast SYBR Green PCR Kit (Qiagen, Germany) and a ViiA7 Real-time PCR system (Applied Biosystems, USA). The primers used for PCR are shown in Table S2. Gene expression was determined by the comparative cycle threshold (Ct) method and was normalized to β-actin.Citation58
RNA sequencing
The procedures for RNA library construction and sequencing were conducted as previously described.Citation59 The sequencing procedures were performed on the BGISEQ−500 platform (BGI, Wuhan, China). High-quality reads were aligned to the mouse genome (mm10) by HISAT2. The expression levels for each of the genes were normalized to fragments per kilobase of exon model per million mapped reads (FPKM) in each sample using RNA-seq by Expectation Maximization (RESM) software. The significance of the differentially expressed genes (DEGs) and hierarchical cluster analysis were conducted using an online website provided by BGI (https://biosys.bgi.com/). The DEGs were defined as genes with a combination of |log2-ratio| ≥ 1 and FDR ≤ 0.001.
Flow cytometry
For extracellular and intracellular staining of immune markers, single-cell suspensions were prepared by mechanical dispersion and enzymatic digestion of fresh liver tissues in mice, as previously described.Citation40 The cells were washed with cell staining buffer (Miltenyi Biotech, Germany) and then sequentially incubated with Fc-block (Miltenyi Biotech, Germany) and antibodies against surface markers. For intracellular staining, cells were incubated with Leuko Act Cktl with GolgiPlug (2 µL of cocktail for every 10^6 cells, BD Pharmingen) for 6 h and collected. The cells were processed with Fixation/Permeabilization Solution (BD Pharmingen). The antibody cocktails for extracellular staining, including CD45, CD3, F4/80, CD11b, Ly6C, CD206, TLR2 and AhR, and that for intracellular staining, including IL−17, are summarized in Table S3. Fluorescence data were collected on a CytoFLEX (Beckman Coulter, Inc., USA) and analyzed with CytExpert 2.0 software.
High-throughput untargeted metabolomics profiling
Fecal samples were prepared and examined according to previously established methods.Citation60 The sample was detected by a Dionex UltiMate 3000 RS ultraperformance liquid chromatography (UPLC) system. A Hypersil Gold C−18 column (2.1 × 100 mm, 1.9 µm, Thermo Fisher Scientific, USA) was used in both ESI+ and ESI− modes. Mass spectrometric analysis was detected by Q Exactive HF-X mass spectrometry (MS) with a heated-ESI-II (HESI-II) ion source (Thermo Scientific, USA). Raw data were collected by Xcalibur™ 4.1 software and processed by Compound Discoverer™ 3.1 software (Thermo Fisher Scientific, USA). The hierarchical cluster analysis of metabolites was based on the log2 fold change of the normalized area in each sample divided by the group area of the NC and was conducted using Cluster 3.0 software.
Quantitative detection of SCFAs
Cecal samples were prepared according to a previous method with modifications.Citation61 Approximately 20 mg of cecal contents, 250 mL of 10% isobutanol and ceramic beads were mixed, homogenized (50 Hz, 30 s, twice) and centrifuged (12,000 rpm, 5 min). Then, 180 μL of supernatant was collected and mixed with 65 μL of 20 mM NaOH and 200 μL of chloroform. The mixture was vortexed and centrifuged. A total of 200 μL of upper aqueous phase, 40 μL of isobutanol, 50 μL of pyridine and ultrahigh-quality water were mixed in a total volume of 325 μL. We then added 25 μL of isobutyl chloroformate to the mixture and opened the lid to release generated gases. Next, 75 μL of hexane was added, and the samples were centrifuged. SCFA separation was achieved by a 0.25-μm HP−5 MS column (Agilent, USA). Fifteen SCFAs were used as external standards. The SCFA concentrations in the feces of mice were determined by the Shanghai Metabolome Institute (SMI, China) using a gas chromatograph (Agilent Technologies 7890B) coupled to a mass spectrometer (Agilent Technologies 5977).
Bacterial 16S rRNA deep sequencing
Total fecal genomic DNA of humans and mice was extracted with a QIAamp® fast DNA Stool Mini Kit (Qiagen, Hilden, Germany) according to the manufacturer’s protocol, as previously described by our group.Citation62 The concentrations of DNA were determined with a NanoDrop 2000c spectrophotometer (Thermo Fisher Scientific, USA). The bacterial genomic DNA of mice was subjected to polymerase chain reaction (PCR) amplification targeting the V3-V4 region of the 16S rRNA gene with a primer pair. The PCR products were pooled and sequenced in an Illumina® MiSeq platform. The high-quality reads were grouped into operational taxonomic units (OTUs) at a 97% level of sequence similarity and then were annotated with the QIIME package (version 1.8.0).Citation63 Representative OTUs were classified taxonomically using the Greengenes reference database (version gg_13_8).Citation64 The community richness (Chao1 and Ace) and diversity (Shannon and Simpson) were analyzed with Mothur (v.1.30.1).Citation65 Principal coordinate analysis (PCoA) was conducted using R software. The linear discriminant analysis (LDA) effect size (LEfSe) method was used to identify taxa of microbiota with statistical significance.Citation66 PERMANOVA (Adonis) was used to evaluate the β-diversity based on nonmetric multidimensional scaling (NMDS), unweighted and weighted UniFrac distance matrices and Bray‒Curtis distance matrices. The ANOSIM (analysis of similarities) test on Bray‒Curtis distances was also used to evaluate the differences in bacterial communities.
Single-cell RNA sequencing
Fresh liver tissue was dispersed and digested as single-cell suspensions, and the cells were captured by the 10× Genomics platform (Pleasanton, CA, USA). The cDNA libraries were prepared and sequenced to a mean depth of approximately 39,000 reads per cell. The raw data were analyzed by Cell Ranger software (version 3.1.0) to assess the quality and further processed by the R package Seurat.Citation67 The cluster of cells was visualized by uniform manifold approximation and projection (Umap) in Seurat. Each cluster with marker genes was identified by the FindAllMarkers function in Seurat and defined by a published article based on the top genes. The sequencing procedures were performed by PLT TECH (Zhejiang, China).
Statistical analysis
Statistical analysis was performed by SPSS software (version 16.0; Chicago, IL, USA) and GraphPad Prism Software Version 6.0 (San Diego, CA, USA). The significance among groups was analyzed by one-way analysis of variance or the Kruskal‒Wallis test. A p value less than 0.05 was considered statistically significant. The hierarchical clustering algorithm of heatmaps was performed by Cluster 3.0 software. The network diagram was generated by Cytoscape software (version 3.8.0).
Supplemental Material
Download MS Word (26.3 MB)Acknowledgments
We thank Mr. Lizong Zhang (Zhejiang Chinese Medical University) for support in animal experiment. This study was supported by National Natural Science Foundation of China (No. 82170668, 81790633), Sino-German Center for Research Promotion (No.GZ1546), and CAMS Innovation Fund for Medical Sciences (No. 2019-I2M-5-045). The work was approved by Clinical research Ethics Committee of the First Affiliated Hospital, College of Medicine, Zhejiang University (reference number: 2020-601) and Care and Use of Laboratory Animals and approved by the Ethics Committee of the First Affiliated Hospital, College of Medicine, Zhejiang University (reference number: 2020-848).
Disclosure statement
No potential conflict of interest was reported by the author(s).
Data availability statement
All relevant data are within the paper and its additional files. Raw sequence data of the 16S rRNA gene has been deposited in NCBI (https://www.ncbi.nlm.nih.gov/) under accession code PRJNA783152 and SRP347563. Other data are available on reasonable request.
Supplemental material
Supplemental data for this article can be accessed online at https://doi.org/10.1080/19490976.2023.2221485
Additional information
Funding
References
- Yang RX, Zou ZS, Zhong BH, Deng H, He FP, Shi JP, Zhao CY, Mi YQ, Zhou YJ, Di FS, et al. The pathologic relevance of metabolic criteria in patients with biopsy-proven nonalcoholic fatty liver disease and metabolic dysfunction associated fatty liver disease: a multicenter cross-sectional study in China. Hepatobiliary Pancreat Dis Int. 2021;20(5):426–24. doi:10.1016/j.hbpd.2021.06.002.
- Younossi Z, Anstee QM, Marietti M, Hardy T, Henry L, Eslam M, George J, Bugianesi E. Global burden of NAFLD and NASH: trends, predictions, risk factors and prevention. Nat Rev Gastro Hepat. 2018;15:11–20. doi:10.1038/nrgastro.2017.109.
- Khan RS, Newsome PN. NAFLD in 2017: novel insights into mechanisms of disease progression. Nat Rev Gastroenterol Hepatol. 2018;15(2):71–72. doi:10.1038/nrgastro.2017.181.
- Cai J, Zhang XJ, Li H. Role of innate immune signaling in non-alcoholic fatty liver disease. Trends Endocrinol Metab. 2018;29(10):712–722. doi:10.1016/j.tem.2018.08.003.
- Chopyk DM, Grakoui A. Contribution of the intestinal microbiome and gut barrier to hepatic disorders. Gastroenterol. 2020;159(3):849–863. doi:10.1053/j.gastro.2020.04.077.
- Kazankov K, Jørgensen SMD, Thomsen KL, Møller HJ, Vilstrup H, George J, Schuppan D, Grønbæk H. The role of macrophages in nonalcoholic fatty liver disease and nonalcoholic steatohepatitis. Nat Rev Gastro Hepat. 2019;16:145–159. doi:10.1038/s41575-018-0082-x.
- Torres‐Hernandez A, Wang W, Nikiforov Y, Tejada K, Torres L, Kalabin A, Adam S. Wu J, Lu L, Chen R et al. γδ T cells promote steatohepatitis by orchestrating innate and adaptive immune programming. Hepatol. 2020;71(2):477–494. doi:10.1002/hep.30952.
- Racanelli V, Rehermann B. The liver as an immunological organ. Hepatol. 2006;43(S1):S54–62. doi:10.1002/hep.21060.
- Hayday AC. γδ T cells and the lymphoid stress-surveillance response. Immunity. 2009;31(2):184–196. doi:10.1016/j.immuni.2009.08.006.
- Li F, Hao X, Chen Y, Bai L, Gao X, Lian Z, Wei H, Sun R, Tian Z. The microbiota maintain homeostasis of liver-resident γδT-17 cells in a lipid antigen/CD1d-dependent manner. Nat Commun. 2017;8(1):13839. doi:10.1038/ncomms13839.
- Postler TS, Ghosh S. Understanding the holobiont: how microbial metabolites affect human health and shape the immune system. Cell Metab. 2017;26(1):110–130. doi:10.1016/j.cmet.2017.05.008.
- Thaiss CA, Levy M, Suez J, Elinav E. The interplay between the innate immune system and the microbiota. Curr Opin Immunol. 2014;26:41–48. doi:10.1016/j.coi.2013.10.016.
- Michaudel C, Sokol H. The gut microbiota at the service of immunometabolism. Cell Metab. 2020;32(4):514–523. doi:10.1016/j.cmet.2020.09.004.
- Hänninen A, Toivonen R, Pöysti S, Belzer C, Plovier H, Ouwerkerk JP, Emani R, Cani PD, De Vos WM. Akkermansia muciniphila induces gut microbiota remodelling and controls islet autoimmunity in NOD mice. Gut. 2018;67(8):1445–1453. doi:10.1136/gutjnl-2017-314508.
- Everard A, Belzer C, Geurts L, Ouwerkerk JP, Druart C, Bindels LB, Guiot Y, Derrien M, Muccioli GG, Delzenne NM, et al. Cross-talk between Akkermansia muciniphila and intestinal epithelium controls diet-induced obesity. Proc Natl Acad Sci USA. 2013;110(22):9066–9071. doi:10.1073/pnas.1219451110.
- Li J, Lin S, Vanhoutte PM, Woo CW, Xu A. Akkermansia muciniphila protects against atherosclerosis by preventing metabolic endotoxemia-induced inflammation in Apoe −/− Mice. Circulation. 2016;133(24):2434–2446. doi:10.1161/circulationaha.115.019645.
- Grander C, Adolph TE, Wieser V, Lowe P, Wrzosek L, Gyongyosi B, Ward DV, Grabherr F, Gerner RR, Pfister A, et al. Recovery of ethanol-induced Akkermansia muciniphila depletion ameliorates alcoholic liver disease. Gut. 2018;67(5):891–901. doi:10.1136/gutjnl-2016-313432.
- Yoon HS, Cho CH, Yun MS, Jang SJ, You HJ, Kim JH, Han D, Cha KH, Moon SH, Lee K, et al. Akkermansia muciniphila secretes a glucagon-like peptide-1-inducing protein that improves glucose homeostasis and ameliorates metabolic disease in mice. Nature microbiol. 2021;6(5):563–573. doi:10.1038/s41564-021-00880-5.
- Depommier C, Everard A, Druart C, Plovier H, Van Hul M, Vieira-Silva S, Falony G, Raes J, Maiter D, Delzenne NM, et al. Supplementation with Akkermansia muciniphila in overweight and obese human volunteers: a proof-of-concept exploratory study. Nat Med. 2019;25(7):1096–1103. doi:10.1038/s41591-019-0495-2.
- Llopis M, Cassard AM, Wrzosek L, Boschat L, Bruneau A, Ferrere G, Puchois V, Martin JC, Lepage P, Le Roy T, et al. Intestinal microbiota contributes to individual susceptibility to alcoholic liver disease. Gut. 2016;65(5):830–839. doi:10.1136/gutjnl-2015-310585.
- Moschen AR, Kaser S, Tilg H. Non-alcoholic steatohepatitis: a microbiota-driven disease. Trends in Endocrinol Metab. 2013;24(11):537–545. doi:10.1016/j.tem.2013.05.009.
- MacParland SA, Liu JC, Ma XZ, Innes BT, Bartczak AM, Gage BK, Manuel J, Khuu N, Echeverri J, Linares I, et al. Single cell RNA sequencing of human liver reveals distinct intrahepatic macrophage populations. Nat Commun. 2018;9(1):4383. doi:10.1038/s41467-018-06318-7.
- Wang L, E FD, Stärkel P, Hartmann P, Chen P, Llorente C, DePew J, Moncera K, B HS, A BD, Hooper, L, et al. Intestinal REG3 lectins protect against alcoholic steatohepatitis by reducing mucosa-associated microbiota and preventing bacterial translocation. Cell Host & Microbe. 2016;19(2):227–239. doi:10.1016/j.chom.2016.01.003.
- Nguyen MT, Götz F. Lipoproteins of gram-positive bacteria: key players in the immune response and virulence. Microbiol Mol Biol Rev. 2016;80(3):891–903. doi:10.1128/mmbr.00028-16.
- Alam A, Leoni G, Quiros M, Wu H, Desai C, Nishio H, Jones RM, Nusrat A, Neish AS. The microenvironment of injured murine gut elicits a local pro-restitutive microbiota. Nature microbiol. 2016;1(2):15021. doi:10.1038/nmicrobiol.2015.21.
- Derrien M, Vaughan EE, Plugge CM, de Vos WM. Akkermansia muciniphila gen. nov., sp. nov., a human intestinal mucin-degrading bacterium. Int J Syst Evol Microbiol. 2004;54(5):1469–1476. doi:10.1099/ijs.0.02873-0.
- Kimura I, Ichimura A, Ohue-Kitano R, Igarashi M. Free fatty acid receptors in health and disease. Physiol Rev. 2020;100(1):171–210. doi:10.1152/physrev.00041.2018.
- Sun M, Wu W, Chen L, Yang W, Huang X, Ma C, Chen F, Xiao Y, Zhao Y, Ma C, et al. Microbiota-derived short-chain fatty acids promote Th1 cell IL-10 production to maintain intestinal homeostasis. Nat Commun. 2018;9(1):3555. doi:10.1038/s41467-018-05901-2.
- Agus A, Planchais J, Sokol H. Gut microbiota regulation of tryptophan metabolism in health and disease. Cell Host & Microbe. 2018;23(6):716–724. doi:10.1016/j.chom.2018.05.003.
- Chelakkot C, Choi Y, Kim DK, Park HT, Ghim J, Kwon Y, Jeon J, Kim MS, Jee YK, Gho YS, et al. Akkermansia muciniphila-derived extracellular vesicles influence gut permeability through the regulation of tight junctions. Exp Mol Med. 2018;50(2):e450. doi:10.1038/emm.2017.282.
- Shin NR, Lee JC, Lee HY, Kim MS, Whon TW, Lee MS, Bae JW. An increase in the Akkermansia spp. population induced by metformin treatment improves glucose homeostasis in diet-induced obese mice. Gut. 2014;63(5):727–735. doi:10.1136/gutjnl-2012-303839.
- Kim S, Lee Y, Kim Y, Seo Y, Lee H, Ha J, Lee J, Choi Y, Oh H, Yoon Y, et al. Akkermansia muciniphila prevents fatty liver disease, decreases serum triglycerides, and maintains gut homeostasis. Appl Environ Microb. 2020;86(7). doi:10.1128/aem.03004-19.
- Lorenzo PM, Sajoux I, Izquierdo AG, Gomez-Arbelaez D, Zulet MA, Abete I, Castro AI, Baltar J, Portillo MP, Tinahones FJ, et al. Immunomodulatory effect of a very-low-calorie ketogenic diet compared with bariatric surgery and a low-calorie diet in patients with excessive body weight. Clin Nutr. 2022;41(7):1566–1577. doi:10.1016/j.clnu.2022.05.007.
- Koutoukidis DA, Astbury NM, Tudor KE, Morris E, Henry JA, Noreik M, Jebb SA, Aveyard P. Association of weight loss interventions with changes in biomarkers of nonalcoholic fatty liver disease: a systematic review and meta-analysis. JAMA Intern Med. 2019;179(9):1262–1271. doi:10.1001/jamainternmed.2019.2248.
- Huang W, Metlakunta A, Dedousis N, Zhang P, Sipula I, Dube JJ, Scott DK, O’Doherty RM. Depletion of liver Kupffer cells prevents the development of diet-induced hepatic steatosis and insulin resistance. Diabetes. 2010;59(2):347–357. doi:10.2337/db09-0016.
- Wang L, Tang L, Feng Y, Zhao S, Han M, Zhang C, Yuan G, Zhu J, Cao S, Wu Q, et al. A purified membrane protein from Akkermansia muciniphila or the pasteurised bacterium blunts colitis associated tumourigenesis by modulation of CD8 + T cells in mice. Gut. 2020;69(11):1988–1997. doi:10.1136/gutjnl-2019-320105.
- Keshavarz Azizi Raftar S, Ashrafian F, Yadegar A, Lari A, Moradi HR, Shahriary A, Azimirad M, Alavifard H, Mohsenifar Z, Davari M, et al. The protective effects of live and pasteurized akkermansia muciniphila and its extracellular vesicles against HFD/CCl4-induced liver injury. Microbiol Spectr. 2021;9(2):e0048421. doi:10.1128/Spectrum.00484-21.
- Miura K, Yang L, van Rooijen N, Brenner DA, Ohnishi H, Seki E. Toll-like receptor 2 and palmitic acid cooperatively contribute to the development of nonalcoholic steatohepatitis through inflammasome activation in mice. Hepatol. 2013;57(2):577–589. doi:10.1002/hep.26081.
- Zhang H, Carnevale G, Polese B, Simard M, Thurairajah B, Khan N, Gentile ME, Fontes G, Vinh DC, Pouliot R, et al. CD109 restrains activation of cutaneous IL-17-producing γδ T cells by commensal microbiota. Cell Reports. 2019;29(2):391–405.e5. doi:10.1016/j.celrep.2019.09.003.
- Wu P, Wu D, Ni C, Ye J, Chen W, Hu G, Wang Z, Wang C, Zhang Z, Xia W, et al. γδT17 cells promote the accumulation and expansion of myeloid-derived suppressor cells in human colorectal cancer. Immunity. 2014;40(5):785–800. doi:10.1016/j.immuni.2014.03.013.
- Martin B, Hirota K, Cua DJ, Stockinger B, Veldhoen M. Interleukin-17-producing γδ T cells selectively expand in response to pathogen products and environmental signals. Immunity. 2009;31(2):321–330. doi:10.1016/j.immuni.2009.06.020.
- Ma HY, Yamamoto G, Xu J, Liu X, Karin D, Kim JY, Alexandrov LB, Koyama Y, Nishio T, Benner C, et al. IL-17 signaling in steatotic hepatocytes and macrophages promotes hepatocellular carcinoma in alcohol-related liver disease. J Hepatol. 2020;72(5):946–959. doi:10.1016/j.jhep.2019.12.016.
- Meng F, Wang K, Aoyama T, Grivennikov SI, Paik Y, Scholten D, Cong M, Iwaisako K, Liu X, Zhang M, et al. Interleukin-17 signaling in inflammatory, Kupffer cells, and hepatic stellate cells exacerbates liver fibrosis in mice. Gastroenterol. 2012;143(3):765–776.e3. doi:10.1053/j.gastro.2012.05.049.
- Pérez MM, Martins LMS, Dias MS, Pereira CA, Leite JA, Gonçalves ECS, de Almeida PZ, de Freitas EN, Tostes RC, Ramos SG, et al. Interleukin-17/interleukin-17 receptor axis elicits intestinal neutrophil migration, restrains gut dysbiosis and lipopolysaccharide translocation in high-fat diet-induced metabolic syndrome model. Immunol. 2019;156(4):339–355. doi:10.1111/imm.13028.
- Gil-Pulido J, Amézaga N, Jorgacevic I, Manthey HD, Rösch M, Brand T, Cidlinsky P, Schäfer S, Beilhack A, Saliba AE, et al. Interleukin-23 receptor expressing γδ T cells locally promote early atherosclerotic lesion formation and plaque necrosis in mice. Cardiovascular Res. 2021;118(14):2932–2945. doi:10.1093/cvr/cvab359.
- Lages CS, Simmons J, Maddox A, Jones K, Karns R, Sheridan R, Shanmukhappa SK, Mohanty S, Kofron M, Russo P, et al. The dendritic cell–T helper 17–macrophage axis controls cholangiocyte injury and disease progression in murine and human biliary atresia. Hepatol. 2017;65(1):174–188. doi:10.1002/hep.28851.
- Dao MC, Everard A, Aron-Wisnewsky J, Sokolovska N, Prifti E, Verger EO, Kayser BD, Levenez F, Chilloux J, Hoyles L, et al. Akkermansia muciniphila and improved metabolic health during a dietary intervention in obesity: relationship with gut microbiome richness and ecology. Gut. 2016;65(3):426–436. doi:10.1136/gutjnl-2014-308778.
- Ponziani FR, Bhoori S, Castelli C, Putignani L, Rivoltini L, Del CF, Sanguinetti M, Morelli D, Paroni SF, Petito V, et al. Hepatocellular carcinoma is associated with gut microbiota profile and inflammation in nonalcoholic fatty liver disease. Hepatol. 2019;69(1):107–120. doi:10.1002/hep.30036.
- Koh A, De Vadder F, Kovatcheva-Datchary P, Bäckhed F. From dietary fiber to host physiology: short-chain fatty acids as key bacterial metabolites. Cell. 2016;165(6):1332–1345. doi:10.1016/j.cell.2016.05.041.
- Smith PM, Howitt MR, Panikov N, Michaud M, Gallini CA, Bohlooly YM, Glickman JN, Garrett WS. The microbial metabolites, short-chain fatty acids, regulate colonic Treg cell homeostasis. Sci. 2013;341(6145):569–573. doi:10.1126/science.1241165.
- Gu Z, Pei W, Shen Y, Wang L, Zhu J, Zhang Y, Fan S, Wu Q, Li L, Zhang Z. Akkermansia muciniphila and its outer protein Amuc_1100 regulates tryptophan metabolism in colitis. Food Funct. 2021;12(20):10184–10195. doi:10.1039/d1fo02172a.
- Cervenka I, Agudelo LZ, Ruas JL. Kynurenines: tryptophan’s metabolites in exercise, inflammation, and mental health. Sci. 2017;357(6349):357. doi:10.1126/science.aaf9794.
- Stockinger B, Shah K, Wincent E. AHR in the intestinal microenvironment: safeguarding barrier function. Nat Rev Gastro Hepat. 2021;18(8):559–570. doi:10.1038/s41575-021-00430-8.
- Wu L, Han Y, Zheng Z, Zhu S, Chen J, Yao Y, Yue S, Teufel A, Weng H, Li L, et al. Obeticholic acid inhibits anxiety via alleviating gut microbiota-mediated microglia accumulation in the brain of high-fat high-sugar diet mice. Nutr. 2021;13(3):940. doi:10.3390/nu13030940.
- Ling Q, Huang H, Han Y, Zhang C, Zhang X, Chen K, Wu L, Tang R, Zheng Z, Zheng S, et al. The tacrolimus-induced glucose homeostasis imbalance in terms of the liver: from bench to bedside. Am J Transplant. 2020;20(3):701–713. doi:10.1111/ajt.15665.
- Cani PD, Bibiloni R, Knauf C, Waget A, Neyrinck AM, Delzenne NM, Burcelin R. Changes in gut microbiota control metabolic endotoxemia-induced inflammation in high-fat diet–induced obesity and diabetes in mice. Diabetes. 2008;57(6):1470–1481. doi:10.2337/db07-1403.
- Kleiner DE, Brunt EM, Van Natta M, Behling C, Contos MJ, Cummings OW, Ferrell LD, Liu YC, Torbenson MS, Unalp-Arida A, et al. Design and validation of a histological scoring system for nonalcoholic fatty liver disease. Hepatol. 2005;41(6):1313–1321. doi:10.1002/hep.20701.
- Gomes AL, Teijeiro A, Burén S, Tummala KS, Yilmaz M, Waisman A, Theurillat JP, Perna C, Djouder N. Metabolic inflammation-associated IL-17A causes non-alcoholic steatohepatitis and hepatocellular carcinoma. Cancer Cell. 2016;30(1):161–175. doi:10.1016/j.ccell.2016.05.020.
- Cha JY, Kim DH, Chun KH. The role of hepatic macrophages in nonalcoholic fatty liver disease and nonalcoholic steatohepatitis. Lab Anim Res. 2018;34(4):133–139. doi:10.5625/lar.2018.34.4.133.
- Wu L, Han Y, Zheng Z, Peng G, Liu P, Yue S, Zhu S, Jun C, Lv H, Shao L, et al. Altered gut microbial metabolites in amnestic mild cognitive impairment and Alzheimer’s disease: signals in host–microbe interplay. Nutr. 2021;13(1):228. doi:10.3390/nu13010228.
- Furuhashi T, Sugitate K, Nakai T, Jikumaru Y, Ishihara G. Rapid profiling method for mammalian feces short chain fatty acids by GC-MS. Anal Biochem. 2018;543:51–54. doi:10.1016/j.ab.2017.12.001.
- Wang B, Jiang X, Cao M, Ge J, Bao Q, Tang L, Chen Y, Li L. Altered fecal microbiota correlates with liver biochemistry in nonobese patients with non-alcoholic fatty liver disease. Sci Rep. 2016;6(1):32002. doi:10.1038/srep32002.
- Caporaso JG, Kuczynski J, Stombaugh J, Bittinger K, Bushman FD, Costello EK, Fierer N, Pena AG, Goodrich JK, Gordon JI, et al. QIIME allows analysis of high-throughput community sequencing data. Nat Methods. 2010;7(5):335–336. doi:10.1038/nmeth.f.303.
- McDonald D, Price MN, Goodrich J, Nawrocki EP, DeSantis TZ, Probst A, Andersen GL, Knight R, Hugenholtz P. An improved Greengenes taxonomy with explicit ranks for ecological and evolutionary analyses of bacteria and archaea. Isme J. 2012;6(3):610–618. doi:10.1038/ismej.2011.139.
- Schloss PD, Westcott SL, Ryabin T, Hall JR, Hartmann M, Hollister EB, Lesniewski RA, Oakley BB, Parks DH, Robinson CJ, et al. Introducing mothur: open-source, platform-independent, community-supported software for describing and comparing microbial communities. Appl Environ Microbiol. 2009;75(23):7537–7541. doi:10.1128/aem.01541-09.
- Langille MG, Zaneveld J, Caporaso JG, McDonald D, Knights D, Reyes JA, Clemente JC, Burkepile DE, Vega Thurber RL, Knight R, et al. Predictive functional profiling of microbial communities using 16S rRNA marker gene sequences. Nat Biotechnol. 2013;31(9):814–821. doi:10.1038/nbt.2676.
- Butler A, Hoffman P, Smibert P, Papalexi E, Satija R. Integrating single-cell transcriptomic data across different conditions, technologies, and species. Nat Biotechnol. 2018;36(5):411–420. doi:10.1038/nbt.4096.