
ABSTRACT
Background & Aim
Clostridioides difficile infection (CDI) is the leading cause of hospital-acquired diarrhea and pseudomembranous colitis. Two protein toxins, TcdA and TcdB, produced by C. difficile are the major determinants of disease. However, the pathophysiological causes of diarrhea during CDI are not well understood. Here, we investigated the effects of C. difficile toxins on paracellular permeability and apical ion transporters in the context of an acute physiological infection.
Methods
We studied intestinal permeability and apical membrane transporters in female C57BL/6J mice. Üssing chambers were used to measure paracellular permeability and ion transporter function across the intestinal tract. Infected intestinal tissues were analyzed by immunofluorescence microscopy and RNA-sequencing to uncover mechanisms of transporter dysregulation.
Results
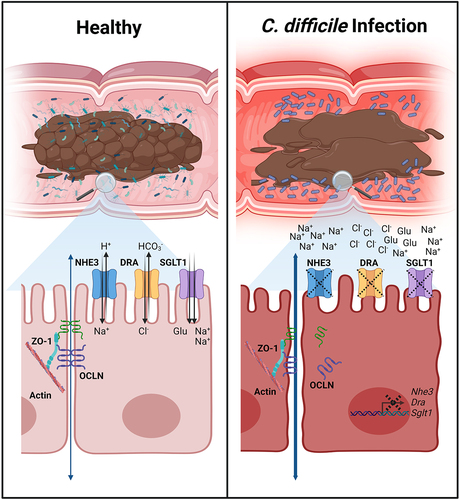
Intestinal permeability was increased through the size-selective leak pathway in vivo during acute CDI in a 2-day-post infection model. Chloride secretory activity was reduced in the cecum and distal colon during infection by decreased CaCC and CFTR function, respectively. SGLT1 activity was significantly reduced in the cecum and colon, accompanied by ablated SGLT1 expression in colonocytes and increased luminal glucose concentrations. SGLT1 and DRA expression was ablated by either TcdA or TcdB during acute infection, but NHE3 was decreased in a TcdB-dependent manner. The localization of key proteins that link filamentous actin to the ion transporters in the apical plasma membrane was unchanged. However, Sglt1, Nhe3, and Dra were drastically reduced at the transcript level, implicating downregulation of ion transporters in the mechanism of diarrhea during CDI.
Conclusions
CDI increases intestinal permeability and decreases apical abundance of NHE3, SGLT1, and DRA. This combination likely leads to dysfunctional water and solute absorption in the large bowel, causing osmotic diarrhea. These findings provide insights into the pathophysiological mechanisms underlying diarrhea and may open novel avenues for attenuating CDI-associated diarrhea.
GRAPHICAL ABSTRACT
Introduction
Clostridioides difficile infection (CDI) is the leading cause of hospital-acquired diarrhea in the USA, posing a significant burden on patients and the healthcare system.Citation1,Citation2 This antibiotic-associated infection causes ~ 250,000 cases and ~ 14,000 deaths in the USA each year, contributing $1.5 billion annually to the cost of healthcare.Citation3,Citation4 Furthermore, 25% of CDI patients experience a recurrent infection within two to 8 weeks of the initial infection, with each episode increasing subsequent risk of recurrence.Citation1 C. difficile is transmitted via the fecal-oral route, where hardy spores traverse the gastrointestinal (GI) tract to germinate in the small intestine and colonize in the colon as vegetative cells.Citation5 Infection results in symptoms ranging from mild to severe diarrhea, pseudomembranous colitis, and, in severe cases, toxic megacolon, sepsis, and death.Citation5 Diarrhea provides a route of spore dispersal onto skin, clothes, and environmental surfaces that remain contaminated after symptom resolution.Citation6 Environmental contamination is difficult to eliminate and perpetuates pathogen spread.Citation6 Therefore, a better understanding of the mechanisms underlying diarrhea and its impact on CDI severity may help improve patient outcomes and mitigate pathogen spread.
Pathogenesis during CDI is mediated by two glucosylating protein toxins, TcdA and TcdB, and may be exacerbated by a third toxin, C. difficile transferase.Citation7 Upon production in the colon, TcdA and TcdB bind host cell receptors and are endocytosed.Citation8 Acidification of the endosome causes conformational changes in the toxins that lead to pore formation and delivery of the glucosyltransferase enzymes into the host cytosol.Citation8 There, the enzymes irreversibly inactivate Rho-family GTPases via glucosylation, disrupting the host cytoskeleton and leading to the production of proinflammatory cytokines, ultimately resulting in cytopathy and cell death.Citation8 Additionally, TcdB concentrations at and above 0.1 nM induce glucosyltransferase-independent epithelial injury through the production of reactive oxygen species that results in a necrotic cell death.Citation8 Despite the understanding that TcdA and TcdB are the main determinants of disease, the role of each toxin during infection is not fully defined.Citation9,Citation10 A recent study from our lab reaffirmed that both TcdA and TcdB alone can cause symptoms in the mouse model of CDI, and suggested that the toxins synergize to worsen diarrhea symptoms and disease outcomes.Citation9
Studies of purified C. difficile toxins in the 1980s demonstrated that injection of TcdA into rabbit ileal and colonic loops, or challenging ex vivo intestinal tissue with TcdA caused tissue damage, increased mucosal permeability, fluid accumulation in the lumen, and increased Cl– secretion.Citation11–15 A follow-up study demonstrated that TcdA, but not TcdB, significantly increased intestinal permeability in rabbit ileal loops, suggesting that TcdA-induced paracellular permeability was the major driver of diarrhea.Citation16 The idea that toxin-mediated tissue damage increases paracellular water and solute efflux has been adopted as a likely mechanism of diarrhea in the C. difficile field. However, our understanding and appreciation of the complex pathophysiology that underlies diarrheal conditions has improved in the past two decades through the molecular identification of solute and water transporters.Citation17 An in vitro study demonstrated that TcdB caused internalization of the Na+/H+ Exchanger 3 protein, NHE3 (a.k.a. SLC9A3).Citation18 Depletion of NHE3 was confirmed in CDI patient biopsies, which was accompanied by elevated Na+ and alkaline levels in patient stool.Citation19 A more recent study demonstrated that the Cl–/HCO3– exchanger protein, DRA (Downregulated in Adenoma; a.k.a. SLC26A3), was depleted in CDI patient biopsies and during murine rectal instillation of purified TcdA.Citation20 The coupled function of NHE3 and DRA is the primary route of electroneutral NaCl absorption in the lower GI tract, and functionally inactivating mutations in either gene can cause congenital diarrhea.Citation21–24 Moreover, in models of inflammatory diarrhea, increased paracellular permeability alone is not sufficient to cause diarrhea; rather, increased permeability and impairment of NHE3 is necessary for solute malabsorption and diarrhea.Citation25 These findings led us to hypothesize that C. difficile toxins induce concerted changes in paracellular permeability and solute absorption and secretion during infection that cause spore-dispersing diarrhea. In this study, we examined this hypothesis and tested the previously proposed models of TcdA-induced diarrhea, with the aim of defining the mechanistic etiology of diarrhea during acute CDI.
Results
Both TcdA and TcdB contribute to diarrhea severity during murine CDI
We previously observed that diarrhea was most severe in mice infected with the wildtype R20291 strain when compared to mutants that had mutationally impaired glucosyltransferase activity in either TcdA or TcdB (A+ BGTX and AGTX B+).Citation9 To generate tissues for the experiments described below, we repeated previously published disease analyses and found consistent results.Citation9 Weight loss was recorded and showed significant differences in percent weight loss at 2 days post-inoculation (dpi) between R20291 and A+ BGTX , AGTX B+, and ΔtcdAΔtcdB (p <.0001) (). Mice inoculated with A+ BGTX and AGTX B+ strains lost significantly more weight than ΔtcdAΔtcdB-inoculated mice (p <.0001; contrast not shown on graph), but there was no difference in weight loss between A+ BGTX and AGTX B+ (p = 0.8531; ). Stool samples were scored by color and consistency at 2 dpi, demonstrating that R20291 consistently caused more severe diarrhea compared to toxin mutant strains (). These results are reflected by the empty ceca and colons from R20291-infected mice (). In situ visualization of the GI tract highlighted the empty and inflamed bowels observed during infection with wildtype C. difficile R20291 (). These data indicate that both TcdA and TcdB contribute to weight loss and diarrhea in our mouse model of CDI and provide the framework to examine the role of toxins in R20291-associated diarrhea during acute infection at 2 dpi.
Figure 1. Diarrhea severity during C. difficile infection with R20291 is toxin-additive.

Intestinal permeability is increased through a size-selective paracellular pathway during C. difficile infection
To define the pathways involved in acute C. difficile diarrhea, we measured intestinal permeability in mice inoculated with the wildtype R20291 strain at 2 dpi by quantifying flux of orally gavaged FD4 and RD70 across the intestinal mucosa into the bloodstream (). Due to the extensive epithelial injury in the cecum and colon during CDI (Supplementary Figure S1), we expected to observe increased flux of both FD4 and RD70. Contrary to our expectations, increased intestinal permeability of FD4 (p = 0.038), but not RD70, was observed during acute CDI, implicating the size-selective leak pathway in this process (). We predicted that FD4 flux would be increased in ex vivo cecum and colon tissue, where extensive histopathological damage occurs (Supplementary Figure S1). Unexpectedly, there was no increase in permeability in large intestinal tissues, or anywhere in the intestinal tract of C. difficile-infected mice when tissue was measured in Üssing chambers ( and Supplementary Figure S2). As an orthogonal measurement for barrier integrity, baseline transmucosal resistance (Rt) was measured 60 min after mounting ex vivo tissue in Üssing chambers. There was no significant change in Rt between CDI and healthy mice across the entire intestinal tract (). After 60 min, these tissue segments were subjected to a course of ion transport inhibitors and stimulants to test electrogenic ion transport during CDI. Despite the addition of chemicals over the course of 120 min, there were no visible ischemic effects that would bias the barrier function and ion transport analyses (). Together, these results demonstrate that intestinal permeability is increased during CDI in vivo, potentially through the size-selective leak pathway. Barrier function measurements in Üssing chambers also showed that CDI caused no net change in Rt throughout the intestinal tract, despite the severe epithelial damage caused during infection.
Figure 2. Intestinal permeability is increased in vivo via the leak pathway during infection.

C. difficile infection decreases Cl– secretory activity in the cecum and colon
The function of intestinal ion transporters during acute CDI was tested using electrophysiological measurements in Üssing chambers. The baseline short circuit current (Isc) was not significantly different between R20291-infected and control mice, suggesting a minimal effect of CDI on electrogenic ion transport (). The absorptive Epithelial Sodium Channel (ENaC), which is functionally relevant in the distal colon, was tested through inhibition with amiloride. There was no significant impairment of ENaC function during CDI ( and Supplementary Figure S3). Cystic Fibrosis Transmembrane Conductance Regulator (CFTR) is responsible for most anion secretion in response to increased intracellular Ca2+ and cyclic dinucleotides, and Calcium activated Chloride Channels (CaCC) contribute to Cl– secretion. To assess their function during CDI, the acetylcholine analogue, carbachol (Cch), and the adenylate cyclase-inducing chemical, forskolin (Fsk), were applied sequentially. The addition of Cch revealed that the secretory potential of the cecum was severely decreased during CDI (p < .0001), while there were no significant effects on other regions of the intestinal tract (). The CFTR-dependent portion of stimulated secretion was measured by adding a maximal dose of the inhibitor R-BPO-27. This demonstrated that CFTR function was significantly impaired in the distal colon during CDI (p < .05; ). CaCC-dependent secretion was measured by the addition of the inhibitor CaCC-A01. CaCC activity was reduced nearly five-fold in the cecum during CDI (p < .001), accounting for the reduction in secretory potential after Cch stimulation (). These results suggest that neither Cl– hypersecretion nor ENaC-mediated Na+ malabsorption are factors in diarrhea during CDI.
Figure 3. Chloride secretory channel activity is diminished in the cecum and distal colon during CDI.

C. difficile infection causes loss of SGLT1 expression and function in the colon
We determined the function of Sodium-dependent Glucose Transporter 1 (SGLT1; a.k.a. SLC5A1), which is critical for absorption of glucose/galactose, Na+, and water through the apical cell membrane in the small intestine.Citation26 The function of SGLT1 in the presence of 11 mM glucose was tested through inhibition with phlorizin. There was no effect in SGLT1 activity in the jejunum or ileum, but unexpectedly, its function was significantly impaired in the cecum, proximal colon, and distal colon during CDI (p < .05) (). Using immunofluorescence microscopy, we found that SGLT1 expression was completely ablated in the colon during infection with R20291 (). SGLT1 is responsible for the majority of small intestinal glucose uptake, and the physiological relevance of SGLT1 in the colon is unknown. However, analysis of fecal samples revealed a greater than two-fold increase in stool glucose in R20291-infected mice at the same timepoint at which SGLT1 function and expression are decreased, suggesting that SGLT1 may be important for reabsorbing excess glucose in the colon (). The role of SGLT1 in carbohydrate, Na+, and water absorption is consistent with a model where loss of SGLT1 expression could contribute to diarrhea during CDI.Citation27
Figure 4. Colonic SGLT1 function is impaired, and expression diminished during CDI.

SGLT1 and DRA expression is decreased by either TcdA or TcdB, but decreased NHE3 expression is TcdB-dependent
NHE3 and DRA are depleted during human CDI and are predicted factors in causing diarrhea.Citation18–20 Given our observation that both TcdA and TcdB contribute to weight loss and diarrhea, we hypothesized that each toxin could have a different effect on the expression of ion transporters implicated in diarrhea. Using immunofluorescence microscopy, we found that SGLT1 expression was significantly decreased in the distal colon in response to either or both toxins but was largely present during colonization with a toxin-negative strain ( and Supplementary Figure S4). Specifically, the expression of SGLT1 was ablated in the presence of functional TcdB, but in the A+ BGTX-infected mice, partial expression remained in the crypt base ().
Figure 5. SGLT1 and DRA expression is decreased by TcdA or TcdB activity, but NHE3 depletion is TcdB-dependent during infection.

DRA is functionally linked to NHE3 and is expressed in a low-to-high gradient from the proximal to distal colon in rodents.Citation28 DRA has been shown to be downregulated at the protein but not mRNA level in mice intrarectally instilled with TcdA, but this has not been assessed during infection.Citation20 Immunofluorescence analysis revealed that DRA expression was significantly decreased in the distal colon in response to functional TcdA or TcdB, with no additive outcome when both functional toxins were present ( and Supplementary Figure S4).
NHE3 is present in a gradient of high-to-low expression from the proximal to the distal colon in rodents.Citation28 No studies have examined NHE3 expression in animal models of CDI. NHE3 expression was significantly decreased in a TcdB-dependent manner in the distal colon ( and Supplementary Figure S4). Unexpectedly, NHE3 expression in the proximal colon, where it is more highly expressed, was unaffected during CDI ().
Figure 6. NHE3 expression in the proximal colon is unaltered during infection with wildtype or mutant C. difficile strains.

NHE3 is internalized in response to TcdB glucosyltransferase activity in vitro.Citation18 It was hypothesized that internalization is caused by TcdB-dependent deactivation of Rho-GTPases, which disrupts the cytoskeletal protein group Ezrin/Radixin/Moesin (ERM) that is linked to Na+-H+ Exchanger Regulatory Factor (NHERF) family proteins that anchor NHE3 to the cell membrane.Citation18,Citation29 We used immunofluorescence microscopy to quantify the expression and observed localization of NHERF1 and the active, phosphorylated ERM (pERM). There was no significant effect on NHERF1 or pERM expression and localization during infection with R20291, suggesting the potential for another mechanism of NHE3 depletion during infection (). Together, these data demonstrate the ability of both TcdA and TcdB to affect the expression of absorptive ion transporters in the distal colon, which likely contributes to the pathophysiology of diarrhea during CDI.
Figure 7. Expression of the cytoskeletal proteins NHERF1 and pERM is not altered in the colon during CDI.

Sglt1, Dra, and Nhe3 mRNA expression is downregulated in the colon in a toxin-specific manner
Since NHERF1 and pERM expression were unaltered during CDI, we hypothesized that NHE3 was decreased at the transcript level. We used RNA-sequencing as an unbiased approach to uncover toxin-dependent effects on mRNA levels. Transcriptomic analysis of the distal colon identified the potent upregulation of genes involved in the innate immune response including Retnlb, Clca4b, Prss22, S100a9, Chil3, and Saa3 ( and Supplementary Table S1). The most highly downregulated gene during infection was the cytochrome p450 family protein-encoding gene Cyp2c55, which has been previously reported.Citation10 Dra (Slc26a3) was the second-most downregulated gene, followed by other solute and water transporters Aqp8, Clca1, Slc20a1, Slc26a2, Nhe3 (Slc9a3), and Sglt1 (Slc5a1).
Figure 8. Transcriptomic analyses indicate that Sglt1, Nhe3, and Dra transcripts are downregulated in the distal colon during infection.

Transcript expression comparisons between vehicle control mice and A+ BGTX, AGTX B+, and R20291-inoculated mice were conducted to explore toxin-dependent effects on expression (Suplementary Tables S2 and S3). Consistent with protein expression data, there was a significant decrease in Sglt1 and Dra expression in mice inoculated with mutant and wildtype strains (). Transcript data also supported TcdB-dependent downregulation of Nhe3 (). Transcript expression changes in Sglt1, Dra, and Nhe3 were confirmed in epithelial cells isolated from the cecum, proximal colon, and distal colon of control and wildtype C. difficile R20291-infected mice at 2 dpi using qRT-PCR. Relative gene expression analyses supported the downregulation of Sglt1 and Dra from the cecum to distal colon, as well as downregulation of Nhe3 in the cecum and distal colon, but not the proximal colon (). These data demonstrate that the absorptive ion transporters SGLT1, NHE3, and DRA are decreased at the transcript level during acute CDI.
We assessed transcript changes of ion transporters that were tested using Üssing chambers in the distal colon using the RNA-seq dataset. There were significant decreases in Cftr expression in mice inoculated with TcdB-positive strains only (), which may affect CFTR activity (). All three strains caused significant decreases in the putative CaCCs, Tmem16a (a.k.a. Ano1) and Clca1. There was also significant downregulation of the ENaC-encoding genes Scnn1a, Scnn1b, and Scnn1g (). Decreased transcript abundance of CaCC- and ENaC-encoding genes did not reflect the relatively stable function of these ion transporters in the distal colon during CDI (), highlighting the complexity of expression and function of ion transporters during disease states.
Finally, aquaporins 1, 4, 8, and 11 were among the most differentially expressed genes during CDI (). Transcript levels of aquaporins 1 and 4 were decreased or increased, respectively, and were dependent on TcdB activity (). The A+ BGTX strain reduced the expression of Aqp8 and Aqp11, but Aqp8 downregulation was more potent in mice infected with strains that possess functional TcdB (). Decreased expression of Aqp11 was most severe in R20291-infected mice, suggesting a synergistic effect in the presence of both functional toxins (). These data suggest that aquaporin proteins could also have a previously uncharacterized role in pathophysiology of water and solute transport during CDI.
Discussion
Diarrhea during CDI can be mild and self-limiting, but in severe cases can cause dehydration through significant water and electrolyte loss. Additionally, diarrhea is the main source of pathogen spread between patients and onto environmental surfaces, which can be spore reservoirs for future outbreaks. Despite the importance of diarrhea during CDI, we do not fully understand the mechanisms underlying this symptom. Previous studies have used cell culture models, intrarectal instillation of toxins in mice, ileal loop injections in rabbits, and human patient samples to examine the effects of toxins and CDI on tight junctions and the expression of key ion transporters.Citation11,Citation13,Citation15,Citation16,Citation19,Citation20 These studies implicate increased paracellular leakage, Cl– secretion, and/or expression loss of electroneutral ion exchangers NHE3 and DRA as potential causes of diarrhea. However, we are not aware of a paper that takes a comprehensive view of these mechanisms in the context of an in vivo infection. In this study, we sought to define the factors underlying diarrhea and to determine the effect of C. difficile toxins on this process using a physiologically relevant acute infection model.
Previous studies have tested the impact of toxins on permeability and Cl– secretion using Üssing chambers.Citation11,Citation15,Citation30,Citation31 These studies used ex vivo rabbit ileal tissue that was exposed to crude or purified toxins in the chamber system over the course of several hours. The mouse infection model allows us to study permeability and electrogenic ion transport in a physiological disease setting that includes a fully functioning immune response. We tested permeability in vivo by gavage fasted mice with FD4 and RD70. Since C. difficile causes significant epithelial damage, we expected to see increased permeability of RD70 through the unrestricted pathway, similar to the dextran sodium sulfate model of colitis.Citation32 Instead, this experiment revealed that permeability is increased through the leak pathway, shown by increased FD4 in plasma. Based on previous studies, this result suggests that intestinal permeability during CDI is increased through tight junction-dependent mechanisms.Citation32,Citation33 We tested tissue permeability in Üssing chambers to delineate where in the intestinal tract permeability was increased. Unexpectedly, there was no increase in tissue permeability in the duodenum, jejunum, ileum, cecum, proximal colon, or distal colon, despite the extensive pathological damage in the cecum and colon during CDI. The simplest explanation is that the small tissue size used for the Üssing chamber permeability analysis may not provide the sensitivity necessary to measure FD4 permeability. However, it is tempting to speculate that permeability may be increased through dynamic processes such as transmigration of polymorphonuclear immune cells through the epithelial layer, which would require circulating immune cells.Citation34 An alternative explanation could be that C. difficile infection increases sampling of luminal antigens, resulting in increased FD4 in sera.
Maintaining ion transport is essential for gut homeostasis and solute absorption and secretion.Citation17 There were no significant changes in baseline Rt or Isc in Üssing chambered tissues during CDI. Previous studies have found that both tissue Rt and transepithelial resistance in cell cultures are decreased after acute exposure to C. difficile toxins.Citation14,Citation35,Citation36 To the best of our knowledge, this is the first time that Rt has been evaluated in tissues during a physiological C. difficile infection. These data, along with permeability data, suggest that dynamic epithelial remodeling occurs in the lower GI during infection, which may not be active in homogenous cell culture and explant intoxication models. Indeed, studies have reported increased crypt length and epithelial cell differentiation during infection, which may serve, in part, to reinforce the mucosal barrier during CDI.Citation37,Citation38 Electrogenic ion transport measurements revealed no effects on ENaC function during infection. Contrary to previous findings,Citation14,Citation15 there was no increase in Cl– secretion after addition of carbachol and forskolin to infected tissue. In fact, there was a decrease in Cl– secretory potential in the cecum during CDI. CFTR activity was decreased significantly in the distal colon, and the loss of Cl– secretion in the cecum was accounted for by reduced CaCC activity. Decreased CaCC and CFTR activity might be a result of the severe epithelial damage that occurs in the cecum and distal colon in the mouse CDI model. However, specific decreases in function of either CaCC in the cecum and CFTR in the distal colon may suggest the involvement of more physiological mechanisms of regulation during infection. Overall, these results strongly suggest that diarrhea during acute CDI is not a result of Cl– hypersecretion, as exemplified by Cl– rich cholera diarrhea, nor is it mediated by lack of Na+ absorption by ENaC, which is a pathophysiological factor of diarrhea during Salmonella-induced enteritis.Citation17,Citation39,Citation40
Electrogenic measurements in Üssing chambers revealed that SGLT1 function was significantly impaired in the cecum and colon during CDI. Immunofluorescence imaging further suggested that this loss of function is due to a near complete ablation of SGLT1 expression. There was a two-fold increase in stool glucose during acute CDI compared to zero dpi. SGLT1-mediated carbohydrate absorption is thought to be mostly relevant in the small intestine and is only expressed at low levels in both rodent and human colons, thus, its function in the colon is incompletely understood.Citation41,Citation42 SGLT1 can actively uptake glucose in rat, pig, and human colons, albeit at a lower rate compared to the small intestine.Citation43,Citation44 This result is intriguing since C. difficile represses toxin production in the presence of glucose in vitro through a mechanism of carbon catabolite repression.Citation45,Citation46 Moreover, a high-carbohydrate diet rich in corn starch, casein, maltodextrin, and sucrose was protective against severe CDI.Citation47 Finally, the two dpi timepoint is when mice undergo the most severe CDI symptoms, and they typically begin resolving by 4 dpi.Citation9 It is therefore conceivable that inactivation of SGLT1 in the colon during severe CDI would increase luminal glucose, decrease toxin production, and thus promote disease resolution.
We previously observed that diarrhea and weight loss were increased during infection with the epidemic B1/NAP1/PCR-ribotype 027 R20291 strain, when compared to mutants with impaired glucosyltransferase activity of TcdA or TcdB.Citation9 This led us to hypothesize that each toxin had unique effects on host physiology that synergize to cause severe diarrhea. We used immunofluorescence microscopy to quantify the relative abundance of SGLT1, NHE3, and DRA during acute infection. These experiments revealed that both TcdA and TcdB decrease DRA and SGLT1 expression significantly during infection. This finding is in contrast to a previous study, where DRA protein expression was reduced by intrarectal administration of TcdA, but not TcdB.Citation20 The difference in our results are most likely due to the repeated exposure of host cells to TcdA and TcdB during the course of infection compared to 4 h of exposure to either toxin alone.Citation20 An alternate explanation could be that TcdA decreases DRA expression in a glucosyltransferase-independent manner, which is why DRA abundance was decreased in mice infected with either A+ BGTX and AGTX B + .Congruent with a previous study,Citation18 NHE3 expression was only decreased by strains that expressed functional TcdB. Unexpectedly, NHE3 expression was only decreased in the distal colon, where its expression is already very low, but not in the proximal colon. It has previously been shown that TcdB causes internalization of NHE3 in cell cultures.Citation18 The authors hypothesized that glucosylation of Rho GTPases by TcdB could lead to disruption of ERM and NHERF proteins, leading to internalization of NHE3.Citation18 We examined the expression of pERM and NHERF1 during infection at 2 dpi and found no quantifiable differences. However, this does not preclude the possibility of internalization by this pathway, rather, we may be capturing a snapshot of infection where NHE3 has already been internalized and the cytoskeleton has undergone rearrangements that do not include returning NHE3 to the apical cell surface.
We used an untargeted RNA-sequencing approach to interrogate dysregulation of ion transporters in the distal colon during infection. These data revealed a significant decrease in transcript levels of Sglt1, Nhe3, and Dra during infection. Downregulation of Nhe3 at the transcript level is supported by a previous study, where Nhe3 expression was decreased in human colonic organoids that were exposed to C. difficile.Citation19 The decreased mRNA levels of Dra we observed during infection contradicts existing data from mice intrarectally instilled with TcdA or TcdB.Citation20 Those mice were exposed to toxins for 4 h before mice were euthanized and gene expression analyses performed. Taken together, the data from these two studies suggest that the pathophysiological mechanisms leading to downregulation of Dra at the mRNA level likely require extended exposure to C. difficile toxins during infection. Finally, the untargeted RNA-sequencing approach also highlighted four aquaporin genes that were either up- or down-regulated during infection, which may play a role in water transport that contributes to diarrhea.
Downregulation of NHE3, DRA, and SGLT1 at the transcript level is likely a major factor contributing to diarrhea during CDI, since the absence of each of these transporters alone in humans can cause congenital Na+, Cl–, or glucose-galactose malabsorption diarrhea.Citation21,Citation22,Citation41 This downregulation response could augment or conflict with the idea that toxin-mediated perturbation of the cytoskeleton may disrupt trafficking of ion transporters to the apical membrane, leading to loss of function.Citation18 Rapid regulation of NHE3 and DRA relies on endocytic recycling and trafficking of these transporters to the apical membrane of epithelial cells.Citation48 It is possible that toxins disrupt membrane trafficking by inactivating Rho GTPases, which leads to downstream signals that decrease expression of each transporter gene. During chronic inflammatory bowel diseases, Nhe3, Dra, and Sglt1 expression is inhibited by circulating proinflammatory cytokines.Citation49–51 The inflammatory response to acute C. difficile infection leads to high serum levels of proinflammatory cytokines including interleukin-1β, IL-6, IL-8, IL-17A, interferon-gamma, and tumor necrosis factor-alpha.Citation52 It is, therefore, conceivable that toxin-mediated inflammatory responses during CDI cause widespread transcriptional downregulation of Sglt1, Dra, and Nhe3 in the cecum and colon. Additionally, increased paracellular flux through the leak pathway is upregulated in response to T cell-mediated increases in TNFα and IFNγ.Citation33,Citation53 These findings lead us to hypothesize that host inflammatory responses during CDI may increase paracellular efflux through the leak pathway, and decrease solute absorption by NHE3, DRA, and SGLT1 in the colon, leading to coordinated dysfunction and malabsorptive diarrhea. Paracrine signaling events would amplify the impact of toxins beyond the cells that undergo direct intoxication. Further experiments are needed to define the mechanisms underlying the pathophysiological changes in solute and water transport during CDI.
In conclusion, these data demonstrate that both TcdA and TcdB are necessary in the R20291 strain to cause pathophysiological changes leading to diarrhea during CDI. Diarrhea associated with CDI is likely a multifactorial condition caused by increased intestinal permeability, and decreased water, Na+, Cl–, and carbohydrate absorption by SGLT1, NHE3, and DRA. Questions remain about the pathophysiological cues that dysregulate these transporters, which will be addressed in future studies.
Materials & methods
Animals and ethics statement
Nine-week-old female C57BL/6J mice purchased from The Jackson Laboratory were allowed to acclimate to the facility for a week before any procedures were performed. Mice were housed in specific pathogen-free conditions with 12-h cycles of light and dark and used at 9–11 weeks of age. Cages were changed every 2 weeks to ensure clean bedding, and unless otherwise mentioned, they had free access to food and water. All studies were approved by the Institutional Animal Care and Use Committee at Vanderbilt University Medical Center under protocol M1700185–01. All authors had access to the study data and have reviewed and approved the final manuscript.
Clostridioides difficile culturing
Mutant and wildtype C. difficile strains () were cultured at 37°C in supplemented brain-heart infusion medium (BHIS) in an anaerobic chamber (90% N2, 5% H2, 5% CO2). Strains were stored at –80°C in 20% glycerol stocks for long-term use. Spore stocks were prepared as previously described and stored at 4°C until use.Citation9
Table 1. Key resources.
Clostridioides difficile infection
Ten-week-old C57BL/6J mice were treated with cefoperazone (0.5 mg/ml) antibiotics in drinking water ad libitum for 5 days, then returned to normal drinking water 2 days before inoculation. Mice were inoculated with 105 CFU/ml spores suspended in 100 µl sterile PBS by transoral gastric gavage. Spore stocks and diluted inoculum from mutant and wildtype C. difficile strains were serially diluted onto BHIS + taurocholic acid (TA; 10% w/v) media to enumerate concentration before and after inoculation.
Mice were monitored daily, and weight and symptom severity were recorded. Stool samples were collected daily by scruffing mice and catching fresh stool in sterile, pre-weighed 1.5 ml microcentrifuge tubes. Stool samples were scored using a modified Bristol Stool Chart by color and consistency. In this scheme 1 = normal stool; 2 = well-formed, discolored stool; 3 = moist, soft, and discolored stool; 4 = wet tail, watery diarrhea, and empty bowels.Citation9 Stool was then weighed, homogenized in PBS, and serially diluted on TCCFA media (TA 10% w/v; D-cycloserine 10 mg/ml; cefoxitin 10 mg/ml; fructose) to quantify C. difficile burden. At the experimental endpoint, mice were humanely euthanized by CO2 followed by cervical dislocation. The entire intestinal tract was excised and imaged. Tissues were processed as described below based on the experiment performed.
In vivo paracellular permeability measurement
Mice were pre-treated with antibiotics then inoculated with wildtype C. difficile R20291, A+ BGTX, AGTX B+, AGTX BGTX, or PBS as described above. Paracellular permeability was measured using an established method.Citation32 Two days post-inoculation (dpi), mice were placed into a new cage with water, but without food or bedding for 3 h to clear gut contents. A probe solution containing 80 mg/ml 4 kDa fluorescein isothiocyanate (FITC) dextran (FD4) and 40 mg/ml 70 kDa rhodamine B dextran (RD70) was prepared in sterile milliQ water and filter sterilized through a 0.2 µm filter into a new sterile tube. After 3 h of fasting, 250 µl of probe solution was orally gavaged into each mouse, while noting the exact time of gavage. One mock-inoculated mouse was orally gavaged with water for a plasma autofluorescence control. Mice were returned to their food- and bedding-less cage and monitored. Food and bedding were returned 90 min post-gavage. Three hours post-gavage, mice were euthanized, and blood was collected via heart stick using a 28 G insulin syringe. Equal volumes of blood were placed into 1.3 ml collection tubes containing 3.2% sodium citrate (Sarstedt). Tubes were gently mixed by inversion to prevent coagulation. After all the samples were collected, tubes were centrifuged at 1500 × g for 10 min at room temperature, and plasma was transferred to new 1.5 ml microcentrifuge tubes. A standard curve for FD4 and RD70 was prepared in duplicate, and plasma FITC and rhodamine B fluorescence was measured in technical duplicate on a BioTek Cytation 5 plate reader, and probe concentration in plasma was calculated exactly as described.Citation32
Ex vivo paracellular permeability measurement in Üssing chambers
To delineate the permeability of functionally distinct portions of the GI tract, mucosal-submucosal preparations of the duodenum, jejunum, ileum, cecum, proximal colon, and distal colon were assessed from R20291-infected and vehicle control mice at 2 dpi. Mice were euthanized, and tissues were excised by carefully cutting mesentery and connective tissue to prevent damage to the mucosa. Functional regions were delineated by sectioning the intestines and colon in equal thirds. Tissue for duodenum preparations was taken from the latter third of the duodenal segment to avoid Brunner’s glands and the pancreatic duct. Excised tissues were flushed with ice-cold, oxygenated Krebs-Ringer Buffer (KRB; 117 mM NaCl, 25 mM NaHCO3, 11 mM glucose, 4.7 mM KCl, 1.2 mM MgCl2, 2.5 mM CaCl2, and 1.2 mM NaH2PO4, pH 7.4). The segments were opened along the mesenteric border, and the seromuscular layer was removed in cold KRB using fine forceps under a dissecting microscope. Preparations were made from each segment, mounted in 0.1 cm2 sliders, and placed in Üssing chambers (Physiologic Instruments). The luminal and serosal surfaces of the jejunum, ileum, cecum, proximal colon, and distal colon were bathed in 4 ml KRB, bubbled with carbogen (95% O2, 5% CO2), and maintained at 37°C using a water-recirculating heating apparatus. The serosal surface of the duodenum was bathed in 4 ml KRB, and the luminal surface was bathed in HCO3− free HEPES buffer (117 mM NaCl, 4.7 mM KCl, 2.5 mM CaCl2 , 1.2 mM MgCl2, 1.2 mM NaH2PO4, 24 mM sodium gluconate, 10 mM HEPES, and 11 mM glucose, pH 7.4), bubbled with 100% O2 to prevent CO2-stimulated HCO3– secretion. To prevent prostaglandin synthesis, indomethacin (10 µM) was added immediately post-mounting to all serosal baths.
Mucosa-submucosa tissue preparations were stabilized for 15 min before administration of FD4 (0.25 mM) and RD70 (17.5 mM) to the serosal bath to measure permeability.Citation32 The mucosal bathing solution was sampled in technical duplicate at 0 and 60 min after FD4 and RD70 addition, and the bath volume was maintained by adding fresh KRB. Fluorescence intensity of each 100 µl sample and standards were analyzed at excitation/emission of 495/525 nm for FD4 and 555/585 nm for RD70 on a BioTek Cytation 5 plate reader.Citation32,Citation57 Paracellular permeability was determined as the concentration of FD4 and RD70 that passed through the mucosal-submucosal preparations from serosal to mucosal baths as µg/ml/cm2.
Ion transporter functional assessment in Üssing chambers
To assess function of electrogenic ion transporters, short-circuit current (Isc), tissue conductance (Gt, mS/cm2), and transmucosal resistance (Rt, Ω · cm2) were recorded under voltage-clamp conditions. Gt was measured every 5 sec with a bipolar pulse of ± 3 mV for 20 mS, and Rt was calculated as the inverse of Gt. Baseline Isc and Rt were recorded after the fluorescent dextran permeability measurements and before inhibitors were applied.
SGLT1 activity in the presence of 11 mM glucose was determined as 0.1 mM phlorizin sensitive ISC. ENaC activity was determined as 10 µM amiloride-sensitive ISC. Carbachol (10 µM) and forskolin (10 µM) were sequentially applied to the serosal bath to compare Ca2+ and cAMP-dependent Cl– secretory responses. After the addition of forskolin, the contribution of CFTR and CaCC to stimulated Cl– secretion was measured by administering the CFTR inhibitor (R)-BPO-27 (10 µM) followed by CaCC-A01 (100 µM).
After the Üssing protocol, mounted tissues were fixed in 10% Neutral Buffered Formalin (NBF) overnight, then embedded in paraffin by the Vanderbilt Tissue Pathology Shared Resource (TPSR). Sections were mounted onto slides and stained with H&E to validate the removal of the seromuscular layer and the lack of ischemic cell death during the experiment. H&E-stained slides were imaged at 40× magnification using a Leica SCN400 at the Digital Histology Shared Resource.
Immunofluorescence staining, imaging, and analysis
Mice were euthanized two days post-inoculation, then the colon of each animal was excised. Colons were gently flushed with cold sterile PBS, then cut transversally and fixed in 2% paraformaldehyde (PFA) at room temperature for 2 h or 10% NBF at room temperature for 16 h. After 2 h, PFA-fixed tissues were washed three times in cold sterile PBS, then placed in a cold solution of 30% sucrose, 1% NaN3 and incubated for 16 h at 4°C. Colons were Swiss rolled and embedded in Optimal Cutting Temperature medium (OCT) in dry ice-cooled ethanol and stored at –80°C until use. NBF-fixed tissues were rinsed three times in cold sterile PBS, then Swiss rolled and embedded in paraffin wax by TPSR.
Formalin-fixed paraffin embedded (FFPE) blocks were sectioned (7 µm) on a Microm HM 335E microtome, then dried overnight and kept at room temperature until use. Paraffin wax was removed using xylenes, then tissues were rehydrated in an ethanol gradient. Antigen retrieval was performed for 15 min using 0.1 M Citrate Buffer pH 6.0. Frozen colon blocks were sectioned (7 µm) on a Leica CM1950 Cryostat and kept at −80°C until use. OCT was removed by incubating in three sequential PBS washes. Both OCT and FFPE tissues were blocked for an hour at room temperature in a solution of PBS pH 7.4, 2% normal goat or donkey serum, and 0.3% Triton X-100.
Afterwards, the blocking solution was removed and replaced with the primary antibody diluted at a specified concentration () in an antibody dilution buffer comprising PBS, 1% bovine serum albumin (BSA), and 0.3% Triton X-100. Slides were incubated with the primary antibody overnight (~16 h) at 4°C. The following day, slides were washed in three changes of PBS, then incubated for 1 h at room temperature in antibody dilution buffer containing secondary antibodies and/or phalloidin (). After an hour, slides were washed in three changes of PBS, incubated with DAPI for 1 min, then washed in PBS. Slides were cover slipped with ProLong Gold and allowed to cure overnight before sealing with clear nail polish and placing at 4°C in the dark until imaging.
Sections were imaged using a Nikon Spinning Disk confocal microscope equipped with a Yokogawa CSU-X1 spinning disk head, a Photometrics Prime 95B sCMOS monochrome camera, and 405 nm, 488 nm, 561 nm, and 647 nm diode laser lines. For each colon samples, at least three distinct regions of the proximal colon (first 1/3rd of colon) and distal colon (last 1/3rd of colon) were imaged for analysis in at least three mice per treatment. These images were acquired at 20× with a Plan Apo Lambda 20 × 0.75 NA WD 1.00 mm objective lens. Magnified images were acquired at 40×, 60×, or 100× with Pan Fluor 40× Oil DIC H N2 1.30 NA WD 0.20 mm, Plan Apo Lambda Oil 60 × 1.40 NA WD 0.13 mm, and Apo TIRF Oil 100 × 1.49 NA WD 0.12 mm objective lenses, respectively.
Relative fluorescence intensity was quantified as a metric for protein abundance using FIJI software (National Institutes of Health). A baseline threshold was generated with vehicle control images using Otsu’s method,Citation60 and fluorescence intensity by area was calculated. The same threshold settings were applied across all treatments and regions of the colon for each protein analyzed. Fluorescence intensity data were averaged between different fields of view from the same region of the same mouse, and relative fluorescence intensity was calculated with reference to the vehicle control.
Histopathological scoring
Pathological scoring of mouse intestinal tissues was performed as previously described.Citation9 Briefly, vehicle control and R20291-infected mice were euthanized at 2 dpi, then the entire intestinal tract was excised. Functional regions of the intestines were separated as described above. Each segment was flushed with cold PBS, then opened longitudinally along the mesenteric border, laid flat between two pieces of Whatman filter paper, and fixed overnight at room temperature in 10% NBF. Tissues were washed three times in PBS, then each segment was Swiss rolled and placed in a tissue cassette in 70% ethanol until paraffin embedding. Tissues were cut to 7 µm sections on a Microm HM 335E microtome, then dried overnight and kept at room temperature until use. Paraffin wax was removed using xylenes, then tissues were rehydrated in an ethanol gradient. Sections were stained with hematoxylin & eosin (H&E; Vector Labs), and slides were scored by a board-certified gastrointestinal pathologist blinded to the conditions. Histological scoring was assessed for edema, inflammation, and epithelial injury based on previously published criteria.Citation9,Citation61 Images were acquired using a 10× objective on a BioTek Cytation 5 plate reader.
Stool glucose measurement
Stool was collected into sterile, pre-weighed microcentrifuge tubes from mice inoculated with C. difficile R20291 (n = 5 per treatment) at day 0, prior to inoculation, and two-days post-inoculation. Tubes containing stool were weighed, and glucose was measured using the Glucose Assay Kit (Abcam) according to manufacturer’s instructions. Briefly, stool was mechanically homogenized in equal volumes of ice-cold assay buffer, then centrifuged at 10,000 × g for 5 min at 4°C. The supernatant was transferred to Spin-X UF 10 kDa molecular weight cutoff columns (Corning) and centrifuged at 10,000 × g for 10 min at 4°C to deproteinate the samples. Flowthrough was then used for colorimetric quantification of glucose concentration compared to standards provided by the manufacturer.
Transcriptome Profiling of the distal colon
Mice inoculated with wildtype and mutant C. difficile strains, or the vehicle control were euthanized at 2 dpi, and a 0.5 cm segment of the distal colon was harvested and placed in RNAlater solution on ice. Tissues were washed with sterile PBS then transferred to fresh tubes containing 1 ml of TRIzol and 1 mm diameter Zirconia-silica beads. Colon samples were homogenized in an Omni Bead Ruptor 4 homogenizer for one minute in two 30 s intervals, then placed on ice for 5 min. Phases were separated by the addition of chloroform and centrifugation, then total RNA was precipitated, washed, and solubilized in nuclease-free water. DNA was depleted using TURBO DNA-free (Invitrogen), then RNA was purified using the Monarch RNA Cleanup Kit (NEB). Quantity and quality were assessed by spectroscopy.
RNA libraries were prepared by depleting eukaryotic ribosomal RNA with the NEBNext rRNA Depletion Kit prior to library synthesis with the NEBNext Ultra II Directional RNA Library Prep Kit and addition of multiplex oligos using the Unique Dual Index Primer Pairs Set 3 (NEB). Library quality control was performed using Qubit and Bioanalyzer 2100. Paired end 150 bp sequencing was performed on an Illumina NovaSeq 6000, with the aim of generating 50 million reads per sample. Sequencing data quality was assessed with FASTQC, then reads were aligned to the GRCm39 mouse genome (GenBank GCA_000001635.9) using the STAR alignment tool with default settings. Normalization by trimmed mean of M-values and differential expression was performed with limma-voom. Plots of differentially expressed genes were generated using GraphPad Prism or Heatmapper. Raw and analyzed data have been deposited on NCBI’s Gene Expression Omnibus and are accessible through GEO Series accession number GSE216919.
Epithelial cell isolation and relative gene expression analyses
Epithelial cells were isolated from the cecum and colon of vehicle control and R20291-infected mice at 2 dpi based on an established protocol.Citation62 Briefly, the lower intestine was excised, and luminal contents were gently flushed with cold PBS. The regions of interest were slid onto a metal gavage needle attached to a 5 ml syringe filled with air. A knot was affixed on the tissue segment nearest the gavage needle bulb with sterile 3–0 vicryl suture, and the tissue was inverted by sliding the intestine over the knot. Another suture knot was placed on the open end of the tissue, and then it was submerged in 4 ml Cell Recovery Solution (Corning) on ice. The tissue was inflated and deflated every 5 min for 30 min. After 30 min, the tissues were removed from solution and sterile surgical forceps were used to gently remove epithelial sheets from the tissue. RNA was isolated using QIAShredder lysis tubes and the Qiagen RNeasy Plus Mini Kit.
Relative gene expression of Nhe3, Dra, and Sglt1 was measured using TaqMan-based quantitative Real Time-Polymerase Chain Reaction (qRT-PCR; ). One microgram of RNA from each sample was synthesized to cDNA using the Qiagen QuantiTect Reverse Transcription Kit. cDNA was diluted 1:5 with nuclease-free water. The expression of each gene (as cycle threshold; Ct) was measured within an intestinal region relative to the expression of Gapdh (ΔCt). ΔCt values were compared to the expression of each transporter gene compared to Gapdh expression in a reference pooled sample comprising cDNA from vehicle control mice for each intestinal region. All qRT-PCR experiments were performed on a technical duplicate on a QuantStudio 6 Flex Real-Time PCR System.
Statistical analyses
The data were plotted with GraphPad Prism, and statistical comparisons were determined using one-way ANOVA and unpaired Student’s t-test for two-group comparisons. For more than three groups, a two-way ANOVA, and Tukey’s multiple comparisons test were performed. P < .05 was considered to be the minimal significant difference.
Abbreviations
| CDI | = | Clostridioides difficile infection |
| GI | = | gastrointestinal |
| NHE3 | = | Na+/H+ Exchanger 3 |
| DRA | = | Downregulated in Adenoma |
| BHIS | = | brain-heart infusion-supplemented medium |
| TA | = | taurocholic acid |
| TCCFA | = | taurocholic acid, D-cycloserine, cefoxitin and fructose agar |
| FITC | = | fluorescein isothiocyanate |
| FD4 | = | 4 kDa FITC dextran |
| RD70 | = | 70 kDa rhodamine B dextran |
| KRB | = | Krebs-Ringer Buffer |
| Isc | = | short-circuit current |
| Rt | = | transmucosal resistance |
| Gt | = | tissue conductance |
| SGLT1 | = | sodium-dependent glucose cotransporter 1 |
| ENaC | = | epithelial sodium channel |
| CFTR | = | cystic fibrosis transmembrane conductance regulator |
| PFA | = | paraformaldehyde |
| NBF | = | neutral buffered formalin |
| FFPE | = | formalin-fixed paraffin embedded |
| OCT | = | optimal cutting temperature embedding medium |
| ERM | = | Ezrin/Radixin/Moesin |
| NHERF | = | Na+/H+ exchanger regulatory factor |
| BI/NAP1/PCR-RT | = | restriction endonuclease analysis type B1, North American pulse-field gel electrophoresis type 1, polymerase chain reaction ribotype |
| qRT-PCR | = | quantitative real time-polymerase chain reaction |
Author contributions
Conceptualization, F.C.P.G., I.K., and D.B.L.; Methodology, F.C.P.G., I.K., A.S., J.A.S., and H.M.S.A.; Investigation, F.C.P.G., I.K., A.S., L.M.W., J.A.S., and M.K.W.; Writing – Original Draft, F.C.P.G.; Writing – Reviewing & Editing: I.K., A.S., H.M.S.A, P.K.D., J.R.G., and D.B.L.; Funding Acquisition, F.C.P.G., I.K., H.M.S.A, and D.B.L.; Resources, I.K., L.M.W., H.M.S.A., P.K.D, J.R.G., and D.B.L.; Supervision, I.K. and D.B.L.
BioRxiv preprint
Synopsis
Clostridioides difficile infection (CDI) causes increased intestinal fluid leakage and decreases the colon’s ability to absorb water and electrolytes. Using a mouse model of CDI, we found that intestinal permeability is increased through a size-selective pathway, and key absorptive ion transporters Sglt1, Nhe3, and Dra are downregulated. These factors likely cause diarrhea associated with CDI.
Transcript profiling
RNA-seq data were uploaded into GEO database (GSE216919).
Supplemental Material
Download Zip (55.4 MB)Acknowledgments
Thank you to the members of the Lacy lab for stimulating discussions and feedback on this manuscript. Thank you to Miguel Beristain, Greg Gomez, and Lee Brackman for technical assistance with qRT-PCR. Thank you to Kari Seedle and the Vanderbilt Cell Imaging Shared Resource Core for support on imaging and analyses; Vanderbilt Technologies for Advanced Genomics for support with RNA-sequencing; TPSR for histology support; and to Colin Kruse for advice on RNA-sequencing data analyses. The graphical abstract and cartoons in figures were made using BioRender.
Disclosure statement
No potential conflict of interest was reported by the author(s).
Data availability statement
Large datasets (RNA-seq) are available online on Gene Expression Omnibus with identifier GSE216919. Reagents used in this study are either commercially available or available upon request.
Supplementary material
Supplemental data for this article can be accessed online at https://doi.org/10.1080/19490976.2023.2225841
Additional information
Funding
References
- Lessa FC, Mu Y, Bamberg WM, Beldavs ZG, Dumyati GK, Dunn JR, Farley MM, Holzbauer SM, Meek JI, Phipps EC, et al. Burden of Clostridium difficile infection in the United States. N Engl J Med. 2015;372(9):825–23. doi:10.1056/NEJMoa1408913.
- CDC. Antibiotic resistance threats in teh United States. Atlanta, GA: U.S. Department of Health and Human Services, CDC; 2019. doi:10.15620/cdc:82532.
- Guh AY, Mu Y, Winston LG, Johnston H, Olson D, Farley MM, Wilson LE, Holzbauer SM, Phipps EC, Dumyati GK, et al. Trends in U.S. burden of Clostridioides difficile infection and outcomes. N Engl J Med. 2020;382(14):1320–1330. doi:10.1056/NEJMoa1910215.
- Zimlichman E, Henderson D, Tamir O, Franz C, Song P, Yamin CK, Keohane C, Denham CR, Bates DW. Health care–associated infections: a meta-analysis of costs and financial impact on the US health care system. JAMA Intern Med. 2013;173(22):2039–2046. doi:10.1001/jamainternmed.2013.9763.
- Smits WK, Lyras D, Lacy DB, Wilcox MH, Kuijper EJ. Clostridium difficile infection. Nat Rev Dis Primer. 2016;2(1):1–20. doi:10.1038/nrdp.2016.20.
- Bobulsky GS, Al-Nassir WN, Riggs MM, Sethi AK, Donskey CJ. Clostridium difficile skin contamination in patients with C. difficile-associated disease. Clin Infect Dis Off Publ Infect Dis Soc Am. 2008;46(3):447–450. doi:10.1086/525267.
- Kordus SL, Thomas AK, Lacy DB. Clostridioides difficile toxins: mechanisms of action and antitoxin therapeutics. Nat Rev Microbiol. 2022;20(5):285–298. doi:10.1038/s41579-021-00660-2.
- Chandrasekaran R, Lacy DB. The role of toxins in Clostridium difficile infection. FEMS Microbiol Rev. 2017;41(6):723–750. doi:10.1093/femsre/fux048.
- Peritore-Galve FC, Shupe JA, Cave RJ, Childress KO, Washington MK, Kuehne SA, Lacy DB. Glucosyltransferase-dependent and independent effects of Clostridioides difficile toxins during infection. PLoS Pathog. 2022;18(2):e1010323. doi:10.1371/journal.ppat.1010323.
- Carter GP, Chakravorty A, Nguyen TAP, Mileto S, Schreiber F, Li L, Howarth P, Clare S, Cunningham B, Sambol SP, et al. Defining the roles of TcdA and TcdB in localized gastrointestinal disease, systemic organ damage, and the host response during Clostridium difficile infections. mBio. 2015;6(3):e00551. doi:10.1128/mBio.00551-15.
- Mitchell TJ, Ketley JM, Haslam SC, Stephen J, Burdon DW, Candy DC, Daniel R. Effect of toxin a and B of Clostridium difficile on rabbit ileum and colon. Gut. 1986;27(1):78–85. doi:10.1136/gut.27.1.78.
- Lyerly DM, Lockwood DE, Richardson SH, Wilkins TD. Biological activities of toxins a and B of Clostridium difficile. Infect Immun. 1982;35(3):1147–1150. doi:10.1128/iai.35.3.1147-1150.1982.
- Taylor NS, Thorne GM, Bartlett JG. Comparison of two toxins produced by Clostridium difficile. Infect Immun. 1981;34(3):1036–1043. doi:10.1128/iai.34.3.1036-1043.1981.
- Moore R, Pothoulakis C, LaMont JT, Carlson S, Madara JL. C. difficile toxin a increases intestinal permeability and induces Cl− secretion. Am J Physiol. 1990;259(2):G165–172. doi:10.1152/ajpgi.1990.259.2.G165.
- Mitchell TJ, Ketley JM, Burdon DW, Candy DCA, Stephen J. The effects of Clostridium difficile crude toxins and purified toxin a on stripped rabbit ileal mucosa in Ussing chambers. J Med Microbiol. 1987;23(3):199–204. doi:10.1099/00222615-23-3-199.
- Triadafilopoulos G, Pothoulakis C, O’Brien MJ, LaMont JT. Differential effects of Clostridium difficile toxins a and B on rabbit ileum. Gastroenterology. 1987;93(2):273–279. doi:10.1016/0016-5085(87)91014-6.
- Das S, Jayaratne R, Barrett KE. The role of ion transporters in the pathophysiology of infectious diarrhea. Cell Mol Gastroenterol Hepatol. 2018;6(1):33–45. doi:10.1016/j.jcmgh.2018.02.009.
- Hayashi H, Szászi K, Coady-Osberg N, Furuya W, Bretscher AP, Orlowski J, Grinstein S. Inhibition and redistribution of NHE3, the apical Na+/H+ exchanger, by Clostridium difficile toxin B. J Gen Physiol. 2004;123(5):491–504. doi:10.1085/jgp.200308979.
- Engevik MA, Engevik KA, Yacyshyn MB, Wang J, Hassett DJ, Darien B, Yacyshyn BR, Worrell RT. Human Clostridium difficile infection: inhibition of NHE3 and microbiota profile. Am J Physiol-Gastrointest Liver Physiol. 2014;308(6):G497–G509. doi:10.1152/ajpgi.00090.2014.
- Coffing H, Priyamvada S, Anbazhagan AN, Salibay C, Engevik M, Versalovic J, Yacyshyn MB, Yacyshyn B, Tyagi S, Saksena S, et al. Clostridium difficile toxins a and B decrease intestinal SLC26A3 protein expression. Am J Physiol - Gastrointest Liver Physiol. 2018;315(1):G43–G52. doi:10.1152/ajpgi.00307.2017.
- Janecke AR, Heinz-Erian P, Yin J, Petersen B-S, Franke A, Lechner S, Fuchs I, Melancon S, Uhlig HH, Travis S, et al. Reduced sodium/proton exchanger NHE3 activity causes congenital sodium diarrhea. Hum Mol Genet. 2015;24(23):6614–6623. doi:10.1093/hmg/ddv367.
- Höglund P, Haila S, Socha J, Tomaszewski L, Saarialho-Kere U, Karjalainen-Lindsberg M-L, Airola K, Holmberg C, de la Chapelle A, Kere J, et al. Mutations of the Down–regulated in adenoma (DRA) gene cause congenital chloride diarrhoea. Nat Genet. 1996;14(3):316–319. doi:10.1038/ng1196-316.
- Gawenis LR, Stien X, Shull GE, Schultheis PJ, Woo AL, Walker NM, Clarke LL. Intestinal NaCl transport in NHE2 and NHE3 knockout mice. Am J Physiol Gastrointest Liver Physiol. 2002;282(5):G776–784. doi:10.1152/ajpgi.00297.2001.
- Schweinfest CW, Spyropoulos DD, Henderson KW, Kim J-H, Chapman JM, Barone S, Worrell RT, Wang Z, Soleimani M. Slc26a3 (dra)-deficient mice display chloride-losing diarrhea, enhanced colonic proliferation, and distinct up-regulation of ion transporters in the colon. J Biol Chem. 2006;281(49):37962–37971. doi:10.1074/jbc.M607527200.
- Clayburgh DR, Musch MW, Leitges M, Fu Y-X, Turner JR. Coordinated epithelial NHE3 inhibition and barrier dysfunction are required for TNF-mediated diarrhea in vivo. J Clin Invest. 2006;116(10):2682–2694. doi:10.1172/JCI29218.
- Erokhova L, Horner A, Ollinger N, Siligan C, Pohl P. The sodium glucose cotransporter SGLT1 is an extremely efficient facilitator of passive water transport. J Biol Chem. 2016;291(18):9712–9720. doi:10.1074/jbc.M115.706986.
- Martín MG, Turk E, Lostao MP, Kerner C, Wright EM. Defects in Na+/glucose cotransporter (SGLT1) trafficking and function cause glucose-galactose malabsorption. Nat Genet. 1996;12(2):216–220. doi:10.1038/ng0296-216.
- Talbot C, Lytle C. Segregation of Na/H exchanger-3 and Cl/HCO3 exchanger SLC26A3 (DRA) in rodent cecum and colon. Am J Physiol-Gastrointest Liver Physiol. 2010;299(2):G358–G367. doi:10.1152/ajpgi.00151.2010.
- Cha B, Tse M, Yun C, Kovbasnjuk O, Mohan S, Hubbard A, Arpin M, Donowitz M. The NHE3 juxtamembrane cytoplasmic domain directly binds ezrin: dual role in NHE3 trafficking and mobility in the brush border. Mol Biol Cell. 2006;17(6):2661–2673. doi:10.1091/mbc.e05-09-0843.
- Riegler M, Sedivy R, Pothoulakis C, Hamilton G, Zacherl J, Bischof G, Cosentini E, Feil W, Schiessel R, LaMont JT, et al. Clostridium difficile toxin B is more potent than toxin a in damaging human colonic epithelium in vitro. J Clin Invest. 1995;95(5):2004–2011. doi:10.1172/JCI117885.
- Heyman M, Corthier G, Lucas F, Meslin JC, Desjeux JF. Evolution of the caecal epithelial barrier during Clostridium difficile infection in the mouse. Gut. 1989;30(8):1087–1093. doi:10.1136/gut.30.8.1087.
- Chanez-Paredes SD, Abtahi S, Kuo W-T, Turner JR. Differentiating between tight junction-dependent and tight junction-independent intestinal barrier loss in vivo. Methods Mol Biol. 2021;2367:249–271.
- Clayburgh DR, Barrett TA, Tang Y, Meddings JB, Van Eldik LJ, Watterson DM, Clarke LL, Mrsny RJ, Turner JR. Epithelial myosin light chain kinase-dependent barrier dysfunction mediates T cell activation-induced diarrhea in vivo. J Clin Invest. 2005;115(10):2702–2715. doi:10.1172/JCI24970.
- Kang L, Fang X, Song Y-H, He Z-X, Wang Z-J, Wang S-L, Li Z-S, Bai Y. Neutrophil–epithelial crosstalk during intestinal inflammation. Cell Mol Gastroenterol Hepatol. 2022;14(6):1257–1267. doi:10.1016/j.jcmgh.2022.09.002.
- Hecht G, Pothoulakis C, LaMont JT, Madara JL. Clostridium difficile toxin a perturbs cytoskeletal structure and tight junction permeability of cultured human intestinal epithelial monolayers. J Clin Invest. 1988;82(5):1516–1524. doi:10.1172/JCI113760.
- Nusrat A, von Eichel-Streiber C, Turner JR, Verkade P, Madara JL, Parkos CA. Clostridium difficile toxins disrupt epithelial barrier function by altering membrane microdomain localization of tight junction proteins. Infect Immun. 2001;69(3):1329–1336. doi:10.1128/IAI.69.3.1329-1336.2001.
- Mileto SJ, Jardé T, Childress KO, Jensen JL, Rogers AP, Kerr G, Hutton ML, Sheedlo MJ, Bloch SC, Shupe JA, et al. Clostridioides difficile infection damages colonic stem cells via TcdB, impairing epithelial repair and recovery from disease. Proc Natl Acad Sci. 2020;117(14):8064–8073. doi:10.1073/pnas.1915255117.
- Drewes JL, Chen J, Markham NO, Knippel RJ, Domingue JC, Tam AJ, Chan JL, Kim L, McMann M, Stevens C, et al. Human colon cancer–derived Clostridioides difficile strains drive colonic tumorigenesis in mice. Cancer Discov. 2022;12(8):1873–1885. doi:10.1158/2159-8290.CD-21-1273.
- Marchelletta RR, Gareau MG, McCole DF, Okamoto S, Roel E, Klinkenberg R, Guiney DG, Fierer J, Barrett KE. Altered expression and localization of ion transporters contribute to diarrhea in mice with Salmonella-induced enteritis. Gastroenterology. 2013;145(6):1358–1368.e4. doi:10.1053/j.gastro.2013.08.054.
- Hodges K, Gill R. Infectious diarrhea: cellular and molecular mechanisms. Gut Microbes. 2010;1(1):4–21. doi:10.4161/gmic.1.1.11036.
- Lehmann A, Hornby PJ. Intestinal SGLT1 in metabolic health and disease. Am J Physiol-Gastrointest Liver Physiol. 2016;310(11):G887–G898. doi:10.1152/ajpgi.00068.2016.
- Yoshikawa T, Inoue R, Matsumoto M, Yajima T, Ushida K, Iwanaga T. Comparative expression of hexose transporters (SGLT1, GLUT1, GLUT2 and GLUT5) throughout the mouse gastrointestinal tract. Histochem Cell Biol. 2011;135(2):183–194. doi:10.1007/s00418-011-0779-1.
- González Bosc LV, Vidal NA, Prieto R, Tur JA. Effect of atrial natriuretic peptide on α-methyl-d-glucoside intestinal active uptake in rats. Peptides. 1998;19(7):1249–1253. doi:10.1016/S0196-9781(98)00072-2.
- Honka H, Mäkinen J, Hannukainen JC, Tarkia M, Oikonen V, Teräs M, Fagerholm V, Ishizu T, Saraste A, Stark C, et al. Validation of [18F]fluorodeoxyglucose and positron emission tomography (PET) for the measurement of intestinal metabolism in pigs, and evidence of intestinal insulin resistance in patients with morbid obesity. Diabetologia. 2013;56(4):893–900. doi:10.1007/s00125-012-2825-5.
- Antunes A, Martin-Verstraete I, Dupuy B. CcpA-mediated repression of Clostridium difficile toxin gene expression. Mol Microbiol. 2011;79(4):882–899. doi:10.1111/j.1365-2958.2010.07495.x.
- Dupuy B, Sonenshein AL. Regulated transcription of Clostridium difficile toxin genes. Mol Microbiol. 1998;27(1):107–120. doi:10.1046/j.1365-2958.1998.00663.x.
- Mefferd CC, Bhute SS, Phan JR, Villarama JV, Do DM, Alarcia S, Abel-Santos E, Hedlund BP. A high-fat/high-protein, atkins-type diet exacerbates Clostridioides (Clostridium) difficile infection in mice, whereas a high-carbohydrate diet protects. mSystems. 2020;5(1):e00765–19. doi:10.1128/mSystems.00765-19.
- Engevik AC, Goldenring JR. Trafficking ion transporters to the apical membrane of polarized intestinal enterocytes. Cold Spring Harb Perspect Biol. 2018;10(1):a027979. doi:10.1101/cshperspect.a027979.
- Kekuda R, Saha P, Sundaram U. Role of Sp1 and HNF1 transcription factors in SGLT1 regulation during chronic intestinal inflammation. Am J Physiol-Gastrointest Liver Physiol. 2008;294(6):G1354–G1361. doi:10.1152/ajpgi.00080.2008.
- Malakooti J, Saksena S, Gill RK, Dudeja P. Transcriptional regulation of the intestinal luminal Na + and Cl − transporters. Biochem J. 2011;435(2):313–325. doi:10.1042/BJ20102062.
- Sundaram U, Wisel S, Rajendren VM, West AB. Mechanism of inhibition of Na+-glucose cotransport in the chronically inflamed rabbit ileum. Am J Physiol-Gastrointest Liver Physiol. 1997;273(4):G913–G919. doi:10.1152/ajpgi.1997.273.4.G913.
- Yu H, Chen K, Sun Y, Carter M, Garey KW, Savidge TC, Devaraj S, Tessier ME, von Rosenvinge EC, Kelly CP, et al. Cytokines are markers of the Clostridium difficile-induced inflammatory response and predict disease severity. Clin Vaccine Immunol. 2017;24(8):e00037–17. doi:10.1128/CVI.00037-17.
- Bruewer M, Luegering A, Kucharzik T, Parkos CA, Madara JL, Hopkins AM, Nusrat A. Proinflammatory cytokines disrupt epithelial barrier function by apoptosis-independent mechanisms. J Immunol. 2003;171(11):6164–6172. doi:10.4049/jimmunol.171.11.6164.
- Kumar A, Priyamvada S, Ge Y, Jayawardena D, Singhal M, Anbazhagan AN, Chatterjee I, Dayal A, Patel M, Zadeh K, et al. A novel role of SLC26A3 in the maintenance of intestinal epithelial barrier integrity. Gastroenterology. 2021;160(4):1240–1255.e3. doi:10.1053/j.gastro.2020.11.008.
- Engevik AC, Kaji I, Engevik MA, Meyer AR, Weis VG, Goldstein A, Hess MW, Müller T, Koepsell H, Dudeja PK, et al. Loss of MYO5B leads to reductions in Na+ Absorption with maintenance of CFTR-Dependent Cl– Secretion in enterocytes. Gastroenterology. 2018;155(6):1883–1897.e10. doi:10.1053/j.gastro.2018.08.025.
- Foulke-Abel J, In J, Yin J, Zachos NC, Kovbasnjuk O, Estes MK, de Jonge H, Donowitz M. Human enteroids as a model of upper small intestinal ion transport physiology and pathophysiology. Gastroenterology. 2016;150(3):638–649.e8. doi:10.1053/j.gastro.2015.11.047.
- Kaji I, Roland JT, Watanabe M, Engevik AC, Goldstein AE, Hodges CA, Goldenring JR. Lysophosphatidic acid increases maturation of brush borders and SGLT1 activity in MYO5B-deficient mice, a model of microvillus inclusion disease. Gastroenterology. 2020;159(4):1390–1405.e20. doi:10.1053/j.gastro.2020.06.008.
- Ng YK, Ehsaan M, Philip S, Collery MM, Janoir C, Collignon A, Cartman ST, Minton NP. Expanding the repertoire of gene tools for precise manipulation of the Clostridium difficile genome: allelic exchange using pyre alleles. Plos One. 2013;8(2):e56051. doi:10.1371/journal.pone.0056051.
- Kuehne SA, Minton NP. ClosTron-mediated engineering of Clostridium. Bioengineered. 2012;3(4):247–254. doi:10.4161/bioe.21004.
- Otsu N. A threshold selection method from gray-level histograms. IEEE Trans Syst Man Cybern. 1979;9(1):62–66. doi:10.1109/TSMC.1979.4310076.
- Theriot CM, Koumpouras CC, Carlson PE, Bergin II, Aronoff DM, Young VB. Cefoperazone-treated mice as an experimental platform to assess differential virulence of Clostridium difficile strains. Gut Microbes. 2011;2(6):326–334. doi:10.4161/gmic.19142.
- Nik AM, Carlsson P. Separation of intact intestinal epithelium from mesenchyme. BioTechniques. 2013;55(1):42–44. doi:10.2144/000114055.