
ABSTRACT
We report the first use of constraint-based microbial community modeling on a single individual with episodic inflammation of the gastrointestinal tract, who has a well documented set of colonic inflammatory biomarkers, as well as metagenomically-sequenced fecal time series covering seven dates over 16 months. Between the first two time steps the individual was treated with both steroids and antibiotics. Our methodology enabled us to identify numerous time-correlated microbial species and metabolites. We found that the individual’s dynamical microbial ecology in the disease state led to time-varying in silico overproduction, compared to healthy controls, of more than 24 biologically important metabolites, including methane, thiamine, formaldehyde, trimethylamine N-oxide, folic acid, serotonin, histamine, and tryptamine. The microbe-metabolite contribution analysis revealed that some Dialister species changed metabolic pathways according to the inflammation phases. At the first time point, characterized by the highest levels of serum (complex reactive protein) and fecal (calprotectin) inflammation biomarkers, they produced L-serine or formate. The production of the compounds, through a cascade effect, was mediated by the interaction with pathogenic Escherichia coli strains and Desulfovibrio piger. We integrated the microbial community metabolic models of each time point with a male whole-body, organ-resolved model of human metabolism to track the metabolic consequences of dysbiosis at different body sites. The presence of D. piger in the gut microbiome influenced the sulfur metabolism with a domino effect affecting the liver. These results revealed large longitudinal variations in an individual’s gut microbiome ecology and metabolite production, potentially impacting other organs in the body. Future simulations with more time points from an individual could permit us to assess how external drivers, such as diet change or medical interventions, drive microbial community dynamics.
Graphical abstract
Introduction
The human gut microbiome performs essential functions in shaping the host immune system, host cell proliferation, and is involved in the maintenance of endocrine functions.Citation1 The human microbiome consists of a large number of archaeal and bacterial species,Citation2 with the composition of the microbiome depending on host factors, such as age, sex, location, ethnicity, and lifestyle (e.g., diet, exercise, and medication). Between healthy individuals, the relative abundances of taxa are highly variable, while the functional capabilities are more stable. In contrast, many multifactorial diseases are characterized by a dysbiotic microbiome.Citation3
An individual’s gut microbiome has a variable composition in different parts of the digestive tract and can undergo extensive modifications throughout life.Citation4 Therefore, combining single time points from a range of people does not reveal the dynamics of an individual dysbiotic gut microbiome. In contrast, by following a time series of the microbiome ecology of an individual, one can trace the interaction of the host symptomatology and inflammation with the time-shifting gut microbiome ecology.Citation5 The host immune system creates a variety of anti-microbial proteins, with different functions. In our individual’s time series, we can follow four measurable fecal biomarkers: calprotectin and lactoferrin (shed from white blood cells), lysozyme (innate immune system), and secretory IgA (adaptive immune system)Citation6 as indicators of levels of severity of episodic colonic inflammation. This time-varying inflammation is the by-product of the constant interaction between the human host’s immune system and the changing ecological profile of the host’s gut microbiome.Citation7 Historically, IBD has been considered to have two main subtypes: ulcerative colitis (UC) and Crohn’s disease (CD). However, a large (30,000 patients) human genotype study in 2016Citation8 demonstrated that the human genetic predisposition is best explained by three subtypes: ileal Crohn’s disease (ICD), colonic Crohn’s disease (CCD), and UC. This same IBD tripartite division is seen when the gut microbiome ecology is clustered.Citation9 This separation into three subtypes is even clearer when using the Kyoto Encyclopaedia of Genes and Genomes (KEGG) database to cluster the gut microbiome of patients.Citation10
Recently, the study of the microbiome has moved from “Who is there?” to “What are they doing?”. In particular, the constraint-based reconstruction and analysis (COBRA) framework, which relies on a genome-scale reconstruction of a target organism’s metabolism and the application of condition-specific constraints, e.g., meta-omics data and allowed uptake of nutrients,Citation11 has moved these questions further to “What do they produce?”, and “How do they interact?”.Citation12–15 Genome-scale reconstructions are assembled using organisms’ genome sequences and biochemical, genetic, and physiological evidence.Citation16 COBRA assumes the biological systems to be at a steady state, i.e., the change in metabolite concentration over time is zero.
Flux balance analysis (FBA),Citation15 a frequently used COBRA method, assumes in addition that the biological system tries to achieve an objective, e.g., maximal biomass yield.Citation17 FBA has been successfully applied to investigate the role of the human gut microbiome in various complex diseases, including Parkinson’s disease,Citation18,Citation19 and inflammatory bowel disease.Citation20–22 To facilitate the application of constraint-based modeling to research on the human gut microbiome, the AGORA (Assembly of Gut Organisms through Reconstruction and Analysis) collection was established,Citation23 and recently expanded to cover over 7,200 semi-manually curated microbial genome-scale metabolic reconstructions.Citation24
In prior studies, FBA was used on a set of microbiome samples comparing healthy individuals with IBD patients at a single time per patient. COBRA modeling has been used to link mechanistically host-microbiome-environment interactions to IBD-related changes.Citation11 The potential of 818 microbial strains to deconjugate primary bile acids into secondary bile acids has been investigated with a combined approach based on comparative genomics followed by FBA.Citation25 In that study, it has been reported that microbial species can complement each other’s bile acid pathway to achieve the broader bile acid production repertoire observed in fecal samples.Citation25
In this paper, we investigate how extreme time changes of the gut microbiome ecology in a single individual with large episodic colonic inflammation are associated with large time variations in a number of key metabolites. To explore the interaction between host metabolism and the compounds produced by the normal and the dysbiotic gut microbiome, we performed an additional investigation using sex-specific, organ-resolved, whole-body metabolic models of human metabolism, which account for 28 organs, tissues, and cell types.Citation26
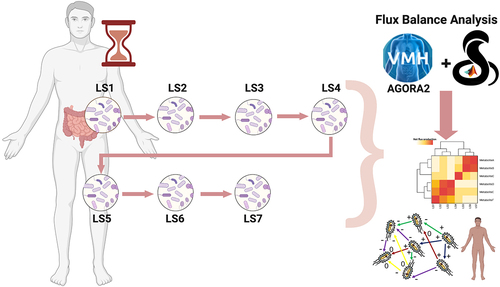
The present study used FBA to analyze the metabolic evolution of the gut microbiome community in a single individual (“LS”) affected by left-sided colonic inflammation across seven time points covering a period of 16 months in 2012/2013 (). We have chosen to investigate the use of FBA in this case study because the LS gut microbiome time series has been carefully studied in several prior papers. The metagenomic data for these seven time points have been previously comparedCitation10,Citation27 with a set of metagenomic data from healthy individuals drawn from the NIH Human Microbiome Project,Citation28 as well as selected metagenomic data from patients with ICD and with UC.Citation10 Another studyCitation21 investigates metagenomics of an extension of the LS fecal time series from the 7 discussed here to 27 time points, with a particular emphasis on E. coli strain evolution. An even longer time period, although more sparsely sampled, was examined for metaproteomics.Citation29 Finally, a detailed analysis of LS daily samplesCitation30 over a month has shown that LS’s gut microbiome taxonomic profile deviated substantially from the healthy individuals exhibiting major taxonomic shifts over short time intervals.
Figure 1. Timeline with metadata of the different samples.

In this paper, we found that LS’s major gut microbiome taxonomic shifts over time led to correspondingly large FBA metabolic shifts from the personalized microbial community models. Since we also computed the metabolite production from each of the 34 healthy controls’ microbiome, we could compare LS’s metabolite production at each time point to the average value (HeAve) of the healthy controls. The results of our models showed that several biologically important metabolites were highly (10–10,000×) overproduced, compared to HeAve, at various time points in LS’s samples, including oxygen, methane, thiamine, formaldehyde, trimethylamine N-oxide, folic acid, serotonin, histamine, and tryptamine. Furthermore, our results suggest that through the production of few metabolites, i.e., L-serine and formate, species of the Dialister genus cooperate with many pathogenic strains, such as adherent invasive Escherichia coli strains, archaeal species, and Desulfovibrio piger ATCC2. The interactions trigger inflammatory responses and enhance methane production. Finally, D. piger ATCC2 plays an important role in the production of the host-toxic SO3−2. Additionally, we investigated host-microbiome co-metabolism during these time points.
In conclusion, we demonstrate that microbial community metabolic models can reflect a single individual’s gut microbiome’s dynamics, which resulted in significant changes in metabolite production, and which affected host organs. More studies with multiple time points are needed to understand how the host-microbiome co-metabolism reacts to changes in diet and medical interventions.
Results and discussion
Characterisation of the time points
The n = 1 patient “LS” with episodic colonic inflammation was a nonsmoker male, 63 years old at baseline. A detailed description of his medical history is reported in Supplementary Materials, with his physicians diagnosing LS with a combination of CCD and Segmental Colitis Associated with Diverticulosis (SCAD), a condition where the inflammation of the colonic mucosa occurs in the same segments that are affected by diverticulosis.Citation31
As part of an earlier study, the J. Craig Venter Institute carried out (see Methods) deep (~100 M reads per sample) shotgun metagenomic sequencing,Citation27 yielding 510 species and 790 strains relative abundance, on frozen fecal samples for seven time points, deemed LS1 to LS7 (Supplementary Table S1, sheets “Abundances_metagenomics_species” and “Abundances_metagenomics”) according to the time of collection. All time points were characterized by abnormal concentrations of hematic and fecal immune or inflammatory biomarkers, with LS1 having both the highest hematic complex reactive protein (CRP) and the highest fecal calprotectin concentration (), (Supplementary Table S1 sheet “Metadata”). In contrast, lactoferrin, lysozyme, and secretory IGA had their highest values at LS4 and LS7.
The medical intervention between LS1 and LS2 () consisted of two months of daily 40 mg oral prednisone, a drug used to suppress the immune system and decrease colon inflammation, starting January 31, 2012. In addition, during the first of these two months, LS was prescribed two antibiotics (500 mg ciprofloxacin administered orally twice a day and 250 mg metronidazole administered orally three times per day).Citation29 The combined treatment was suggested to reduce the colon inflammation, while also reducing the high level of blood CRP inflammation (Supplementary material, LS Medical History).
In addition to LS time series of gut microbiome metagenomics, we obtained shotgun metagenomic data (~100 M reads per person) for the gut microbiome from 34 healthy individuals in the Human Microbiome ProjectCitation32 (Methods, Supplementary Table S1 sheet “rawreads”). This control dataset allowed for the comparison of the LS microbiome with healthy individuals and for the identification of microbial and functional differences associated with the disease status at each time point.
Analysis of metagenomic data with microbiome-level metabolic models
First, we investigated the time evolution of the metagenomic phyla abundances in the healthy and disease microbiomes. We identified major differences over time between the seven LS time samples and the healthy microbiomes across the most abundant phyla: Actinobacteria, Bacteroidetes, Euryarchaeota, Firmicutes, Fusobacteria, Proteobacteria, and Verrucomicrobia (), (Supplementary Table S1 sheet “Abundances_metagenomics”). Then, we used the strains identified in the shotgun metagenomic data of LS (Supplementary Table S1 sheet “Abundances_metagenomics”) as input to the AGORA2 collection of microbial metabolic reconstructionsCitation24 (see Methods). This process led to the creation of seven in silico microbial community models (Supplementary Table S1 sheet “Abundances_AGORA2”) accounting for a total of 213 distinct microbes, covering both bacterial and archaeal species. We used the seven ecological models to compute the metabolites produced by the microbial communities (Methods). ITherefore, the maximal production and uptake fluxes of each metabolite from all the microbial species was computed, using the procedure outlined by Orth and colleagues.Citation15 In the following sections, we will state when we are referring to the input metagenomic microbial abundances or to the AGORA2 mapped abundances.
Figure 2. Graphical representation of the time evolution of the gut microbiome ecology in the microbial community model.

Using the metagenomic relative abundances, we compared LS microbial species composition at each time point and with those of the 34 healthy controls, including calculating both the maximum (HeMax) and average (HeAve) abundance of each microbial species across the healthy individuals (Supplementary Table S1 sheet “HealthyInd_metagenomics_species”). We observed cases where LSMax > HeAve, meaning that the disease state associated microbiome fluctuated over time and exceeded the average relative abundance in the healthy population. Additionally, we identified cases with LSMax > HeMax, meaning that the relative abundance in the disease state could be greater than the largest cross-population variation. Using this comparison, the dysbiosis experienced by LS was characterized by a major decrease in microbe species that were dominant in the healthy individuals, thereby allowing for the time-dependent bloom of typically less abundant microbes in LS1-7 (Supplementary Fig. S3-S9).
In more detail, the average healthy control’s gut microbiomes were found to be predominantly composed of Bacteroidetes (65.6%) and a lower fraction of Firmicutes (30%) (). In contrast, the most abundant LS microbiome phylum at all seven time points was Firmicutes, which ranged from 1.4 to 2.5× the HeAve abundance (), (Supplementary Table S1 sheet “Phyla abundances”). The overabundance of Firmicutes was driven by the blooming of normally rare Firmicutes species from classes Bacilli and Clostridia, with overabundances ranging from 100–1,000× HeAve for those species. In particular, the family Lachnospiraceae (in class Clostridia) was 2.6–3.7× HeAve, mainly represented by Dorea longicatena DSM 13,814, normally rare, but 25× HeAve in LS4 (), (Supplementary Table S1 sheet “Abundances_AGORA2”). In contrast, the other dominant microbial phylum in healthy individuals, Bacteroidetes, was depleted by more than 10× in all LS time points except LS6 when it bounced back to half the abundance of HeAve.
Figure 3. Correlations between microbial abundances and secretion fluxes of key metabolites.

The ecological absence of the normally dominant phylum Bacteroidetes allowed other, normally rare phyla in the healthy individuals, to dynamically bloom. In particular, the phylum Euryarchaeota was elevated by at least three times in all samples when compared with the HeAve, with an extreme overabundance in LS1 and LS6, which are 137× HeAve and 57× HeAve, respectively (Supplementary Table S1 sheet “Phyla abundances”). The observed high archaeal relative abundances in all the phases are typical of CD-associated dysbiosis.Citation33 In particular, the presence of the family Methanobacteriaceae (dominated by Methanobrevibacter smithii) was strongly influenced by the disease, varying between 3-170× HeAve (Supplementary Fig. S13), with the highest value occurring at LS1. The phylum Proteobacteria was also overabundant, compared to healthy individuals, at all seven time points. For LS1–3, it was approximately seven times higher, and for LS7, it was 10 times higher than HeAve. Within this phylum, the family Enterobacteriaceae reached a peak of > 150× HeAve in LS7 (Supplementary Table S1 sheet “Abundances_metagenomics”, Supplementary Fig. S10). The abundance of family Enterobacteriaceae species E. coli in LS1 was 187× (Supplementary Table S1 sheet “Abundances_metagenomics”, Supplementary Fig. S11). Phylum Actinobacteria had a higher abundance (4-50× HeAve) at all time points and a higher diversity with 58 different species present at time point LS5 compared to the healthy average (36 species).Citation30 Among these species, Bifidobacterium longum climaxed to seven times the HeAve. Finally, there were also isolated blooms of the phyla Fusobacteria (40× and 11× HeAve at LS1 and LS6) and Verrucomicrobia (seven times the HeAve at LS5).
To assess the diversity within each microbial community model, we calculated the alpha diversity based on the AGORA2 taxonomic assignments for both LS1-7 and HeAve. The highest LS alpha diversity was obtained for LS6 (). Although LS2 was the time point with the highest number of species, it was not the one with the highest alpha diversity, when the taxonomic differences of the different samples were weighted with a hierarchical tree based on the taxonomies.Citation34 This result was mainly due to the algorithm used to calculate the alpha diversity, which considered the taxonomic diversity among the strains present in the samples. It reflects the presence of many species, which were, however, taxonomically highly related (e.g., belonging to the same phylum). Indeed, LS2 was mainly composed of Firmicutes and Actinobacteria, which covered more than 70% of the relative abundance in the sample (, ), (Supplementary Table S1 sheet “Phyla abundances” and “alpha diversity”).
Table 1. Information about the species filtering performed through AGORA2 mapping.
To assess the changes in diversity between the time points, we calculated the beta diversity using the Bray-Curtis dissimilarity index.Citation34 The average beta diversity between samples was 58.00. The two most dissimilar samples were LS1 and LS2 (84.1%), likeliest reflecting the effect of the antibiotic treatment before LS2 collection. The two lowest beta diversities were between LS3 with LS4, which had a beta diversity of 23.44, and LS5 with LS7 of 35.76. The diversity between LS1 and LS6 was 79.50 (Supplementary Table S1 sheet “beta diversity”).
In the Principal Component Analysis (PCA) performed on microbial composition and abundances (), (Supplementary Fig. S1, S2), the first component accounted for 47.6% of the total variability, while both the second and the third components each accounted for approximately 13% of the total variability. The different PCA components were mainly driven by the differential abundance of two archaeal species, i.e., the already mentioned M. smithii ATCC 35,061, and Methanosphaera stadtmanae DSM 3091 (LSMax = 542× HeAve). Both archaea were more abundant in LS1 and LS6 in comparison to the other time points (), (Supplementary Fig. S2, S17). In the PCA cluster plot, LS6 was clearly separated from the other six LS time points () being closer to HeAve, consistent with the higher alpha diversity of the LS6 microbiome () compared to the other time points.
As aforementioned, the LS1 gut microbiome was severely depleted in almost all of the most abundant HeAve species (), (Supplementary Fig. S3-S9). We found 21 microbe species with relative abundance > 1% in HeAve, yet they were very rare (HeAve/LS1 > 10) in LS1 (), (Supplementary Fig. S3A), including the phylum Bacteroidetes species Prevotella copri (1436×), Bacteroides stercoris (152×), Bacteroides caccae (43×), Bacteroides ovatus (40×), Bacteroides vulgatus (28×), Bacteroides dorei (20×), Alistipes putredinis (15×) and the phylum Firmicutes species Eubacterium rectale (43×) and Ruminococcus bromii (11×). Only three of the 21 HeAve most abundant species had relative abundances in LS1 that were comparable (1<HeAve/LS1 < 5) to HeAve: Faecalibacterium prausnitzii (4.5×), and Alistipes finegoldii (3×), Dialister invisus (1.5×). We note that F. prausnitzii is a well-known anti-inflammatory bacterium. Its high level at LS1 may be an indication of the microbiome attempting to counter the high level of host inflammation at LS1.
A complementary analysis identified microbial species with the highest relative abundance (>1%) in the gut microbiome of LS1 (Supplementary Fig. S3B). Not only were there fewer microbe species that had a relative abundance > 1% than in HeAve, but also the most abundant microbes in LS1 were normally extremely rare in the healthy gut microbiome. Except for Dialister invisus (to which we will return later), all of the dominant LS1 microbiome species ranged from 100 to almost 1,000 times more abundant than in the healthy gut microbiome. A number of these normally rare species (e.g., E. coli, M. smithii, M. stadtmanae, and P. micra) will have major impacts on key metabolite production, as we will discuss later in this paper. This illustrates a classic ecological dynamics result: when formerly dominant species are wiped out, normally rarer species can bloom and become the dominant ones.
Taken together, our metagenomic time series analysis demonstrated that the microbial composition varied substantially between the LS time points, as well as compared to the healthy average. The strong differences between LS and healthy samples in microbial abundance motivated the use of metabolic modeling to understand how these metagenomic differences over time could influence metabolite production as the gut microbiome ecology shifts.
Microbial and metabolic changes over time
To investigate potential changes in metabolic activity associated with the dysbiotic microbiome composition at each time point, we performed metabolic modeling and FBACitation15 assuming a Western diet.Citation35 For each metabolite, we computed the net metabolite production potential (Methods, Supplementary Table S2). The resulting in silico metabolite production profiles represent the potential of all microbial community members to uptake dietary metabolites and secrete metabolic end products. We also predicted microbe-specific contributions to the overall fluxes in each microbial community model (Methods). To allow for the comparison between the LS microbiome and the healthy gut microbiome, we calculated the healthy average of the fluxes (HeAveFluxes) from 34 healthy controls microbial community models generated using the healthy controls’ metagenomic data (Supplementary Table S2). The resulting HeAveFluxes enabled us to discover that over 20 metabolites had a predicted maximum value over the LS1–7 LS dysbiotic gut microbiome, which ranged from 10 to 750 times higher than the maximum values across the healthy controls (Supplementary Table S2).
Next, we examined in detail the strong time variations of a number of key gut microbially produced metabolites. Specifically, we selected 24 metabolite exchange reactions with LSMax/LSMin flux ratios > 10 [or if LSMin = 0, the ratio is large (technically divided by 0)] to examine in more depth (Supplementary Table in Supplementary Materials). All but five of these 24 were greatly overproduced by LS, with LSMax from 5× to 750× times the highest value (HeMax) found across the 34 healthy controls. For each of these 24 metabolites, we then visually pattern-matched the metabolite time graph to microbial species relative abundance graphs over time. This approach allowed for the identification of several microbe-metabolite relationship time variation patterns over LS1–7 (), (Supplementary Fig. S15-S21). The microbe-metabolite relationships were characterized by two distinct microbe/metabolite classes: Class I, with a peak value at LS1 and dramatically lower values in the other time points (e.g., the M. smithii/methane, ), (Supplementary Fig. S17), and Class II, which were low in LS1 and higher values in the subsequent time points (e.g., Dorea longicatena DSM 13,814/Pyridoxal, ). We give archetypal examples of each Class in with subclasses of Classes I and II defined with matching metabolite examples in Supplementary Fig. S15-S21.
Among the two dozen microbe species-metabolite pairs, a deeper biochemical pathway analysis was required to determine whether a causal relationship may exist between the bacteria and the metabolite they produce. Because of our discovery of the extreme overproduction in the disease state compared to the inter-population variability in healthy individuals, these metabolites are all potential candidates to be biomarkers for tracking the episodic development of the disease. Below, we take a first look at this hypothesis.
Methane and Methanobacteriaceae
The average methane production in healthy gut microbiomes (HeAveFluxes) computed using the corresponding microbial community model was 0.26 mmol/gDW/day (Supplementary Table S2). In contrast, in the LS diseased state, the production of methane was highest in LS1 (40.19 mmol/gDW/day) and decreased in LS2–7 (1 mmol/gDW/day at LS2) closely following Methanobacteriaceae abundance in the corresponding microbiome samples (, top). Linear regression analysis was performed to determine if the methane metabolite production correlated with inflammation measured in terms of fecal calprotectin and blood CRP. Two independent models were analyzed using calprotectin and blood CRP as quantitative independent variables. In the first model, the R-squared (R2) was 0.193 (p-value 0.324), in the second model, it was 0.311 (p-value 0.193) (Supplementary Table S2). Therefore, methane production does not seem to correlate with inflammation, but rather with the large overabundance in LS1 of Methanobacteriaceae archaea species. However, the small number of time points may be limiting in determining a real correlation. As shown in the LS medical history (SM), there was no imaging or colonoscopy indication that LS had small intestinal bacterial overgrowth (SIBO), which could also be a source of methane.Citation36 However, we do not exclude that by enhancing the number of timepoints, we could find a possible correlation. This aspect will need to be covered during future studies.
The relationship between Methanobacteriaceae abundance and methane production was also reflected in the microbe-metabolite simulations (Supplementary Table S3). At its peak, M. smithii was the most abundant species in LS1 (Supplementary Fig. S3B) and methane production in the disease state was 155× the highest value computed (HeMax) for methane across the healthy controls. This result agrees with prior findings that methanogenic archaea are the major biological source of methane in humans with a single species, M. smithii, accounting for up to 94% of methanogenic activity in most colonized individuals.Citation37 In addition, chorismate followed the same time evolution as methane, peaking at 141× HeMax.
Oxygen and E. coli
The in silico average healthy level (HeAveFluxes) of the oxygen production fluxes was 0.003 mmol/gDW/day. In contrast, the extreme value of LS1 was over 2,000 times higher (8.3 mmol/gDW/day) than HeAve and 165× HeMax (we note only two of the 34 healthy controls had any significant oxygen production). This enormous increase in the dysbiotic production of free oxygen was found to follow the time variation of E. coli, being highest at L1-L3 (where E. coli was ~ 10% of the gut microbiome ecology or 187× HeAve relative abundance), normal at LS5 and LS7, and an additional increase at LS6. It is remarkable how large the change in oxygen production was as the dysbiotic evolution progressed. The ratio of the oxygen production from its high in LS1 (8.3) to its low in LS7 (0.00075 or 0.25× HeAve) was over 10,000 fold (11,116×).
These large fluctuations suggest an obligate syntrophy with one of the oxygen-producing bacteria present in the consortium. Many reconstructions of microbial species included in the simulations (e.g., Eggerthella lenta DSM 2243, Bacteroides vulgatus ATCC 8482, and Megasphaera elsdenii DSM 20,460) have a superoxide dismutase (VMH ID: SPODM) converting reactive oxygen species to oxygen and oxygen peroxide (2.0 h[c] + 2.0 o2s[c] -> h2o2[c] + o2[c]), as well as an oxygen exchange (VMH ID: EX_o2) reaction. The simulations, therefore, suggested a novel, unidirectional interaction among these species boosting E. coli bloom with superoxide dismutase products. Our hypothesis is novel, yet consistent with the “oxygen hypothesis” that posits that some aspects of IBD symptoms may result from an increase of oxygen and reactive oxygen species into the intestinal lumen competitively favoring facultative anaerobic species over strictly anaerobic ones.Citation38 Indeed, Enterobacteriaceae bacteria, such as E. coli, can absorb and utilize oxygen being facultative aerobic species.Citation39
In addition to the likely increased anaerobic respiration, which was induced by inflammation in LS (),Citation39 the dysbiotic shifts in the microbiome ecology itself produced, according to our microbial community models, copious amounts of free oxygen, which came from the detoxification of reactive oxygen species. E. coli could then utilize this oxygen to increase its relative abundance directly via aerobic respiration. In addition to the production of free oxygen, our microbial community models predicted that the flux of trimethylamine N-oxide (TMAO) for LS1 was 3,082× HeAveFluxes (Supplementary Table S2). In previous studies, TMAO has been highlighted as a metabolite, which alters systemic homeostasis and participates in the first inflammatory states.Citation40 Furthermore, TMAO production is known to boost aerobic respiration, which favors Enterobacteriaceae, e.g., E. coli, over Clostridia and Bacteroides species.Citation41 Therefore, we conclude that there appeared to be two separate mechanisms (inflammation-induced aerobic respiration and dysbiotic microbiome ecology creating free oxygen) that both provided E. coli with a selective energy advantage over the otherwise dominant Firmicutes and Bacteroides, which can do neither anaerobic nor aerobic respiration.
Thiamine and E. coli
Vitamin synthesis by gut microbes is one of their essential ecological services to the health of the host. Our microbial community model predicted that, in the extreme of the disease state (LS1), the thiamine (vitamin B1) flux (17.1 mmol/gDW/day in LS1) was 18,318× higher than the HeAveFluxes (0.00093 mmol/gDW/day) (Supplementary Table S2). The thiamine production flux computed by the LS microbial community models was highly variable, fluctuating across LS1–7 by a factor of 15,000×, while across the population of healthy patients, each sampled at one time point, there was a variation in thiamine production of only 23 × . Furthermore, the maximum value of thiamine (at LS1) was 7,472× greater than HeMax for thiamine (Supplementary Table S2), meaning that the disease state drove thiamine production almost four orders of magnitude beyond what was seen in the cross-population production.
In addition, we also predicted other B vitamins to be overproduced in LS compared to HeAve (Supplementary Table S2). Our microbial community model predicted LSMax/HeAve for riboflavin (vitamin B2, 8×), pyridoxal (vitamin B6, 98×), and folic acid (vitamin B9, 39×). For niacinamide (vitamin B3) and biotin (vitamin B7), the healthy controls were all zero, but there was substantial production of each in LS1–7. This result highlights the value of measuring the dysbiotic time variation within a single patient instead of only reporting population averages.
Other metabolites that vary with E. coli
Several other metabolite exchange fluxes () (Supplementary Fig. S18), which closely followed the time variation in E. coli relative abundance, were also found to have an LSMax value far above cross-population HeMax value. Specifically, the ratio of LSMax/HeMax for some of these included the polyamine metabolism-related metabolites ortho-hydroxyphenylacetic acid (164×), 5’methylthioadenosine (142×), spermidine (12×), and histamine (13×) consistent with previously reported results.Citation42 In particular, dysbiosis can predispose overgrowth of E. coli, which in turn leads to increased production of histamine, thus contributing to the symptomatology of histamine intolerance.Citation3 The LS1–7 variation predicted for histamine was 170×, with a maximum flux of 46.95 mmol/gDW/day in LS1, while the HeAve was 0.32 mmol/gDW/day (Supplementary Table S2).
TMAO and Fusobacterium species
TMAO has been recently hypothesized to be a possible link mediating between red meat intake and vascular inflammation, leading to poor cardiometabolic health.Citation43 Separately, Fusobacteria have been discussed as being involved in the onset of colon cancer.Citation44 Intriguingly, at the height of LS inflammation, as measured by calprotectin and serum CRP, LS1 had nearly a 1,000× overabundance of the dominant phylum Fusobacteria species Fusobacterium sp. 12_1B, compared to HeAve. This coincided with our microbial community models predicting a similar level of overproduction of TMAO (LS1/HeAve = 3082×) and LS1/HeMax = 91×.
Serotonin and B. longum
The microbial production of the neurotransmitter serotonin, which had a variation across LS1–7 of 25× and whose maximum at LS5 was 3× the HeMax, mimicked the fluctuations of Bifidobacterium longum abundances (Supplementary Fig. S19). It is known that B. longum supernatants upregulate the serotonin transporter expression in intestinal epithelial cells.Citation45 Deregulation of gut-produced serotonin has also been associated with diarrhea or constipation symptoms.Citation46 Furthermore, according to Minderhaud and colleagues,Citation47 the severity of intestinal inflammation can depend on the availability of gut serotonin. Another metabolite, which followed the variation of B. longum and is also involved in the gut-brain axis, was tryptamine, which varied by 103× across LS1–7 and whose peak at LS1 was 25× HeMax.
Dorea longicatena and Ruminococcus obeum were the 1st and 2nd most abundant Firmicutes species in the Lachnospiraceae family in LS, respectively. Their time evolution aligned with a number of metabolites with large ratios of LSMax/HeMax: formaldehyde (3,477×), 5-methyltetrahydrofolic acid (311×), tetrahydrofolic acid (260×), folic acid (12×), pyridoxal (7×), and riboflavin (3×).
Normally rare Firmicutes species
An unusual aspect of LS dysbiosis was that at LS1 several normally quite rare Firmicutes species (Peptostreptococcus stomatis, LS’s most abundant species in Firmicutes family Peptostreptococcaceae; Solobacterium moorei, LS’s most abundant species in Firmicutes family Erysipelotrichaceae; and Parvimonas micra, LS’s most abundant species in Firmicutes family Clostridiales Family XI. Incertae Sedis) were from 250 to 1,000× more abundant than in HeAve. Their graphs over LS1–7 closely matched metabolites with high ratios of LSMax/HeMax: acetoin (38×), trimethylamine (13×), and 1,2-diacyl-sn-glycerol (8×) (Supplementary Fig. S15).
Taken together, we observed that dozens of metabolites were greatly overproduced by LS in the disease state compared to our healthy controls and we discovered numerous microbe-metabolite pairs showing similar changes over time. For a causal explanation of these observed patterns, it will be necessary to examine a larger number of time points. Overall, our analyses at the different time points as well as longitudinally illustrate that the dysbiotic microbial composition changes were associated with significant changes in metabolic function.
Metabolic and subsystem signature of each phase
After analyzing metabolites strongly diverging between LS and healthy average patients, we focused on reactions subsystem and metabolites characterizing the different phases of the disease development. The constraint-based modeling approach revealed that the reaction subsystems strongly changed during the disease progress, which was associated with changes in metabolic production potential by the microbial communities (Supplementary Table S2). It has been reported that the prevalence or absence of reaction subsystems in microbial community models can reflect healthy or dysbiotic microbial communities.Citation48
First, we investigated which metabolite production potentials followed the observed proximity of LS3 with LS4, and LS5 with LS7 in the PCA plot (). The net production of some metabolites increased or decreased constantly from LS3 to LS5 but were predicted to be very high (isobutyrate) or very low in LS6 (). The net flux production of L-isoleucine, ethanol, and L-lactate was low in LS1 and LS6 (HeAveFluxes 130.48 mmol/gDW/day), while it increased in the other time points (HeAveFluxes 234.93 mmol/gDW/day). In contrast, the production of isobutyrate followed an opposite trend and had a higher simulated accumulation in LS1 and LS6 (HeAveFluxes 106.87 mmol/gDW/day) compared to the other samples (HeAveFluxes 30.14 mmol/gDW/day). With the exception of isobutyrate, for each of the metabolites in , the ratio of the maximum values in LS1–7 (LSMax) was greater than the maximum value (HeMax) in any of the 34 healthy individuals: butyrate (2.7×), ethanol (2.6×), L-isoleucine (7.3×), and L-lactate (3×). These results suggest that monitoring the fluctuations of key microbial species and key metabolites together with the processes of bioconversion could help to identify transitions of inflammation ().
Figure 4. Metabolites net flux variation.

To identify metabolite signatures at each time point, Euclidean clusteringCitation49 was performed considering all the metabolites predicted with net flux production higher than 10 mmol/gDW/day. The results revealed the existence of three main clusters (). The threshold of 10 was selected arbitrarily for graphical purposes. The first cluster, named low fluxes (LF), grouped together all the metabolites with a very low net production; the second cluster had the metabolites with intermediate net production (IF); and the third included the metabolites with high net production (HF). The three clusters were heterogeneous in metabolic subsystem composition. Some metabolites, whose flux rates were variable among the different phases of the disease, will be discussed more in detail and the roles of the microbial species mainly involved in their production. The prevalence of subsystems including reactions related to the metabolites will also be discussed.
Figure 5. Overview of metabolites produced and reactions subsystems across the different time points.

As expected, “Methane metabolism” was strongly increased in LS1 and LS6 compared to the other phases (Supplementary Table S2) and was due to the higher abundance of methanogenic Archaea in LS1 and LS6. Accordingly, the predicted production of methane enhanced in LS1 and LS6 (log fold change (LogFC) 1.42 and 0.84, respectively, Supplementary Table S2). In contrast, some subsystems were phase-specific (Supplementary Table S2). This was the case for the “Stickland reaction” (), which couples oxidation and reduction of amino acids to organic acidsCitation50 and characterized LS1. In a study exploring the subproducts of common degradation pathways, 80% (8/10) of Stickland reaction products have been frequently detected in IBD patient stool.Citation51 Since all microbial community models for the seven time points received the same in silico diet, the observed differences were a direct result of the difference in microbial composition. The increase in hydrogen production could be an additional cause of the bloating event experienced as one of the IBD symptoms. Levitt and Olsson have already linked hydrogen production to the adverse bloating event.Citation52 LS6 was characterized by an increased abundance of E. coli strains, e.g., E. coli 042, E. coli B354, and E. coli FVEC1302, whose genomes encode enzymes belonging to lipopolysaccharide (LPS) biosynthesis subsystems. LPSs are produced and secreted by gram-negative bacteria (e.g., Salmonella typhimuriumCitation53 and E. coli,Citation54) and can provoke an immune response. LPSs are generally soluble as monomers but they can aggregate into fibrous, highly insoluble lipoproteins and lead to inflammation.Citation55 It has been reported that the concentration of LPS is increased in the acute phases of the disease compared to relapsing ones.Citation56
Butyrate is a key energy source for the host’s colonic epithelial cells.Citation57 Our microbial community models predicted that the butyrate secretion rate in LS7 (flux of 152.164 mmol/gDW/day) was more than twice as high as the LS6 butyrate secretion rate (70.58 mmol/gDW/day). This jump was confirmed by the laboratory-measured butyrate concentration in the LS6 and LS7 fecal samples (Supplementary Table S1 sheet “Metadata”, Fig. S14), which also more than doubled from 0.7 to 1.7 mg/mL. This large increase in butyrate production is likely driven by the 8-fold increase, from 3.99% (LS6) to 31.5% (LS7) (), (Supplementary Table S1 sheet “Metadata”), of the relative abundance of Faecalibacterium prausnitzii, one of the major butyrate-producing microbes in the human gut. Butyrate increase is also known to play an anti-inflammatory role in the gastrointestinal tract in CD patients.Citation58
Furthermore, the production of L-serine was increased in LS6 () compared to the other time points (Supplementary Table S2). L-serine has been shown to interact with the gut microbiome and is known to elicit the secretion of antimicrobial molecules, such as bacteriocins.Citation59 This amino acid is mainly produced by species of the Dialister genus and its importance will be discussed in the following paragraph. E. coli pathogenic strains have been proposed to use L-serine anabolism to enhance their fitness in the inflamed gut.Citation60 In contrast, this pathway has a minor role in the pathogenic bacterial growth of healthy guts,Citation61 suggesting that the signals or transduction pathways necessary for L-serine catabolism activation could be responsible for pathogen-specific adaptation to the inflammatory microenvironment. Intestinal inflammation can result in the generation of a microenvironment that is conducive to the growth of Enterobacteriaceae, allowing the outcompete of obligate anaerobes.Citation62 Therefore, enterobacterial blooms, such as those seen in LS (Supplementary Fig. S10), and more generally in CD, are a hallmark of inflammation-associated dysbiosis.Citation63 Accordingly, E. coli can catabolize L-serine converting it to pyruvate, a crucial substrate for gluconeogenesis and tricarboxylic acid cycle pathways.Citation64 L-serine also plays a role as a signaling molecule targeting the expression of stress response genes.Citation59 Furthermore, it can be used as a precursor in the synthesis of gene products involved in stress adaptation.Citation60 In this context, it is known that L-serine catabolism is increased in E. coli under heat shock conditions and L-serine is used for the generation of heat shock proteins.Citation60 L-serine uptake during inflammatory conditions is probably a conserved mechanism utilized by pathogenic bacteria for their competitive fitness.Citation65
Finally, the production of primary, conjugated bile acids and secondary bile acids were analyzed following the work of Heinken and colleagues.Citation25 Primary bile acids did not fluctuate over the different time points, while secondary bile acids showed dynamic changes peaking at the less inflamed stages of LS2, LS3, LS4, and LS6. This result is in agreement with previous studies reporting that secondary bile acids are lower in IBD-associated microbiomesCitation66 (Supplementary Fig. S22). The deconjugation was driven by the activity of Dorea formicigenerans ATCC 27,755Citation67 and Ruminococcus lactaris ATCC 29,176Citation68 (Supplementary Table 3).
Taken together, our results revealed that numerous metabolite production fluxes were altered during the seven time points. Generalising our results for IBD will require validation in other patients or hypothesis testing in model organisms.
Insight into Dialister spp. metabolism and net of interactions
Next, we aimed at elucidating which microbes were driving the metabolic changes at each phase, thereby, shedding light onto the potential mechanisms of the disease onset. Therefore, we calculated the microbe-metabolite contribution using the cooperative trade-off algorithm.Citation69 Briefly, this algorithm assumes that the growth rate of an individual microbe in the community is maximized, while a sub-optimal growth rate of the remaining microbial community is maintained. The microbe-metabolite contribution identified that, in LS6, the production of L-serine was mediated mainly by two members of the Dialister genus, i.e., Dialister succinatiphilus YIT 11,850 (Max (LS1–7) = 19× HeAve) and Dialister invisus DSM 15,470 (Max (LS1–7) = 0.9× HeAve).
D. invisus DSM 15,470 has been shown to be involved in the establishment of dysbiosis typical for the IBD gut microbiome.Citation70 Hence, metabolites produced by species of this genus were inspected in detail. D. invisus DSM 15,470 was identified in all time points except LS5, but its metabolic activity, measured in terms of the number of exchanged compounds, was very different in these time points. In LS1, D. invisus produced as many as 12 metabolites and consumed 52, while in the other time points, it consumed an average of ten metabolites. Notably, D. invisus and D. succinatiphilus YIT 11,850 produced L-serine and formate during LS1, and glycine in the other phases (), (Supplementary Table S3). Dietary glycine is known to prevent chemical-induced colitis by inhibiting the induction of inflammatory cytokines and chemokines.Citation71
Figure 6. Map of species interactions.

Both L-serine and formic acid have been proposed to mediate proinflammatory mechanisms.Citation61 In LS6, L-serine uptake was mainly mediated by members of the Enterobacteriaceae family (e.g., E. coli 042, B354, FVEC1302, and H299). Additionally, formate production in LS1 was assigned a key role in the microbial interaction (). Indeed, formate in LS1 fueled the proliferation of E. coli F11, M. smithii ATCC 35,061, and D. piger ATCC 29,098 (), (Supplementary Table S3). E. coli F11 is an adherent invasive and pathogenic strain, which takes advantage of the leaking gut to replace strictly anaerobic bacteria.Citation72 M. smithii ATCC 35,061 is a hydrogenotrophic archaeon that can use either CO2 and H2 or formate alone for methane production.Citation37 The increase in methane production, and, therefore, constipation and bloating events, is known to be partially caused by the increase of this archaeal species (), (Supplementary Table S3).Citation73 The prevalence of D. piger is higher in patients hospitalized for IBD in comparison to healthy individuals or patients hospitalized for other pathologies.Citation74
The multifaceted role of Desulfovibrio piger ATTC2
The microbial composition varies between individuals,Citation75 which may not necessarily translate into functional or metabolic differences.Citation76 However, certain metabolic functions may require the presence of specific microbial species.Citation77 Hence, we investigated whether there were any function-specific microbes in the microbial community models at the different time points, whose presence was required for the production of specific metabolites. The analysis revealed that the Proteobacteria D. piger ATCC2 was the only microbial species involved in the production of sulfite (SO3Citation2−) in the microbial community models (Supplementary Table S3). We found that D. piger at its peak in LS was nearly four times more abundant than in the maximum relative abundance found across the healthy controls (LSMax/HeMax = 3.7). Patients affected by IBD, such as ulcerative colitis, are strongly discouraged to consume foods with high SO32- levels as being harmful and favoring tightening of inflammation.Citation75 Furthermore, sodium sulfite, a common food additive, inhibits the activity of commensal and anti-inflammatory bacteria, such as F. prausnitzii.Citation77 A large part of the SO32- present in the gut comes from dietary intake,Citation78 however, some microbial species are known to produce SO32-. D. piger ATTC2 was not able to synthesize SO32- in single-species simulations. However, the pairwise simulations revealed that this species interacted with the Archaea M. stadtmanae DSM3091. Only when in synergy with the archaeal partner, D. piger ATTC2 could produce SO32-. This metabolic dependency reflected a cooperative behavior culminating in the production of the host-toxic SO32-. In support of this hypothesis, it is worth noting that the flux production of SO3Citation2− in the LS time points strongly reflected the abundance fluctuations of both M. stadtmanae and M. smithii, the two archaea in the community under investigation (Supplementary Fig. S17).
The pairwise simulations revealed that D. piger ATCC 29,098 absorbed ethanol, converted it into acetate, and, finally, secreted it. The acetate was then taken up by the acetoclastic Archaea M. stadtmanae DSM 3091. D. piger ATCC 2909 can metabolize ethanol using two alternative anaerobic pathways: in one case, the ethanol is oxidized to acetate via acetaldehyde as an intermediate. In the second case, other intermediates between acetaldehyde and acetate are generated, namely acetyl-CoA and acetyl-P.Citation79 In the simulations, the conversion of ethanol to acetate had a yield of approximately 1 (0.93), as expected from experimental data.Citation80 The nearly 1:1 ethanol-to-acetate ratio reflected the release of an excess of reducing equivalents, such as methane, by syntrophic partners.Citation79 The ability of D. piger ATCC 29,098 to synthesize and export SO32- may also be recovered through the interaction with other archaeal partners. Accordingly, due to the commensalism, when M. stadtmanae DSM 3091 and D. piger ATCC 29,098 were co-occurrent, the net flux production of methane was higher (Supplementary Table S2). The abundance of D. piger strains in IBD patients has already been reported.Citation74
Taken together, our results indicate that through the production of two metabolites, i.e., L-serine and formate, species of the Dialister genus cooperated with many pathogenic strains, such as adherent invasive E. coli strains, archaeal species, and D. piger ATCC2. The interactions could trigger inflammatory responses and enhance methane production. Furthermore, D. piger ATCC2 plays an important role in enhancing the production of host-toxic SO32- in microbial communities.
Whole-body modeling suggests a role of D. piger in the transsulfuration pathway
We then integrated the microbial community metabolic models of each time point with a male organ-resolved whole-body model of human metabolismCitation26 to track the metabolic consequences of gut microbiome dysbiosis on different body sites, organs, and tissues on the host metabolism. In this simulation, we inspected the microbial metabolic influence on a range of different organs and tissues of the host as the only variable was the gut microbiome ecology composition, which changed over time. We found that the dysbiosis resulted in greater flux changes in some organs or cell types than in others. In fact, red blood cells, platelets, and the retina showed the most pronounced changes in predicted fluxes (), (Supplementary Table S4). Indeed, episcleritis, a disease involving the eyes, is one of the most common extraintestinal IBD manifestations.Citation81 The retina is currently the only eye organ included in the whole-body metabolic model; however, it would be interesting to account for additional body sites including other eye layers, e.g., the episclera, in a future release. The predicted flux through the metabolism of the prostaglandin E2 was altered in the pancreas in LS2 and LS7. Prostaglandin release is one of the first triggering factors of the inflammatory cascade typical of CD.Citation82 Finally, many drugs, such as mesalazine, are used to inhibit the release of prostaglandins and leukotrienes in different body sitesCitation83 underlying the key role of these molecules in the establishment of CD.
Figure 7. Overview of the alteration of the microbiome-associated whole-body models.

Notably, the sulfite metabolism in the liver was dependent on the presence of D. piger ATCC 2909 (), (Supplementary Table S4) in the gut. In the microbiome-associated whole-body model, sulfite from the small and large intestine could be either transported directly to the liver through the portal vein or as cysteine-S-sulfate (VMH ID: slfcys). In the liver, cysteine-S-sulfate can then be metabolized to cysteine (VMH ID: cys_L) and SO3−2.Citation84 In our simulations, SO32- was oxidized to SO42- through sulfite oxidase activity (VMH ID: SULFOX). This reaction produced hydrogen peroxide in the model and thus, could contribute to oxidative stress, which we do not model as such. At the same time, sulfur metabolism was linked to the metabolism of bile acids in the simulations in LS2 and LS7. Indeed, cysteine-S-sulfate is a precursor of hypotaurine and taurine. The flux through the reactions involved in this pathway (e.g., the reactions HYPTROX, r0539, and r0381) changed with the time points, being increased in LS2 and LS7. Around 85% of bile acid reactions were affected by the presence of D. piger ATCC 2909 (), (Supplementary Table S4). The increase of these compounds led to an increase in fecal H2S, which has been reported to be increased in IBD patients compared to healthy controls,Citation85 in LS2 and LS7. Cysteine was converted to L-cystine (Supplementary Fig. S20) by a state transition reaction named Glutathione:Cystine Oxidoreductase (VMH ID: CYSGLTH). CYSGLTH enabled the oxidation of glutathione, which acted as a scavenger molecule. Thus, based on our predictions, the presence of D. piger changed the fluxes in the transsulfuration pathway leading to higher cysteine to glutathione turnover.
In conclusion, the analysis of the microbiome-associated whole-body model has the potential to shed light on the alteration in the metabolism of different body sites caused by the dynamic dysbiotic microbiome. The alteration of the sulfur metabolism in the liver and its link with the presence or absence of D. piger ATCC 2909 in the large intestine reflected the intercommunication among the different body sites. This network and its influence on the disease onset has been so far largely overlooked. However, this connection could reveal understudied pathobiology mechanisms.
Conclusions
The time course analysis performed on a patient affected by episodic colonic inflammation enabled the analysis of how net metabolite production fluxes were induced by the change of the gut microbial community composition during a time course covering more than one year. To date, this is the first analysis inspecting the gut microbiome dysbiosis evolution in a patient with time-varying colonic inflammation with metabolic modeling.
The study revealed that substantial metabolic changes were associated with the disease evolution as a direct consequence of the patient’s changing gut microbiome composition, notably involving archaeal species. A number of biologically important metabolites were found to be highly overproduced over time in the patient, compared to healthy controls. This list includes oxygen, methane, thiamine, formaldehyde, TMAO, folic acid, serotonin, histamine, and tryptamine, which may yield new biomarkers of disease progression.
The analyses with microbiome-associated whole-body models revealed that the presence of D. piger could alter the metabolism of sulfur in the liver. This finding could be validated with functional experimental studies, e.g., with D. piger administration in murine models of colitis or germ-free mice and measurement of sulfur metabolism in liver.
Since the microbial composition is variable among individuals, to obtain a wide and general representation of the microbiome the time course inspection of a higher number of patients will be needed. Despite confounding effects of antibiotic use being a major limitation of the study, we demonstrated that microbial community metabolic modeling is a very valuable in silico approach to track correspondence between metagenomic data and metabolite production and can yield testable novel hypotheses to be addressed with additional validation studies. These results underline the importance of tracking an individual’s gut microbiome composition and metabolic production along a time course, paving the way to new analyses for personalized medicine.
Methods
Ethics statement
The stool samples of the patient were collected by consent under two protocols: HRPP 141,853 (American Gut Project) and HRPP 150,275 (Evaluating the Human Microbiome). The protocols include written informed consent concerning dissemination and scientific publication of the results. Both protocols were approved by the Human Research Protection Program (HRPP) of the University of California, San Diego.
Longitudinal sample collection
The LS samples have been collected from naturally passed feces and stored without a buffer at − 80°C. Seven samples were selected. A personal symptom log was recorded, along with a large number of serum and stool biomarker metadata at the time that each fecal sample was taken.
Metagenomics data generation
Metagenomic sequencing of the seven stool samples (LS1-LS7) was performed at the J. Craig Venter Institute using Illumina HiSeq2000 platform. On average, 160 million paired-end reads at 2 × 100base pairs were generated per sample. The raw reads for the healthy controls were downloaded from National Center for Biotechnology Information (NCBI) Sequence Read Archives under BioProject ID PRJNA43021. The processing of the raw metagenomic sequence data for LS and for the healthy controls and the computation of species relative abundance were described in an earlier publication by Wu et al.Citation27 Briefly, after low-quality reads, reads from humans and duplicated reads were removed, and the filtered reads were then aligned to our curated microbial genomic sequences. The reads were assigned to their top matched genomes and the depth of genome coverage of each species was calculated and then normalized to relative abundance so that the total relative abundance was 1.0.
Butyrate and biomarkers measurement
The patient LS used the company Doctor’s Data Comprehensive Stool Analysis kit (www.doctorsdata.com/Comprehensive-Stool-Analysis-CSA21) to generate the values of lysozyme, lactoferrin, and secretory IgA (all ELISA) reported in and graphed in the Supplementary Materials. In addition, total butyrate (Supplementary Material Figure S14) was measured from the LS stool sample by Doctor’s Data using gas chromatography. The values in of fecal calprotectin, generated by ARUP Laboratories using Immunoassay, and of serum CRP were from tests with UC San Diego Health.
Definition of the average European diet
The in silico diet represented the nutrient intake of an average European individual; hence, representing a typical “Western” diet. Its description, along with the corresponding flux values, was obtained from the nutrition resource in the Virtual Metabolic Human database.Citation35 The diet was supplemented with metabolites that have been previouslyCitation23 determined as necessary for the biomass production of at least one AGORA reconstruction. The dedicated function (adaptVMHDietToAGORA.m) of the Microbiome Modelling ToolboxCitation86 was used to constrain each microbial community model. The lower bounds on all other dietary exchange reactions were set to zero to prevent the uptake of other metabolites.
Simulations
Simulations were carried out using the COBRA ToolboxCitation87 and the Microbiome Modelling Toolbox,Citation88 which is part of the COBRA Toolbox, in MATLAB version 2018b (MathWorks, Inc.) as a programming environment. Microbes identified in the metagenomic samples were mapped onto the AGORA2 collection to create the microbial community models for the simulation. For this purpose, the function translateMetagenome2AGORA from the COBRA Toolbox was used. Microbial species with relative abundance higher than 10−5 were considered in the population analysis (i.e., for the alpha and beta analysis), while for the AGORA2 collection mapping and all microbial community models, a threshold of 10−4 was used. The precise total relative abundance covered for each time point is reported in . Abundances were normalized for the microbial community modeling. For the simulations and the net secretion and uptake fluxes predictions, the function initMgPipe, contained in the Microbiome Modeling Toolbox,Citation88 was used. More specifically, the function initMgPipe contains the function microbiotaModelSimulator, which calculates the net maximal production capability for each metabolite. This parameter indicates the maximal production of each metabolite and is computed by summing the maximal secretion flux with the maximal uptake flux for each metabolite. Furthermore, the function initMgPipe contains the function adaptVMHDietToAGORA, which was used to apply the diet constraints to the microbial community model. Microbe-metabolite contributions were performed following Basile et al.Citation12 In brief, the MICOM softwareCitation12 was used through the cooperative trade-off algorithm integrating the abundances as input. Subsystems were assigned following the procedure proposed by Heirendt et al.,Citation87 and implemented in the function calculateSubsystemAbundance using as input the reaction abundances. The list of primary and secondary bile acids, as well as the list of reactions catalyzing their production, were extracted from the Supplementary material of the work of Heinken and colleagues.Citation25
The integration of the whole-body model was performed using the Harvey reconstruction.Citation26 To create the personalized gut model, the function combineHarveyMicrotiota was used and the simulations were performed with the minNorm algorithm through the COBRA Toolbox (optimizeWBmodel).
For all simulations, the optimization solver used was CPLEX (IBM iLOG, Inc).
Statistical analysis
A cohort of 34 metagenomic samples from 34 healthy individuals from the Human Microbiome ProjectCitation32 was used to create a “healthy average” (HE Ave) value for each microbe species. Then, we computed the ratio of the relative abundance of the seven time points to the average health and reported the ratio of the maximum value at any of the seven time points, i.e., Max (LS1–7), to the healthy average. Alpha diversity and beta diversity analysis were calculated with the “vegan” packageCitation34 and using R software v.4.0.3. The taxonomic differences of the different samples were weighted with a hierarchical tree based on the taxonomies of AGORA2Citation24 with the function taxa2dist. The alpha diversity was calculated with taxondive.Citation89 The score considered for the alpha diversity was ∆*. For the beta diversity, the function vegdist was applied. The values of beta diversity were converted to Newick format and used to generate a tree representing the differences between samples with the function NJ of the ape package. The PCA was performed with the function princomp with the parameters “cor=TRUE, scores=TRUE”. The 3D plot of the PCA was realized with the function plot3d of the package “rgl”. The Log2 Fold Change was adopted as a parameter to characterize metabolite production across samples. Linear regression analysis was performed using the software XLSTAT to determine if methane production correlated with inflammation in terms of fecal calprotectin and blood CRP.
Author contributions
Arianna Basile: Funding acquisition, Conceptualisation, Investigation, Formal Analysis, Visualisation, Writing – Original Draft. Almut Heinken: Software, Methodology, Formal Analysis, Writing – view & Editing. Johannes Hertel: Supervision, Writing – Review & Editing. Larry Smarr: Funding acquisition, Formal Analysis, Writing – Review & Editing. Weizhong Li: Review & Editing. Laura Treu: Supervision, Writing – Review & Editing. Giorgio Valle: Writing – Review & Editing. Stefano Campanaro: Supervision, Conceptualisation, Writing – Review & Editing. Ines Thiele: Conceptualisation, Supervision, Funding acquisition, Software, Writing – Review & Editing.
Supplemental Material
Download Zip (21.7 MB)Acknowledgments
We thank staff at the J Craig Venter Institute for performing the metagenomic sequencing of stool samples and the San Diego Supercomputer for providing the CPU hours for processing the metagenomic sequencing data. WL thanks the Center for Research in Biological Systems (CRBS) for support during part of the metagenomic analysis. A final acknowledgement to the Italian Consortium for Biotechnologies (CIB) for the support.
Disclosure statement
No potential conflict of interest was reported by the author(s).
Data availability statement
The raw abundance data have been submitted as part of Supplementary Table I.
Two later publications resequenced some of the LS1–7 samples, at a lower depth than reported herein, as part of research on a longer time series of LS fecal samples. The first publicationCitation21 resequenced LS 1–7 (12/28/2011 to 4/29/2013) as part of a longer time series of 27 LS samples (dates from 12/28/2011 to 12/07/2014 are listed in their Supplementary Table S1, Sheet Metadata) analyzing the metagenomics of E. coli strain dynamics. The metagenomics sequence of these 27 samples can be found in EBI under study PRJEB24161. The second publicationCitation30 sequenced eight LS time series samples (dates from 12/28/2011 to 5/22/2016), including resequencing LS1–3, and added metaproteomic analysis for these eight time points. Metagenomic data are available through EBI under the study PRJEB28712 (ERP110957).
Supplementary material
Supplemental data for this article can be accessed online at https://doi.org/10.1080/19490976.2023.2226921
Additional information
Funding
References
- Heinken A, Hertel J, Thiele I. Metabolic modelling reveals broad changes in gut microbial metabolism in inflammatory bowel disease patients with dysbiosis. NPJ Syst Biol Appl. 2021;7(1):19. doi:10.1038/s41540-021-00178-6.
- Almeida A, Nayfach S, Boland M, Strozzi F, Beracochea M, Shi ZJ, Pollard KS, Sakharova E, Parks DH, Hugenholtz P, et al. A unified catalog of 204,938 reference genomes from the human gut microbiome. Nat Biotechnol. 2021;39(1):105–25. doi:10.1038/s41587-020-0603-3.
- Schippa S, Conte MP. Dysbiotic events in gut microbiota: impact on human health. Nutrients [Internet] 2014;6(12):5786–5805. [accessed 2022 Nov 11]. https://www.mdpi.com/2072-6643/6/12/5786.
- Cheng M, Ning K. Stereotypes about enterotype: the old and new ideas. Genomics, Proteomics & Bioinf. 2019;17(1):4–12. doi:10.1016/j.gpb.2018.02.004.
- Cho I, Blaser MJ. The human microbiome: at the interface of health and disease. Nat Rev Genet. 2012;13(4):260–270. doi:10.1038/nrg3182.
- Lopez RN, Leach ST, Lemberg DA, Duvoisin G, Gearry RB, Day AS. Fecal biomarkers in inflammatory bowel disease. J Gastroen Hepatol [Internet]. 2017;32(3):577–582. [accessed 2022 Aug 6]. https://onlinelibrary.wiley.com/doi/abs/.10.1111/jgh.13611
- Yoo JY, Groer M, Dutra SVO, Sarkar A, McSkimming DI. Gut microbiota and immune system interactions. Microorganisms [Internet]. 2020;8(10):1587. [accessed 2022 Sep 21]. https://www.mdpi.com/2076-2607/8/10/1587.
- Cleynen I, Boucher G, Jostins L, Schumm LP, Zeissig S, Ahmad T, Andersen V, Andrews JM, Annese V, Brand S, et al. Inherited determinants of Crohn’s disease and ulcerative colitis phenotypes: a genetic association study. Lancet. 2016;387(10014):156–167. doi:10.1016/S0140-6736(15)00465-1.
- Willing BP, Dicksved J, Halfvarson J, Andersson AF, Lucio M, Zheng Z, Järnerot G, Tysk C, Jansson JK, Engstrand L. A pyrosequencing study in twins shows that gastrointestinal microbial profiles vary with inflammatory bowel disease phenotypes. Gastroenterology. 2010;139(6):1844–1854.e1. doi:10.1053/j.gastro.2010.08.049.
- Yazdani M, Taylor BC, Debelius JW, Li W, Knight R, Smarr L. Using machine learning to identify major shifts in human gut microbiome protein family abundance in disease. In: 2016 IEEE International Conference on Big Data (Big Data); 2016 December 5-8; Washington D.C., USA. p. 1272–1280.
- Heinken A, Basile A, Thiele I. Advances in constraint-based modelling of microbial communities. Current Opinion Sys Biol. [Internet] 2021;27:100346. https://www.sciencedirect.com/science/article/pii/S2452310021000317.
- Basile A, Campanaro S, Kovalovszki A, Zampieri G, Rossi A, Angelidaki I, Valle G, Treu L. Revealing metabolic mechanisms of interaction in the anaerobic digestion microbiome by flux balance analysis. Metab Eng. 2020;62:138–149. doi:10.1016/j.ymben.2020.08.013.
- Thiele I, Heinken A, Fleming RMT. A systems biology approach to studying the role of microbes in human health. Curr Opin Biotechnol. 2013;24(1):4–12. doi:10.1016/j.copbio.2012.10.001.
- Heinken A, Basile A, Hertel J, Thinnes C, Thiele I. Genome-scale metabolic modeling of the human microbiome in the era of personalized medicine. Annu Rev Microbiol. 2021;75(1):199–222. doi:10.1146/annurev-micro-060221-012134.
- Orth JD, Thiele I, Palsson BØ. What is flux balance analysis? Nat Biotechnol. 2010;28(3):245–248. doi:10.1038/nbt.1614.
- Norsigian CJ, Fang X, Seif Y, Monk JM, Palsson BO. A workflow for generating multi-strain genome-scale metabolic models of prokaryotes. Nat Protoc. 2020;15(1):1–14. doi:10.1038/s41596-019-0254-3.
- Feist AM, Palsson BO. The biomass objective function. Curr Opin Microbiol [Internet]. 2010; 13(3):344–349. doi:10.1016/j.mib.2010.03.003.
- Baldini F, Hertel J, Sandt E, Thinnes CC, Neuberger-Castillo L, Pavelka L, Betsou F, Krüger R, Thiele I, Consortium N-P. Parkinson’s disease-associated alterations of the gut microbiome predict disease-relevant changes in metabolic functions. BMC Biol. 2020;18:62. doi:10.1186/s12915-020-00775-7.
- Hertel J, Harms AC, Heinken A, Baldini F, Thinnes CC, Glaab E, Vasco DA, Pietzner M, Stewart ID, Wareham NJ, et al. Integrated analyses of microbiome and longitudinal metabolome data reveal microbial-host interactions on sulfur metabolism in Parkinson’s Disease. Cell Rep. 2019;29(7):1767–1777.e8. doi:10.1016/j.celrep.2019.10.035.
- Fang X, Vázquez-Baeza Y, Elijah E, Vargas F, Ackermann G, Humphrey G, Lau R, Weldon KC, Sanders JG, Panitchpakdi M, et al. Gastrointestinal surgery for inflammatory bowel disease persistently lowers microbiome and metabolome diversity. Inflamm Bowel Dis. 2021;27(5):603–616. doi:10.1093/ibd/izaa262.
- Fang X, Monk JM, Nurk S, Akseshina M, Zhu Q, Gemmell C, Gianetto-Hill C, Leung N, Szubin R, Sanders J, et al. Metagenomics-based, strain-level analysis of Escherichia coli from a time-series of microbiome samples from a crohn’s disease patient. Front Microbiol. 2018;9:2559. doi:10.3389/fmicb.2018.02559.
- Fang X, Monk JM, Mih N, Du B, Sastry AV, Kavvas E, Seif Y, Smarr L, Palsson BO. Escherichia coli B2 strains prevalent in inflammatory bowel disease patients have distinct metabolic capabilities that enable colonization of intestinal mucosa. BMC Syst Biol. 2018;12(1):66. doi:10.1186/s12918-018-0587-5.
- Magnúsdóttir S, Heinken A, Kutt L, Ravcheev DA, Bauer E, Noronha A, Greenhalgh K, Jäger C, Baginska J, Wilmes P, et al. Generation of genome-scale metabolic reconstructions for 773 members of the human gut microbiota. Nat Biotechnol. 2017;35(1):81–89. doi:10.1038/nbt.3703.
- Heinken A, Hertel J, Acharya G, Ravcheev DA, Nyga M, Okpala OE, Hogan M, Magnúsdóttir S, Martinelli F, Nap B, et al. Genome-scale metabolic reconstruction of 7,302 human microorganisms for personalized medicine. Nat Biotechnol. 2023: 1–12. doi:10.1038/s41587-022-01628-0
- Heinken A, Ravcheev DA, Baldini F, Heirendt L, Fleming RMT, Thiele I. Systematic assessment of secondary bile acid metabolism in gut microbes reveals distinct metabolic capabilities in inflammatory bowel disease. Microbiome. 2019;7(1):75. doi:10.1186/s40168-019-0689-3.
- Thiele I, Sahoo S, Heinken A, Hertel J, Heirendt L, Aurich MK, Fleming RM. Personalized whole-body models integrate metabolism, physiology, and the gut microbiome. Mol Syst Biol. 2020;16(5):e8982. doi:10.15252/msb.20198982.
- Wu S, Li W, Smarr L, Nelson K, Yooseph S, Torralba M Large memory high performance computing enables comparison across human gut microbiome of patients with autoimmune diseases and healthy subjects [Internet]. In: Proceedings of the Conference on Extreme Science and Engineering Discovery Environment: Gateway to Discovery. New York, NY, USA: Association for Computing Machinery; 2013:1–6. doi:10.1145/2484762.2484828.
- Peterson J, Garges S, Giovanni M, McInnes P, Wang L, Schloss JA, Bonazzi V, McEwen JE, Wetterstrand KA, NIH HMP Working Group, et al. The NIH human microbiome project. Genome Res. 2009;19(12):2317–2323. doi:10.1101/gr.096651.109.
- Mills RH, Vázquez-Baeza Y, Zhu Q, Jiang L, Gaffney J, Humphrey G, Smarr L, Knight R, Gonzalez DJ. Evaluating metagenomic prediction of the metaproteome in a 4.5-year study of a patient with Crohn’s disease. mSystems. 2019;4:e00337–18. doi:10.1128/mSystems.00337-18.
- Smarr L, Hyde ER, McDonald D, Sandborn WJ, Knight R. Tracking human gut microbiome changes resulting from a colonoscopy. Methods Inf Med. 2017;56(6):442–447. doi:10.3414/ME17-01-0036.
- Schembri J, Bonello J, Christodoulou DK, Katsanos KH, Ellul P. Segmental colitis associated with diverticulosis: is it the coexistence of colonic diverticulosis and inflammatory bowel disease? Ann Gastroenterol. 2017;30:257–261. [accessed 2023 Apr 19]. doi:10.20524/aog.2017.0126.
- Integrative HMP (iHMP) research network consortium. The integrative human microbiome project. Nature. 2019;569(7758):641–648. doi:10.1038/s41586-019-1238-8.
- Chibani CM, Mahnert A, Borrel G, Almeida A, Werner A, Brugère J-F, Gribaldo S, Finn RD, Schmitz RA, Moissl-Eichinger C. A catalogue of 1,167 genomes from the human gut archaeome. Nat Microbiol [Internet]. 2022;7(1):48–61. [Internet] doi:10.1038/s41564-021-01020-9.
- Callahan BJ, Sankaran K, Fukuyama JA, McMurdie PJ, Holmes SP. Bioconductor workflow for microbiome data analysis: from raw reads to community analyses. F1000Res. 2016;5:1492. doi:10.12688/f1000research.8986.2.
- Noronha A, Modamio J, Jarosz Y, Guerard E, Sompairac N, Preciat G, Daníelsdóttir AD, Krecke M, Merten D, Haraldsdóttir HS, et al. The virtual metabolic human database: integrating human and gut microbiome metabolism with nutrition and disease. Nucleic Acids Res. 2019;47(D1):D614–24. doi:10.1093/nar/gky992.
- Shah A, Morrison M, Burger D, Martin N, Rich J, Jones M, Koloski N, Walker MM, Talley NJ, Holtmann GJ. Systematic review with meta-analysis: the prevalence of small intestinal bacterial overgrowth in inflammatory bowel disease. Aliment Pharmacol Ther. 2019;49(6):624–635. doi:10.1111/apt.15133.
- Dridi B, Raoult D, Drancourt M. Archaea as emerging organisms in complex human microbiomes. Anaerobe. 2011;17(2):56–63. doi:10.1016/j.anaerobe.2011.03.001.
- Henson MA, Phalak P. Microbiota dysbiosis in inflammatory bowel diseases: in silico investigation of the oxygen hypothesis. BMC Syst Biol. 2017;11(1):145. doi:10.1186/s12918-017-0522-1.
- Winter SE, Lopez CA, Bäumler AJ. The dynamics of gut-associated microbial communities during inflammation. EMBO Rep. 2013;14(4):319–327. doi:10.1038/embor.2013.27.
- Wilson A, Teft WA, Morse BL, Choi Y-H, Woolsey S, DeGorter MK, Hegele RA, Tirona RG, Kim RB. Trimethylamine-N-oxide: a novel biomarker for the identification of inflammatory bowel disease. Dig Dis Sci Available from. 2015;60(12):3620–3630. doi:10.1007/s10620-015-3797-3.
- Pickard JM, Zeng MY, Caruso R, Núñez G. Gut microbiota: role in pathogen colonization, immune responses and inflammatory disease. Immunol Rev. 2017 [[cited 2022 Nov 10]];279(1):70–89. doi:10.1111/imr.12567.
- Sánchez-Pérez S, Comas-Basté O, Duelo A, Veciana-Nogués MT, Berlanga M, Latorre-Moratalla ML, Vidal-Carou MC. Intestinal dysbiosis in patients with histamine intolerance. Nutrients. 2022;14(9):1774. [accessed 2022 Sep 22]. https://www.mdpi.com/2072-6643/14/9/1774.
- Liu Y, Dai M. Trimethylamine N-Oxide generated by the gut microbiota is associated with vascular inflammation: new insights into atherosclerosis. Mediators Inflamm. 2020;2020:4634172. doi:10.1155/2020/4634172.
- Kelly D, Yang L, Gut Microbiota PZ. Fusobacteria, and colorectal cancer. Diseases [Internet]. 2018;6(4):109. https://www.mdpi.com/2079-9721/6/4/109.
- Cao Y-N, Feng L-J, Wang B-M, Jiang K, Li S, Xu X, Wang W-Q, Zhao J-W, Wang Y-M. Lactobacillus acidophilus and Bifidobacterium longum supernatants upregulate the serotonin transporter expression in intestinal epithelial cells. Saudi J Gastroenterol. 2018;24(1):59–66. doi:10.4103/sjg.SJG_333_17.
- Crowell MD. Role of serotonin in the pathophysiology of the irritable bowel syndrome. Br J Pharmacol. 2004;141(8):1285–1293. doi:10.1038/sj.bjp.0705762.
- Minderhoud IM, Oldenburg B, Schipper MEI, Ter LindeJJM, Samsom M, Ter Linde JJM. Serotonin synthesis and uptake in symptomatic patients with Crohn’s disease in remission. Clin Gastroenterol Hepatol. 2007;5(6):714–720. doi:10.1016/j.cgh.2007.02.013.
- Heinken A, Thiele I. Systems biology of host–microbe metabolomics. Wiley Interdiscip Rev Syst Biol Med. 2015;7(4):195–219. doi:10.1002/wsbm.1301.
- Gu Z, Eils R, Schlesner M. Complex heatmaps reveal patterns and correlations in multidimensional genomic data. Bioinformatics. 2016;32(18):2847–2849. doi:10.1093/bioinformatics/btw313.
- de Vladar HP, de Vladar HP. Amino acid fermentation at the origin of the genetic code. Biol Direct. 2012;7(1):6. doi:10.1186/1745-6150-7-6.
- Theriot CM, Fletcher JR. Human fecal metabolomic profiling could inform Clostridioides difficile infection diagnosis and treatment. J Clin Invest. 2019;129(9):3539–3541. doi:10.1172/JCI130008.
- Levitt MD, Furne J, Olsson S. The relation of passage of gas an abdominal bloating to colonic gas production. Ann Intern Med. 1996;124(4):422–424. doi:10.7326/0003-4819-124-4-199602150-00006.
- Freudenberg MA, Merlin T, Gumenscheimer M, Kalis C, Landmann R, Galanos C. Role of lipopolysaccharide susceptibility in the innate immune response to Salmonella typhimurium infection: lPS, a primary target for recognition of gram-negative bacteria. Microbes Infect. 2001;3(14–15):1213–1222. doi:10.1016/S1286-4579(01)01481-2.
- Gronbach K, Flade I, Holst O, Lindner B, Ruscheweyh HJ, Wittmann A, Menz S, Schwiertz A, Adam P, Stecher B, et al. Endotoxicity of lipopolysaccharide as a determinant of T-Cell−Mediated colitis induction in mice. Gastroenterology. 2014;146(3):765–775. doi:10.1053/j.gastro.2013.11.033.
- Deng Z, Liu S. Inflammation-responsive delivery systems for the treatment of chronic inflammatory diseases. Drug Deliv Transl Res. 2021;11(4):1475–1497. doi:10.1007/s13346-021-00977-8.
- Magro DO, Kotze PG, Martinez CAR, Camargo MG, Guadagnini D, Calixto AR, Vasques ACJ, de LS AM, Geloneze B, Pareja JC, et al. Changes in serum levels of lipopolysaccharides and CD26 in patients with Crohn’s disease. Intest Res. 2017;15:352–357. doi:10.5217/ir.2017.15.3.352.
- Maynard CL, Elson CO, Hatton RD, Weaver CT. Reciprocal interactions of the intestinal microbiota and immune system. Nature. 2012;489(7415):231–241. doi:10.1038/nature11551.
- Segain JP, Raingeard de la Blétière D, Bourreille A, Leray V, Gervois N, Rosales C, Ferrier L, Bonnet C, Blottière HM, Galmiche JP. Butyrate inhibits inflammatory responses through NFkappaB inhibition: implications for Crohn’s disease. Gut. 2000;47(3):397–403. doi:10.1136/gut.47.3.397.
- Sassone-Corsi M, Nuccio S-P, Liu H, Hernandez D, Vu CT, Takahashi AA, Edwards RA, Raffatellu M. Microcins mediate competition among Enterobacteriaceae in the inflamed gut. Nature. 2016;540(7632):280–283. doi:10.1038/nature20557.
- Matthews RG, Neidhardt FC. Elevated serine catabolism is associated with the heat shock response in Escherichia coli. J Bacteriol. 1989;171(5):2619–2625. doi:10.1128/jb.171.5.2619-2625.1989.
- Kitamoto S, Alteri CJ, Rodrigues M, Nagao-Kitamoto H, Sugihara K, Himpsl SD, Bazzi M, Miyoshi M, Nishioka T, Hayashi A, et al. Dietary L-serine confers a competitive fitness advantage to Enterobacteriaceae in the inflamed gut. Nature Microbiology. 2020;5(1):116–125. doi:10.1038/s41564-019-0591-6.
- Zeng MY, Inohara N, Nuñez G. Mechanisms of inflammation-driven bacterial dysbiosis in the gut. Mucosal Immunol. 2017;10(1):18–26. doi:10.1038/mi.2016.75.
- Stecher B, Conway T, Cohen P. The roles of inflammation, nutrient availability and the commensal microbiota in enteric pathogen infection. Microbiol Spectr. 2015;3(3):3. doi:10.1128/microbiolspec.MBP-0008-2014.
- Sawers G. The anaerobic degradation of L-serine and L-threonine in enterobacteria: networks of pathways and regulatory signals. Arch Microbiol. 1998;171(1):1–5. doi:10.1007/s002030050670.
- Connolly JPR, Gabrielsen M, Goldstone RJ, Grinter R, Wang D, Cogdell RJ, Walker D, Smith DGE, Roe AJ, Mulvey MA. A highly conserved bacterial d-serine uptake system links host metabolism and virulence. PLoS Pathog. 2016;12(1):e1005359. doi:10.1371/journal.ppat.1005359.
- Duboc H, Rajca S, Rainteau D, Benarous D, Maubert M-A, Quervain E, Thomas G, Barbu V, Humbert L, Despras G, et al. Connecting dysbiosis, bile-acid dysmetabolism and gut inflammation in inflammatory bowel diseases. Gut. 2013;62(4):531–539. doi:10.1136/gutjnl-2012-302578.
- Li N, Koester ST, Lachance DM, Dutta M, Cui JY, Dey N. Microbiome-encoded bile acid metabolism modulates colonic transit times. iScience [Internet]. 2021; 24:102508. doi:10.1016/j.isci.2021.102508.
- Kean IRL, Wagner J, Wijeyesekera A, De Goffau M, Thurston S, Clark JA, White DK, Ridout J, Agrawal S, Kayani R, et al. Profiling gut microbiota and bile acid metabolism in critically ill children. Sci Rep [Internet]. 2022; 12:10432. doi:10.1038/s41598-022-13640-0.
- Diener C, Gibbons SM, Resendis-Antonio O, Chia N. MICOM: metagenome-scale modeling to infer metabolic interactions in the gut microbiota. mSystems. 2020;5(1):e00606–19. doi:10.1128/mSystems.00606-19.
- Joossens M, Huys G, Cnockaert M, De Preter V, Verbeke K, Rutgeerts P, Vandamme P, Vermeire S. Dysbiosis of the faecal microbiota in patients with Crohn’s disease and their unaffected relatives. Gut. 2011;60:631–637. doi:10.1136/gut.2010.223263.
- Tsune I, Ikejima K, Hirose M, Yoshikawa M, Enomoto N, Takei Y, Sato N. Dietary glycine prevents chemical-induced experimental colitis in the rat. Gastroenterology. 2003;125(3):775–785. doi:10.1016/S0016-5085(03)01067-9.
- Mirsepasi-Lauridsen HC, Vallance BA, Krogfelt KA, Petersen AM. Escherichia coli pathobionts associated with inflammatory bowel disease. Clin Microbiol Rev. 2019;32(2):e00060–18. doi:10.1128/CMR.00060-18.
- Ghoshal U, Shukla R, Srivastava D, Ghoshal UC. Irritable bowel syndrome, particularly the constipation-predominant form, involves an increase in methanobrevibacter smithii, which is associated with higher methane production. Gut Liver. 2016;10(6):932–938. doi:10.5009/gnl15588.
- Loubinoux J, Bronowicki J-P, Pereira IAC, Mougenel J-L, Faou AE. Sulfate-reducing bacteria in human feces and their association with inflammatory bowel diseases. FEMS Microbiol Ecol. 2002;40(2):107–112. doi:10.1111/j.1574-6941.2002.tb00942.x.
- Magee EA, Edmond LM, Tasker SM, Kong SC, Curno R, Cummings JH. Associations between diet and disease activity in ulcerative colitis patients using a novel method of data analysis. Nutr J. 2005;4(1):7. doi:10.1186/1475-2891-4-7.
- Eng A, Borenstein E. Taxa-function robustness in microbial communities. Microbiome. 2018;6(1):45. doi:10.1186/s40168-018-0425-4.
- Jimenez Loayza JJ, Berendsen EM, Teh J-J, Hoedt EC, Zhang J, Liu Q, Hamilton AL, Wilson-O’Brien A, Trakman GL, Lin W, et al. P837 the common food additives sodium sulfite and polysorbate 80 have a profound inhibitory effect on the commensal, anti-inflammatory bacterium Faecalibacterium prausnitzii: the ENIGMA study. Journal Of Crohn’s And Colitis. 2019;13(Supplement_1):S542–3. doi:10.1093/ecco-jcc/jjy222.961.
- Devkota S, Chang EB. Interactions between diet, bile acid metabolism, gut microbiota, and inflammatory bowel diseases. Dig Dis [Internet] Available from. 2015; 33:351–356. doi:10.1159/000371687.
- Keller A, Schink B, Müller N. Alternative pathways of acetogenic ethanol and methanol degradation in the thermophilic anaerobe thermacetogenium phaeum. Front Microbiol. 2019;10:423. doi:10.3389/fmicb.2019.00423.
- Bertsch J, Siemund AL, Kremp F, Müller V. A novel route for ethanol oxidation in the acetogenic bacterium Acetobacterium woodii: the acetaldehyde/ethanol dehydrogenase pathway. Environ Microbiol. 2016;18(9):2913–2922. doi:10.1111/1462-2920.13082.
- Levine JS, Burakoff R. Extraintestinal manifestations of inflammatory bowel disease. Gastroenterol Hepatol (N Y). [Internet] 2011 Available from. cited 2022 Apr 28.7. 235–241.https://www.ncbi.nlm.nih.gov/pmc/articles/PMC3127025/.
- Wallace JL. Prostaglandin biology in inflammatory bowel disease. Gastroenterol Clin North Am. 2001;30(4):971–980. doi:10.1016/S0889-8553(05)70223-5.
- Tromm A, Griga T, May B. Oral mesalazine for the treatment of Crohn’s disease: clinical efficacy with respect to pharmacokinetic properties. Hepatogastroenterology. 1999;46:3124–3135.
- Stipanuk MH. Sulfur amino acid metabolism: pathways for production and removal of homocysteine and cysteine. Annu Rev Nutr. 2004;24(1):539–577. doi:10.1146/annurev.nutr.24.012003.132418.
- Walker A, Schmitt-Kopplin P. The role of fecal sulfur metabolome in inflammatory bowel diseases. Int J Med Microbiol. 2021;311(5):151513. doi:10.1016/j.ijmm.2021.151513.
- Heinken A, Thiele I, Wren J. Microbiome Modelling Toolbox 2.0: efficient, tractable modelling of microbiome communities. Bioinformatics Available from. 2022;38(8):2367–2368. [[cited 2023 Mar 28]]. doi:10.1093/bioinformatics/btac082.
- Heirendt L, Arreckx S, Pfau T, Mendoza SN, Richelle A, Heinken A, Haraldsdóttir HS, Wachowiak J, Keating SM, Vlasov V, et al. Creation and analysis of biochemical constraint-based models using the COBRA Toolbox v.3.0. Nat Protoc. 2019;14(3):639–702. doi:10.1038/s41596-018-0098-2.
- Baldini F, Heinken A, Heirendt L, Magnusdottir S, Fleming RMT, Thiele I, Wren J. The microbiome modeling toolbox: from microbial interactions to personalized microbial communities. Bioinformatics. 2019;35(13):2332–2334. doi:10.1093/bioinformatics/bty941.
- Clarke KR, Warwick RM. The taxonomic distinctness measure of biodiversity: weighting of step lengths between hierarchical levels. Mar Ecol Prog Ser. 1999;184:21–29. doi:10.3354/meps184021.