
ABSTRACT
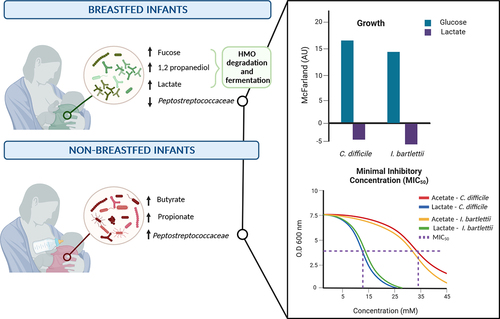
Previous studies indicated an intrinsic relationship between infant diet, intestinal microbiota composition and fermentation activity with a strong focus on the role of breastfeeding on microbiota composition. Yet, microbially formed short-chain fatty acids acetate, propionate and butyrate and other fermentation metabolites such as lactate not only act as substrate for bacterial cross-feeding and as mediators in microbe–host interactions but also confer antimicrobial activity, which has received considerably less attention in the past research. It was the aim of this study to investigate the nutritional–microbial interactions that contribute to the development of infant gut microbiota with a focus on human milk oligosaccharide (HMO) fermentation. Infant fecal microbiota composition, fermentation metabolites and milk composition were analyzed from 69 mother-infant pairs of the Swiss birth cohort Childhood AlleRgy nutrition and Environment (CARE) at three time points depending on breastfeeding status defined at the age of 4 months, using quantitative microbiota profiling, HPLC-RI and 1H-NMR. We conducted in vitro fermentations in the presence of HMO fermentation metabolites and determined the antimicrobial activity of lactate and acetate against major Clostridiaceae and Peptostreptococcaceae representatives. Our data show that fucosyllactose represented 90% of the HMOs present in breast milk at 1- and 3-months post-partum with fecal accumulation of fucose, 1,2-propanediol and lactate indicating fermentation of HMOs that is likely driven by Bifidobacterium. Concurrently, there was a significantly lower absolute abundance of Peptostreptococcaceae in feces of exclusively breastfed infants at 3 months. In vitro, lactate inhibited strains of Peptostreptococcaceae. Taken together, this study not only identified breastfeeding dependent fecal microbiota and metabolite profiles but suggests that HMO-derived fermentation metabolites might exert an inhibitory effect against selected gut microbes.
GRAPHICAL ABSTRACT
Introduction
The infant gut starts to be colonized from birth through vertical transmission, and microbes are received from the environment. The human gut microbial ecosystem is highly dynamic with temporarily changing nutrient supplies.Citation1 Such nutrient alterations are especially distinctive during the first year of life, when a physiologically developing gut system hosting a community of intestinal microbes is exposed to two major dietary transition stages. The first transition takes place soon after birth with the start of the lactation period and the feeding of breast milk. Breast milk mainly contains lipids (3.2 to 3.6 g dL−1), proteins (0.9 to 1.2 g dL−1), lactose (6.7 to 7.8 g dL−1), human milk oligosaccharides (HMOs) (0.5 to 2 g dL−1) and lower amounts of metabolites such as butyrate.Citation2–5 There are up to 200 structurally and compositionally different HMOs, which are not digested by the host and consist of five monosaccharides: D-glucose, D-galactose, L-fucose, N-acetyl-D-glucosamine and sialic acid.Citation3 The core structure is lactose that can be elongated with lacto-N-biose or N-acetyllactosamine and fucosylated and/or sialylated at terminal positions.Citation6 Milk of mothers that lack the fucosyltransferase 2 encoding gene (fut2) (FUT2 non-secretor status) do not secrete α1–2 fucosylated HMO. Non-secretor status has been linked to an overall lower HMO content.Citation7 During the breastfeeding period, Bifidobacterium spp. of the phylum Actinomycetota (formerly known as Actinobacteria) are generally the major bacterial taxa as some species are adapted to degrade and cross-feed on HMO and HMO degradation products. Bifidobacterium spp. including Bifidobacterium longum subsp. infantis digest HMOs intracellularly, while Bifidobacterium bifidum hydrolyses HMOs extracellularly enabling microbial cross-feeding. Major fermentation metabolites of Bifidobacterium HMO metabolism are acetate, lactate, formate and the fucose degradation product 1,2-propanediol (1,2-PD).Citation8–10 Colonization by a low number of butyrate and propionate producers during the first months of life relates to low fecal levels of propionate and butyrate that have been observed in several studies.Citation10–12 The earliest butyrate producers were suggested to be members of the endospore forming Clostridiaceae and Peptostreptococcaceae.Citation12
In non-breastfed infants, Bifidobacterium spp. often represent a major proportion of the gut microbiota, α-diversity of fecal microbiota of non-breastfed infants is often higher than that of breastfed infants.Citation13–15 Formula feeding has been associated with higher abundance of Clostridium spp. and of Clostridioides difficile compared to breastfed infants.Citation16,Citation17
The second nutrient transition occurs during the weaning period with the introduction of solid foods containing structurally and compositionally more complex carbohydrates.Citation18 During weaning, the gut microbiota diversifies taxonomically and functionallyCitation19 leading to a microbiota dominated by the phyla Bacteroidota and Bacillota.Citation20 The increase in abundance of butyrate producing taxa including Faecalibacterium prausnitzii, the Roseburia spp,/Eubacterium rectale group and Anaerobutyricum hallii during weaning has been related to higher fecal butyrate levels.Citation11,Citation21 Fecal fermentation profiles after weaning are concurrently characterized by higher propionate levels compared to pre-weaning.Citation11,Citation12,Citation21
Previous studies indicated a strong relationship between infant diet, fecal microbiota composition and fermentation activity represented by fecal short chain fatty acids (SCFA) and lactate.Citation20,Citation22 Acetate, propionate and butyrate and other major fermentation metabolites including lactate not only act as substrate for bacterial cross-feeding and as mediators in microbe–host interactions but also have antimicrobial activity.Citation23 In food fermentation systems, the antimicrobial activity of lactate and other SCFA contribute to biopreservation effects through the inhibition of sensitive microbes, such a bioactivity has been much less investigated in the gut microbial ecosystemCitation24.
The aim of this study was to elucidate the impact of breastfeeding status on fecal fermentation metabolites and their effect on specific taxa during the first year of life.
Results
Baseline breastfeeding and delivery characteristics of infants
Milk and fecal samples of 69 mothers and their infants, respectively, were collected in the context of the ongoing Swiss birth cohort ‘Childhood AlleRgy nutrition and Environment’ (CARE) between 2016 and 2019. The major aim of the CARE study has been to determine the relationship between nutrition, the gut microbiota, and the development of allergic diseases such as atopic dermatitis in early life. The 69 mother-infant pairs were grouped depending on their breastfeeding status reported at 4 months of age, which is the recommended length of breastfeeding only in Switzerland (www.blv.admin.ch). Infants were grouped as exclusively-breastfed (BF) (n = 38) if they only received breast milk at 4 months, while partially-BF (n = 17) infants obtained breastmilk and complementary formula (mixed breastfeeding). Non-BF infants (n = 14) only received formula at 4 months ().
Figure 1. Timeline of sample collection and division by breastfeeding status.

Based on dietary diaries collected until 1 year of age, the infants in this cohort were mixed breastfed for a median of 25 weeks (interquartile range (IQR) 11–32 weeks). N = 25 mothers (36%) mixed breastfed at 52 weeks. The median duration of only breastfeeding was 20 (IQR 17–21) weeks for infants classified as exclusively-BF, 0 (IQR 0–1.75) weeks for non-BF, and 10 (IQR 3–15) weeks for partially-BF groups (). Exclusively BF infants (defined at 4 months) were mixed breastfed for a length of 29 (IQR 17–32) weeks, while non-BF and partially-BF infants, defined at the age of 4 months, were mixed breastfed for 7.5 (IQR 2–9.8) and 34 (IQR 21–37) weeks, respectively ().
Table 1. Baseline characteristics of the infants based on breastfeeding status.
There was no significant difference in delivery mode for exclusively-BF infants (74% of vaginal and 26% C-section delivery), partially-BF (86% and 14%) and non-BF (82% and 18%) infants (). The median of mixed breastfeeding was 25 and 27 weeks for vaginal and C-section delivered infants, respectively.
Carbohydrates and metabolites present in breast milk
To determine the composition and amount of HMOs, lactose, SCFA and lactate that were present in breast milk, we used proton nuclear magnetic resonance, 1H-NMR. To cover two stages during lactation, samples collected at 1 month (±1 week) and 3–4 months (termed as 3 months) were analyzed. At 1 month, 96.5% of the infants were either only or mixed breastfed, while at 3 months, 79.7% of the infants received breastmilk.
The most abundant HMOs were 2-fucosyllactose (2-FL) and 3-fucosyllactose (3-FL) presenting together 90% of the HMOs (Suppl. Table S1). 2-FL was present in more than 76% of the samples at 1 month and over 83% at 3 months. Based on the presence of 2-FL, 80% of the mothers were identified as FUT2-secretors (Suppl. Table S1). 3-FL was significantly higher (p < 0.05) in non-secretor compared to FUT2-secretor (Suppl. Figure S1). Concentrations ranged between 1148.4–5255.9 μM for 2-FL and 148.5–5552.9 μM for 3-FL at 1 month and between 1022.3–4577.1 μM (2-FL) and 387.1–7493.6 μM (3-FL) at 3 months (Suppl. Figure S1). At 3 months, the median of 2-FL (2069.3 μM, IQR 1628.6–2483.3 μM) was significantly lower compared to 1 month (2781.2 μM, IQR 2121.1–3453.8 μM, p < 0.05) (Suppl. Figure S1).
Lacto-N-fucopentaose I (LNFP I) was detected in all samples, while Lacto-N-difucohexaose (LDFT), Lacto-N-difucohexaose (LNDFH I and II) and lacto-N-fucopentaose V (LNFP V) were present in 57–100% of the samples (Suppl. Table S1). With the exception of 3-FL, LDFT and LNDFH II, all HMOs differed (p < 0.05) in concentration between time points (Suppl. Figure S1). From 1 to 3 months, median levels of Lacto-N-difucohexaose I (LNDFH I) (1194.9; 598 μM) and LNFP I (511.2; 202.8 μM) significantly (p < 0.05) decreased (Suppl. Figure S1). The only HMO that increased its concentration significantly (p < 0.05) from 1 to 3 months was LNFP V (300.5; 619.2 μM).
The sialic HMO 3-sialyllactose (3-SL) (187.11; 133.7 μM), 6-sialyllactose (6-SL) (80; 25.7 μM), and disialyllacto-N-tetraose (DSLNT) (206.6; 81.5 μM) were present in all samples at significantly higher levels (p < 0.05) at 1 compared to 3 months (Suppl. Figure S1). At 1 month, 3-SL was significantly higher (p < 0.05) in non-BF and exclusively-BF compared to partially-BF infants (Suppl. Table S1).
Lactose was recovered from all samples (125.2; 135.6 mM) with a significant increase in levels (p < 0.05) between 1 and 3 months (Suppl. Figure S1 and Table S1). The SCFA acetate, butyrate, and lactate, were present in all breast milk samples (Suppl. Table S2). Formate was detected in 77% of the samples at 1 month and in 74% at 3 months. Acetate levels ranged from 25.6 to 42.9 μM with no difference between 1 and 3 months (Suppl. Figure S2). The median level of butyrate at 1 month was 60.6 μM, which significantly increased (p < 0.05) to 228.4 μM at 3 months (Suppl. Figure S2). At 1 and 3 months, formate concentration from 15.5 to 14.5 μM, while lactate concentrations ranged from 137.4 to 154.8 μM (Suppl. Figure S2 and Table S2).
These data show that breast milk is not only a source of HMO but also a vehicle for SCFA and lactate.
Infant fecal microbiota composition
Next, we next re-analyzed the data generated by Appert et al. Citation12 for the same cohort of samples collected within the months that are recommended for exclusive breastfeeding (3–4 months, termed 3 months throughout the manuscript), after the introduction of solid foods at 6–7 months (termed 6 months) and 12–13 months (termed 12 months). Fecal microbiota composition was determined based on breastfeeding status at 4 months using quantitative microbiota profiling based on combined 16S rRNA gene sequencing data (accessible at PRJNA616703) and quantitative PCR as provided by Appert et al. Citation12
Alpha-diversity indices increased from 3 to 12 months in all three breastfeeding groups (). At 3 months, richness based on Chao1 was 1.4 times higher for the non-BF group compared to the exclusively-BF (p < 0.05) and partially-BF (p < 0.05) groups (). At 6 months, Chao1, evenness and Shannon diversity of partially-BF were significantly lower (p < 0.05) than of non-BF, while at 12 months there was no difference in α-diversity indices and breastfeeding status ().
Figure 2. Fecal concentrations of fucose and fermentation metabolites.

Beta-diversity was evaluated using the Bray-Curtis distance. In principal coordinates analysis (PCoA), PcoA 1 captured 22.5% of the data while PcoA 2 explained 9.4% (). At 3 and 6 months, the majority of samples of exclusively-BF and partially-BF clustered together, while the samples collected at 12 months were more dispersed similar to the samples collected from non-BF infants (). There was a significant difference (p < 0.05) between the β-diversity distances regarding time (at 3, 6 and 12 months) or breastfeeding status (between exclusively, partially and non-BF), but there were no differences if both variables were combined ().
Based on 16S rRNA gene sequencing, most reads (>55%) were assigned to Bifidobacteriaceae at 3 months (Suppl. Figure S3). Enterobacteriaceae and Bacteroidaceae contributed 13.6% and 7.8%, respectively, in exclusively-BF. Major families in feces of non-BF were Lachnospiraceae (12.9%), Peptostreptococcaceae (9%) and Enterococcaceae (4.6%), whose abundance was <2% in exclusively or partially-BF infants. At 1 year of age, the three major bacterial families were Bifidobacteriaceae (22–36%), Lachnospiraceae (23–27%) and Bacteroidaceae (1–6%) in all three breastfeeding groups (Suppl. Figure S3).
Next, we used quantitative microbiota profiling to determine the absolute abundance of major bacterial families in the different breastfeeding groups (). The absolute abundance of Bifidobacteriaceae remained constant during the first year for all the breastfeeding groups with a median of 9.0 (IQR 8.2–9.7) log10 cells g−1 for exclusively-BF, 9.1 (IQR 8.6–9.5) log10 cells g−1 for partially-BF and 8.5 (IQR 8.1–9.4) log10 cells g−1 for non-BF.
Figure 3. Fecal concentrations of fucose and fermentation metabolites.

Cell counts of Bacteroidaceae were significantly higher for exclusively-BF (7.8 log10 cells g−1) compared to partially-BF (6.0 log10 cells g−1) (p < 0.05) at 3 months (). At 3 months, there was a significantly higher abundance of Pasteurellaceae in exclusively-BF (4.1 log10 cells g−1 (p < 0.05)) and partially-BF (5.0 log10 g−1 (p < 0.05) compared to non-BF (0 log10 cells g−1). Abundance of Peptostreptococcaceae was significantly (p < 0.05) lower for exclusively-BF (4.5 log10 cells g−1) and partially-BF (2.7 log10 cells g−1) compared to non-BF (6.8 log10 cells g−1) infants (). At 12 months, no significant difference was observed for abundance of Peptostreptococcaceae between groups (7.7 log10 cells g−1 median). The absolute abundance of Clostridiaceae increased over time from 6.8 to 7.6 log10 cells g−1 in exclusively-BF, 5.8 to 7.9 log10 cells g−1 in partially-BF and from 6.7 to 7.3 log10 cells g−1 in non-BF. The absolute abundance of Lachnospiraceae was around 5.9–7.2 log10 cells g−1 at 3 months and increased to 7.9–9.6 log10 cells g−1 at 12 months ().
Together, these data show that breastfeeding status was associated with higher abundance of bacterial families Bacteroidaceae, Pasteurellaceae and lower counts of Peptostreptococcaceae especially when samples from 3 months old infants were considered.
Fecal fermentation metabolite and fucose profiles
Fecal levels of fucose and of fermentation metabolites that were generated and presented by Appert et al. Citation12 and Sasaki et al.Citation25 for the same cohort were re-analyzed to establish whether there was an association between the breastfeeding status and intestinal microbial fermentation activity.
Fucose was present in the majority of fecal samples (>92%) at 3 months (Suppl. Table S3); fecal levels were higher for exclusively-BF (p < 0.05) or partially-BF (p < 0.05) compared to non-BF (). At 3 months, lactate was detected in 80% and 62% of the feces of the BF- and non-BF infants, respectively (Suppl. Table S3). Fecal lactate levels of exclusively-BF (median 52 μmol g−1 feces) were significantly higher than of the non-BF (11 μmol g−1, p < 0.05) group (). At 3 months, there was a significant difference in the occurrence of 1,2-PD in feces of exclusively-BF (83%), partially-BF (63%) and non-BF (23%) infants (p < 0.05) (Suppl. Table S3). Median levels of 1,2-PD were higher (14 μmol g−1) for the exclusively-BF compared to the non-BF infants (0 μmol g−1 (p < 0.05)) ().
Acetate was the major SCFA present in the feces with a significant difference (p < 0.05) between non-BF and partially-BF infants at 12 months (). At 3 months, the occurrence of propionate and butyrate in exclusively-BF infants (41% and 21%) was significantly lower (p < 0.05) compared to non-BF (92% and 62%, Suppl. Table S3). Median levels of fecal propionate were significantly higher for both partially (p < 0.05) and non-BF (p < 0.001) compared to exclusively-BF at 3 months (), while butyrate levels were significantly higher in non-BF compared to exclusively-BF (p < 0.01).
Taken together, these data show that breastfeeding status had a strong impact on fecal fermentation profiles especially at 3 months. There was an inverse relationships of lactate, and butyrate and propionate, while fucose and its major metabolite 1,2-PD accumulated together with lactate in feces of breastfed infants.
Relationship of breast milk composition, fecal microbiota abundance and fermentation metabolites
To identify relationships between quantitative breastfeeding data and microbiota abundance fecal metabolites levels, we performed a factor analysis for mixed data (FAMD) of fecal and milk samples collected at 3 months.
The first dimension explained 19.7% of the data, while the second dimension explained 12.1% (). The variable ‘exclusively-BF’ was related to ‘Pasteurellaceae’, and fecal concentrations of ‘lactate’, ‘1,2-PD’ and ‘fucose’ and levels of ‘lactose’, ‘3SL’, ‘DSLNT’ and ‘2FL’ in milk; while variable ‘Non-BF’ samples was linked to fecal ‘butyrate’ and ‘propionate’, as well as abundance of ‘Peptostreptococcaceae’, ‘Erysipelotrichaceae’, ‘Eggerthellaceae’, ‘Lactobacill-aceae’ and ‘Ruminococcaceae’ family (). ‘Delivery mode’, ‘Partially-BF’ or ‘secretor phenotype’ did not have any impact in the quantitative parameters in these two dimensions ().
Figure 4. Relationship of fecal microbiota composition, fermentation metabolites and milk composition with delivery mode, secretor phenotype and breastfeeding status.

Impact of fucose, 1,2-PD and lactate on growth and metabolic activity of selected Peptostreptococcaceae and Clostridiaceae
Since the abundance of the Peptostreptococcaceae was higher for the non-BF group compared to exclusively and partially-BF at 3 months, and there was an inverse relationship with BF status and fecal lactate, fucose and 1,2-PD levels (), we investigated the response of selected Peptostreptococcaceae to the presence of compounds that were accumulated in feces of BF infants, i.e., the HMO component fucose, and the fermentation intermediates lactate and 1,2-PD and compared the response to members of the Clostridiaceae. Clostridiaceae was selected as a phylogenetically and functionally closely related taxon that potentially also contributes to early butyrate production in the infant gut.Citation12,Citation26
Based on the data generated by Appert et al.Citation12 and additional blast analysis, the majority of Amplicon Sequence Variants (ASVs) assigned to the family Peptostreptococcaceae were C. difficile (81.7%) and Intestinibacter bartlettii (13.2%) (Suppl. Table S4). The majority of Clostridiaceae ASVs were assigned to Clostridium sensu stricto, i.e. Clostridium perfringens (61.5%), Clostridium butyricum (16.3%) and Clostridium paraputrificum (10.5%) with lower proportions of Clostridium baratii and Clostridium neonatale (0.5–1.3%) (Suppl. Table S4). We obtained representative strains from commercial and laboratory culture collections and conducted growth assays in Hungate tubes using anaerobically prepared modified yeast-extract casitone medium without fatty acids (YC, Duncan et al.)Citation27. Measurements of turbidity were performed after 0 and 24 h of incubation at 37°C, substrate utilization and metabolite formation were determined using HPLC-RI. The increase in turbidity in YC medium without carbon source (0.2–3.8 McFarland units, AU) and corresponding metabolites were subtracted.
All strains grew in the presence of glucose () producing mostly lactate, butyrate, formate and acetate (Clostridiaceae) or acetate, butyrate and formate (Peptostreptococcaceae) (). There was an increase in turbidity of C. neonatale LiF, C. perfringens FMT 1006, C. difficile DSM 12056 and I. bartlettii DSM 16795 when grown in the presence of fucose concurrently, fucose was used and mainly acetate, formate, and 1,2-PD were formed (). C. perfringens FMT 1006 and C. difficile DSM 12056 and FMT 1007 produced additional propionate and butyrate (). In the presence of lactate, turbidity only increased for C. baratii FMT 558, while it did not change or became lower for all other strains (). Butyrate (3.3–1.3 mM) and/or acetate (9.5–4.5 mM) were formed by C. baratii FMT 558, C. butyricum CBL4, C. perfringens FMT 568 and FMT 1006, and C. difficile DSM 12056 and FMT 1007 (). In the presence of 1,2-PD, there was little change in turbidity, nevertheless, C. baratii FMT 558 and C. perfringens FMT 1006 utilized about 50% and 100% of the supplied 1,2-PD ().
Figure 5. Turbidity of selected strains of Clostridiaceae and Peptostreptococcaceae in YC medium.

Figure 6. Substrate utilization and metabolite production of selected HMO components and fermentation metabolites.

These data indicate the overall capacity of infant-associated species of Clostridiaceae and Peptostreptococcaceae species to utilize fucose and 1,2-PD derived from fucosylated HMO for growth, and additionally suggest that lactate might be inhibitory toward strains of C. perfringens, C. difficile and I. bartlettii.
Antimicrobial activity of acetic and lactic acid
As there was lower turbidity during growth in YC-lactic acid (55 mM) in vitro, we determined the antimicrobial activity of lactic acid against selected strains of Peptostreptococcaceae (C. difficile DSM 12056 and I. bartlettii DSM 16795) and Clostridiaceae (C. perfringens FMT 568 and FMT 1006) using broth dilution assays in 96-well microtiter plates at strict anaerobic conditions. For comparison, acetic acid, the most abundant SCFA in feces, was included in the assay. The pH of the Wilkins-Chalgren medium was adjusted to pH 5.5 and 6.2, maximal concentrations of acetic and lactic acid were 90 mM. Plates were incubated at anaerobic conditions at 37°C for 24 h until optical density was measured at 590 nm. Data were fit in a sigmoidal equation (four logistic parameters) used to calculate the minimal inhibitory concentration reducing the final density to 50% (MIC50).
Data could only be fit by the sigmoidal equation at pH 5.5 for C. difficile DSM 12056 and I. bartlettii DSM 16795, the MIC50 of lactic acid for C. difficile DSM 12056 and I. bartlettii DSM 16795 was 25 mM, while the MIC50 was >90 mM with acetic acid (Suppl. Figure S4). For C. perfringens FMT 568 and FMT 1006, the MIC50 toward acetic or lactic acid could not be determined, as turbidity was only reduced to 89.0 ± 3.4% and 43.1 ± 17.7%, or 51.6 ± 9.6% and 47.6 ± 13.0% in the presence of 90 mM acid, respectively, compared to controls (Suppl. Figure S4).
At pH 6.2, C. difficile DSM 12056 and I. bartlettii DSM 16795 reached 87.4 ± 19.8% and 54.1 ± 13.4% when grown with 90 mM acetic acid compared to controls, with lower maximum turbidity 34.9 ± 9.3% and 17.4 ± 8.4% when 90 mM lactic acid was present (Suppl. Figure S4). Turbidity of both C. perfringens with 90 mM acetic and lactic acid was 67.7 ± 12.4 and 49.6 ± 07.4% compared to positive controls. All strains reached lower optical density when grown in pH 5.5 compared to pH 6.2 (Suppl. Figure S4). There was no synergistic activity of lactic and acetic acid (data not shown).
In summary, the strains of Peptostreptococcaceae were more sensitive toward lactate than strains of Clostridiaceae at the tested conditions, and acetate had less antimicrobial activity than lactate at standardized pH.
Discussion
During the first year of life, the infant gut microbiota changes in composition with a major gain in functional capacity with the introduction of solid food during weaning. Infant gut microbiota composition has been shown to be influenced by parameters including the mode of delivery, gestation age, the use of antibiotics, and the type of feeding.Citation19 Our data showed that breastfeeding was associated with distinctive fecal fermentation metabolite profiles that related to higher abundance of Peptostreptococcaceae in infants that were not breastfed. In vivo observations together with in vitro experiments suggested that lactate might play an inhibitory role in the growth of members of the Peptostreptococcaceae family during exclusive breastfeeding.
Fermentation of fucosylated HMO characterizes fecal fermentation profiles
2-FL and 3-FL were the major HMO found in breast milk in agreement with previous studies.Citation7,Citation28–30 2-FL represented 30% of the HMO content of secretor mothers, which is the major phenotype in Europe accounting for almost 80% of the mothers.Citation29,Citation31,Citation32 A similar proportion was observed for this Swiss cohort.
Infant-associated Bifidobacterium spp. are able to degrade and cross-feed on fucosylated HMO.Citation33 Strains of B. bifidum liberate the fucose extracellularly, fucose that is not used in microbial cross-feeding might account for the levels of free fucose observed in feces.Citation34
Strains of the species B. longum subsp. infantis, B. breve, and B. kashiwanohense ferment fucosyllactose and fucose producing acetate, formate, lactate and 1,2-PD.Citation8,Citation10,Citation35 Exclusively-BF infants had higher fecal levels of both lactate and 1,2-PD compared to non-BF infants in agreement with other cohorts.Citation36–38 These results indicate that the presence of fucose, 1,2-PD and lactate was directly related to breastfeeding. These compounds are products of Bifidobacterium-driven metabolism of the most prominent HMO 2-FL and 3-FL and might also be released by other HMO utilizers including Bacteroidaceae.Citation33,Citation39 It is currently under debate whether HMOs are possibly supplied in surplus as spent HMOs were recovered in feces with concentrations decreasing during the first months of breastfeeding,Citation40 or whether fecal recovery of HMO depends on the abundance of certain strains of B. longum subsp. infantis.Citation41
Without nutritional restrictions during breastfeeding, microbiota profiles and fecal fermentation metabolites became more diverse
Breastfeeding has been frequently associated with a lower α-diversity compared to formula fed infants and to a dominance of Bifidobacterium.Citation13,Citation22,Citation42 With the cessation of breastfeeding due to the introduction of formula or solid foods, the competitive advantage of HMO utilizers decreases, which leads to higher fecal microbial taxonomic diversity.Citation19,Citation37,Citation38 In non-breastfed infants and after weaning, the microbial community became more diverse with a concurrent increase in fecal propionate and butyrate levels.Citation37,Citation38
During breastfeeding, fecal levels of butyrate and propionate remained low despite the potential of some functional groups to use the fermentation intermediates lactate or 1,2-PD and to produce butyrate and propionate from HMOs. As an example, the fermentation metabolite 1,2-PD can be metabolized into propionate by gut microbes such as Anaerobutyricum hallii, Blautia obeum, Ruminococcus gnavus and Flavonifractor plautii and seems to be available in excess, yet these species were low abundant at 3 months leading to the accumulation of 1,2-PD in feces.Citation12,Citation43,Citation44 Similarly, the butyrate producing Roseburia hominis or Roseburia inulivorans can degrade and utilize HMO but were only present at low abundance (3–4 log10 cells g−1 feces) before weaning.Citation12,Citation45
Among the early detected succinate/propionate producers were members of the Bacteroidota with strains of the species B. fragilis and B. vulgatus being able to metabolize HMOs.Citation19,Citation46 In agreement, Bacteroides and Prevotellaceae were more abundant in exclusively-BF infants in this study, but were still present at significantly lower levels than Bifidobacterium possibly due to a higher competitiveness of Bifidobacterium spp. in utilizing HMOs with a low degree of polymerization.Citation47 Early colonizing butyrate producers in the infant gut were Clostridiaceae and Peptostreptococcaceae, abundance of the last-mentioned was lower in breastfed infants.
SchwabCitation18 recently suggested that the ability to use HMOs as alternative or secondary substrate might support the colonization or seeding of propionate and butyrate producers. Despite a lack of competitiveness against Bifidobacterium spp. such an early colonization might prime the intestinal microbial community for the development of degradation and fermentation capacity as soon as breastfeeding has been terminated. This is supported by the observation that fecal propionate and butyrate levels increased once breastfeeding was terminated, or even before weaning in the non-BF group.
Clostridiaceae and Peptostreptococcaceae can selectively use HMO derived monomers or metabolites
Appert et al.Citation12 identified members of the families Clostridiaceae and Peptostreptococcaceae as first butyrate producers in samples of 3-month-old infants. These families include taxa that are characterized by their ability of producing butyrate from the catabolism of other compounds such glucose or acetate, but also through peptidoolytic activity.Citation48 Here, we show that strains of C. perfringens, C. neonatale and C. difficile utilized HMO derived fucose and 1,2-PD. A study performed by Salli et al. Citation49 observed a small increase in turbidity of C. perfringens E-98861 grown in the presence of 3-FL and fucose but no growth of different strains of C. difficile. C. perfringens ATCC 13124 did not utilize fucosyl- or sialyllactose.Citation39 These results indicate that Clostridiaceae and Peptostreptococcaceae might profit from HMO derived cross-feeding in a species- and/or strain-dependent manner, which seems, however, not to contribute to the overall competitiveness especially of the Peptostreptococcaceae in breastfed infants during the first months of life.
The fermentation metabolite lactate impacts C. difficile and I. bartlettii abundance and growth
At 3 months, we observed significantly higher levels of Peptostreptococcaceae in non-BF infants. Several publications agree on a lower occurrence of the family Peptostreptococcaceae when comparing breastfed and non-breastfed infants.Citation13,Citation15,Citation50,Citation51 Among the Peptostreptococcaceae, C. difficile abundance has been repeatedly related to a non-breastfeeding status pointing at a breastmilk component or fermentation metabolite with inhibitory activity toward C. difficile.Citation52 Here, the family Peptostreptococcaceae was less abundant in lactate-rich feces of breastfed infants, and strains of the species C. difficile and I. bartlettii were inhibited by lactic acid in vitro. Together, these results suggest that fermentation derived lactate might play an inhibitory role toward members of the Peptostreptococcaceae through direct interaction as an antimicrobial in breastfed infants; such an antimicrobial effect was not evident in non-breastfed infants. C. difficile is considered a commensal in infants with a toxin burden of about 20%, and pediatric C. difficile infections have been reported.Citation53,Citation54 Intestinal HMO fermentation might be a contributing a defense mechanism to reduce the risk of such an infection.
Even in exclusively-BF infants that were colonized with C. difficile, fecal microbial or metabolic indicators more closely resembled non-breastfed infants including a higher α-diversity, a lower relative abundance of Bifidobacteriaceae, higher relative abundance of Bacillota and Pseudomonata, and higher fecal propionate and butyrate levels compared to non-colonized infantsCitation55 supporting the observation that a breastfeeding-related fermentation profile impacts C. difficile colonization. A recent study reported that the inclusion of 2-FL to infant formula in combination with the probiotic lactate producer Limosilactobacillus reuteri led to significantly lower abundance of C. difficile in vivo, which could be partly attributed to the potential of L. reuteri to produce lactate.Citation56
Lactic acid had a stronger inhibitory effect than acetic acid
Based on the ‘weak acid theory’, the antimicrobial activity of SCFAs and lactate relies on the degree of dissociation as mainly the undissociated, more hydrophobic molecule passes through the cell membrane to dissociate intracellularly.Citation23 Antimicrobial activity of SCFAs and lactate is therefore linked to environmental pH and the dissociation constant (pKa) of the weak acid; a higher pKa relates to higher antimicrobial activity compared weak acids with a low pKa. With a pKa of 3.86, lactic acid is a stronger acid but a weaker antimicrobial than acetic acid (pKa 4.76). In agreement, previous studies targeting species such as Penicillium sp, Fusarium graminearum, Aspergillus niger and Escherichia coli. Citation57,Citation58 showed higher antimicrobial activity of acetic acid than lactic acid. In this study conducted at controlled pH, lactic acid inhibited C. difficile and I. bartlettii more effectively than acetic acid indicating a compound specific mode of action and/or species dependent susceptibility beyond the weak acid theory.
Lactic acid levels could also be connected to fecal pH. A review including studies from 1926 to 2017, reported a trend for an increase in fecal pH during the last century, which concurrently related to higher presence of bacterial families including Clostridiaceae and Peptostreptococcaceae.Citation59 In vitro, we observed lower turbidity of strains of Peptostreptococcaceae and Clostridiaceae after growth in medium with pH 5.5 compared to 6.2.
Breast milk is a source of SCFA and lactate
In addition to being exposed to SCFA and lactate produced by intestinal microbial HMO fermentation, breast milk contained acetate, formate, butyrate, and lactate. There have been only a few studies that investigated SCFA and lactate content in breast milk. Stinson et al. Citation4 reported a median content of 47 μM acetate, 96 μM butyrate, 44 μM formate and 171 μM lactate in breast milk from 109 mothers collected at 1 months.Citation4,Citation60 While we also consistently recovered SCFA and lactate, levels were up to three-fold lower. Nevertheless, these results show that breast milk should be considered a source of fermentation metabolites for potential cross-feeding or with antimicrobial activity. With an estimated daily consumption of 700 mL at 4 months, there would be a daily uptake of 30 µmol acetate, 159.9 µmol butyrate and 10.2 µmol formate, and 108.4 µmol lactate, which could contribute to antimicrobial activity if not absorbed in the upper gastrointestinal tract.Citation61 Limited data is available on human lactate absorption. In sheep, absorption of lactate depended on concentration and pH while in pigs, absorption behavior was more similar to glucose than to other SCFA.Citation62,Citation63 Butyrate absorption occurs mainly in the colonocytes in the proximal colon either through passive diffusion or by active transport mechanisms linked to ion exchange.Citation64
Study limitations
Despite of all the findings presented above, this study presents some limitations. Collection of milk was performed at 1 and 3 months to cover two stages of lactation, while fecal samples were collected at 3, 6 and 12 months. The non-BF and partially-BF groups included a lower number of children compared to the exclusively-BF group, and we may not have had enough statistical power to detect differences between the three groups. Furthermore, most children of the non-BF group were also exposed to some breastmilk before 3 months, which may have caused underestimation of the effect of breastfeeding on the fecal microbiota or metabolite profile by making the groups similar. However, at 3 months, when the fecal samples were analyzed, the proportion of breastfeeding among the children in the non-BF group was 11/14 (75.8%) and children in the non-BF group were mixed-breastfed for a median of 7.5 weeks. Additionally, information on the dose or frequency of formula milk consumption was not available for the children in the partially breastfed group. Thus, it was not possible to assess whether there is a dose–response relationship between formula or breastmilk exposure and fecal microbiota or metabolites.
Conclusion
This study shows a major impact of breastfeeding on microbial community composition and fermentation activity before weaning. Exclusive breastfeeding promoted the accumulation of fecal metabolites from Bifidobacterium-HMO utilization such as fucose, 1,2-PD and lactate with the potential involvement of other bacterial families. While breastfeeding likely suppressed additional fermentation activity, butyrate and propionate producers were already present at 3 months of age setting stage for an increase in fermentation capacity when breast milk is replaced with infant formula, or for the onset of weaning.
Members of the Clostridiaceae and Peptostreptococcaceae utilized HMO derived fucose and 1,2-PD, nevertheless, there was higher abundance in Peptostreptococcaceae family in the non-breastfed infants compared to the exclusively-BF which might directly relate to the antimicrobial activity of the fermentation metabolite lactate. These observations suggest that breastfeeding not only directs fermentation activity but that the fermentation metabolites themselves impact the composition of the intestinal microbiota. The results obtained here might suggest targeted interventions to direct colonization of selective microbes during the first months of life.
Materials and methods
Materials and chemicals
All chemicals were purchased from Merck (Denmark) unless specified otherwise.
Cohort and sample collection
Childhood AlleRgy, nutrition and Environment (CARE) is a birth cohort in which 69 infants and mothers from Switzerland were chosen for the following project between 2016 and 2019. Mothers were recruited at the cantonal and children’s hospitals in St. Gallen. Ethical approval was obtained from the Ethics Commission from Ostschweiz (EKSG 15/005), the Swiss ethic ID is: PB_2017–00243. All healthy babies born in the Cantonal Hospital St. Gallen with at least one parent who speaks German were considered eligible for the study and invited to participate after birth. Exclusion criteria were congenital abnormality, chronic lung disease, immune deficiency of the child, or autoimmune disease of the mother.
The CARE cohort monitored the breastfeeding of the participants over time and collected milk samples at the age of 1 month (±1 week, 22–37 days) and 3 months (3–4 months, 80–177 days). Data presented in the manuscript on breastfeeding status was based on weekly food diaries until the end of year 1. Milk samples were collected by the participants. Mothers were advised to collect milk between 7 am and 1 pm in the course of breastfeeding. Afterwards, 5 mL of milk sample was collected in a tube. Samples were sent overnight with a cooling pad to the laboratory, were aliquoted within the period of 24–48 hours and kept at −80°C until analysis. Infants were divided into three groups based on their breastfeeding status at exactly 4 months as exclusively breastfed (Exclusively-BF) (n = 38), partially breastfed (Partially-BF) (n = 17) or not breastfed (Non-BF) (n = 14). Fecal samples were collected at 3 (90–120 days), 6 (180–210 days) and 12 months (330–390 days) were transferred to the laboratory as described by Appert et al. Citation12
Analysis of microbial composition and fecal fermentation metabolites based on breastfeeding status
To determine the impact of breast milk on fecal microbiota composition and fermentation metabolites, the 16S rRNA gene libraries, qPCR-based abundance data and the fecal fermentation metabolites collected by Appert et al.Citation12 were re-analyzed depending on time and breastfeeding status of the infants. Methods are described in detail in Appert et al. Citation12 Briefly, 16S rRNA gene sequencing was performed by targeting the V4 hypervariable region using the primers 515F (5’-GTGCCAGCMGCCGCGG TAA-3’) and 806 R (5’-GGACTACHVGGGTWTCTAAT-3’) using an Illumina MiSeq platform with 250 × 2 read length by the usage of v2 chemistry followed by bioinformatic analysis as described.Citation12 16S rRNA gene sequences are available at NCBI’s SRA archive under BioProject with accession number PRJNA616703. qPCR assays were performed to determine total abundance of bacteria using a Roche LightCycle 480 System. Total and relative bacteria abundance data was combined for quantitative microbiota profiling.Citation12 Fecal fermentation metabolites and fucose obtained with a water-based extraction method were analyzed using HPLC-RI.Citation12
The number of fecal samples collected at the different time points (3, 6 and 12 months) depending on the breastfeeding status of the infants were at 3 months: Exclusively-BF n = 34, Partially-BF n = 16, Non-BF n = 13; at 6 months: Exclusively-BF n = 38, Partially-BF n = 17, Non-BF n = 14; at 12 months: Exclusively-BF n = 38, Partially-BF n = 17, Non-BF n = 14.
In this study, we calculated alpha-diversity at an initial subsampling of ASVs higher than 15.000 reads or more, and further used to calculate the richness and diversity indices (Chao1, Shannon). Beta-diversity was calculated with all the entire gene catalog using Bray-Curtis dissimilarity matrix using the R package ‘vegan 2.6–2’. Principal Coordinate Analysis (PCoA) ordination was used for visualization, components that plot close present lower dissimilarity. Here, we combined the SILVA (v. 132) based assignment with additional BLASTn analysis (refseq_rna) for taxonomic identification to determine the species distribution within the ASV assigned to Clostridiaceae and Peptostreptococcaceae at 3 months.
Strains and growth conditions
Strains (Suppl. Table S4) were obtained from the German Collection of Microorganisms and Cell Cultures (DSMZ, Germany), from the strain collection of the Department of Functional Microbe Technology (FMT) (Aarhus University, Denmark) or from the Department of Microbiology, Dietetics and Nutrition of Czech University of Life Sciences Prague (CZU, Czechia). Bacteria were routinely cultivated in Wilkins-Chalgren supplemented with 5 g/L soya peptone (WCSP, Biolife), 1 g/L Tween 80, and 0.5 g/L L-cysteine-HCl. All components were solubilized in milliQ water. The pH was adjusted to 7.1 before boiling, and L-cysteine-HCl was added before degassing for a final pH of 6.5 after autoclaving. Samples were dispersed in Hungate tubes under constant CO2 flow and were autoclaved at 120°C for 20 min. To reactive strains from −80°C glycerol stocks and to generate working cultures, strains were streaked on anaerobically prepared WCSP agar plates (WSCP with the addition of 15 g/L agar (VWR)) in an anaerobic chamber (10% CO2, 5% H2, 85% N2, Coy Laboratories, USA) and were incubated for 3 days. Single colonies were picked and inoculated in anaerobic WCSP broth in Hungate tubes at 37°C for 24 h unless indicated otherwise. Strain identification was confirmed by Sanger sequencing of the 16S rRNA gene as indicated in Suppl. Table S4. Strain purity was routinely checked using microscopy.
Utilization of fucose, HMO and selected fermentation metabolites by strains of Clostridiaceae and Peptostreptococcaceae
To test the utilization of fucose, HMO and fermentation metabolites, single colonies from WCSP agar were transferred to a Hungate tube containing anaerobically prepared, modified yeast extract-casitone (YC) medium that was prepared as described by Duncan et al. Citation27 without volatile fatty acids but with 51 mM glucose (YC-glucose). After 24 h incubation at 37°C, 2% was transferred to new tubes with YC-glucose for incubation at 37°C for 24 h. Consequently, each strain was transferred (2%) to YC containing glucose (YC-glucose, positive control), YC with lactic acid (55 mM, YC-lactate), YC with 1,2-PD (43 mM, YC-1,2-PD); YC with fucose (45 mM) (YC-fuc). YC without additional carbon source as background control (YC). Turbidity was measured with the McFarland Densitometer (Grant-Bio) at 0 and 24 h of incubation. At 0 and 24 h, 1 mL culture was centrifuged at 10 000 g for 4 min for fermentation metabolite analysis. All experimental work was performed in at least independent triplicates.
Antimicrobial activity of lactic and acetic acid
The antibacterial activity of lactic and acetic acid was tested using two-fold broth dilution assay in 96-well sterile microtiter plates essentially as described.Citation65 Briefly, a two-fold dilution series of the organic acids was prepared in an anaerobic chamber in microtiter plates filled with 100 μL anaerobically prepared WCSP adjusted to pH 5.5 or 6.2. The maximum concentration of lactic and acetic acid was 100 mM. The cooperative antibacterial activity of lactic and acetic acid against C. perfringens FMT 568 and C. difficile DSM 12056 was tested using a modified broth dilution assay in 96-well sterile microtiter plates (VWR). Two-fold broth dilution assays were prepared horizontally (acetic acid) and vertically (lactic acid) with highest concentrations of 50 mM. Cells from overnight cultures of selected Clostridiaceae and Peptostreptococcaceae (Suppl. Table S4) grown in WSCP broth were diluted 100-fold in fresh WCSP at the respective pH and were added at 10%. Plates were incubated in an anaerobic bench at 37°C for 24 h. Positive controls (cultivation medium without organic acid), as well as blanks (sterile media instead of cell suspension), were included in each assay. Bacterial growth was detected by measuring the optical density at 590 nm after 24 h of incubation using the Infinite M200 Pro Plate Reader from TECAN. A sigmoidal (four parameter logistic) equation was used to fit the data (Sigma Plot version 15, Alfasoft); the inflection point of the resulting curve represents the MIC50 value, which was defined as the concentration that reduced final optical density of the test strains to 50% compared to optical density without inhibitors. Every strain was analyzed at least 3 times unless otherwise indicated.
Carbohydrate and metabolite analysis by HPLC-RI
Fermentation metabolites were measured from the supernatants obtained from the different YC-media at 24 h using the 1260 Infinity II LC System equipped with a Hi-Plex H guard (7.7 × 50 mm, 8 µm) and separation (300 × 7.7 mm) columns and a refractive index detector (all Agilent). The samples (10 μL injection volume) were eluted 5 mM H2SO4 at a flow rate of 0.6 mL min−1 at 40°C. Fucose and fermentation metabolites were quantified using external standards and Chromeleon Console (version 7.7.2.10) for analysis.
Analysis of the milk samples by 1H-NMR spectroscopy
In total 84 milk samples (At 1 month: Exclusively-BF n = 16, Partially-BF n = 7, Non-BF n = 7; at 3 months: Exclusively-BF n = 31, Partially-BF n = 12) were analyzed using 1H-NMR was performed as described.Citation66 Briefly, samples were removed from the −80°C, were thawed at room temperature for 30 min and were transferred to ice. Milk samples (300 μL) were transferred to a microcentrifuge tube, 300 μL milliQ water was added, vortexed and centrifuged at 4 000 × g for 10 min at 4°C, in order to skim the milk. Filters (Amicon Ultra 0.5 centrifugal filter 10K) were washed with 500 µL milliQ water three times by centrifugation at 10 000 × g for 10 min at 4°C followed by drying (filters inverted) by centrifugation at 800 × g for 10 sec at 4°C. After scooping the fat layer off the milk samples, 500 μL milk were added to the dry filters and centrifuged at 10 000 × g for 60 min at 4°C. The filtration product (400 μL) was transferred to a new microcentrifuge followed by the addition of 200 μL of a mixture of 60 µL deuterium oxide (D2O) containing 0.05% trimethylsilylpropanoic acid as internal chemical shift reference, and 140 µL milliQ water. The mixture (600 μL) was transferred then to an NMR tube (NMR 4’’ Tubes 5 mm, Bruker). NMR spectroscopy was performed on a 600 Bruker Neo-IVDR NMR spectrometer, operating at a 1H frequency of 600.03 MHz, and equipped with a 5-mm 1H BBI probe (Bruker). All 1H spectra were referenced to the TSP signal at 0 ppm. 1H-NMR spectra were phase and baseline corrected manually using Topspin 4.09 (Bruker Biospin). NMR signals were assigned in accordance with previous literature, 2D NMR spectroscopy, Chenomx NMR Suite 8.6 (Chenomx Inc) and the Human Metabolome Database.
Statistical analysis
Data analysis and statistics were performed by R Studio with the packages FSA, ggplot2, RcolorBrewer, ggpubr (Version 1.3.1093). Normality was tested for the metabolites determined by 1H-NMR by Shapiro-Wilk’s method and was identified as not normally distributed (p < 0.05) similar to the data provided by Appert et al.Citation12 Kruskal–Wallis test was used for the univariate comparison and Dunn test for the multiple posthoc comparisons with p-values adjusted with the Holm method using the package ‘rstatix’ version 0.7.0. Pairwise comparisons using Wilcoxon rank sum exact test and adjustment by Holm method was used for adjustment of p-values after Kruskal–Wallis test for pair-wise comparisons using the package ‘rstatix’ version 0.7.0. Chi square test was used for the categorical comparison using the package ‘rstatix’ version 0.7.0. Vegan package was used for calculations of beta diversity and Permutational multivariate analysis of variance (PERMANOVA).
Factor analysis for mixed data (FAMD) included categorical variables such as delivery mode, secretor phenotype, breastfeeding status and quantitative data such as absolute abundance of the families derived from quantitative microbiota profiling, fecal fermented (f_) metabolites and breastmilk (bm_) metabolites at 3 months. The values around the coordinate 0 reflect variables with low power of discrimination, therefore they do not influence in the distinction of the groups. Variables closer to the −1 or 1 coordinates have high power of discrimination. In this study, values with a contribution equal or below 1 in both dimensions 1 and 2 were discarded from the plotting.
Figures were made with RStudio (Version 1.3.1093), BioRender, Canva or with Sigma Plot.
Supplemental Material
Download MS Word (874.1 KB)Disclosure statement
No potential conflict of interest was reported by the author(s).
Data availability statement
The authors confirm that the data supporting the findings of this study are either submitted to public repository (PRJNA616703) or available within the article and its supplementary materials.
Supplementary material
Supplemental data for this article can be accessed online at https://doi.org/10.1080/19490976.2023.2241209
Additional information
Funding
References
- Pereira FC, Berry D. Microbial nutrient niches in the gut. Environ Microb. 2017;19(4):1366–21. doi:10.1111/1462-2920.13659.
- Ballard O, Morrow AL. Human milk composition: nutrients and bioactive factors. Pediatr Clin North Am. 2013;60(1):49–74. doi:10.1016/j.pcl.2012.10.002.
- Smilowitz JT, Lebrilla CB, Mills DA, German JB, Freeman SL. Breast milk oligosaccharides: structure-function relationships in the neonate. Annu Rev Nutr. 2014;34(1):143–169. doi:10.1146/annurev-nutr-071813-105721.
- Stinson LF, Gay MCL, Koleva PT, Eggesbø M, Johnson CC, Wegienka G, du Toit E, Shimojo N, Munblit D, Campbell DE, et al. Human milk from atopic mothers has lower levels of short chain fatty acids. Front Immunol. 2020;11:1427. doi:10.3389/fimmu.2020.01427.
- Schwab C, Voney E, Ramirez Garcia A, Vischer M, Lacroix C. Characterization of the cultivable microbiota in fresh and stored mature human breast milk. Front Microbiol. 2019;10:2666. doi:10.3389/fmicb.2019.02666.
- Bode L. Human Milk Oligosaccharides: Structure and Functions. Nestle Nutr Inst Workshop Ser. 2020;94:115–123. doi:10.1159/000505339.
- Azad MB, Robertson B, Atakora F, Becker AB, Subbarao P, Moraes TJ, Mandhane PJ, Turvey SE, Lefebvre DL, Sears MR, et al. ’Human milk oligosaccharide concentrations are associated with multiple fixed and modifiable maternal characteristics, environmental factors, and feeding practices. J Nutr. 2018;148(11):1733–1742. doi:10.1093/jn/nxy175.
- Bunesova V, Lacroix C, Schwab C. Fucosyllactose and L-fucose utilization of infant Bifidobacterium longum and Bifidobacterium kashiwanohense. BMC Microbiol. 2016;16(1):248. doi:10.1186/s12866-016-0867-4.
- Lawson MAE, O’Neill IJ, Kujawska M, Gowrinadh Javvadi S, Wijeyesekera A, Flegg Z, Chalklen L, Hall LJ. Breast milk-derived human milk oligosaccharides promote Bifidobacterium interactions within a single ecosystem. Isme J. 2020;14(2):635–648. doi:10.1038/s41396-019-0553-2.
- Tsukuda N, Yahagi K, Hara T, Watanabe Y, Matsumoto H, Mori H, Higashi K, Tsuji H, Matsumoto S, Kurokawa K, et al. Key bacterial taxa and metabolic pathways affecting gut short-chain fatty acid profiles in early life. Isme J. 2021;15(9):2574–2590. doi:10.1038/s41396-021-00937-7.
- Pham VT, Lacroix C, Braegger CP, Chassard C. Early colonization of functional groups of microbes in the infant gut. Environ Microbiol. 2016;18(7):2246–2258. doi:10.1111/1462-2920.13316.
- Appert O, Garcia AR, Frei R, Roduit C, Constancias F, Neuzil-Bunesova V, Ferstl R, Zhang J, Akdis C, Lauener R, et al. Initial butyrate producers during infant gut microbiota development are endospore formers. Environ Microbiol. 2020;22(9):3909–3921. doi:10.1111/1462-2920.15167.
- Azad MB, Konya T, Maughan H, Guttman DS, Field CJ, Chari RS, Sears MR, Becker AB, Scott JA, Kozyrskyj AL, CHILD Study Investigators. Gut microbiota of healthy Canadian infants: profiles by mode of delivery and infant diet at 4 months. CMAJ. 2013;185(5):385–394. doi:10.1503/cmaj.121189.
- Ho NT, Li F, Lee-Sarwar KA, Tun HM, Brown BP, Pannaraj PS, Bender JM, Azad MB, Thompson AL, Weiss ST, et al. Meta-analysis of effects of exclusive breastfeeding on infant gut microbiota across populations. Nat Commun. 2018;9(1):4169. doi:10.1038/s41467-018-06473-x.
- Ma J, Li Z, Zhang W, Zhang C, Zhang Y, Mei H, Zhuo N, Wang H, Wang L, Wu D. Comparison of gut microbiota in exclusively breast-fed and formula-fed babies: a study of 91 term infants. Sci Rep. 2020;10(1):15792. doi:10.1038/s41598-020-72635-x.
- Penders J, Vink C, Driessen C, London N, Thijs C, Stobberingh EE. Quantification of Bifidobacterium spp., Escherichia coli and Clostridium difficile in faecal samples of breast-fed and formula-fed infants by real-time PCR. FEMS Microbiol Lett. 2005;243(1):141–147. doi:10.1016/j.femsle.2004.11.052.
- Jiang H, Gallier S, Feng L, Han J, Liu W. Development of the digestive system in early infancy and nutritional management of digestive problems in breastfed and formula-fed infants. Food Funct. 2022;13(3):1062–1077. doi:10.1039/d1fo03223b.
- Schwab C. The development of human gut microbiota fermentation capacity during the first year of life. Microb Biotechnol. 2022;15(12):2865–2874. doi:10.1111/1751-7915.14165.
- Bäckhed F, Roswall J, Peng Y, Feng Q, Jia H, Kovatcheva-Datchary P, Li Y, Xia Y, Xie H, Zhong H, et al. Dynamics and stabilization of the human gut microbiome during the first year of life. Cell Host & Microbe. 2015;17(5):690–703. Erratum in: Cell Host Microbe. 2015;17(6):852. Jun, Wang [corrected to Wang, Jun]. Erratum in: Cell Host Microbe. 2015;17(6):852. doi:10.1016/j.chom.2015.04.004.
- Tanaka M, Nakayama J. Development of the gut microbiota in infancy and its impact on health in later life. Allergol Int. 2017;66(4):515–522. doi:10.1016/j.alit.2017.07.010.
- Pham VT, Greppi A, Chassard C, Braegger C, Lacroix C. Stepwise establishment of functional microbial groups in the infant gut between 6 months and 2 years: A prospective cohort study. Front Nutr. 2022;9:948131. doi:10.3389/fnut.2022.948131.
- Vandenplas Y, Carnielli VP, Ksiazyk J, Luna MS, Migacheva N, Mosselmans JM, Picaud JC, Possner M, Singhal A, Wabitsch M. Factors affecting early-life intestinal microbiota development. Nutrition. 2020;78:110812. doi:10.1016/j.nut.2020.110812.
- Siedler S, Balti R, Neves AR. Bioprotective mechanisms of lactic acid bacteria against fungal spoilage of food. Curr Opin Biotechnol. 2019;56:138–146. doi:10.1016/j.copbio.2018.11.015.
- Wang SP, Rubio LA, Duncan SH, Donachie GE, Holtrop G, Lo G, Farquharson FM, Wagner J, Parkhill J, Louis P, et al. Pivotal Roles for pH, Lactate, and Lactate-Utilizing Bacteria in the Stability of a Human Colonic Microbial Ecosystem. Microbial Ecosystem mSystems. 2020;5(5):e00645–20. doi:10.1128/mSystems.00645-20.
- Sasaki M, Schwab C, Ramirez Garcia A, Li Q, Ferstl R, Bersuch E, Akdis CA, Lauener R, CK-CARE study group, Frei R, et al. The abundance of Ruminococcus bromii is associated with faecal butyrate levels and atopic dermatitis in infancy. Allergy. 2022. doi:10.1111/all.15440.
- Candeliere F, Musmeci E, Amaretti A, Sola L, Raimondi S, Rossi M. Profiling of the intestinal community of Clostridia: taxonomy and evolutionary analysis. Microbiome Res Rep. 2023;2(3):13. doi:10.20517/mrr.2022.19.
- Duncan SH, Barcenilla A, Stewart CS, Pryde SE, Flint HJ. Acetate utilization and butyryl coenzyme a (CoA): acetate-CoA transferase in butyrate-producing bacteria from the human large intestine. Appl Environ Microbiol. 2002;68(10):5186–5190. doi:10.1128/AEM.68.10.5186-5190.2002.
- Plows JF, Berger PK, Jones RB, Alderete TL, Yonemitsu C, Najera JA, Khwajazada S, Bode L, Goran MI. Longitudinal changes in Human Milk Oligosaccharides (HMOs) over the course of 24 months of lactation. J Nutr. 2021;151(4):876–882. doi:10.1093/jn/nxaa427.
- Soyyılmaz B, Mikš MH, Röhrig CH, Matwiejuk M, Meszaros-Matwiejuk A, Vigsnæs LK. The mean of milk: A Review of human milk oligosaccharide concentrations throughout lactation. Nutrients. 2021;13(8):2737. doi:10.3390/nu13082737.
- Cheema AS, Trevenen ML, Turlach BA, Furst AJ, Roman AS, Bode L, Gridneva Z, Lai CT, Stinson LF, Payne MS, et al. Exclusively breastfed infant microbiota develops over time and is associated with human milk oligosaccharide intakes. Int J Mol Sci. 2022;23(5):2804. doi:10.3390/ijms23052804.
- Cheng YJ, Yeung CY. Recent advance in infant nutrition: Human milk oligosaccharides. Pediatr Neonatol. 2021;62(4):347–353. doi:10.1016/j.pedneo.2020.12.013.
- McGuire MK, Meehan CL, McGuire MA, Williams JE, Foster J, Sellen DW, Kamau-Mbuthia EW, Kamundia EW, Mbugua S, Moore SE, et al. What’s normal? Oligosaccharide concentrations and profiles in milk produced by healthy women vary geographically. Am J Clin Nutr. 2017;105(5):1086–1100. doi:10.3945/ajcn.116.139980.
- Schwab C, Ruscheweyh HJ, Bunesova V, Pham VT, Beerenwinkel N, Lacroix C. Trophic interactions of infant Bifidobacteria and Eubacterium hallii during L-Fucose and fucosyllactose degradation. Front Microbiol. 2017;8:95. doi:10.3389/fmicb.2017.00095.
- Sakanaka M, Gotoh A, Yoshida K, Odamaki T, Koguchi H, Xiao JZ, Kitaoka M, Katayama T. Varied pathways of infant gut-associated bifidobacterium to assimilate human milk oligosaccharides: Prevalence of the gene set and its correlation with bifidobacteria-rich microbiota formation. Nutrients. 2019;12(1):71. doi:10.3390/nu12010071.
- James K, Bottacini F, Contreras JIS, Vigoureux M, Egan M, Motherway MO, Holmes E, van Sinderen D. Metabolism of the predominant human milk oligosaccharide fucosyllactose by an infant gut commensal. Sci Rep. 2019;9(1):15427. Erratum in: Sci Rep. 2020;10(1):17265. doi:10.1038/s41598-019-51901-7.
- Chow J, Panasevich MR, Alexander D, Vester Boler BM, Rossoni Serao MC, Faber TA, Bauer LL, Fahey GC. Fecal metabolomics of healthy breast-fed versus formula-fed infants before and during in vitro batch culture fermentation. J Proteome Res. 2014;13(5):2534–2542. doi:10.1021/pr500011w.
- Bridgman SL, Azad MB, Field CJ, Haqq AM, Becker AB, Mandhane PJ, Subbarao P, Turvey SE, Sears MR, CHILD Study Investigators, et al. Fecal short-chain fatty acid variations by breastfeeding status in infants at 4 months: Differences in relative versus absolute concentrations. Front Nutr. 2017;4:11. doi:10.3389/fnut.2017.00011.
- Borewicz K, Gu F, Saccenti E, Hechler C, Beijers R, de Weerth C, van Leeuwen SS, Schols HA, Smidt H. The association between breastmilk oligosaccharides and faecal microbiota in healthy breastfed infants at two, six, and twelve weeks of age. Sci Rep. 2020;10(1):4270. doi:10.1038/s41598-020-61024-z.
- Yu ZT, Chen C, Newburg DS. Utilization of major fucosylated and sialylated human milk oligosaccharides by isolated human gut microbes. Glycobiology. 2013;23(11):1281–1292. doi:10.1093/glycob/cwt065.
- Jensen NM, Heiss BE, Mills DA. How nursing mothers protect their babies with bifidobacteria. Good Microbes Medi, Food Prod Biotechnol Biorem Agri. 2022;13–21. doi:10.1002/9781119762621.ch2.
- He X, Parenti M, Grip T, Lönnerdal B, Timby N, Domellöf M, Hernell O, Slupsky CM. Fecal microbiome and metabolome of infants fed bovine MFGM supplemented formula or standard formula with breast-fed infants as reference: a randomized controlled trial. Sci Rep. 2019;9(1):11589. doi:10.1038/s41598-019-47953-4.
- Milani C, Duranti S, Bottacini F, Casey E, Turroni F, Mahony J, Belzer C, Delgado Palacio S, Arboleya Montes S, Mancabelli L, et al. The first microbial colonizers of the human gut: composition, activities, and health implications of the infant gut microbiota. Microbiol Mol Biol Rev. 2017;81(4):e00036–17. doi:10.1128/MMBR.00036-17.
- Reichardt N, Duncan SH, Young P, Belenguer A, McWilliam Leitch C, Scott KP, Flint HJ, Louis P. Phylogenetic distribution of three pathways for propionate production within the human gut microbiota. Isme J. 2014;8(6):1323–1335. Epub 2014. Erratum in: ISME J. 2014;8(6):1352. doi:10.1038/ismej.2014.14.
- Zhang J, Lacroix C, Wortmann E, Ruscheweyh HJ, Sunagawa S, Sturla SJ, Schwab C. Gut microbial beta-glucuronidase and glycerol/diol dehydratase activity contribute to dietary heterocyclic amine biotransformation. BMC Microbiol. 2019;19(1):99. doi:10.1186/s12866-019-1483-x.
- Pichler MJ, Yamada C, Shuoker B, Alvarez-Silva C, Gotoh A, Leth ML, Schoof E, Katoh T, Sakanaka M, Katayama T, et al. Butyrate producing colonic Clostridiales metabolise human milk oligosaccharides and cross feed on mucin via conserved pathways. Nat Commun. 2020;11(1):3285. doi:10.1038/s41467-020-17075-x.
- Marcobal A, Barboza M, Froehlich JW, Block DE, German JB, Lebrilla CB, Mills DA. Consumption of human milk oligosaccharides by gut-related microbes. J Agric Food Chem. 2010;58(9):5334–5340. doi:10.1021/jf9044205.
- Marcobal A, Barboza M, Sonnenburg ED, Pudlo N, Martens EC, Desai P, Lebrilla CB, Weimer BC, Mills DA, German JB, et al. Bacteroides in the infant gut consume milk oligosaccharides via mucus-utilization pathways. Cell Host & Microbe. 2011;10(5):507–514. doi:10.1016/j.chom.2011.10.007.
- De Vos P, Garrity GM, Jones D, Krieg NR, Ludwig W, Rainey EA, Schleifer KH, Whitman WB, ed. Bergey’s Manual of Systematic Bacteriology. Vol. 3, 2nd ed. Dordrecht, The Netherlands: The Firmicutes. Springer; 2009.
- Salli K, Hirvonen J, Siitonen J, Ahonen I, Anglenius H, Maukonen J. Selective Utilization of the human milk Oligosaccharides 2’-Fucosyllactose, 3-Fucosyllactose, and difucosyllactose by various probiotic and pathogenic bacteria. J Agric Food Chem. 2021;69(1):170–182. doi:10.1021/acs.jafc.0c06041.
- Brink LR, Mercer KE, Piccolo BD, Chintapalli SV, Elolimy A, Bowlin AK, Matazel KS, Pack L, Adams SH, Shankar K, et al. Neonatal diet alters fecal microbiota and metabolome profiles at different ages in infants fed breast milk or formula. Am J Clin Nutr. 2020;111(6):1190–1202. doi:10.1093/ajcn/nqaa076.
- Tannock GW, Ercolini D. Building robust assemblages of bacteria in the human gut in early life. Appl Environ Microbiol. 2021;87(22):e0144921. doi:10.1128/AEM.01449-21.
- Bridgman SL, Konya T, Azad MB, Guttman DS, Sears MR, Becker AB, Turvey SE, Mandhane PJ, Subbarao P, CHILD Study Investigators, et al. High fecal IgA is associated with reduced Clostridium difficile colonization in infants. Microbes Infect. 2016;18(9):543–549. doi:10.1016/j.micinf.2016.05.001.
- Ferretti P, Wirbel J, Maistrenko OM, Van Rossum T, Alves R, Fullam A, Akanni W, Schudoma C, Schwarz A, Thielemann R, et al. C. difficile may be overdiagnosed in adults and is a prevalent commensal in infants. bioRxiv. 2022. doi:10.1101/2022.02.16.480740.
- Schutze GE, Willoughby RE, Brady MT, Byington CL, Dele Davies H, Edwards KM, Glode MP, Jackson MA, Keyserling HL, Maldonado YA, et al. Clostridium difficile Infection in Infants and Children. Pediatrics. 2013;131(1):196–200. doi:10.1542/peds.2012-2992.
- Drall KM, Tun HM, Morales-Lizcano NP, Konya TB, Guttman DS, Field CJ, Mandal R, Wishart DS, Becker AB, Azad MB, et al. Clostridioides difficile colonization is differentially associated with gut microbiome profiles by infant feeding modality at 3-4 months of age. Front Immunol. 2019;10:2866. doi:10.3389/fimmu.2019.02866.
- Alliet P, Vandenplas Y, Roggero P, Jespers SNJ, Peeters S, Stalens JP, Kortman GAM, Amico M, Berger B, Sprenger N, et al. Safety and efficacy of a probiotic-containing infant formula supplemented with 2’-fucosyllactose: a double-blind randomized controlled trial. Nutr J. 2022;21(1):11. doi:10.1186/s12937-022-00764-2.
- Gerez CL, Torino MI, Rollán G, Font de Valdez G. Prevention of bread mould spoilage by using lactic acid bacteria with antifungal properties. Food Control. 2009;20(2):144–148. doi:10.1016/j.foodcont.2008.03.005.
- Chun AY, Yunxiao L, Ashok S, Seol E, Park S. Elucidation of toxicity of organic acids inhibiting growth of Escherichia coli w. Biotechnol Bioprocess Eng. 2014;19(5):858–865. doi:10.1007/s12257-014-0420-y.
- Henrick BM, Hutton AA, Palumbo MC, Casaburi G, Mitchell RD, Underwood MA, Smilowitz JT, Frese SA. Elevated fecal ph indicates a profound change in the breastfed infant gut microbiome due to reduction of Bifidobacterium over the past century. mSphere. 2018;3(2):e00041–18. doi:10.1128/mSphere.00041-18.
- Prentice PM, Schoemaker MH, Vervoort J, Hettinga K, Lambers TT, van Tol EAF, Acerini CL, Olga L, Petry CJ, Hughes IA, et al. Human milk short-chain fatty acid composition is associated with adiposity outcomes in infants. J Nutr. 2019 May 1;149(5):716–722. doi:10.1093/jn/nxy320.
- Kent JC, Mitoulas LR, Cregan MD, Ramsay DT, Doherty DA, Hartmann PE. Volume and frequency of breastfeedings and fat content of breast milk throughout the day. Pediatrics. 2006;117(3):e387–95. doi:10.1542/peds.2005-1417.
- Ding Z, Xu Y. Lactic acid is absorbed from the small intestine of sheep. J Exp Zool A Comp Exp Biol. 2003;295(1):29–36. doi:10.1002/jez.a.10212.
- Serena A, Jørgensen H, Bach Knudsen KE. The absorption of lactic acid is more synchronized with the absorption of glucose than with the absorption of short-chain fatty acids — a study with sows fed diets varying in dietary fibre. Livest Sci. 2007;109(1–3):118–121. doi:10.1016/j.livsci.2007.01.107.
- Velázquez OC, Lederer HM, Rombeau JL. Butyrate and the colonocyte. Production, absorption, metabolism, and therapeutic implications. Adv Exp Med Biol. 1997;427:123–134.
- Liang N, Neužil-Bunešová V, Tejnecký V, Gänzle M, Schwab C. 3-Hydroxypropionic acid contributes to the antibacterial activity of glycerol metabolism by the food microbe Limosilactobacillus reuteri. Food Microbiol. 2021 Sep;98:103720. doi:10.1016/j.fm.2020.103720.
- Sundekilde UK, Downey E, O’Mahony JA, O’Shea CA, Ryan CA, Kelly AL, Bertram HC. The effect of gestational and lactational age on the human milk metabolome. Nutrients. 2016;8(5):304. doi:10.3390/nu8050304.
Appendix
Thomas Bieber1,2; Peter Schmid-Grendelmeier1,3; Claudia Traidl-Hoffmann1,4,5; Marie-Charlotte Brüggen1,3,6,7; Claudio Rhyner1,2,8
1Christine Kühne-Center for Allergy Research and Education Davos (CK-CARE), Davos, Switzerland
2Davos Biosciences, Davos, Switzerland
3Allergy Unit, Department of Dermatology, University Hospital of Zürich, Zürich, Switzerland
4Environmental Medicine, Faculty of Medicine, University of Augsburg, Augsburg, Germany
5Institute of Environmental Medicine, Helmholtz Zentrum Muenchen, German Research Center for Environmental Health, Augsburg, Germany
6Hochgebirgsklinik Davos, Davos, Switzerland
7Faculty of Medicine, University of Zürich, Zürich, Switzerland
8Swiss Institute of Allergy and Asthma Research (SIAF), Davos, Switzerland