
ABSTRACT
Early life gut microbiome composition has been correlated with childhood obesity, though microbial functional contributions to disease origins remain unclear. Here, using an infant birth cohort (n = 349) we identify a distinct fecal microbiota composition in 1-month-old infants with the lowest rate of exclusive breastfeeding, that relates with higher relative risk for obesity and overweight phenotypes at two years. Higher-risk infant fecal microbiomes exhibited accelerated taxonomic and functional maturation and broad-ranging metabolic reprogramming, including reduced concentrations of neuro-endocrine signals. In vitro, exposure of enterocytes to fecal extracts from higher-risk infants led to upregulation of genes associated with obesity and with expansion of nutrient sensing enteroendocrine progenitor cells. Fecal extracts from higher-risk infants also promoted enterocyte barrier dysfunction. These data implicate dysregulation of infant microbiome functional development, and more specifically promotion of enteroendocrine signaling and epithelial barrier impairment in the early-life developmental origins of childhood obesity.
Introduction
One in three children in the United States experience overweight or obesity [defined as body mass index (BMI) ≥85th percentile for age and sex] and, as a result, are at increased risk of co-morbidities including heart and fatty liver disease, diabetes, and asthma.Citation1 In adults, gut microbiome perturbation is characteristic of patients with obesityCitation2–5 and its functional contribution to disease pathogenesis has been confirmed in humanized gnotobiotic mouse models.Citation6,Citation7 Several murine and human studies have correlated early-life gut microbiota perturbation with subsequent adiposity during adolescence and adulthood.Citation8–13 However, none have provided data for a functional role of the human infant gut microbiome in the subsequent development of childhood obesity or identified infant microbiomes features that promote obesogenic responses.
Early-life gut microbiome development progresses along a temporal gradient.Citation14–16 Alterations to the composition and rate of microbial accumulation during this critical developmental window are related to risk of childhood conditions that impact body size, including impaired growthCitation13,Citation17 and Kwashiorkor (protein malnutrition).Citation18–20 Diet plays a significant role in shaping the gut microbiome,Citation19 which in turn influences the metabolic fate of ingested nutritional substrates and the production of bioactive molecules that influence host cell physiology.Citation20–23 Mode of delivery and nutrition in infancy have been associated with alterations to the infant gut microbiome and with obesity in childhood,Citation24,Citation25 though the mechanisms by which they contribute to disease remain unclear. Here, to better understand the origins of childhood obesity, we focus on very-early infancy and identify a compositionally and functionally precocious fecal microbiome at one month of age associated with correlates of lower socioeconomic status, decreased rates of exclusive breastfeeding and with heightened risk for overweight or obese phenotypes (OW/OB) in early childhood. We provide evidence for how the infant fecal microbiome may functionally contribute to childhood obesity, including promoting expansion of nutrient sensing enteroendocrine progenitor cells, induction of enterocyte transcriptional programs characteristic of obesity and increasing epithelial barrier dysfunction. Thus, our data suggest that early-life nutrition and appropriately paced microbiota functional and metabolic development appear crucial determinants of childhood obesity development.
Results
Distinct infant fecal microbiota associates with OW/OB at age two years
Fecal samples collected in early postnatal life (n = 349; median age 35 days; range 21–58 days) were subjected to parallel 16S rRNA and ITS2 sequencing. Breastfeeding, delivery mode, parity, maternal BMI and smoke exposure during pregnancy and various factors reflective of parental socioeconomic status explained a significant proportion of the variance observed in the fecal microbiota profiles across infants (PERMANOVA, pall <0.05; Supplementary Table S1). Dirichlet Multinomial Mixture (DMM) modeling, which implements an unsupervised Bayesian approach to class discovery,Citation26 was applied to the 16S rRNA dataset to classify participants based on fecal bacterial community composition. Three distinct gut microbiota classes [GMC1 (n = 141/349), GMC2 (n = 130/349), and GMC3 (n = 78/349)] represented the best model fit (Unweighted UniFrac; PERMANOVA; R2 = 0.11; p = 1e−4; and Supplemental Figure S1a). Notably, GMC3 infants were more likely to have unmarried mothers with a shorter duration of formal education and to have been exclusively formula fed, while GMC1 infants had the greatest proportion of exclusively breastfed infants (Supplementary Table S2). BMI Z-scores of GMC3 infants were greater than either GMC1 (β = 0.51; 95% CI 0.17–0.85; p = 0.004; and Supplementary Table S3a) or GMC2 groups (β = 0.45; 95% CI 0.11–0.79; p = 0.010; and Supplementary Table S3a) after adjusting for variables known to be related to both microbiome composition and obesity (i.e. age at stool sample collection, maternal BMI at first measure during pregnancy, prenatal antibiotic use, prenatal antifungal use, mode of delivery, and breastfeeding status at 1-month) and which resulted in a change-in-effect estimate of the GMC and body size association (Supplementary Table S3a and Supplemental Figure S1b-c). Relative risk (RR) for OW/OB at age two was also greater for GMC3 compared with GMC1 infants (Adjusted Multivariable Model; RR = 2.52; 95% CI 1.33–4.79; p = 0.005; Supplementary Table S3b and ). This represented an 8% increase in risk over the unadjusted RR (Supplementary Table S3b), indicating that the observed relationship between the infant fecal microbiota and childhood OW/OB persists and is in fact strengthened when factors known to be related to these outcomes are adjusted for in statistical models.
Figure 1. Compositionally distinct gut microbiota classes (GMCs) in feces of 1-month-old infants exhibit differential microbiota maturity and relate to the relative risk (RR) of overweight/obesity (OW/OB) at age 2 years.
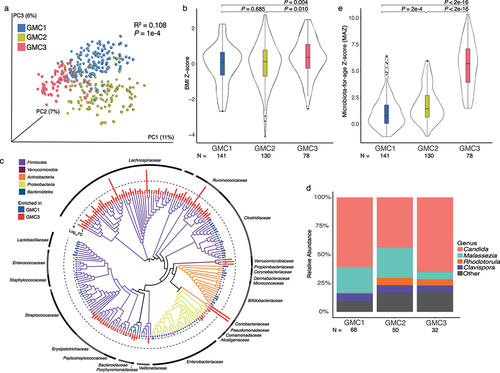
Table 1. Infant gut microbiota classes (GMCs) exhibit significantly different relative risk ratios (RRs) of developing OW/OB phenotypes at age 2 years.
DMM modeling applied to older infant samples (median age 206 days; range 174–238 days; n = 287) identified four distinct fecal microbiota structures (GMC4–7; Unweighted UniFrac; PERMANOVA, R2 = 0.15, p = 0.001; Supplemental Figure S1d-e), however these were not significantly related to BMI Z-score or OW/OB phenotypes at age two years (Supplementary Table S4a-b). This may be due to reduced power to detect such associations attributable to increased microbiota compositional variation associated with environmental exposures, breastfeeding cessation and dietary diversification at this later life stage.Citation15,Citation27
Infants at higher risk for OW/OB exhibit precocious fecal microbial development
Despite exhibiting increased bacterial species richness (p < 2e-16, Supplemental Figure S1f) and phylogenetic diversity (p < 2e-16, Supplemental Figure S1g) compared with GMC1 or GMC2 microbiota, GMC3 communities were depleted of key genera (e.g. Bifidobacterium, Clostridium and Malassezia) typical of this stage of postnatal developmentCitation14,Citation28 ( and Supplemental Figure S2a-b and Supplementary Tables S5 and S6). Instead, they exhibited relative enrichment of Lachnospiraceae (including Blautia, Ruminococcus and Dorea), Ruminococcaceae (including Oscillospira and Faecalibacterium) and Saccharomyces and Candida ( and Supplementary Tables S5 and S6), genera typically associated with later stages of infant gut microbiome developmentCitation14,Citation28 (Supplemental Figure S2a-b) and, in adult populations, with greater visceral fat massCitation4,Citation29,Citation30 and insulin resistance.Citation4 These microbial enrichments were consistent irrespective of the lower-risk comparison group used (Supplementary Tables S7 and S8) and included several age-discriminatory bacterial taxa identified through random forest predictive modeling of healthy infants (Supplemental Figure S2c-e) that are associated with more mature infant gut microbiomes.Citation14,Citation31 Consistent with this observation, GMC3 infants exhibited older microbiota-for-age z-scores [Microbiota-for-age Z-score (MAZ); p < 2e-16; ], indicating precocious early life intestinal microbiota development in infants at higher-risk for OW/OB in early childhood.
Higher-risk GMC3 infant microbiomes exhibit broad metabolic and functional reprogramming
To determine whether the compositionally distinct GMC3 fecal microbiota associated with increased OB/OW risk produced a distinct suite of metabolites from that of their lower risk counterparts, untargeted mass spectrometry was performed on a subset of infant feces (n = 60) chosen based on highest posterior probability of GMC1 or 3 membership (P > 0.90) and a balanced distribution of BMI classifications (i.e. per GMC, approximately equal numbers of infants who developed normal BMI and OW/OB phenotypes at age two years; Supplementary Table S9). Comparative analyses evidenced distinct metabolic productivity between lower- and higher-risk GMCs ( and Supplementary Table S10), particularly within the lipid (short and medium chain fatty acid, secondary bile acid and glycerophospholipid classes), amino acid (aromatic and branched chain) and vitamin and co-factor (B and E vitamins and biotin) classes of metabolites. In several cases, these metabolic differentials were corroborated by analysis of targeted pathways in paired shotgun metagenomic data derived from the same fecal samples, indicating that several of the metabolites associated with childhood obesity risk are most likely microbially derived products. GMC3 feces were enriched both for glycerol 3-phosphate (PFDR = 0.05; and Supplemental Figure S3a), a metabolite involved in glycolysis and mitochondrial oxidative phosphorylation, and for the microbial glycerol degradation pathway responsible for its production (P = 0.003; , Supplemental Figure S4a). GMC1 feces were enriched for lactate and pyruvate (PFDR = 0.047 and PFDR = 0.029 respectively; and Supplemental Figure S3b-c), products of the methylglyoxal detoxification pathway which was also found to be significantly enriched in paired fecal metagenomes of GMC1 infants (P = 0.005; and Supplemental Figure S4b). In addition, the significant depletion of pyruvate observed in GMC3 feces was paralleled by an increase in abundance of microbial encoded pathways for pyruvate fermentation (P = 0.003 for both; Supplemental Figure S4c-d), though products of these pathways were not observed in our liquid chromatography mass spectrometry data, plausibly due to their volatility.
Figure 2. High-risk GMC3 and lower-risk GMC1 exhibit distinct metabolic productivity and functional capacities.
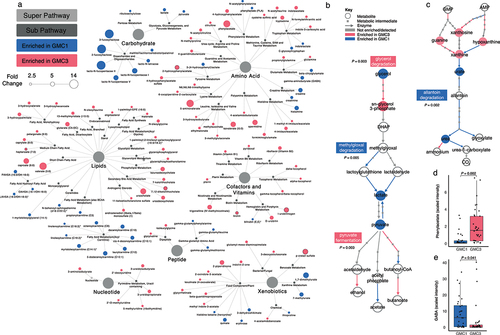
Lower-risk GMC1 fecal metabolomes exhibited significantly elevated concentrations of human milk oligosaccharides (2-fucosyllactose, 3-fucosyllactose, lacto-N-fucopentaose and lacto-N-tetraose; and Supplementary Table S10). GMC1 was also enriched in a large range of distinct lipids, including fatty acid esters of hydroxy fatty acids (FAHFAs) and acylcarnitines ( and Supplementary Table S10), the latter indicative of enhanced capacity for mitochondrial fatty acid β-oxidation. While GMC1 exhibited relatively higher concentrations of bilirubin (PFDR = 0.021; Supplemental Figure S3d), GMC3 was enriched for the microbially reduced heme catabolic product, urobilinogen (PFDR = 0.011; Supplemental Figure S3e), which is associated with obesityCitation32 and older age.Citation33
Higher-risk GMC3 feces exhibited significantly increased concentrations of several vitamin and amino acid derivatives ( and Supplementary Table S10) despite being depleted of microbial pathways responsible for their production (≤P = 0.01 for all; Supplemental Figure S4e-h), and for the metabolism of allantoin (P = 0.002; and Supplemental Figure S4i) which recycles nitrogen necessary for their synthesis. Such dichotomy may reflect a dietary surplus of these vitamin and amino acids in higher-risk infants who were more likely to be formula fed. GMC3 feces were highly enriched for a range of catabolic amino acid by-products (), including phenylacetate (PFDR = 0.002; ) which is known to trigger hepatic steatosis,Citation34 and modulators of GABAergic signaling, such as the gamma-aminobutyrate acid (GABA) precursor glutamine (PFDR = 0.006; Supplemental Figure S3f) and weak GABA agonist 5-aminovalerate (PFDR = 0.024; Supplemental Figure S3g). Notably, GABA, which regulates neuro-endocrine body weight control,Citation35,Citation36 obesity-induced inflammation,Citation37 insulin sensitivityCitation37 and intestinal epithelial barrier integrity,Citation38,Citation39 was depleted in the feces of higher-risk GMC3 infants (PFDR = 0.041; ). These latter observations implicate altered enteroendocrine signaling in higher-risk for obesity infants.
Cell-free products of higher-risk infant fecal microbiomes promote transcriptional and functional reprogramming of enterocytes and reduce intestinal barrier integrity
The intestinal epithelium regulates nutrient uptake, inflammation, and intestinal barrier integrity and is constantly exposed to diffusible small molecules secreted by the fecal microbiome. Hence, we examined the effect of cell-free fecal microbiome products of metabolically profiled GMC3 and GMC1 infants (n = 17 samples with sufficient feces remaining for assay) on the transcriptional response and differentiation of Caco-2 enterocytes in the presence of oleic acid, the most abundant unsaturated fatty acid found in human and formula milk.Citation40 Variance in enterocyte transcriptional response associated with GMC (Euclidean; PERMANOVA; R2 = 0.18; p = 0.005; Supplemental Figure S5a) and OW/OB status (Euclidean; PERMANOVA; R2 = 0.12, p = 0.046; Supplemental Figure S5b) and was greatest between the extremes of microbiome and obesity status [i.e. GMC3 OW/OB (n = 7) and GMC1 Normal BMI (n = 4); Supplemental Figure S5c]. This latter comparison produced starkly different transcriptional programs (Euclidean; PERMANOVA; R2 = 0.33, p = 0.003; and Supplementary Table S11). To assess potential cell types involved in these responses we applied gene set enrichment analysis, and found genes associated with enteroendocrine progenitors to be enriched in enterocytes treated with GMC3 OW/OB extracts (PFDR = 0.05; ). This is consistent with our observation that GMC3 microbiomes were enriched in metabolic products with the potential to alter enteroendocrine function and is further supported by the observation that PCSK1N, which controls neuroendocrine peptide precursor proteolysis,Citation41 was also upregulated in this context (). Genes associated with mucin-producing goblet cells were enriched in enterocytes treated with fecal extracts from GMC1 infants who had normal BMIs at age two (PFDR = 0.04, ), indicating that microbiome-induced gastrointestinal mucus production, a critical physical and biochemical barrier, may play a protective role against childhood obesity development. GMC3 OW/OB fecal extracts also increased enterocyte expression of genes regulating inflammation (ALOX5, TNFSF9, CCL20, CCL22; ), cell proliferation (LGALS1, WNT1; ) and long-chain fatty acid transport (SLC27A1, ACSL1, ACSL3, ACSL4; and Supplemental Figure S5d), as well as those regulating vesicle maturation, transport and exocytosis (KIF5C, LGI3, TMEM59L; ). In parallel, decreased expression of genes regulating barrier function (GJB7, CLDN2; ), cellular organization (BFSP1, LAMA1; ), fatty acid oxidation (Supplemental Figure S5d) and mitochondrial oxidative phosphorylation (Supplemental Figure S5e) were also observed. These data implicate the metabolic products of GMC3 infant fecal microbiomes in the induction of altered programs of enterocyte lipid trafficking and metabolism and in the promotion of diminished epithelial barrier integrity.
Figure 3. Cell-free fecal products from GMC3 infant microbiomes who developed OW/OB phenotypes in childhood reprogram Caco-2 enterocyte transcription.
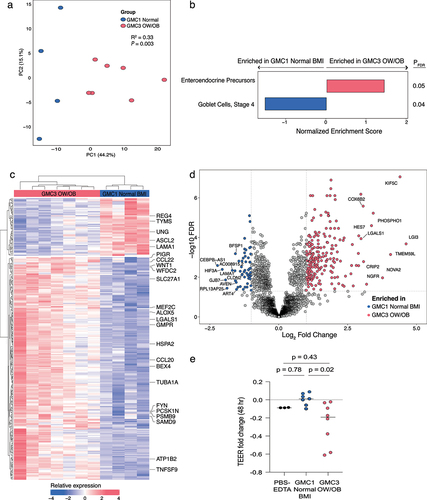
To validate these observations, we next tested the effect of GMC1 or GMC3 luminal products on epithelial barrier integrity. Polarized Caco-2 cell trans-well cultures were exposed to cell-free fecal extracts and transepithelial electrical resistance (TEER) was assessed pre- and post-exposure, using a subset of samples (n = 15) that had also undergone untargeted metabolomic analysis. Compared to cell-free products from GMC1 infants who developed normal BMIs, GMC3 OW/OB extracts were associated with reduced barrier integrity, a phenotype that was evident at 24 hours (p = 0.093; Supplemental Figure S6a) and significantly exacerbated by 48 hours post-exposure (p = 0.02; ). Since increased intestinal permeability is often accompanied by inflammation in the context of obesity, we also assessed whether cell-free fecal products induced inflammatory cytokine secretion by Caco-2 cells. IL-1β, IL-8, and CCL20 are among the few cytokines produced by enterocytes in the absence of crosstalk from immune cells.Citation42 ELISA-based quantification of these cytokines in basolateral supernatants resulted in minimal or no detection in any experimental group (Supplemental Figure S6b-d), suggesting that epithelial cross-talk with immune or microbial cells may be necessary to induce inflammatory responses associated with increased obesity risk.
To identify potential mediators of microbiome-derived epithelial permeability, we assessed associations between TEER values and microbiota composition and metabolic profiles. Fecal bacterial composition significantly related to TEER values (Bray-Curtis; PERMANOVA; R2 = 0.14, p = 0.02; Supplemental Figure S6e). To identify specific bacteria implicated in regulation of epithelial integrity, fixed effects models of taxon relative abundance were generated for samples used in the TEER assay. This analysis identified Lactobacillaceae, Staphylococcaceae, Bacteroidaceae, Bifidobacteriaceae, and Clostridiaceae to be associated with increased epithelial integrity while members of Enterobacteriaceae and Streptococcaceae related to increased barrier permeability (PFDR < 0.05 for all; Supplemental Figure S6f). Although variance in fecal metabolomes did not correlate with epithelial hyperpermeability (Euclidean; PERMANOVA; R2 = 0.84, p = 0.21), several individual metabolites were associated with TEER values (Spearman correlation; PFDR < 0.06, Supplemental Figure S6g). Specifically, 2-piperidinone was associated with decreased epithelial integrity, while acyl carnitines, hydroxyhippurate, creatine and agmatine correlated with improved intestinal barrier integrity.
Discussion
Early-life microbiome development is the product of evolutionary selection and dynamic functional synergy with the human host in the context of environmental exposures. Emerging evidence indicates that alterations to the rate of intestinal microbiome development disrupts the chronological synchrony of microbial-host interactions, impacting microbiome assembly, productivity and early-life developmental programming, resulting in childhood disease.Citation17,Citation18,Citation43,Citation44 Previously, a Canadian birth cohort uncovered an association between 3-month-old gut microbiota composition and risk of OW/OB at 12-months of age.Citation10 Additional studiesCitation13,Citation45–51 have similarly examined the relationship between the early life microbiota and future risk of obesity, and our findings largely agree with previous investigations. For example, Collinsella, Parabacteroides and members of the Ruminococcaceae family, which are enriched in infants at greater risk of childhood OW/OB in our study, have been similarly associated with rapid infant growth.Citation48 Although fungal abundance in the gut at one year of age has been inversely correlated with reduced BMI and increased height in Norwegian children,Citation52 the role of fungi in early life on subsequent childhood growth and OW/OB outcomes remains poorly understood. To our knowledge, our study is the first to identify fungal biomarkers in early infancy, including depletions in Malassezia and an enrichment in Rhodotorula, which are correlated with increased childhood OW/OB risk and that are distinct from fungi associated with obesity in human adults.Citation53 Further mechanistic studies will help elucidate whether such fungal differences in early life contribute to the altered growth trajectories.
Our findings indicate that accelerated gut microbiome functional and metabolic maturation evident at one month of age increases risk of OW/OB phenotypes at age two years, suggesting that interventions in very early-life may be necessary to alter disease course. Factors associated with higher-risk gut microbiomes at 1-month of age in our United States-based cohort included several correlates of lower socioeconomic status, including single parents with a shorter duration of formal education and reduced breastfeeding rates, which have previously been associated with childhood obesityCitation54,Citation55 and with structural racism.Citation56,Citation57 Thus, strategies including support for breastfeeding and addressing social inequities due to structural racism, a fundamental determinant of health,Citation58 could decrease the prevalence of childhood obesity.
Pre- and post-natal exposures, including postnatal nutrition play a key role in shaping both host-mediated metabolism and infant intestinal microbiome functional capacity and metabolic productivity.Citation14,Citation15,Citation20,Citation59 Human milk is a complex, dynamic functional food that varies across individuals and with length of lactation to support nutritional requirements throughout infancy.Citation60 Bioactives in breast milk, such as lactoferrin and immunoglobulin-A, regulate early-life microbial colonization in the gastrointestinal tractCitation61,Citation62 while nutritional substrates further select for co-evolved microbes capable of their metabolism.Citation63 In contrast, infant formula primarily provides nutritional substrates, thus failing to exert the same chronologically programmed selective pressures as breast milk on the developing microbiome. Interestingly, the relationship between the infant fecal microbiota and childhood obesity and overweight phenotypes persisted despite adjustment for a number of biologically relevant factors, including infant age and breastfeeding status. This indicates that while formula feeding associates with increased risk of childhood obesity, accelerated microbiome development in the infant intestine appears to represent an independent early-life marker of childhood obesity risk. This may be due to additional intrinsic factors recently associated with childhood disease development such as heritable microbesCitation64 and/or early life epigenetic training of immune functionCitation65 that promote accelerated microbial accumulation trajectories.
Broad metabolic differences between higher- and lower-risk for obesity infant microbiomes were evident and supported by parallel changes in gene content, indicating that multiple parallel microbial mechanisms may contribute to childhood obesity risk. Notable differences in microbial strategies for energy harvest were evident in lower- and higher-risk infants. Nutrient excess is known to promote mitochondrial dysfunction, leading to obesity-related pathologies.Citation66 Numerous alternative microbial strategies for energy harvest were observed in lower-risk infants who were more likely to have been breastfed. This suggests that breastmilk-mediated enrichment of diverse microbial nutrient utilization pathways in the nascent gut microbiome may protect against childhood obesity by regulating host access to nutritional substrates. Failure to develop such microbial nutrient utilization strategies in infancy could conceivably lead to energy disequilibrium in the intestine and long-term host exposure to excess nutrient availability, thus increasing obesity risk. Importantly, given the transition from a milk-based to solid food diet during the first two years of life, it is plausible that unhealthy eating habits during the introduction of complementary foods conflate microbiome-mediated risks for childhood adiposity.
The feces of higher-risk infants were relatively depleted of GABA, which regulates neuro-endocrine mediated body weight control,Citation35,Citation36 intestinal barrier integrity,Citation38,Citation39 and is produced by lactic acid bacteria,Citation67 implicating altered neuro-endocrine signaling in higher-risk infants. Though somewhat limited by sample size, our in vitro studies found that the cell-free fecal products of high-risk infants induced expression of genes and pathways associated with enteroendocrine progenitor cells, including PCSK1N which regulates proteolytic cleavage of neuroendocrine peptide precursors.Citation41 Nutrient sensing enteroendocrine cells regulate macronutrient absorption and produce hormones that control energy homeostasis, appetite, satiety, post-prandial glucose levels, systemic metabolism and body weight.Citation68,Citation69 Thus, the cell-free products associated with higher-risk fecal microbiomes, which may include nutritional substrates in various stages of digestion, induce enteroendocrine cell progenitors that may contribute to childhood obesity by increasing host capacity for early-life macronutrient intake and harvest.
More broadly, enterocytes exposed to cell-free products of higher-risk fecal microbiomes, which can include variably digested nutritional substrates and microbiome-derived metabolites, were characterized by transcriptional reprogramming of genes involved in inflammation, lipid handling, fatty acid oxidation, and reduced barrier function – all previously described gastrointestinal features of patients with diagnosed obesity.Citation70–74 Our data also found evidence that the cell-free products of the higher-risk infant fecal microbiome reduced intestinal epithelial barrier function. Intestinal hyperpermeability is central to the pathology of obesity and is associated with increased microbial product translocation, visceral adiposity, insulin resistance and chronic low-grade inflammation in adult disease.Citation75–77 More recently, viable microbial translocation to mesenteric adipose via epithelial barrier breach was shown to promote expansion of mesenteric adipose tissue around inflamed intestines in humans.Citation78 Our functional confirmation that cell-free products of the high-risk infant fecal microbiome promoted enterocyte hyperpermeability supports both a pathologic role and an additional mechanism by which the higher-risk infant fecal microbiomes may contribute to childhood obesity development.
Notably, key early-life gut microbial colonizers synonymous with breastfeeding i.e. Lactobacillaceae, Bacteroidaceae and Bifidobacteriaceae, and associated metabolic products such as agmatineCitation79, correlated with improved intestinal barrier integrity in vitro and reduced risk of obesity development. Very recent studies have demonstrated that a multi-strain Lactobacillus cocktail improves intestinal barrier dysfunction and blood glucose levels in obese db/db miceCitation80 and that the Lactobacillus-derived metabolite phenyllactic acid protects against diet-induced obesity in young mice fed a high fat diet.Citation81 However, since nutrition, gut microbiome activity, and intestinal barrier integrity collectively contribute to childhood obesity development, further studies delineating their dynamic interactions along an early-life developmental gradient coupled with obesity outcomes measured at later stages of life are necessary to fully elucidate the generalizability of such observations to human populations.
Our study is not without limitations, which include insufficient granularity on factors such as complementary feeding practices and physical activity that contribute to OW/OB outcomes. Given the dynamics of early life gut microbiome development, future studies with more complete data on diet, feeding habits, and physical activity should further examine these relationships into later stages of infancy. The current study focused on the 1-month fecal microbiome and the functional implications of their associated metabolites in a subset of samples due to cost and sample availability, which reduced power in the multi-omic analyses and enterocyte assays and excluded the ability to detect key longitudinal shifts requiring longitudinal multi-omic datasets. Nonetheless, evidence from our current study supports the need for future studies with high resolution and quality stool sample collection over the course of infancy and early childhood.
Our findings implicate very early-life fecal microbiome dysfunction in the developmental origins of childhood obesity development and uncover key exposures associated with lower socioeconomic status and early life nutrition that co-associate with disease development. Functional infant microbiome analyses coupled with in vitro assays provide evidence that multiple microbial mechanisms involving nutrient harvest, altered enteroendocrine signaling and epithelial barrier impairment underlie increased risk of disease in childhood. Thus, early-life approaches to foster appropriately paced microbiome development and metabolism may help prevent obesity development in later childhood.
Materials and Methods
Study population, subsample criteria of subjects for stool microbiome analysis and OW/OB definition
The Wayne County Health, Environment, Allergy and Asthma Longitudinal Study (WHEALS) is a United States birth cohort that recruited pregnant individuals (n = 1258) aged 21–49 years between August 2003 and November 2007.Citation82 Persons were considered to be eligible if they lived in a predefined cluster of contiguous zip codes in Wayne County, Michigan (including the city of Detroit), had no intention of moving out of the area in the subsequent two years and provided informed written consent. For this study, we selected WHEALS children who had a stool sample collected during a 1- and/or 6-month home visit and had completed their 24-month clinic visit with height and weight measurements (n = 543 subjects; n = 756 samples). Targeted ages at stool sample collection were 1 and 6 months of age, though actual ages ranged from 1 to 11 months. Infant stool was collected by field staff during the 1- and 6-month home visits and transported promptly back to the lab on ice to slow down metabolic processes before storage at − 80°C. Banked samples were shipped to the University of California, San Francisco (UCSF) on dry ice, where they were also stored at − 80°C until processed. At the study’s 2-year clinic visit, trained field staff measured child height and weight. Overweight or obesity (OW/OB) at age 2 years was defined using the 2000 age and sex adjusted CDC growth chartsCitation83 as BMI at or above the 85th percentile and normal BMI as BMI between the 5th to < 85th percentile.
Since age strongly influences microbiome composition during early-life, DMM modeling was only applied to samples that were collected within a standard deviation of the mean collection age for each home visit to control for age-specific microbiome differences. Samples were stratified by time of sample collection (n = 403, 1-month; n = 353, 6-month). In the DMM analytical dataset, stool specimens from the 1-month visit were collected at a mean ±1 standard deviation (SD) of 39 ± 19 days (n = 349, median age 35 days; range 21–58 days) and stool specimens from the 6-month visit were collected at a mean ±1 SD of 205 ± 33 days (n = 287, median age 206 days; range 174–238 days).
DNA extraction
Fecal DNA was extracted from stool samples using the modified cetyltrimethylammonium bromide (CTAB) method previously used for fungal and bacterial biomarker sequence-based profiling.Citation28,Citation84 Briefly, 500 µl modified CTAB extraction buffer was added to 25 mg of stool in a 2 ml Lysing Matrix E tube (MP Biomedicals) prior to incubation at 65°C for 15 min. Samples were bead-beaten (5.5 m/s, 30 sec) in a Fastprep-24 (MP Biomedicals) and then centrifuged (16000 × g, 5 min) before the top aqueous phase was transferred to a 2 ml polypropylene 96-well plate (USA Scientific). A further 500 µl modified CTAB extraction buffer was added to each LME tube, similarly bead-beaten and centrifuged to collect a total of 1 ml aqueous phase per sample. After adding 1 ml of phenol:chloroform:isoamyl alcohol (25:24:1) to the collected aqueous supernatant, samples were centrifuged (3200 × g, 20 min, 4°C) and the resulting top aqueous phase was transferred to a new 2 ml polypropylene 96-well plate (USA Scientific). Polyethylene glycol/NaCl (2 v/v) was added to the collected aqueous supernatant and incubated at room temperature for 2 h. Samples were then centrifuged (3200 × g, 60 min, 4°C), washed with ice cold 70% EtOH and resuspended in 30 μl of TE buffer (Invitrogen).
PCR conditions and library preparation for bacterial and fungal biomarker sequencing
The V4 region of the 16S rRNA bacterial gene was amplified using primers designed by Caporaso et al Citation85 PCR was performed in 25 μl reactions using 0.025 U Takara Hot Start ExTaq (Takara Mirus Bio Inc.), 1× Takara buffer with MgCl2, 0.4 pmol/μl of F515 and R806 primers, 0.56 mg/ml of bovine serum albumin (BSA; Roche Applied Science), 200 μM of dNTPs and 10 ng of gDNA. Reactions were performed in triplicate with the following: initial denaturation (98°C, 2 min), 30 cycles of 98°C (20 s), annealing at 50°C (30 s), extension at 72°C (45 s) and final extension at 72°C (10 min). Amplicons from technical triplicates were pooled and verified using a 2% TBE agarose e-gel (Life Technologies), cleaned up and normalized using SequalPrep Normalization Plates (Applied Biosystems), and quantified using the Qubit dsDNA HS Assay Kit (Invitrogen). Samples were pooled in equal moles (5 ng), purified using AMPure SPRI beads (Beckman Coulter), quantified using KAPA SYBR (KAPA Biosystems), denatured, and diluted to 2 nM, and 5 pmol was loaded onto the Illumina Nextseq cartridge with 40% (v/v) of denatured 12.5 pM PhiX spike-in control.
The internal transcribed spacer region 2 (ITS2) of the fungal rRNA gene was amplified using the primer pair fITS7 (5’- GTGAATCATCGAATCTTTG-3’) and ITS4 (5’-TCCTCCGCTTATTGATATGC-3’).Citation85 PCR was performed in triplicate in 25 µl reactions with 1× Takara buffer (Takara Mirus Bio), 200 nM of each primer, 200 µM dNTPs, 2.75 mM of MgCl2, 0.56 mg ml−1 of BSA (Roche Applied Science), 0.025 U Takara Hot Start ExTaq and 50 ng of gDNA. Reactions were conducted under the following conditions: initial denaturation (94°C for 5 min) followed by 30 cycles of 94°C (30 sec), annealing at 54°C (30 sec), extension at 72°C (30 sec) and a final extension at 72°C (7 min). PCR amplicons were verified, purified, quantified, and pooled as described above for bacterial library preparation. ITS2 PCR was performed on all stool samples, which produced ITS2 amplicons in n = 186 1-month and n = 180 6-month samples; samples without fungal data had no detectable ITS2 amplicons. The amplicon library was purified, quantified, denatured, and diluted similar to the 16S amplicon library described above. 10 pmol of the ITS2 amplicon library was loaded onto the Illumina MiSeq cartridge with 25% (v/v) of denatured 10 pM PhiX spike-in control.
Biomarker sequence data processing
Paired-end sequences were assembled using FLASH v1.2.7Citation86 requiring a minimum base pair overlap of 25 bp and demultiplexed by barcode using QIIME v1.9.1.Citation87 Quality filtering was performed using USEARCH v8.0.1623Citation88 to remove reads with > 2 expected errors. Quality reads were dereplicated at 100% sequence identity, clustered at 97% sequence identity into operational taxonomic units (OTUs), filtered of chimeric sequences by UCHIME,Citation89 and mapped back to resulting OTUs using UPARSE;Citation90 sequence reads that failed to cluster with a reference sequence were clustered de novo. Taxonomy was assigned to the OTUs using the Greengenes v13_5 database.Citation91 Sequences were aligned using PyNAST,Citation92 and FastTree 2.1.3Citation93 was used to build a phylogenetic tree. Resulting sequence reads were normalized by multiply rarefying to 60,000 reads per sample as described previouslyCitation28 to ensure reduced data were representative of the fuller data for each sample.
Fungal sequences were quality trimmed (Q score, <25) and removed of adaptor sequences using cutadapt.Citation94 Paired-end sequences were assembled, demultiplexed by barcode, clustered into OTUs at 97% identity and filtered of chimeras using similar methods as described for 16S amplicons. Taxonomy was assigned using UNITE v7.0.Citation95 Resulting sequence reads were normalized by multiply rarefying to 1,000 reads per sample to ensure reduced data were representative of the fuller data for each sample.
Prediction of microbiota age using random forests
Random forest models were used to regress the relative abundances of all 16S rRNA-derived bacterial OTUs in infant stool samples against their chronological age using randomForest in R as previously described.Citation31 Default parameters were used with the following exceptions: ntree = 10,000, importance = TRUE. Tenfold cross-validation was performed using the rfcv function over 100 iterations to estimate the minimum number of features needed to accurately predict microbiota age. The features most important for prediction were identified over 100 iterations of the importance function, and a sparse model consisting of the 50 most important features was constructed and trained on a set of n = 255 normal BMI infants (n = 356 fecal samples) randomly selected from the larger normal BMI infant set (including 50% of normal BMI GMC1 infants [n = 54]). This model was validated in the remaining n = 54 normal BMI GMC1 infants, and then applied to all remaining GMC1–3 infants to predict microbiota age. Microbiota-for-age z-scores (MAZ) was computed as previously described,Citation31 enabling comparisons of microbiota maturity as the metric accounts for differing variance in predicted microbiota age throughout infant development.
Metabolomic profiling
Stool samples selected had the highest posterior probability of GMC membership and sufficient remaining material for paired metabolomic and metagenomic analyses, reflecting representative feeding practices (more exclusively breastfed infants in GMC1; more exclusively formula fed infants in GMC3) and balanced BMI classifications across GMCs. Selected stool samples (200 mg; n = 28 GMC1 (n = 15 Normal, n = 13 OW/OB) and n = 32 GMC3 (n = 15 Normal, n = 17 OW/OB); Supplementary Table S9) were provided to Metabolon (Durham, NC) for Ultrahigh Performance Liquid Chromatography/Tandem Mass Spectrometry (UPLC-MS/MS) and Gas Chromatography-Mass Spectrometry (GC-MS) using their standard protocol (http://www.metabolon.com/). Identified compounds were compared to Metabolon’s in-house library of purified standards, which includes more than 3,300 commercially available compounds.
Metagenomic processing and data analysis
DNA was extracted from stool samples that had been metabolically profiled (Supplementary Table S9) using the modified CTAB methods described above – Extracted DNA was provided to the Vincent J. Coates Genomic Sequencing Laboratory at the California Institute for Quantitative Biosciences for library preparation and 150-bp paired-end sequencing on an Illumina HiSeq 4000 (www.qb3.berkeley.edu/gsl). Only samples with > 50,000 total raw reads were included in the data analysis (n = 43, indicated within parentheses in Supplementary Table S9). The median number of raw reads per sample was 13,541,440 (IQR 6,300,000). The median number of reads following Q15 quality trimming and filtering human DNA using Bbduk v38.73 (https://sourceforge.net/projects/bbmap/) was 13,367,212 (IQR 2,073,330). All analyses were performed on trimmed and filtered reads. HUMAnN2 v2.8.1Citation96 was used to identify genes, level4ECs and functional MetaCyc pathways from the short-reads, and to normalize outputs into copies per million (CPM). MetaCyc pathways were aggregated into functional families as previously described.Citation20 Zero-inflated compound Poisson regression (MaAsLin2Citation97 package) was used to determine pathways that differed in relative abundance between GMCs. Significantly different pathways (P < 0.05) with corroborating metabolomic data were visualized using BioCyc’s Pathway Collage and overlaid with log2 FC paired level4EC and metabolite (see Metabolomic profiling) values.
Caco-2 enterocyte RNA sequencing and data analysis
Fecal samples from 4 GMC1 Normal BMI, 1 GMC1 OW/OB, 5 GMC3 Normal BMI and 7 GMC3 OW/OB infants (biological replicates) that had undergone metagenomic and metabolic profiling were used to prepare cell-free fecal products; excluded samples from these groups had insufficient material. Stool samples were homogenized 1 g/ml in pre-warmed phosphate-buffered saline (PBS) containing 20% fetal bovine serum (FBS). Samples were vortexed, incubated (37°C, 10 min) and centrifuged (14,000 rpm, 30 min). Supernatant was filtered through a 0.2 μm filter before being used to treat Caco-2 enterocytes, which have previously been used as a model to study infant enterocyte function.Citation98,Citation99
RNA was extracted from Caco-2 enterocytes treated with 5% v/v cell-free fecal products using the RNAqueous kit (ThermoFisher) and quantified using Qubit RNA HS assay (ThermoFisher). Extracted RNA was sent to the Vincent J. Coates Genomic Sequencing Laboratory at the California Institute for Quantitative Biosciences for library preparation and 150-bp paired-end sequencing on an Illumina NovaSeq 6000 (www.qb3.berkeley.edu/gsl). Demultiplexed paired-end reads were quality filtered and Q20 trimmed, removed of PCR duplicates and Illumina adapters using HTStream (https://github.com/s4hts/HTStream) and aligned to the human genome (Hg38 release) using STAR Citation100 with ENCODE recommended parameters.Citation101 Features were assigned to transcripts using STAR and normalized using DESeq2.Citation102 Differential expression was evaluated using DESeq2 genes with at least 20 reads per gene in respective sample groups using a two-sided FDR. Log2-normalized read counts were obtained from DESeq2 package, genes were filtered for presence in 75% of samples per comparison group, top variable genes were identified by the coefficient of variance and used to calculate principal components of Euclidean distances. Differential gene expression was mapped onto WikiPathways (WP3942 and WP111) using RCy3.Citation103 Gene set enrichment analysis of transcripts associated with intestinal epithelial cell statesCitation104 was performed using default recommended parameters. Gene set enrichment comparisons were controlled for FDR with two sided PFDR ≤ 0.05 results displayed.Citation105,Citation106
Transepithelial electrical resistance (TEER) assays
Caco-2 cells were seeded at 20,000 cells/cm2 on 6.5 mm diameter transwell inserts with 0.4um pores for 18 days. Complete Minimal Essential Media (MEM) was changed every other day to maintain and polarize enterocyte monolayers. At Day 18 post-seeding, baseline TEER measurements were taken prior to cells being treated with serum-free complete MEM containing 5% v/v cell-free fecal extracts or control exposures. TEER measurements were assessed by first removing media in the bottom chamber of the transwell, followed by removal of media in the top chamber. Media was replaced by room temperature PBS (-/- Ca2+, -/-Mg+), and TEER was measured with an EVOM2 epithelial voltohmmeter (World Precision Instruments). TEER measurements were assessed at baseline and following 24 or 48 hours of exposure to fecal extracts using the procedure outlined above.
Statistical analysis
Except where indicated, all analyses were performed using the R statistical programming environment. Faith’s phylogenetic diversity was calculated in QIIME and Student’s or Welch’s t-tests or Wilcoxon tests were calculated in R, depending on the data distribution. Distance matrices based on unweighted and weighted UniFrac,Citation107 Bray-Curtis and Canberra algorithms were calculated in QIIME to assess compositional dissimilarity between samples and were visualized using PCoA plots in R and Emperor,Citation108 PERMANOVA was performed using Vegan:AdonisCitation109 to determine factors that significantly (p < 0.05) explained variation in microbiota and metabolic β-diversity.
Dirichlet Multinomial Mixture (DMM) modeling,Citation26 which uses an unsupervised Bayesian approach to cluster samples, was used to identify clusters of subjects based on bacterial taxon relative abundance. Samples were stratified by time of sample collection (1-month, 6-month; n = 349 or n = 287, respectively), with rarefied counts collapsed at the genus-level to avoid extreme sparsity. The best-fitting DMM model was determined using the Laplace approximation to the negative log model evidence, testing up to 10 underlying microbiota classes. Each sample was assigned to a particular Gut Microbiota Class (GMC) based upon the maximum posterior probability of membership; GMCs were examined for good separation and interpretability.
Hypothesized potential confounders were a priori specified as those potentially being associated with both GMC and childhood obesity, but not within the causal pathway. These variables included maternal marital status, maternal age at birth, maternal BMI first recorded in pregnancy, maternal and paternal education, location of residence, prenatal antibiotic and antifungal use, prenatal household smoke exposure, mode of delivery, gestational age at delivery, birthweight z-score, race-ethnicity of child, breastfeeding status at time of stool sample collection, and age at stool sample collection. Final multivariable models were built by weighing the importance of inclusion based on preconceived hypotheses, examining individually adjusted models to see which variables impacted effect sizes the greatest, and taking into consideration sample size concerns. Unadjusted and adjusted risk ratios (RRs) and corresponding 95% confidence intervals were calculated for OW/OB using log-binomial regression with maximum likelihood estimation, using PROC GENMOD in SAS version 9.4. In cases of model non-convergence, Poisson regression with robust error variance was alternatively used. Linear regression was used to test if BMI Z-scores were significantly different between GMCs; note that BMI Z-scores were normally distributed and model assumptions were evaluated. To determine which OTUs differed in relative abundance between GMCs, unnormalized read counts were transformed using DESeq2Citation110 to identify log-Fold Change (FC) enrichment and corrected for multiple hypothesis testing using BH FDR (PFDR < 0.05). Taxon fold change in relative abundance between GMCs was log10 transformed for illustration on a phylogenetic tree using iTOL v5.6.1. Metabolites exhibiting significantly different (PFDR < 0.05) scaled intensities between GMCs were illustrated using Cytoscape v3.7.2.Citation111
Author contributions
G.J.M.Y. designed the study, performed research, analyzed the data and wrote the manuscript; C.E.P. performed research, analyzed data, and contributed to manuscript writing, A.R.S. and K.E.F. contributed to data analysis and manuscript development; K.M. assisted with data analysis; D.T.N. assisted in performing research; K.J.W. and C.C.J. provided resources. A.C.B. designed and supervised the epidemiology study, provided resources and contributed to manuscript development; S.V.L. designed and supervised the study, contributed to data analysis and wrote the manuscript. A.M.L, D.R.O., A.G.R. and all other authors discussed the results and edited the manuscript.
Supplemental Material
Download MS Word (18 KB)Microbiome_Childhood_Obesity_Figures_20230523_EPS.rar
Download (7.5 MB)MicrobiomeObesity2YO_SupplementaryTables_20230523.xlsx
Download MS Excel (564.8 KB)Acknowledgments
We thank the participants in the WHEALS study. We also thank E. Rackaityte, A.R. Panzer, C. Ha, M. Bacino and X.H. Lim for their thoughtful critique of this manuscript.
Disclosure statement
S.V.L. is a cofounder, consultant and serves on the board of directors of Siolta Therapeutics Inc.
Data availability statement
All raw sequences are deposited in the European Nucleotide Archive (Study PRJEB52295 and PRJEB13896) and in the SRA Bioproject PRJNA648818. All additional datasets and materials are available from the corresponding author upon reasonable request.
Supplementary material
Supplemental data for this article can be accessed online at https://doi.org/10.1080/19490976.2023.2290661
Additional information
Funding
References
- Kumar S, Kelly AS. Review of childhood obesity: from epidemiology, etiology, and comorbidities to clinical assessment and treatment. Mayo Clin Proc. 2017;92(2):251–20. doi:10.1016/j.mayocp.2016.09.017.
- Ley R, Turnbaugh P, Klein S, Gordon J. Microbial ecology: human gut microbes associated with obesity. Nature. 2006;444(7122):1022–1023. doi:10.1038/4441022a.
- Turnbaugh PJ, Hamady M, Yatsunenko T, Cantarel BL, Duncan A, Ley RE, Sogin ML, Jones WJ, Roe BA, Affourtit JP, et al. A core gut microbiome in obese and lean twins. Nature. 2009;457(7228):480–484. doi:10.1038/nature07540.
- Le Chatelier E, Nielsen T, Qin J, Prifti E, Hildebrand F, Falony G, Almeida M, Arumugam M, Batto J-M, Kennedy S, et al. Richness of human gut microbiome correlates with metabolic markers. Nature. 2013;500(7464):541–546. doi:10.1038/nature12506.
- Liu R, Hong J, Xu X, Feng Q, Zhang D, Gu Y, Shi J, Zhao S, Liu W, Wang X, et al. Gut microbiome and serum metabolome alterations in obesity and after weight-loss intervention. Nat Med. 2017;23(7):859–868. doi:10.1038/nm.4358.
- Turnbaugh PJ, Ley RE, Mahowald MA, Magrini V, Mardis ER, Gordon JI. An obesity-associated gut microbiome with increased capacity for energy harvest. Nature. 2006;444(7122):1027–1031. doi:10.1038/nature05414.
- Turnbaugh PJ, Bäckhed F, Fulton L, Gordon JI. Diet-induced obesity is linked to marked but reversible alterations in the mouse distal gut microbiome. Cell Host & Microbe. 2008;3(4):213–223. doi:10.1016/j.chom.2008.02.015.
- Cox LM, Yamanishi S, Sohn J, Alekseyenko A, Leung J, Cho I, Kim S, Li H, Gao Z, Mahana D, et al. Altering the intestinal microbiota during a critical developmental window has lasting metabolic consequences. Cell. 2014;158(4):705–721. doi:10.1016/j.cell.2014.05.052.
- Cho I, Yamanishi S, Cox L, Methé BA, Zavadil J, Li K, Gao Z, Mahana D, Raju K, Teitler I, et al. Antibiotics in early life alter the murine colonic microbiome and adiposity. Nature. 2012;488(7413):621–626. doi:10.1038/nature11400.
- Tun HM, Bridgman SL, Chari R, Field CJ, Guttman DS, Becker AB, Mandhane PJ, Turvey SE, Subbarao P, Sears MR, et al. Roles of birth mode and infant gut microbiota in intergenerational transmission of overweight and obesity from mother to offspring. JAMA Pediatr. 2018;172(4):368–377. doi:10.1001/jamapediatrics.2017.5535.
- Kalliomäki M, Collado MC, Salminen S, Isolauri E. Early differences in fecal microbiota composition in children may predict overweight. Am J Clin Nutr. 2008;87(3):534–538. doi:10.1093/ajcn/87.3.534.
- Luoto R, Kalliomäki M, Laitinen K, Delzenne NM, Cani PD, Salminen S, Isolauri E. Initial dietary and microbiological environments deviate in normal-weight compared to overweight children at 10 years of age. J Pediatr Gastroenterol Nutr. 2011;52(1):90–95. doi:10.1097/MPG.0b013e3181f3457f.
- Dogra S, Sakwinska O, Soh S-E, Ngom-Bru C, Brück WM, Berger B, Brüssow H, Lee YS, Yap F, Chong Y-S, et al. Dynamics of infant gut microbiota are influenced by delivery mode and gestational duration and are associated with subsequent adiposity. mBio. 2015;6(1):1–9. doi:10.1128/mBio.02419-14.
- Stewart CJ, Ajami NJ, O’Brien JL, Hutchinson DS, Smith DP, Wong MC, Ross MC, Lloyd RE, Doddapaneni H, Metcalf GA, et al. Temporal development of the gut microbiome in early childhood from the TEDDY study. Nature. 2018;562(7728):583–588. doi:10.1038/s41586-018-0617-x.
- Bäckhed F, Roswall J, Peng Y, Feng Q, Jia H, Kovatcheva-Datchary P, Li Y, Xia Y, Xie H, Zhong H, et al. Dynamics and stabilization of the human gut microbiome during the first year of life. Cell Host & Microbe. 2015;17(5):690–703. doi:10.1016/j.chom.2015.04.004.
- Rackaityte E, Halkias J, Fukui EM, Mendoza VF, Hayzelden C, Crawford ED, Fujimura KE, Burt TD, Lynch SV. Viable bacterial colonization is highly limited in the human intestine in utero. Nat Med. 2020;26(4):599–607. doi:10.1038/s41591-020-0761-3.
- Blanton LV, Charbonneau MR, Salih T, Barratt MJ, Venkatesh S, Ilkaveya O, Subramanian S, Manary MJ, Trehan I, Jorgensen JM, et al. Gut bacteria that prevent growth impairments transmitted by microbiota from malnourished children. Sci (1979). 2016;351(6275). doi:10.1126/science.aad3311.
- Smith MI, Yatsunenko T, Manary MJ, Trehan I, Mkakosya R, Cheng J, Kau AL, Rich SS, Concannon P, Mychaleckyj JC, et al. Gut microbiomes of Malawian twin pairs discordant for kwashiorkor. Science (1979). Sci. 2013;339(6119):548–554. doi:10.1126/science.1229000.
- Yatsunenko T, Rey FE, Manary MJ, Trehan I, Dominguez-Bello MG, Contreras M, Magris M, Hidalgo G, Baldassano RN, Anokhin AP, et al. Human gut microbiome viewed across age and geography. Nature. 2012;486(7402):222–227. doi:10.1038/nature11053.
- Baumann-Dudenhoeffer AM, D’Souza AW, Tarr PI, Warner BB, Dantas G. Infant diet and maternal gestational weight gain predict early metabolic maturation of gut microbiomes. Nat Med. 2018;24(12):1822–1829. doi:10.1038/s41591-018-0216-2.
- De Vadder F, Kovatcheva-Datchary P, Goncalves D, Vinera J, Zitoun C, Duchampt A, Bäckhed F, Mithieux G. Microbiota-generated metabolites promote metabolic benefits via gut-brain neural circuits. Cell. 2014;156(1–2):84–96. doi:10.1016/j.cell.2013.12.016.
- Perry RJ, Peng L, Barry NA, Cline GW, Zhang D, Cardone RL, Petersen KF, Kibbey RG, Goodman AL, Shulman GI, et al. Acetate mediates a microbiome–brain–β-cell axis to promote metabolic syndrome. Nature. 2016;534(7606):213–217. doi:10.1038/nature18309.
- Miyamoto J, Igarashi M, Watanabe K, Karaki S-I, Mukouyama H, Kishino S, Li X, Ichimura A, Irie J, Sugimoto Y, et al. Gut microbiota confers host resistance to obesity by metabolizing dietary polyunsaturated fatty acids. Nat Commun. 2019;10(1):1–5. doi:10.1038/s41467-019-11978-0.
- Arenz S, Rückerl R, Koletzko B, Von Kries R. Breast-feeding and childhood obesity—a systematic review. Int J Obes. 2004;28(10):1247–1256. doi:10.1038/sj.ijo.0802758.
- Dominguez-Bello MG, Costello EK, Contreras M, Magris M, Hidalgo G, Fierer N, Knight R. Delivery mode shapes the acquisition and structure of the initial microbiota across multiple body habitats in newborns. Proc Natl Acad Sci U S A. 2010;107(26):11971–11975. doi:10.1073/pnas.1002601107.
- Holmes I, Harris K, Quince C, Gilbert JA. Dirichlet multinomial mixtures: Generative models for microbial metagenomics. PLoS ONE. 2012;7(2):e30126. doi:10.1371/journal.pone.0030126.
- Sugino KY, Ma T, Kerver JM, Paneth N, Comstock SS. Human milk feeding patterns at 6 months of age are a major determinant of fecal bacterial diversity in infants. J Hum Lact. 2021;37(4):703–713. doi:10.1177/0890334420957571.
- Fujimura KE, Sitarik AR, Havstad S, Lin DL, Levan S, Fadrosh D, Panzer AR, LaMere B, Rackaityte E, Lukacs NW, et al. Neonatal gut microbiota associates with childhood multisensitized atopy and T cell differentiation. Nat Med. 2016;22(10):1187–1191. doi:10.1038/nm.4176.
- Pallister T, Jackson MA, Martin TC, Glastonbury CA, Jennings A, Beaumont M, Mohney RP, Small KS, MacGregor A, Steves CJ, et al. Untangling the relationship between diet and visceral fat mass through blood metabolomics and gut microbiome profiling. Int J Obes. 2017;41(7):1106–1113. doi:10.1038/ijo.2017.70.
- Le Roy CI, Bowyer RCE, Castillo-Fernandez JE, Pallister T, Menni C, Steves CJ, Berry SE, Spector TD, Bell JT. Dissecting the role of the gut microbiota and diet on visceral fat mass accumulation. Sci Rep. 2019;9(1):1–10. doi:10.1038/s41598-019-46193-w.
- Subramanian S, Huq S, Yatsunenko T, Haque R, Mahfuz M, Alam MA, Benezra A, DeStefano J, Meier MF, Muegge BD, et al. Persistent gut microbiota immaturity in malnourished Bangladeshi children. Nature. 2014;510(7505):417–421. doi:10.1038/nature13421.
- Walker A, Pfitzner B, Neschen S, Kahle M, Harir M, Lucio M, Moritz F, Tziotis D, Witting M, Rothballer M, et al. Distinct signatures of host–microbial meta-metabolome and gut microbiome in two C57BL/6 strains under high-fat diet. ISME J. 2014;8(12):2380–2396. doi:10.1038/ismej.2014.79.
- Midtvedt A-C, Carlstedt-Duke B, Norin KE, Saxerholt H, Midtvedt T. Development of five metabolic activities associated with the intestinal microflora of healthy infants. J Pediatr Gastroenterol Nutr. 1988;7(4):559–567. doi:10.1097/00005176-198807000-00014.
- Hoyles L, Fernández-Real J-M, Federici M, Serino M, Abbott J, Charpentier J, Heymes C, Luque JL, Anthony E, Barton RH, et al. Molecular phenomics and metagenomics of hepatic steatosis in non-diabetic obese women. Nat Med. 2018;24(7):1070–1080. doi:10.1038/s41591-018-0061-3.
- Gameiro A, Reimann F, Habib AM, O’Malley D, Williams L, Simpson AK, Gribble FM. The neurotransmitters glycine and GABA stimulate glucagon-like peptide-1 release from the GLUTag cell line. Journal Of Physiology. 2005;569(3):761–772. doi:10.1113/jphysiol.2005.098962.
- Meng F, Han Y, Srisai D, Belakhov V, Farias M, Xu Y, Palmiter RD, Baasov T, Wu Q. New inducible genetic method reveals critical roles of GABA in the control of feeding and metabolism. Proc Natl Acad Sci U S A. 2016;113(13):3645–3650. doi:10.1073/pnas.1602049113.
- Hwang I, Jo K, Shin KC, Kim JI, Ji Y, Park YJ, Park J, Jeon YG, Ka S, Suk S, et al. GABA-stimulated adipose-derived stem cells suppress subcutaneous adipose inflammation in obesity. Proc Natl Acad Sci U S A. 2019;116(24):11936–11945. doi:10.1073/pnas.1822067116.
- Braun HS, Sponder G, Pieper R, Aschenbach JR, Deiner C. GABA selectively increases mucin-1 expression in isolated pig jejunum. Genes Nutr. 2015;10(6):1–8. doi:10.1007/s12263-015-0497-8.
- Abd El-Hady AM, Gewefel HS, Badawi MA, Eltahawy NA. Gamma-aminobutyric acid ameliorates gamma rays-induced oxidative stress in the small intestine of rats. J Basic Appl Zool. 2017;78(1):1–9. doi:10.1186/s41936-017-0005-3.
- Delplanque B, Gibson R, Koletzko B, Lapillonne A, Strandvik B. Lipid quality in infant nutrition: Current knowledge and future opportunities. J Pediatr Gastroenterol Nutr. 2015;61(1):8–17. doi:10.1097/MPG.0000000000000818.
- Fricker LD, McKinzie AA, Sun J, Curran E, Qian Y, Yan L, Patterson SD, Courchesne PL, Richards B, Levin N, et al. Identification and characterization of proSAAS, a granin-like neuroendocrine peptide precursor that inhibits prohormone processing. J Neurosci. 2000;20(2):639–648. doi:10.1523/JNEUROSCI.20-02-00639.2000.
- Parlesak A, Haller D, Brinz S, Baeuerlein A, Bode C. Modulation of cytokine release by differentiated CACO-2 cells in a compartmentalized coculture model with mononuclear leucocytes and nonpathogenic bacteria. Scand J Immunol. 2004;60(5):477–485. doi:10.1111/j.0300-9475.2004.01495.x.
- Durack J, Kimes NE, Lin DL, Rauch M, McKean M, McCauley K, Panzer AR, Mar JS, Cabana MD, Lynch SV, et al. Delayed gut microbiota development in high-risk for asthma infants is temporarily modifiable by lactobacillus supplementation. Nat Commun. 2018;9(1). doi:10.1038/s41467-018-03157-4.
- Stokholm J, Blaser MJ, Thorsen J, Rasmussen MA, Waage J, Vinding RK, Schoos AMM, Kunøe A, Fink NR, Chawes BL, et al. Publisher correction: maturation of the gut microbiome and risk of asthma in childhood. Nat Commun. 2018;9(1):1–10. doi:10.1038/s41467-018-03150-x.
- Chen LW, Xu J, Soh SE, Aris IM, Tint M-T, Gluckman PD, Tan KH, Shek LPC, Chong Y-S, Yap F, et al. Implication of gut microbiota in the association between infant antibiotic exposure and childhood obesity and adiposity accumulation. Int J Obes. 2020;44(7):1508–1520. doi:10.1038/s41366-020-0572-0.
- Gilley SP, Ruebel ML, Sims C, Zhong Y, Turner D, Lan RS, Pack LM, Piccolo BD, Chintapalli SV, Abraham A, et al. Associations between maternal obesity and offspring gut microbiome in the first year of life. Pediatr Obes. 2022;17(9). doi:10.1111/ijpo.12921.
- Shao X, Ding X, Wang B, Li L, An X, Yao Q, Song R, Zhang J-A. Antibiotic exposure in early life increases risk of childhood obesity: a systematic review and meta-analysis. Front Endocrinol (Lausanne). 2017;8. doi:10.3389/fendo.2017.00170.
- Alderete TL, Jones RB, Shaffer JP, Holzhausen EA, Patterson WB, Kazemian E, Chatzi L, Knight R, Plows JF, Berger PK, et al. Early life gut microbiota is associated with rapid infant growth in hispanics from Southern California. Gut Microbes. 2021;13(1). doi:10.1080/19490976.2021.1961203.
- Stanislawski MA, Dabelea D, Wagner BD, Iszatt N, Dahl C, Sontag MK, Knight R, Lozupone CA, Eggesbø M, et al. Gut microbiota in the first 2 years of life and the association with body mass index at age 12 in a Norwegian birth cohort. mBio. 2018;9(5). doi:10.1128/mBio.01751-18.
- Tun MH, Tun HM, Mahoney JJ, Konya TB, Guttman DS, Becker AB, Mandhane PJ, Turvey SE, Subbarao P, Sears MR, et al. Postnatal exposure to household disinfectants, infant gut microbiota and subsequent risk of overweight in children. Cmaj. 2018;190(37):E1097–E1107. doi:10.1503/cmaj.170809.
- Forbes JD, Azad MB, Vehling L, Tun HM, Konya TB, Guttman DS, Field CJ, Lefebvre D, Sears MR, Becker AB, et al. Association of exposure to formula in the hospital and subsequent infant feeding practices with gut microbiota and risk of overweight in the first year of life. JAMA Pediatr. 2018;172(7):1–11. doi:10.1001/jamapediatrics.2018.1161.
- Schei K, Simpson MR, Avershina E, Rudi K, Øien T, Júlíusson PB, Underhill D, Salamati S, Ødegård RA. Early gut fungal and bacterial microbiota and childhood growth. Front Pediatr. 2020;8:1–11. doi:10.3389/fped.2020.572538.
- Mar Rodríguez M, Pérez D, Javier Chaves F, Esteve E, Marin-Garcia P, Xifra G, Vendrell J, Jové M, Pamplona R, Ricart W, et al. Obesity changes the human gut mycobiome. Sci Rep. 2015;5(1). doi:10.1038/srep14600.
- Gibbs BG, Forste R. Socioeconomic status, infant feeding practices and early childhood obesity†. Pediatr Obes. 2014;9(2):135–146. doi:10.1111/j.2047-6310.2013.00155.x.
- Benusic M, Cheskin LJ. Obesity prevalence in large US cities: association with socioeconomic indicators, race/ethnicity and physical activity. J Public Health (Oxf). 2021;43(1):148–154. doi:10.1093/pubmed/fdz077.
- Chantarat T, Van Riper DC, Hardeman RR. The intricacy of structural racism measurement: a pilot development of a latent-class multidimensional measure. EClinicalMedicine. 2021;40:101092. doi:10.1016/j.eclinm.2021.101092.
- Furman L, Feinstein J, Delozier S. Understanding breastfeeding barriers at an urban pediatric practice. J Racial Ethn Health Disparities. 2022;2022:1–12. doi:10.1007/S40615-022-01248-Z.
- Baumer Y, Powell-Wiley TM. Interdisciplinary approaches are fundamental to decode the biology of adversity. Cell. 2021;184(11):2797–2801. doi:10.1016/j.cell.2021.04.010.
- Furse S, Snowden SG, Olga L, Prentice P, Ong KK, Hughes IA, Acerini CL, Dunger DB, Koulman A. Evidence from 3-month-old infants shows that a combination of postnatal feeding and exposures in utero shape lipid metabolism. Sci Rep. 2019;9(1):1–10. doi:10.1038/s41598-019-50693-0.
- Ballard O, Morrow AL. Human Milk Composition. Nutrients and Bioactive Factors. Pediatr Clin North Am. 2013;60(1):49–74. doi:10.1016/j.pcl.2012.10.002.
- Rogier EW, Frantz AL, Bruno MEC, Wedlund L, Cohen DA, Stromberg AJ, Kaetzel CS. Secretory antibodies in breast milk promote long-term intestinal homeostasis by regulating the gut microbiota and host gene expression. Proc Natl Acad Sci U S A. 2014;111(8):3074–3079. doi:10.1073/pnas.1315792111.
- Hu P, Zhao F, Zhu W, Wang J. Effects of early-life lactoferrin intervention on growth performance, small intestinal function and gut microbiota in suckling piglets. Food Funct. 2019;10(9):5361–5373. doi:10.1039/C9FO00676A.
- Marcobal A, Barboza M, Froehlich JW, Block DE, German JB, Lebrilla CB, Mills DA. Consumption of human milk oligosaccharides by gut-related microbes. J Agric Food Chem. 2010;58(9):5334–5340. doi:10.1021/jf9044205.
- McCauley KE, Rackaityte E, LaMere B, Fadrosh DW, Fujimura KE, Panzer AR, Lin DL, Lynch KV, Halkias J, Mendoza VF, et al. Heritable vaginal bacteria influence immune tolerance and relate to early-life markers of allergic sensitization in infancy. Cell Rep Med. 2022;3(8):100713. doi:10.1016/j.xcrm.2022.100713.
- DeVries A, McCauley K, Fadrosh D, Fujimura KE, Stern DA, Lynch SV, Vercelli D. Maternal prenatal immunity, neonatal trained immunity, and early airway microbiota shape childhood asthma development. Allergy: Eu J Allergy Clin Immunol. 2022;77(12):3617–3628. doi:10.1111/all.15442.
- Bournat JC, Brown CW. Mitochondrial dysfunction in obesity. Curr Opin Endocrinol Diabetes Obes. 2010;17(5):446–452. doi:10.1097/MED.0b013e32833c3026.
- Dhakal R, Bajpai VK, Baek K-H. Production of gaba (γ - aminobutyric acid) by microorganisms: a review. Braz J Microbiol. 2012;43(4):1230–1241. doi:10.1590/S1517-83822012000400001.
- Latorre R, Sternini C, De Giorgio R, Greenwood-Van Meerveld B. Enteroendocrine cells: a review of their role in brain–gut communication. Neurogastroent Motil. 2016;28(5):620–630. doi:10.1111/nmo.12754.
- McCauley HA, Matthis AL, Enriquez JR, Nichol JT, Sanchez JG, Stone WJ, Sundaram N, Helmrath MA, Montrose MH, Aihara E, et al. Enteroendocrine cells couple nutrient sensing to nutrient absorption by regulating ion transport. Nat Commun. 2020;11(1):1–10. doi:10.1038/s41467-020-18536-z.
- Muoio DM, Newgard CB. Obesity-related derangements in metabolic regulation. Annu Rev Biochem. 2006;75(1):367–401. doi:10.1146/annurev.biochem.75.103004.142512.
- D’Aquila T, Hung YH, Carreiro A, Buhman KK. Recent discoveries on absorption of dietary fat: presence, synthesis, and metabolism of cytoplasmic lipid droplets within enterocytes. Biochim Biophys Acta Mol Cell Biol Lipids. 2016;1861(8):730–747. doi:10.1016/j.bbalip.2016.04.012.
- Araújo JR, Tazi A, Burlen-Defranoux O, Vichier-Guerre S, Nigro G, Licandro H, Demignot S, Sansonetti PJ. Fermentation products of commensal bacteria alter enterocyte lipid metabolism. Cell Host & Microbe. 2020;27(3):358–375.e7. doi:10.1016/j.chom.2020.01.028.
- Monteiro-Sepulveda M, Touch S, Mendes-Sá C, André S, Poitou C, Allatif O, Cotillard A, Fohrer-Ting H, Hubert E-L, Remark R, et al. Jejunal T cell inflammation in human obesity correlates with decreased enterocyte insulin signaling. Cell Metab. 2015;22(1):113–124. doi:10.1016/j.cmet.2015.05.020.
- Winer DA, Luck H, Tsai S, Winer S. The intestinal immune System in obesity and insulin resistance. Cell Metab. 2016;23(3):413–426. doi:10.1016/j.cmet.2016.01.003.
- Gummesson A, Carlsson LMS, Storlien LH, Bäckhed F, Lundin P, Löfgren L, Stenlöf K, Lam YY, Fagerberg B, Carlsson B, et al. Intestinal permeability is associated with visceral adiposity in healthy women. Obesity. 2011;19(11):2280–2282. doi:10.1038/oby.2011.251.
- Nagpal R, Newman TM, Wang S, Jain S, Lovato JF, Yadav H. Obesity-linked gut microbiome dysbiosis associated with derangements in gut permeability and intestinal cellular homeostasis independent of diet. J Diabetes Res. 2018;2018:1–9. doi:10.1155/2018/3462092.
- Cani PD, Bibiloni R, Knauf C, Neyrinck AM, Delzenne NM, Delzenne NM, Burcelin R. Changes in gut microbiota control metabolic endotoxemia-induced inflammation in high-fat diet–induced obesity and diabetes in mice. Diabetes. 2008;57(6):1470–1481. doi:10.2337/db07-1403.
- Ha CWY, Martin A, Sepich-Poore GD, Shi B, Wang Y, Gouin K, Humphrey G, Sanders K, Ratnayake Y, Chan KSL, et al. Translocation of viable gut microbiota to mesenteric adipose drives formation of creeping fat in humans. Cell. 2020;183(3):666–683.e17. doi:10.1016/j.cell.2020.09.009.
- Pryor R, Norvaisas P, Marinos G, Best L, Thingholm LB, Quintaneiro LM, De Haes W, Esser D, Waschina S, Lujan C, et al. Host-Microbe-drug-nutrient screen identifies bacterial effectors of metformin therapy. Cell. 2019;178(6):1299–1312.e29. doi:10.1016/j.cell.2019.08.003.
- Wang Y, Dilidaxi D, Wu Y, Sailike J, Sun X, Nabi X, etal. Composite probiotics alleviate type 2 diabetes by regulating intestinal microbiota and inducing GLP-1 secretion in db/db mice. Biomed Pharmacother. 2020;125:109914. doi:10.1016/j.biopha.2020.109914.
- Shelton C D, Sing, E, Mo, J, Shealy, N G, Yoo, W, Thomas, J, Fitz, G N, Castro, P R, Hickman, T T, Torres, T P . (2023). An early-life microbiota metabolite protects against obesity by regulating intestinal lipid metabolism. Cell Host & Microbe, 31(10), 1604–1619.e10. 10.1016/j.chom.2023.09.002
- Aichbhaumik N, Zoratti EM, Strickler R, Wegienka G, Ownby DR, Havstad S, Johnson CC. Prenatal exposure to household pets influences fetal immunoglobulin e production. Clin Expl Allergy. 2008;38(11):1787–1794. doi:10.1111/j.1365-2222.2008.03079.x.
- Ogden CL, Kuczmarski RJ, Flegal KM, Mei Z, Guo S, Wei R, Grummer-Strawn LM, Curtin LR, Roche AF, Johnson CL, et al. Centers for disease control and prevention 2000 growth charts for the United States: improvements to the 1977 National center for Health Statistics version. Pediatrics. 2002;109(1):45–60. doi:10.1542/peds.109.1.45.
- DeAngelis KM, Brodie EL, DeSantis TZ, Andersen GL, Lindow SE, Firestone MK. Selective progressive response of soil microbial community to wild oat roots. ISME J. 2009;3(2):168–178. doi:10.1038/ismej.2008.103.
- Caporaso JG, Lauber CL, Walters WA, Berg-Lyons D, Huntley J, Fierer N, Owens SM, Betley J, Fraser L, Bauer M, et al. Ultra-high-throughput microbial community analysis on the Illumina HiSeq and MiSeq platforms. ISME J. 2012;6(8):1621–1624. doi:10.1038/ismej.2012.8.
- Magoč T, Salzberg SL. FLASH: fast length adjustment of short reads to improve genome assemblies. Bioinformatics. 2011;27(21):2957–2963. doi:10.1093/bioinformatics/btr507.
- Caporaso JG, Kuczynski J, Stombaugh J, Bittinger K, Bushman FD, Costello EK, Fierer N, Peña AG, Goodrich JK, Gordon JI, et al. QIIME allows analysis of high-throughput community sequencing data. Nat Methods. 2010;7(5):335–336. doi:10.1038/nmeth.f.303.
- Edgar RC. Search and clustering orders of magnitude faster than BLAST. Bioinformatics. 2010;26(19):2460–2461. doi:10.1093/bioinformatics/btq461.
- Edgar RC, Haas BJ, Clemente JC, Quince C, Knight R. UCHIME improves sensitivity and speed of chimera detection. Bioinformatics. 2011;27(16):2194–2200. doi:10.1093/bioinformatics/btr381.
- Edgar RC. UPARSE: highly accurate OTU sequences from microbial amplicon reads. Nat Methods. 2013;10(10):996–998. doi:10.1038/nmeth.2604.
- DeSantis TZ, Hugenholtz P, Larsen N, Rojas M, Brodie EL, Keller K, Huber T, Dalevi D, Hu P, Andersen GL, et al. Greengenes, a chimera-checked 16S rRNA gene database and workbench compatible with ARB. Appl Environ Microbiol. 2006;72(7):5069–5072. doi:10.1128/AEM.03006-05.
- Caporaso JG, Bittinger K, Bushman FD, DeSantis TZ, Andersen GL, Knight R. PyNAST: a flexible tool for aligning sequences to a template alignment. Bioinformatics. 2010;26(2):266–267. doi:10.1093/bioinformatics/btp636.
- Price MN, Dehal PS, Arkin AP, Poon AFY. FastTree 2–approximately maximum-likelihood trees for large alignments. PLoS ONE. 2010;5(3):e9490. doi:10.1371/journal.pone.0009490.
- Martin M. Cutadapt removes adapter sequences from high-throughput sequencing reads. EMBnet J. 2011;17(1):10. doi:10.14806/ej.17.1.200.
- Kõljalg U, Nilsson RH, Abarenkov K, Tedersoo L, Taylor AFS, Bahram M, Bates ST, Bruns TD, Bengtsson‐Palme J, Callaghan TM, et al. Towards a unified paradigm for sequence-based identification of fungi. Mol Ecol. 2013;22(21):5271–5277. doi:10.1111/mec.12481.
- Franzosa EA, McIver LJ, Rahnavard G, Thompson LR, Schirmer M, Weingart G, Lipson KS, Knight R, Caporaso JG, Segata N, et al. Species-level functional profiling of metagenomes and metatranscriptomes. Nat Methods. 2018;15(11):962–968. doi:10.1038/s41592-018-0176-y.
- Mallick H, Rahnavard A, McIver LJ, Ma S, Zhang Y, Nguyen LH, Tickle TL, Weingart G, Ren B, Schwager EH, et al. Multivariable association discovery in population-scale meta-omics studies. PLoS Comput Biol. 2021;17(11):e1009442. doi:10.1371/journal.pcbi.1009442.
- Wickramasinghe S, Pacheco AR, Lemay DG, Mills DA. Bifidobacteria grown on human milk oligosaccharides downregulate the expression of inflammation-related genes in Caco-2 cells. BMC Microbiol. 2015;15(1):1–12. doi:10.1186/s12866-015-0508-3.
- Chew S, Ehrlich A, Prambs J, Henrick BB. Infantis EVC001 Metabolites Improve Enterocyte Proliferation in Vitro. Curr Dev Nutr. 2020;4:960–960. doi:10.1093/cdn/nzaa054_032.
- Dobin A, Davis CA, Schlesinger F, Drenkow J, Zaleski C, Jha S, Batut P, Chaisson M, Gingeras TR. STAR: ultrafast universal RNA-seq aligner. Bioinformatics. 2013;29(1):15–21. doi:10.1093/bioinformatics/bts635.
- The ENCODE Project Consortium.An integrated encyclopedia of DNA elements in the human genome. Nature. 2012;489(7414):57–74. doi: https://doi.org/10.1038/nature11247.
- Love MI, Huber W, Anders S. Moderated estimation of fold change and dispersion for RNA-seq data with DESeq2. Genome Biol. 2014;15(12):1–21. doi:10.1186/s13059-014-0550-8.
- Gustavsen JA, Pai S, Isserlin R, Demchak B, Pico AR. RCy3: network biology using Cytoscape from within R. F1000Research. 2019;20198:1774. doi:10.12688/f1000research.20887.2.
- Parikh K, Antanaviciute A, Fawkner-Corbett D, Jagielowicz M, Aulicino A, Lagerholm C, Davis S, Kinchen J, Chen HH, Alham NK, et al. Colonic epithelial cell diversity in health and inflammatory bowel disease. Nature. 2019;567(7746):49–55. doi:10.1038/s41586-019-0992-y.
- Subramanian A, Tamayo P, Mootha VK, Mukherjee S, Ebert BL, Gillette MA, Paulovich A, Pomeroy SL, Golub TR, Lander ES, et al. Gene set enrichment analysis: a knowledge-based approach for interpreting genome-wide expression profiles. Proc Natl Acad Sci. 2005;102(43):15545–15550. doi:10.1073/pnas.0506580102.
- Mootha VK, Lindgren CM, Eriksson K-F, Subramanian A, Sihag S, Lehar J, Puigserver P, Carlsson E, Ridderstråle M, Laurila E, et al. PGC-1α-responsive genes involved in oxidative phosphorylation are coordinately downregulated in human diabetes. Nat Genet. 2003;34(3):267–273.http://www.nature.com/naturegenetics
- Lozupone C, Knight R. UniFrac: a new phylogenetic method for comparing microbial communities. Appl Environ Microbiol. 2005;71(12):8228–8235. doi:10.1128/AEM.71.12.8228-8235.2005.
- Vázquez-Baeza Y, Pirrung M, Gonzalez A, Knight R. Emperor: a tool for visualizing high-throughput microbial community data. Gigascience. 2013;2(1):2–5. doi:10.1186/2047-217X-2-16.
- Oksanen J, Guillaume Blanchet F, Friendly M, Kindt R, Pierre Legendre DM, Minchin PR, O’Hara RB, Simpson GL, Peter Solymos M, Henry H, et al. Vegan: community ecology package. R package version 2.5-6. (2019).
- Letunic I, Bork P. Interactive tree of life (iTOL) v4: recent updates and new developments. Nucleic Acids Res. 2019;47(W1):W256–W259. doi:10.1093/nar/gkz239.
- Shannon P, Markiel A, Ozier O, Baliga NS, Wang JT, Ramage D, Amin N, Schwikowski B, Ideker T. Cytoscape: a software environment for integrated models of biomolecular interaction networks. Genome Res. 2003;13(11):2498–2504. doi:10.1101/gr.1239303.